Multi-wavelength observation of MAXI J1348–630 during the outburst in 2019
Abstract
We study the multi-wavelength spectral properties of the black hole X-ray binary MAXI J1348–630 using quasi-simultaneous ALMA, NICER, and Swift observations during the decay phase of the January 2019 outburst. In millimeter wavelengths, radio continuum emissions in the frequency range of 89.56–351.44 GHz are measured. We found that the flux densities at millimeter wavelength varied between 12.18 mJy and 18.47 mJy with spectral index () of . The broadband spectrum suggests that the source was accompanied by weak synchrotron emission from the compact jets. Broadband spectral study indicates that MAXI J1348–630 falls in the regime of “radio-quiet” during the decay phase of the outburst. The NICER spectrum is fitted by a combined model of disk blackbody component (diskbb) along with a comptonization component (simpl) which explains the power-law continuum caused by the thermal Comptonisation of soft disk photons in a hot gas of electrons. The NICER spectrum is dominated by the comptonised components during the decay phase of the outburst close to the hard state of the source. We have investigated the correlation between X-ray and radio luminosity using quasi-simultaneous ALMA and NICER data to understand the source nature by locating the source in the - diagram. The correlation study of radio/X-ray luminosity suggests that MAXI J1348–630 did not follow the well-known track for black holes and it is a new member of a restricted group of sources.
email: sabya.pal@gmail.com00footnotetext: Department of Physics, Indian Institute of Science Education and Research, Bhopal, Madhya Pradesh, India, 462066
Keywords X-ray binary stars – accretion – black holes – radio continuum emission – stars – X-rays: individual: MAXI J1348–630
1 Introduction
Black hole transients are known to accrete matter from companion stars, which form an accretion disk around them, and the emission of X-rays is observed during the event. During an outburst, transitions between different spectral states are observed with various timing and spectral properties (Homan & Belloni, 2005). Black hole transients spend a large duration of time (several months to years) in quiescence, and during outbursts, emissions in different wavelengths are observed (Cadolle et al., 2011), and the source luminosity increases by several orders of magnitude in all wavelengths of the electromagnetic spectrum (Remillard & McClintock, 2006). Outbursts of black hole X-ray binaries (BHXRBs) are characterized by their evolution through different spectral states (Remillard & McClintock, 2006; Belloni, 2009). At the beginning of the outburst, they remain in the hard state (HS), during which comptonized hard photons dominate the spectra. As luminosity increases, they usually make a transition to the soft state (SS). In SS, very strong emissions of soft X-rays from the accretion disk are observed. During this transition from HS to SS, BHXRBs sometimes exhibit intermediate states, which are known as hard intermediate states (HIMS) and soft intermediate states (SIMS) (Homan & Belloni, 2005). In most cases, BHXRBs are in the SS when they reach the maximum luminosity, and similar state transitions are observed in the decay phase of the outburst until they return to the HS (Homan & Belloni, 2005; van der Klis, 2006; Belloni, Motta & Muñoz-Darias, 2011; Motta et al., 2011). The complete evolution generally creates a “”–shaped track in the hardness-intensity diagram (HID) (Homan & Belloni, 2005; Remillard & McClintock, 2006; Dunn et al., 2010). The spectral parameters are used to probe the emission mechanism and different spectral states of a black hole. During SS, spectra are steep, with a typical spectral index of (Remillard & McClintock, 2006). Accretion disks are relatively hot, with a disk temperature of keV (Shakura & Sunyaev, 1973; Dunn et al., 2010), and thermal X-rays are emitted from the innermost regions of the accretion disks. Spectra becomes hard with in the HS, and the disk becomes relatively cooler (Makishima et al., 2008; Miller et al., 2008; Takahashi et al., 2008). Multi-wavelength observations help to understand emission mechanisms, and accretion phenomena of a source during the outburst.
BHXRBs show emission from radio to IR frequencies, which is attributed to synchrotron emission from compact jets (Fender, 2006; Gallo, 2010). Positive correlations between radio and X-ray luminosities are generally found (Gallo, Fender & Pooley, 2003; Carotenuto et al., 2021) which indicates a coupling nature between the emissions from jets and accretion disks (Yadav, 2001; Corbel et al., 2003). The BHXRB transient MAXI J1348–630 was discovered during a giant outburst in January 2019 (Yatabe et al., 2019) and followed by a subsequent outburst in June 2019 (Negoro et al., 2019). During the January 2019 outburst, the source reached a peak flux of 4 Crab as measured by MAXI/GSC in 2–20 keV (Tominaga et al., 2020). The optical counterpart of MAXI J1348–630 was detected by Denisenko et al. (2019) during the January 2019 outburst. Previous observations suggested that the source is a black hole candidate (Sanna et al., 2019; Tominaga et al., 2020; Zhang et al., 2020). The mass of the black hole was estimated to be 7 and Chauhan et al. (2021) measured the source distance to be 2.2 kpc by studying the absorption line of HI observed by the Australian Square Kilometre Array Pathfinder (ASKAP) and MeerKAT. Different types of quasi-periodic oscillations (QPOs; types A, B, and C) were found during the January 2019 outburst (Belloni et al., 2020; Jana et al., 2020; Zhang et al., 2020).
Using Insight-HXMT, Weng et al. (2021) conducted a detailed time-lag study of MAXI J1348–630 from which it was concluded that the observed time lag between the radiations of the accretion disk and corona causes the hysteresis feature and the “q”-diagram. Jia et al. (2022) investigated the black hole spin parameter and the inclination of the accretion disk. The evolution of outburst and different timing properties of MAXI J1348–630 was studied using multiple NICER observations (Zhang et al., 2020). To track the evolution of the jets, simultaneous X-ray (MAXI and Swift/XRT) and radio (MeerKAT and ATCA) observations were used (Carotenuto et al., 2021).
Earlier, several radio/X-ray observations were performed to understand the multi-wavelength behaviour of MAXI J1348–630 during the 2019 outburst. The radio flux density at 1.28 GHz was 520.3 5.0 mJy on MJD 58523.21 as observed by MeerKAT (Carotenuto et al., 2019). In another radio observation by the Murchison Widefield Array (MWA) telescope on MJD 58523.79, flux densities at 154 MHz and 216 MHz were 301 21 mJy and 362 22 mJy respectively (Chauhan et al., 2019). The quasi-simultaneous X-ray flux was 1 10-8 erg cm-2 s-1 as observed by Swift/XRT (1–10 keV) on MJD 58523.44.
In this paper, we study the multi-wavelength spectral properties of MAXI J1348–630 using fluxes in radio, optical, ultra-violet, and X-ray wavelengths during the decay phase of the January 2019 outburst. We also study the correlation of radio/X-ray luminosities to understand the nature of the source using quasi-simultaneous ALMA and NICER observation. The paper is organized in the following manner: Observation and data analysis methods of different instruments are discussed in Sect. 2, and results are summarised in Sect. 3. The discussion and the conclusions are summarised in Sects. 5 and 6, respectively.
| Instruments | Obs. ID | Band/Filter | Date | Start Time | MJD | Exposure |
|---|---|---|---|---|---|---|
| (ks) | ||||||
| 2018.1.01034.T | Band-3 (89.56–105.43 GHz) | 2019-05-02 | 04:15:00 | 58605.18 | 0.302 | |
| ALMA | 2018.1.01034.T | Band-4 (137.06–152.93 GHz) | 2019-05-02 | 04:34:00 | 58605.19 | 0.302 |
| 2018.1.01034.T | Band-6 (223.07–105.43 GHz) | 2019-05-02 | 03:50:00 | 58605.16 | 0.423 | |
| 2018.1.01034.T | Band-7 (335.56–351.44 GHz) | 2019-05-02 | 03:06:00 | 58605.13 | 1.149 | |
| NICER | 2200530128 | 0.5–10 keV | 2019-05-02 | 07:08:39 | 58605.30 | 3.869 |
| Swift (UVOT) | 00011107032 | uvm2 ( Å) | 2019-05-03 | 09:25:35 | 58606.39 | 0.526 |
2 Observation and data analysis
We have used data of Swift/BAT (15–50 keV) and MAXI/GSC (2–20 keV) to study the temporal variation of flux during the outbursts. The evolution of HR was studied by using MAXI/GSC fluxes in the energy ranges of 2–6 keV and 6–20 keV.
2.1 ALMA observation
To study the X-ray binary transient MAXI J1348–630 in radio wavelength, we have used 12 m array data from the high-resolution Atacama Large Millimeter/Submillimeter Array ALMA.111https://www.almaobservatory.org/en/home/. The observation log is given in Table 1. The black hole was observed in bands 3, 4, 6, and 7 with XX and YY signal correlators. The on-source total integration times during the observation were 302.400 s, 302.400 s, 423.360 s, and 1149.120 s for ALMA bands 3, 4, 6, and 7 respectively. The bandwidth of all science spectral windows is 1.875 GHz, which is divided into 1920 channels. During the observation, a total of 43 antennas were working with a minimum baseline of 15.1 m and a maximum baseline of 783.5 m. The antenna temperature did not exceed 100 K. During the observation of MAXI J1348–630, the precipitable water vapour (PWV) of the ALMA bands 3, 4, 6, and 7 were 1.1 mm, 1.1 mm, 1.2 mm, and 1.1 mm, which indicates that the environmental condition was good. The phase RMS during the observation of ALMA bands 3, 4, 6, and 7 were 0.105∘, 0.163∘, 0.239∘, 0.770∘. During the observation, the source J1427–4206 was used as a bandpass and flux calibrator, and J1337–6503 was used as a phase calibrator.
We used the Common Astronomy Software Application (CASA v5.4.1)222https://casa.nrao.edu/. for data reduction and continuum image of black hole MAXI J1348–630 with the standard data reduction pipeline delivered by ALMA observatory. The continuum flux density of the flux calibrator J1427–4206 was scaled for each baseline and matched with the Perley-Butler 2017 flux calibrator model with 5% accuracy using task SETJY (Perley & Butler, 2017). After the flux and bandpass calibration, we applied the CASA pipeline with tasks hifa_bandpassflag and hifa_flagdata for flagging the bad data. After the initial data calibration, we used the task MSTRANSFORM to split the corrected target data set with all available rest frequencies. After the splitting of target data, we created the continuum image of MAXI J1348–630 using task TCLEAN with Stokes-I and robust parameter 0.5. The continuum image was deconvolved several times to reduce the background RMS. After the initial data calibration, the observed background RMS varied between 15 and 22 mJy beam-1 for ALMA bands 3, 4, 6, and 7. For improvement of the background RMS, we applied the self-calibration method using the CASA tasks GAINCAL and APPLYCAL. After the self-calibration, the background RMS of the source for ALMA bands 3, 4, 6, and 7 varied between 3.06–8.36 mJy beam-1. After the creation of the continuum emission map, we applied the task IMPBCOR for the correction of the primary beam pattern.
2.2 NICER observation
The Neutron Star Interior Composition Explorer (NICER) on the International Space Station (ISS) is mainly dedicated to the study of neutron stars. The primary instrument of NICER is the X-ray Timing Instrument (XTI), which is an array of 56 X-ray photon detectors that collect photons in the energy range of 0.2–12 keV (Gendreau et al., 2016). NICER performed multiple observations of MAXI J1348–630 after its discovery. We used a quasi-simultaneous NICER observation with ALMA during the decay phase of the January 2019 outburst. The observation details are summarised in Table 1.
We have used the nicerl2 script to process the NICER data in HEASOFT 6.31 with the latest caldb version20221001. We used nicerl3-spect to extract the spectrum from the clean event file. The good time intervals were selected for the timing analysis according to the following criteria: The ISS was not in the South Atlantic Anomaly (SAA) zone, the source elevation was 20∘ above the Earth limb, and the source direction was at least 30∘ from the bright Earth. The background corresponding to each epoch of the observation was simulated by using the nibackgen3C50333https://heasarc.gsfc.nasa.gov/docs/nicer/tools/nicer_bkg_est_tools.html. tool (Remillard et al., 2021). We used XSPEC v12.13 (Arnaud, 1996) for the spectral fitting.
2.3 Swift observation
The Neil Gehrels Swift Observatory is a multi-wavelength observatory that operates in a wide range of wavelengths, including optical, ultraviolet, X-ray, and soft gamma-ray wavebands, with three different instruments onboard. The Burst Alert Telescope (BAT) operates in the energy range of 15–150 keV, which detects new events and the corresponding location in the sky (Barthelmy et al., 2005). We used daily monitoring data of Swift/BAT (15–50 keV) to plot the light curve. The X-ray Telescope (XRT) onboard Swift operates in the energy range of 0.3–10 keV to study different spectral properties of a source (Burrows et al., 2000).
The Ultraviolet/Optical Telescope (UVOT) operates in both UV and visible wavelengths with the help of six different filters (1928–5468 Å) (Poole et al., 2008). We used UVOT observation performed on MJD 58606 close to our quasi-simultaneous NICER and ALMA observation to study the broadband spectrum during the January 2019 outburst. The observation log and a list of filters used during the observations are shown in Table 1. We performed uvotdetect for the source location on the UVOT sky image. We performed the routine uvotsource to examine the flux of the source, keeping the background threshold of . The result is used in the broadband spectrum.
3 Results
3.1 Continuum image of MAXI J1348–630 using ALMA
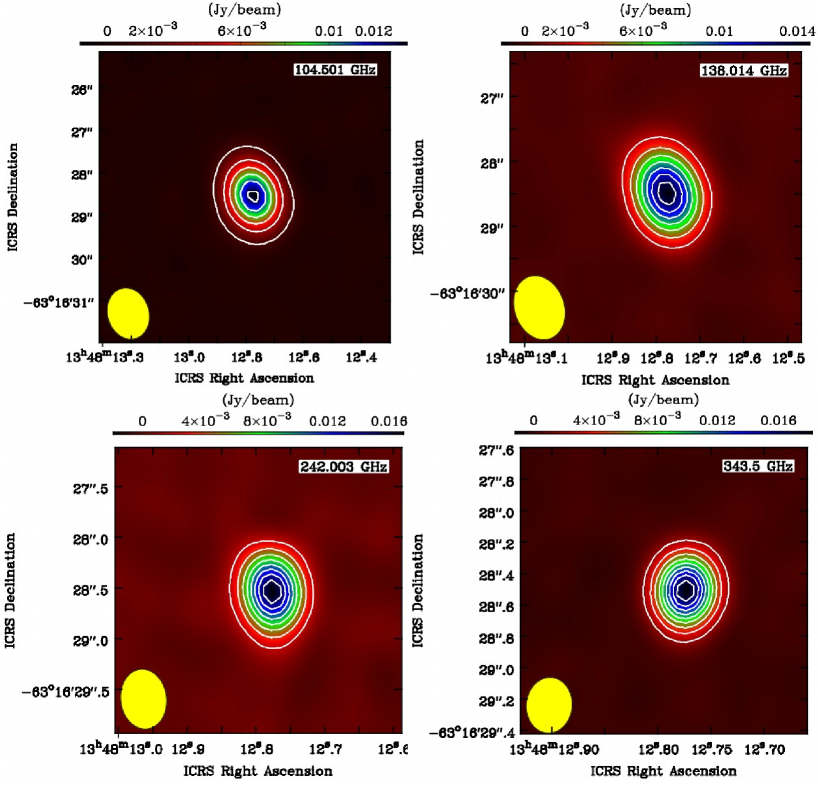
We study the radio continuum emission from MAXI J1348–630 using ALMA band 3, 4, 6, and 7 observations in the frequency range of 89.56 GHz–351.44 GHz. The measured flux densities at different frequencies vary between 12.18 mJy and 18.47 mJy. For estimation of the flux densities, we fitted the 2D Gaussian over the black hole candidate MAXI J1348–630 using the CASA task IMFIT. The RMS of the background of the radio continuum images varied between 3.06–8.36 mJy beam-1 in different observing frequencies. The continuum images of MAXI J1348–630 at different frequencies are shown in Fig. 1. The phase centre of the continuum image of MAXI J1348–630 is RA 13 h48m12.790s, Dec –63∘16′28.480′′ (J2000). In continuum images, the beam sizes are 1.220.97′′ for 104 GHz, 1.220.97′′ for 138 GHz, 0.580.44′′ for 242 GHz, and 0.350.29′′ for 343 GHz. After fitting a 2D Gaussian over the source, we found that the ALMA band 3, 6, and 7 images of MAXI J1348–630 did not resolve, but the band 4 image was marginally resolved. So, we cannot draw any conclusions about the continuum morphology of MAXI J1348–630.
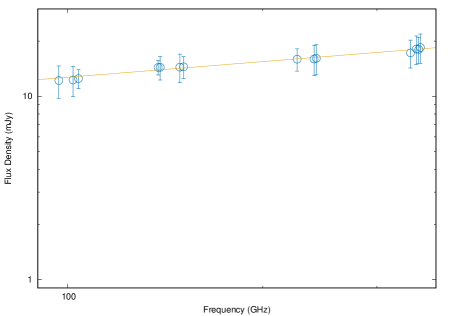
The resultant radio continuum spectrum of MAXI J1348–630 is shown in Fig. 2. The continuum radio spectrum is fitted using power law () with a spectral index of . The slope of the spectrum is positive in the radio region, indicating that the synchrotron radiation is from an optically thick region and that the self-absorption frequency was more than 351.4 GHz.
We also searched the molecular lines from the surroundings of the source, as found earlier for the cases of galactic black holes GRS 1758–258 and 1E 1740.7–2942 (Tetarenko et al., 2020). We have looked for molecular line emission of H2CO, CH3OH, SO2, 13C34S, and OH from the background of the source. We cannot find the line emission of those molecules in the background. The derived 3 upper-limit column-density of H2CO, CH3OH, SO2, 13C34S, and OH are 1.51012 cm-2, 1.9 1012 cm-2, 3.81013 cm-2, 2.8 1013 cm-2, and 8.5 1013 cm-2 respectively. This result suggests that there is not enough molecular gas in the vicinity of MAXI J1348–630.
3.2 Temporal variations of X-ray emission
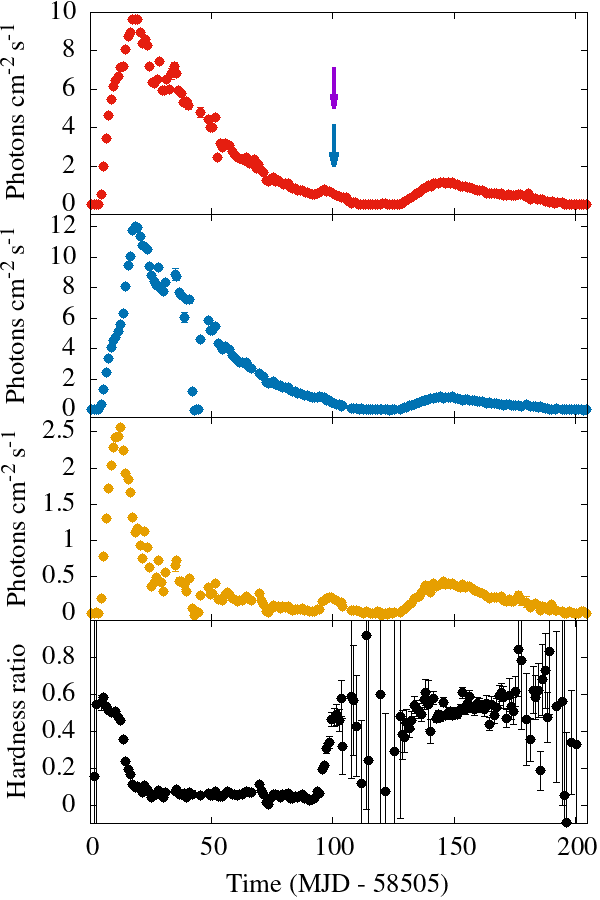
The Gas Slit Camera (GSC) onboard MAXI444http://maxi.riken.jp/top/index.html. and NICER have been continuously monitoring the source since its discovery in January 2019. A subsequent outburst happened in June 2019. In this paper, we mainly focused on the study of the broadband spectrum during the decay phase of the January outburst using ALMA, Swift, and NICER. The evolution of X-ray flux during the outburst is shown in Fig. 3 in different energy bands of MAXI/GSC. The top panel shows the evolution of 2–20 keV MAXI/GSC flux between MJD 58505 and MJD 58710. The second and third panels show the variation of flux in two different energy bands of MAXI/GSC (2–6 keV and 6–20 keV).
The peak flux during the January 2019 outburst was 20 photons cm-2 s-1 in the 2–20 keV as measured by MAXI/GSC. In the 2–6 keV, the peak flux (12 photons cm-2 s-1) was observed on MJD 58523, and in the 6–20 keV the peak flux (2.56 photons cm-2 s-1) was observed on MJD 58517. The bottom panel of Fig. 3 shows the variation of the hardness ratio (6–20 keV/2–6 keV of MAXI/GSC) during these two outburst phases.
3.3 Broadband spectrum during the decay phase of January outburst
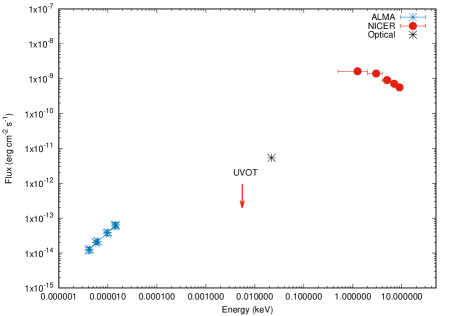
We have studied the spectral energy distribution (SED) of MAXI J1348–630 over multi-wavelength regions to get an idea about the emission mechanism from different emitting regions. The broadband SED has been studied in a wide range of energies from radio to X-ray, including fluxes at ultraviolet and optical wavebands during the outburst of January 2019. In Fig. 4, we have shown the broadband spectrum of the source using quasi-simultaneous observations. All observations were performed between May 2 and May 3, 2019, during the decay phase of the January 2019 outburst. ALMA observations started at 03:06 UT on May 2, 2019 (MJD 58605.13) from which the radio emission from the compact jets was studied using different wavebands (bands 3, 4, 6, and 7) with frequencies ranging from 89.56 GHz to 351.44 GHz. The NICER observation performed on May 2, 2019 (MJD 58605.3) is used for the X-ray flux. Flux in the ultraviolet region is taken from the UVOT observations that were carried out with uvm2 filter having a central wavelength () of 2246 Å(details are given in Table 1). The source remained undetected in the uvm2 band. We have mentioned the upper limit of flux at the location of the source in Fig. 4.
The broadband spectrum is studied when the source is in the intermediate state, making a transition from SS to HS (time of observations of ALMA and NICER are pointed out in Fig. 3) in the decay phase of the January 2019 outburst. Emission in the X-ray wavelengths is higher compared to that in other wavelengths, which indicates strong radiation from the accretion disk. In the region of radio wavelengths, the spectrum was nearly flat/slightly inverted. Fitting the ALMA spectrum, we obtained the spectral index (assuming ) as measured on May 2, 2019. The spectral index indicates self-absorbing compact jets and a slightly inverted radio spectrum. The low radio flux from MAXI J1348–630 categorized itself as a “radio-quiet” black hole candidate.
Due to the lack of sufficient photons in the ultraviolet and optical wavelengths, we could not fit the broadband spectrum. The X-ray spectrum in the range of 0.5–10 keV obtained from NICER can be described well by using the combinational model consisting of a comptonization component simpl (Steiner et al., 2009) to account for the power law continuum produced by the thermal comptonisation of soft photons in hot gas of electron and a multi-temperature disk blackbody component diskbb (Mitsuda et al., 1984), which is used to account for the emission from the optically thick and geometrically thin accretion disk. Typically, in hard and hard-intermediate states of black hole X-ray binaries, the accretion flow consists of an optically thick and geometrically thin outer disk (Shakura & Sunyaev, 1973). In addition, the interstellar medium absorption model tbabs (Wilms, Allen & McCray, 2000) is used. The photon index during the observation is 1.68 0.01, indicating the source was close to the hard state, and the hydrogen column density is 0.3 cm-2. The inner disk temperature is found to be nearly 0.38 0.02 keV and the disk normalization is 9796. The total unabsorbed flux during the NICER observation on MJD 58605.3 was 5.4 10-9 erg cm-2 s-1 (1–10 keV). The quasi-simultaneous radio flux densities are found to be 12.2–18.5 mJy (or corresponding fluxes are – erg cm-2 s-1 respectively) as measured by ALMA bands 3, 4, 6, and 7 at frequencies ranging between 97–350 GHz measured during MJD 58605.13–58605.19.
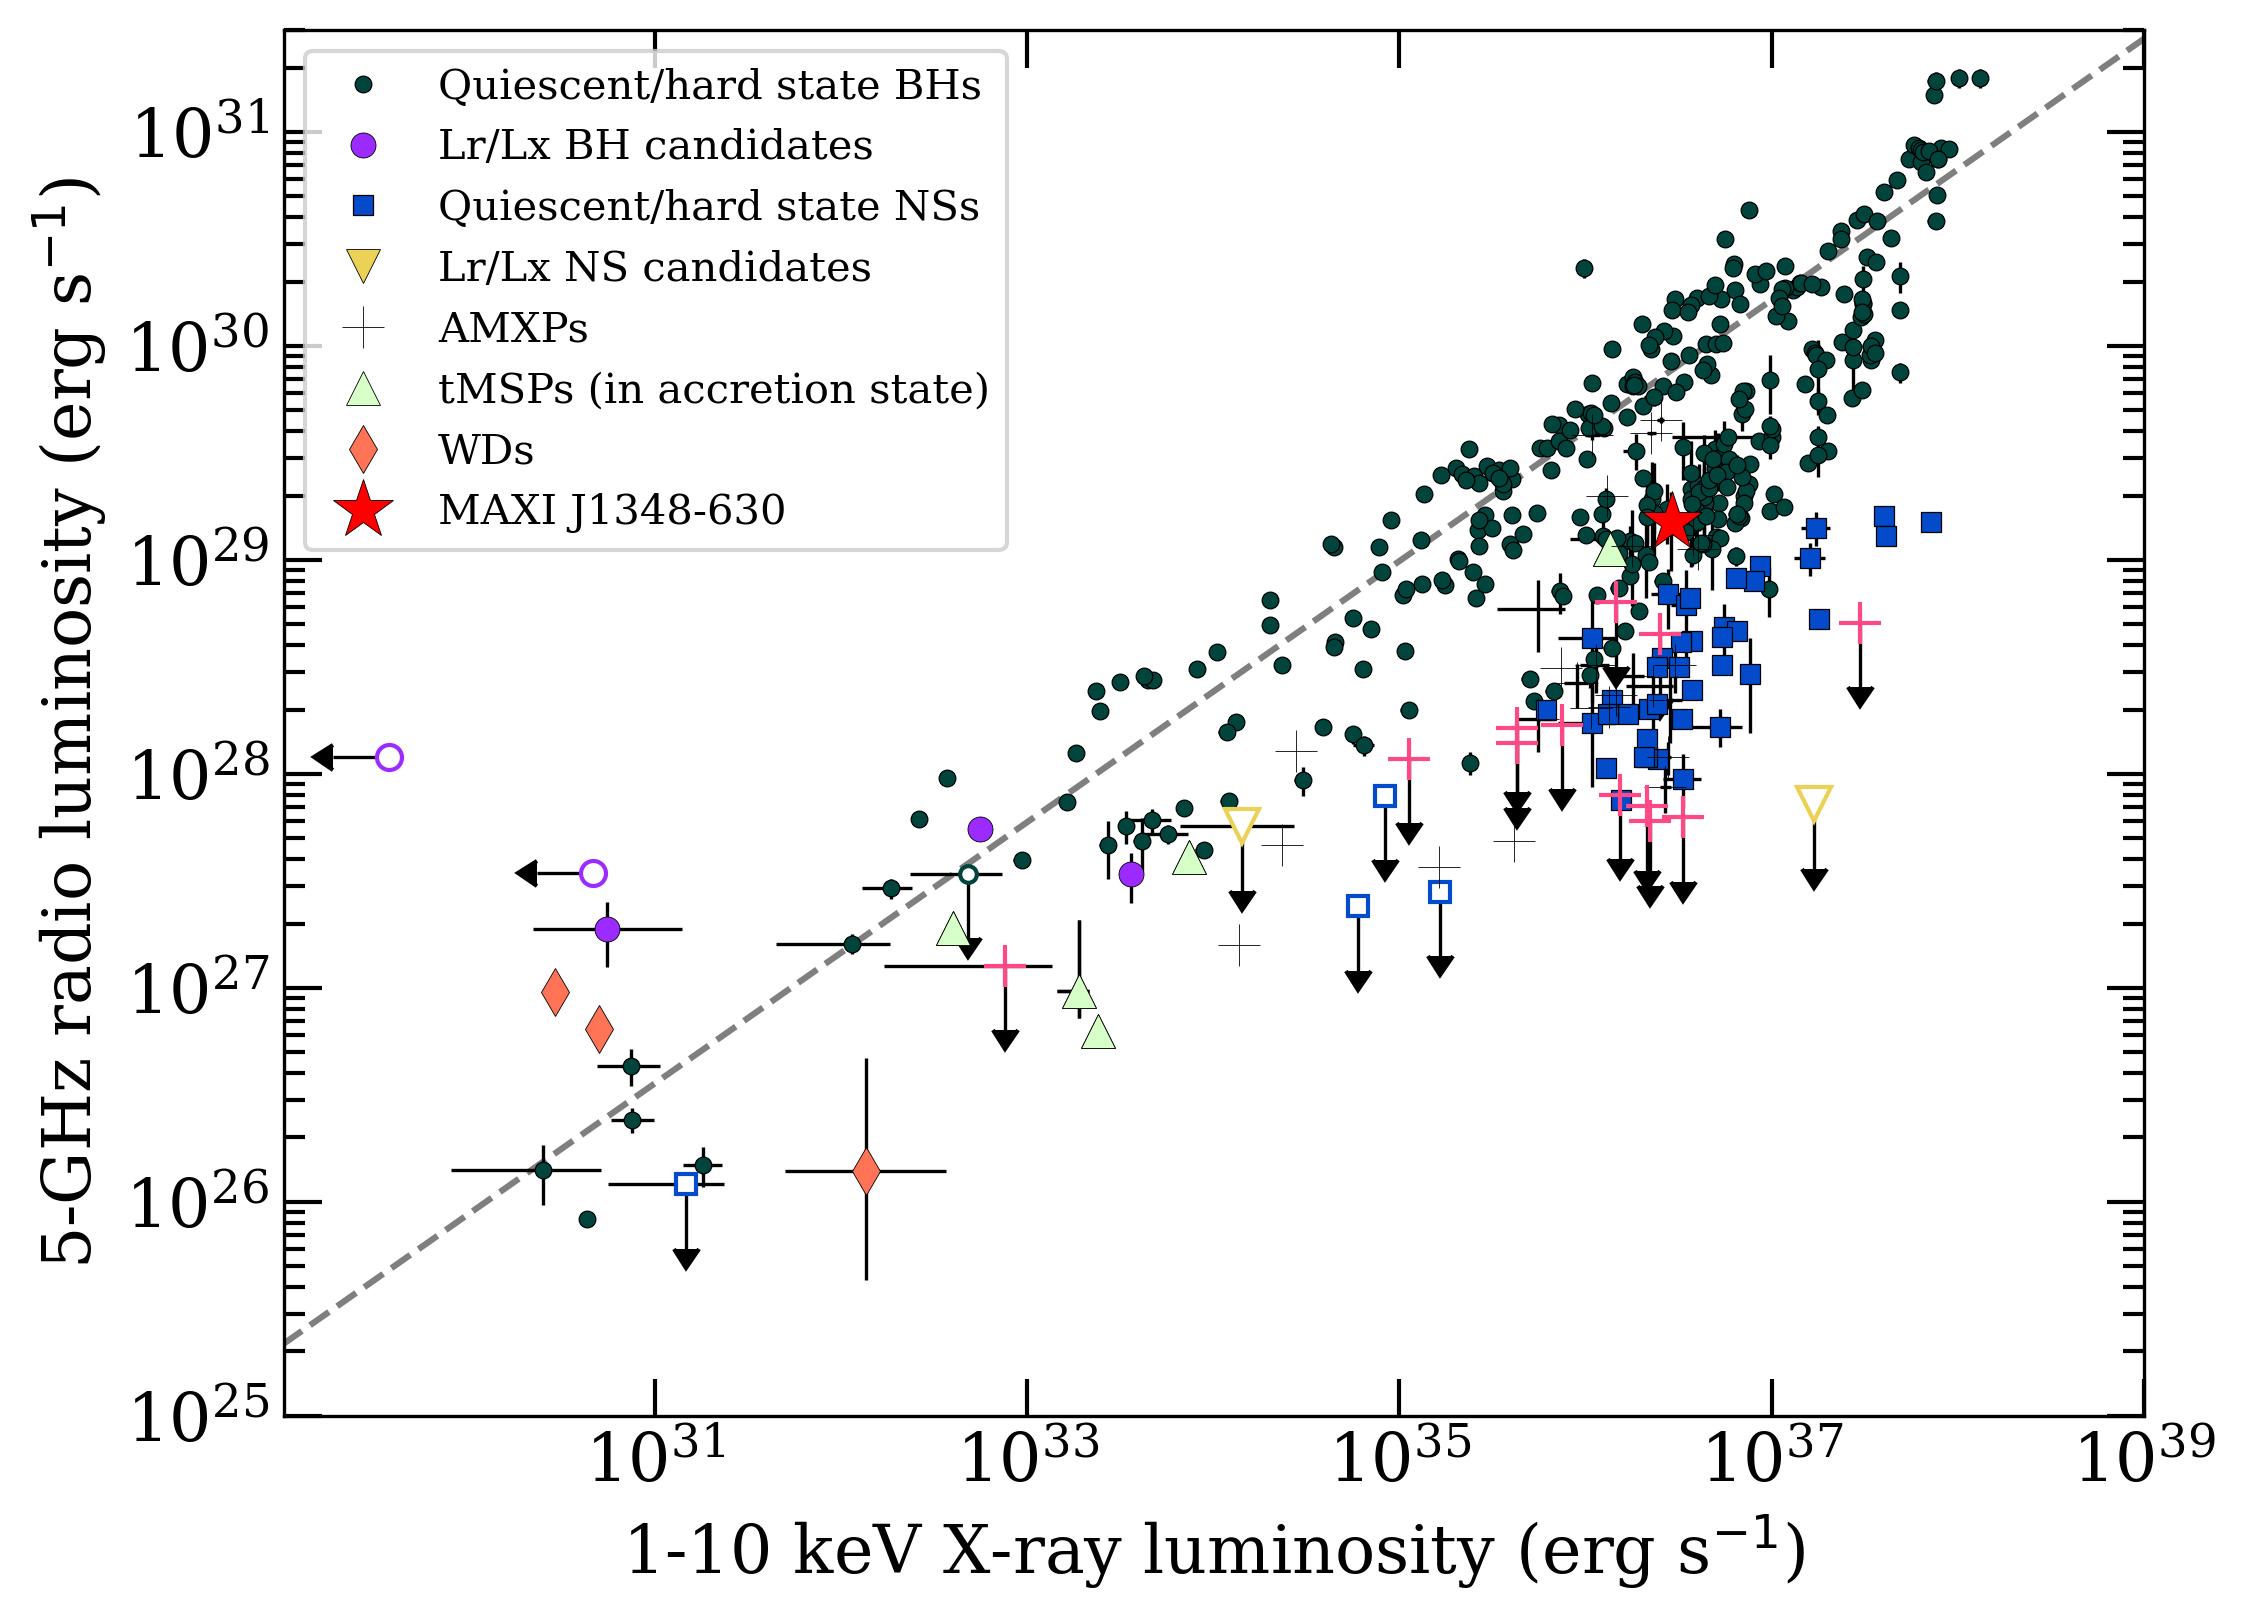
4 Radio and X-ray correlation
One of the main objectives of this study is to investigate the correlation between the X-ray luminosity and the radio luminosity of MAXI J1348–630 during the quasi-simultaneous observation of ALMA (97–350 GHz), NICER (1–10 keV), and Swift/UVOT. We have estimated the radio luminosity from the radio flux density using ALMA data, assuming a source distance of 2.2 kpc (Chauhan et al., 2021). To compare the radio luminosity to other well-known systems we have calculated the corresponding 5 GHz radio flux density from Fig. 2. The 5 GHz radio flux density is estimated to be 5 mJy and the corresponding radio luminosity is found to be 1.5 erg s-1. The X-ray luminosity is also estimated using quasi-simultaneous NICER observation on MJD 58605.3. The unabsorbed X-ray flux in the band 1–10 keV is estimated to be 5.4 erg cm-2 s-1 and the corresponding luminosity is 3.1 erg s-1. We have plotted the estimated radio luminosity and corresponding X-ray luminosity in Fig. 5 to get an idea about the system. Figure 5 shows the well-known tracks for different black holes and neutron stars in the – diagram. From this figure, it is visible that MAXI J1348–630 is a new member of a restricted group of sources, which is consistent with earlier results (Carotenuto et al., 2021). Carotenuto et al. (2021) also used different radio observations using ATCA and MeerKAT to study the correlation between the X-ray and radio luminosity and concluded that MAXI J1348–630 did not follow any well-known track in the – diagram. During the quiescence, Carotenuto, Corbel, & Tzioumis (2022) studied the correlation between the X-ray luminosity and radio luminosity and concluded that hybrid-correlation sources like MAXI J1348–630 followed a standard track at low luminosities like GX 339–4, V404 Cyg, and MAXI J1820070 (see Fig. 2 of Carotenuto, Corbel, & Tzioumis (2022)).
5 Discussion
In this paper, we have mainly focused on the study of the multi-wavelength nature of MAXI J1348–630 during the decay phase of the January 2019 outburst using ALMA, NICER, and Swift data. The correlation between the X-ray and radio luminosity is performed to understand the nature of the source. During the decay phase of the January 2019 outburst, the source started the soft to hard transition on MJD 58597 and then the source came back to the hard state on MJD 58608 (Zhang et al., 2020). During the quasi-simultaneous observation of NICER and ALMA on MJD 58605 the source was close to the hard state. During this state, the NICER spectrum is modelled using a disk black body and a comptonization component. We have estimated the ratio between the flux from the comptonization component to the total flux to understand the emission mechanism. The ratio (F/F) is found to be 70%, which implies that the spectrum is dominated by the comptonised component with a photon index of 1.7.
In the HS of BHXRBs, the energy spectra are strongly dominated by comptonized emission, with a weak and cool thermal component emitted from truncated disks (Done et al., 2007; Saha, Mandal, & Pal, 2023). Whereas in SS, emissions are characterized by strong thermal blackbody radiation from the accretion disk, and the effect of comptonization becomes minimum. During this state, the inner disk radius sometimes extends up to the innermost stable circular orbit (Tanaka, 1989; Ebisawa et al., 1993; Steiner et al., 2010). During the transition towards the hard state, the comptonization component starts dominating the spectra, and fluxes are mostly due to the hard photons (Takahashi et al., 2008; Makishima et al., 2008).
Multi-wavelength observations are key to understanding the accretion mechanism from different regions of BHXRB during outbursts (viz. Ueda et al. (2002); Chakrabarti et al. (2005)). While the sources of X-ray and radio emissions are well understood, the origin of emissions in infrared, ultraviolet, and visible wavebands is complicated to understand (van Paradijs & McClintock, 1995), since multiple radiation mechanisms occur in different regions of the system. The soft X-rays are believed to come from the inner-most regions of the accretion disk, whereas the ultraviolet and optical emissions are thought to come from the irradiated outer thin accretion disks (Poutanen & Veledina, 2014). The origin of the hard X-rays is due to the inverse comptonization of the disk photons by the electron clouds around the black hole called “corona” (Done et al., 2007). Radio emissions originated due to synchrotron emissions from jets (Falcke & Biermann, 1996, 1999).
Earlier, some multi-wavelength observations were performed for other sources to study the accretion phenomenon around them. Earlier, the radio/X-ray diagram of MAXI J1348–630 during quiescence indicated that the source belongs to the standard (radio-loud) track in the quiescence phase (Carotenuto, Corbel, & Tzioumis, 2022). According to typical SEDs of AGNs presented in Fig. 1 and Fig. 10 of Elvis et al. (1994), the ratio of between the radio and X-ray band is roughly for radio-loud quasars and for radio-quiet quasars. We have used the radio flux from the 240 GHz ALMA band, which is erg cm-2 s-1 and the unabsorbed NICER flux in the 1–10 keV band was erg cm-2 s-1. We have estimated the ratio of for MAXI J1348–630 using fluxes in radio (ALMA band, Hz) and X-ray (NICER band, Hz) bands.
| (1) |
The estimated ratio for MAXI J1348–630 is , which is lower than the typical value () for radio-quiet quasars. This indicates that MAXI J1348–630 falls into the regime of “radio-quiet”. During the quiescence, Carotenuto, Corbel, & Tzioumis (2022) studied the radio and X-ray correlation and concluded that MAXI J1348–630 falls in the well-defined track for the black holes in the – diagram. The results indicated that MAXI J1348–630 belongs to the standard “radio-loud” track during the quiescence. Misalignment of jets may be possible for the low radio emission from the source (Miller-Jones et al., 2019) during the outburst. In the multi-wavelength campaign on the black hole X-ray binary GRS 1915105 (April 2002), it was found that radio emissions from jets were relatively weak, whereas the X-rays emitted from the disk were much stronger (Ueda et al., 2002). For GRS 1915105, the ratio was found to be (Ueda et al., 2002). The same nature of SED was observed in the LMXB GX 339–4 during the outburst of 2010 (Cadolle et al., 2011). But during the broadband study of the HMXB SS 433, Chakrabarti et al. (2005) noticed that the source was strong in radio wavelengths, but fluxes drastically decreased in the infra-red, optical, and ultraviolet regions, and significantly less in X-ray wavelengths.
6 Conclusions
We report the multi-wavelength spectral properties of the black hole X-ray binary MAXI J1348–630 during the decay phase of the January 2019 outburst using the quasi-simultaneous data from ALMA, NICER, and Swift. We found that MAXI J1348–630 falls in the “radio-quiet” regime during our multi-wavelength observation. We also study the radio/X-ray correlation for the source using the ALMA and NICER data during the decay phase of the outburst. The correlation study suggested that MAXI J1348–630 did not follow any well-known track in the – diagram and it can be categorized as a new candidate of a restricted group of sources. We have found that the ratio of flux between the comptonised component and total flux (F/F) is 70%, indicating the source is close to the hard state in the decay phase of the outburst. The NICER spectral fitting results suggest that spectra are dominated by the thermally comptonised photons, as usually observed in the hard state of black hole X-ray binaries.
Acknowledgments
We thank the reviewer. This research has made use of data provided by the High Energy Astrophysics Science Archive Research Centre (HEASARC), which is a service of the Astrophysics Science Division at NASA/GSFC. We acknowledge the use of public data from the NICER, and swift data archives. Special thanks to Neil Gehrels Swift Observatory and MAXI-RIKEN teams since daily monitoring data of Swift/BAT and MAXI/GSC have been used in this research. This paper uses the ALMA data. ALMA is a partnership of ESO (representing its member states), NSF (USA), and NINS (Japan), together with NRC (Canada), MOST and ASIAA (Taiwan), and KASI (Republic of Korea), in cooperation with the Republic of Chile. The Joint ALMA Observatory is operated by ESO, AUI/NRAO, and NAOJ.
Data availability
The X-ray data used for this article are publicly available in the High
Energy Astrophysics Science Archive Research Centre (HEASARC) at
https://heasarc
.gsfc.nasa.gov/cgi-bin/W3Browse/w3browse.pl.
The ALMA data are publicly available at https://almascience.nao.ac.jp/asax/ (project id: 2018.1.01034.T).
Funding
The authors declare that no funds, grants, or other supports were received during the preparation of this manuscript.
Conflicts of interest
The authors have no relevant financial or non-financial interests to disclose.
Author Contributions
All authors contributed to the conception and design of the study. Data analysis is performed by MM, DS, and AM. The manuscript is jointly written by MM, SP, and DS. All authors read and approved the final manuscript.
References
- Arnaud (1996) Arnaud K. A., 1996, in Jacoby G. H., Barnes J., eds, ASP Conf. Ser. Vol. 101, Astronomical Data Analysis Software and Systems V. Astron. Soc. Pac., San Francisco, p. 17
-
Bahramian et al. (2022)
Bahramian A., et al., 2018, Radio/X-ray correlation database for X-ray binaries (version 220908), Zenodo,
https://doi.org/10.5281/zenodo.1252036 - Barthelmy et al. (2005) Barthelmy S. D., et al., 2005, SSRv, 120, 143B
- Belloni (2009) Belloni T. M., 2009, Lecture Notes in Physics, 794, 53
- Belloni et al. (2020) Belloni T. M., Zhang L., Kylafis N. D., Reig P., Altamirano, D., 2020, MNRAS, 496, 4366B
- Belloni, Motta & Muñoz-Darias (2011) Belloni T. M., Motta S. E., Muñoz-Darias T., 2011, BASI, 39, 409B
- Burrows et al. (2000) Burrows D. N., et al., 2000, SPIE, 4140, 64B
- Cadolle et al. (2011) Cadolle B. M., et al., 2011, A&A, 534, A119
- Carotenuto et al. (2019) Carotenuto F., Tremou E., Corbel S., Fender R., Woudt P., Miller-Jones J., 2019, The Astronomer’s Telegram, 12497, 1
- Carotenuto et al. (2021) Carotenuto F., et al., 2021, MNRAS, tmpL, 51C
- Carotenuto et al. (2021) Carotenuto F., et al., 2021, MNRAS, 504, 444
- Carotenuto, Corbel, & Tzioumis (2022) Carotenuto F., Corbel S., Tzioumis A., 2022, MNRAS, 517, L21
- Chauhan et al. (2021) Chauhan J., et al., 2021, MNRAS, 501, L60
- Chakrabarti et al. (2005) Chakrabarti S. K., et al., 2005, MNRAS, 362, 957C
- Chauhan et al. (2019) Chauhan J., Miller-Jones J., Anderson G., Russell T., Hancock P., Bahramian A., Duchesne S., Williams A., 2019, The Astronomer’s Telegram, 12520, 1
- Carotenuto, Corbel, & Tzioumis (2022) Carotenuto F., Corbel S., Tzioumis A., 2022, MNRAS, 517, L21
- Corbel et al. (2003) Corbel S., Nowak M. A., Fender R. P., Tzioumis A. K., Markoff S., 2003, A&A, 400, 1007
- Denisenko et al. (2019) Denisenko D., et al., 2019, The Astronomer’s Telegram, 12430, 1
- Done et al. (2007) Done C., Gierliński M., Kubota A., 2007, A&ARv, 15, 1
- Dunn et al. (2010) Dunn R. J. H., et al., 2010, MNRAS, 403, 61
- Elvis et al. (1994) Elvis M., et al., 1994, ApJS, 95, 1
- Ebisawa et al. (1993) Ebisawa K., et al., 1993, ApJ, 403, 684
- Falcke & Biermann (1996) Falcke H., Biermann P. L., 1996, A&A, 308, 321
- Falcke & Biermann (1999) Falcke H., Biermann P. L., 1999, A&A, 342, 49
- Fender (2006) Fender R., 2006, Jets from X-ray binaries (Compact stellar X-ray sources), 381, 419
- Gallo et al. (2006) Gallo E., et al., 2006, MNRAS, 370, 1351
- Gallo (2010) Gallo E., 2010, Lecture Notes in Physics, Berlin Springer Verlag, 794, 85
- Gallo, Fender & Pooley (2003) Gallo E., Fender R. P., Pooley G. G., 2003, MNRAS, 344, 60
- Gendreau et al. (2016) Gendreau K. C., et al., 2016, in Proc. SPIE. p. 99051H
- Homan & Belloni (2005) Homan J., Belloni T., 2005, Ap&SS, 300, 107
- Jana et al. (2020) Jana A., Debnath D., Chatterjee D., Chatterjee K., Chakrabarti S. K., Naik S., Bhowmick R., Kumari N., 2020, ApJ, 897, 3
- Jia et al. (2022) Jia N., et al., 2022, MNRAS, 511, 3125.
- Makishima et al. (2008) Makishima K., et al., 2008, PASJ, 60, 585
- Miller et al. (2008) Miller J. M., Raymond J., Reynolds C. S., Fabian A. C., Kallman T. R., Homan J., 2008, ApJ, 680, 1359
- Miller-Jones et al. (2019) Miller-Jones J. C. A., et al., 2019, Nature, 569, 374
- Mitsuda et al. (1984) Mitsuda K., et al., 1984, PASJ, 36, 741
- Motta et al. (2011) Motta S., Muñoz-Darias T., Casella P., Belloni T., Homan J., 2011, MNRAS, 418, 2292
- Negoro et al. (2019) Negoro H., et al., 2019, The Astronomer’s Telegram, 12838, 1
- Perley & Butler (2017) Perley R. A., Butler B. J., 2017, ApJ, 230, 1538
- Poole et al. (2008) Poole T. S., et al., 2008, MNRAS, 383, 627P
- Poutanen & Veledina (2014) Poutanen J., Veledina A., 2014, SSRv, 183, 61
- Remillard & McClintock (2006) Remillard R. A., McClintock J. E., 2006, ARA&A, 44, 49
- Remillard et al. (2021) Remillard R. A. et al., 2021, preprint (arXiv:2105.09901)
- Saha, Mandal, & Pal (2023) Saha D., Mandal M., Pal S., 2023, MNRAS, 519, 519
- Sanna et al. (2019) Sanna A., et al., 2019, The Astronomer’s Telegram, 12447, 1
- Shakura & Sunyaev (1973) Shakura N. I., Sunyaev R. A., 1973, A&A, 500, 33
- Steiner et al. (2010) Steiner J. F., et al., 2010, ApJL, 718, L117
- Steiner et al. (2009) Steiner J. F., Narayan R., McClintock J. E., Ebisawa K., 2009, PASP, 121, 1279
- Takahashi et al. (2008) Takahashi H., et al., 2008, PASJ, 60, 69
- Tanaka (1989) Tanaka Y., 1989, in ESA Special Publication, Vol. 1, Two Topics in X-Ray Astronomy, Volume 1: X-Ray Binaries. Volume 2: AGN and the X-Ray Background, ed. J. Hunt & B. Battrick, 3
- Tominaga et al. (2020) Tominaga M., et al., 2020, ApJ, 899, 20
- Tetarenko et al. (2020) Tetarenko A. J., Rosolowsky E. W., Miller-Jones J. C. A., Sivakoff G. R., 2020, MNRAS, 497, 3504
- Ueda et al. (2002) Ueda Y., et al., 2002, ApJ, 571, 918
- van der Klis (2006) van der Klis M., 2006, Rapid X-ray Variability. pp 39–112
- van Paradijs & McClintock (1995) van Paradijs J., McClintock J. E. 1995, xrbi.nasa, 58
- Weng et al. (2021) Weng S.-S., Cai Z.-Y., Zhang S.-N., Zhang W., Chen Y.-P., Huang Y., Tao L., 2021, ApJL, 915, L15.
- Wilms, Allen & McCray (2000) Wilms J., Allen A., McCray R., 2000, ApJ, 542, 914
- Yadav (2001) Yadav J. S., 2001, ApJ, 548, 876Y
- Yatabe et al. (2019) Yatabe F., et al., 2019, The Astronomer’s Telegram, 12425, 1
- Zhang et al. (2020) Zhang L., et al., 2020, MNRAS, 499, 851