Modeling the Broadband Emission of 3C 454.3
Abstract
The results of a long-term multiwavelength study of the powerful flat spectrum radio quasar 3C 454.3 using Fermi-LAT and Swift XRT/UVOT data are reported. In the -ray band, Fermi-LAT observations show several major flares when the source flux was ; the peak -ray flux above MeV, observed on MJD 55519.33, corresponds to isotropic -ray luminosity. The analysis of Swift XRT and UVOT data revealed a flux increase, although with smaller amplitudes, also in the X-ray and optical/UV bands. The X-ray emission of 3C 454.3 is with a hard spectral index of , and the flux in the flaring states increased up to . Through combining the analyzed data, it was possible to assemble 362 high-quality and quasi-simultaneous spectral energy distributions of 3C 454.3 in 2008-2018 which all were modeled within a one-zone leptonic scenario assuming the emission region is within the broad line region, involving synchrotron, synchrotron self-Compton and external Compton mechanisms. Such an extensive modeling is the key for constraining the underlying emission mechanisms in the 3C 454.3 jet and allows to derive the physical parameters of the jet and investigate their evolution in time. The modeling suggests that during the flares, along with the variation of emitting electron parameters, the Doppler boosting factor increased substantially implying that the emission in these periods has most likely originated in a faster moving region.
keywords:
quasars: individual: 3C 454.3 – galaxies: jets – gamma-rays: galaxies – X-rays: galaxies1 Introduction
Blazars are a subclass of active galactic nuclei with a jet pointing or making a small angle with respect to the observer (Urry &
Padovani, 1995). These jets are strong sources of electromagnetic radiation ranging from radio to high energy (HE; MeV) and very high energy -ray bands (see Padovani
et al. 2017 for a recent review). This emission is characterized by rapid and high-amplitude variability in almost all wavelengths, the most extreme being at -ray band (e.g., order of minutes, Ackermann
et al., 2016; Foschini et al., 2011; Foschini
et al., 2013; Nalewajko, 2013; Brown, 2013; Rani et al., 2013a; Saito
et al., 2013; Hayashida et al., 2015; Shukla
et al., 2018). Blazars are dominant sources in the extragalactic -ray sky and have been observed even at very high redshifts (e.g., Ackermann
et al., 2017; Sahakyan et al., 2020). The recent studies of 4FGL J1544.3-0649 reveal the possible existence of transient blazars; being undecteable in the X-ray and -ray bands, 4FGL J1544.3-0649 for a few months rose to be one of the brightest known X-ray blazars (Sahakyan &
Giommi, 2021). If 4FGL J1544.3-0649 does not indeed represent an isolated case but rather a common phenomenon, this would have a non-negligible role in the multimessenger astrophysics.
The broadband spectral energy distribution (SED) of blazars is characterized by two broad humps, one at optical/UV/X-ray bands and the other in the HE -ray band
(see Padovani
et al. 2017 for a recent review). It is believed that the first peak (low energy component) is mostly due to synchrotron emission from relativistic electrons, whereas the origin of the second component is highly debatable. Within conventional leptonic scenarios, this component is produced when the synchrotron emitting electrons inverse Compton up scatter the photons of internal (synchrotron self Compton (SSC) Ghisellini et al., 1985; Bloom &
Marscher, 1996; Maraschi et al., 1992)
or external (external inverse Compton (EIC) Błażejowski et al., 2000; Ghisellini &
Tavecchio, 2009; Sikora
et al., 1994) origin. The nature of the external photon fields depends on the distance of the emitting region from the central black hole (Sikora et al., 2009) and can be dominated either by the photons directly emitted from the accretion disk (Dermer &
Schlickeiser, 1993; Dermer et al., 1992) or disk photons reflected from the broad-line region (BLR; Sikora
et al., 1994) or IR photons emitted from the dusty torus (Błażejowski et al., 2000). Recently, after associating TXS 0506+056 with the IceCube-170922A neutrino event (IceCube
Collaboration et al., 2018a, b; Padovani
et al., 2018), it is more evident that the HE component could be initiated by the interaction of energetic protons when they are effectively accelerated in the blazar jets. The HE component can be either from proton synchrotron emission (Mücke &
Protheroe, 2001) or from secondary particles from pion decay (Mannheim, 1993; Mannheim &
Biermann, 1989; Mücke &
Protheroe, 2001; Mücke et al., 2003; Böttcher et al., 2013). In the latter case, blazars are also sources of very high energy neutrinos (Ansoldi
et al., 2018; Keivani
et al., 2018; Murase et al., 2018; Padovani
et al., 2018; Sahakyan, 2018; Righi
et al., 2019; Cerruti et al., 2019; Sahakyan, 2019; Gao
et al., 2019).
Based on the properties observed in the optical band, blazars are classified as Flat Spectrum Radio Quasars (FSRQs) when the emission lines are stronger and quasar-like or BL Lacs when these lines are weak or absent (Urry &
Padovani, 1995). Alternatively, blazars are FSRQs when the luminosity of the broad emission lines (or accretion disk) measured in Eddington units is , otherwise they are BL Lacs (Ghisellini et al., 2011; Sbarrato et al., 2012a). Depending on the position of the synchrotron component peak (), the blazars are further classified as low synchrotron peaked (LSP) sources, when Hz, intermediate synchrotron peaked (ISP) and high synchrotron peaked (HSP) sources when Hz and Hz, respectively (Padovani &
Giommi, 1995; Abdo
et al., 2010b). However, sometimes the synchrotron peak of HSPs can reach 1 keV, ( Hz) or beyond, showing an extreme behaviour (e.g. Giommi
et al., 1999; Costamante
et al., 2001; Biteau
et al., 2020). Such behaviour was first observed during the flare of Mkn 501 when the synchrotron peak reached keV (Pian
et al., 1998), and then many such objects were identified in the X-ray observations. For example, during the flares of 1ES 1218+304 the X-ray spectral index hardened to , shifting the peak towards higher energies (Sahakyan, 2020a). In this classification, FSRQs usually have a synchrotron peak at Hz, so they are LSPs.
The BL Lac and FSRQ SEDs demonstrate different properties. In FSRQs, the strong external photon fields which are weak or absent in the case of BL Lacs, modify the HE component: these external photons are seen relativistically boosted in the comoving frame of the jet and can dominate over the internal synchrotron photon fields, giving rise to the EIC component (e.g., Gasparyan et al., 2018; Sahakyan &
Gasparyan, 2017). Therefore, in FSRQs the luminosity of the second component is usually larger, i.e. shows a larger Compton dominance (Sikora
et al., 1994) due to the presence of external seed photons. The shape of this component depends on the distribution of up-scattering photons which in its turn is defined by the distance of the emitting region from the central black hole. So, the modeling of the SED or features in the -ray spectrum (e.g., break or cut-off) can help to localize the emission region
(e.g., Poutanen &
Stern, 2010; Aleksić
et al., 2011; Sahakyan, 2020b).
3C 454.3 is a typical FSRQ at harboring a black hole with a mass estimated to be (Woo &
Urry, 2002; Liu
et al., 2006). This source was extensively studied in the multiwavelength band over the last two decades (e.g., Giommi
et al., 2006). However, after the prominent optical outburst in 2005 with a peak optical brightness of mag, the source remained active showing several bright flares, it has become a target of multiwavelength studies (Raiteri
et al., 2008, 2011; Pacciani
et al., 2010; Abdo
et al., 2011, 2009; Ackermann
et al., 2010; Jorstad
et al., 2013; Amaya-Almazán
et al., 2021). This multiwavelength campaigns provided unprecedented information on this source. For example, Bonning
et al. (2009) studying the multiwavelength data observed during the high flux state in July 2008, showed that the emissions in IR, optical, UV, and -ray bands are well correlated while the X-ray flux is correlated with none of these fluxes. These features in the multiwavelength variability can be naturally explained within the EIC scenario. However, Bonnoli et al. (2011) found that the optical, X-ray and -ray fluxes correlate during the extreme brightening of 3C 454.3 in the first week of December 2009. In the -ray band the source was first detected by EGRET on the Compton Gamma-Ray Observatory (Hartman
et al., 1993) and then extensively monitored by AGILE and Fermi large area telescope (Fermi-LAT) since 2007. The AGILE observations have shown that the 3C 454.3 was in active -ray state in several occasions (Donnarumma
et al., 2009; Pacciani
et al., 2010; Vercellone
et al., 2011). In 2010 during the exceptional bright -ray flare Fermi-LAT detected a flux above from 3C 454.3 which corresponds to isotropic luminosity, making 3C 454.3 one of the brightest -ray sources in the sky (Abdo
et al., 2011). During the flaring of 3C 454.3, different extraordinary changes in terms of spectral and temporal properties were reported in the multiwavelength context and especially in the -ray band. For example, Abdo
et al. (2009) found that the -ray spectrum of 3C 454.3 steepens above GeV and it is better explained by a broken power-law with photon indices of and below and above the break, respectively. This turnover in the spectrum was interpreted by the spectral break in the electron distribution; however, Finke &
Dermer (2010) interpreted the break to be due to the inverse Compton scattering of accretion disk and BLR photons.
In this paper, the evolution of the multiwavelength SED of 3C 454.3 during 2008-2018 as well as the spectral changes in different bands are investigated. These changes in the SED are expected to arise from the variation of the parameters of the emitting electrons or the physical parameters of the emission region (Paggi et al., 2011), so, they directly define the physical processes taking place in the jet as well as the state of the plasma in it. For this reason, in the period from 2008 to 2018, as many SEDs of 3C 454.3 as possible that can be constructed with contemporaneous data from the radio to HE bands have been modeled within a leptonic scenario. More explicitly, these SEDs are modeled assuming the low energy component is due to synchrotron emission whereas the second component is due to SSC and/or EIC by the same electrons. Through such modeling the jet parameters are estimated for different periods allowing to investigate their variation which
could help to investigate the changes in the jet of 3C 454.3 as well as to understand the origin of the flares. 3C 454.3 was selected because of i) the availability of rich multiwavelength data (e.g., more than 465 observations with Neil Gehrels Swift Observatory (hereafter Swift) and continuous monitoring by Fermi-LAT) and ii) its large amplitude variability in almost all wavelengths.
In the current paper the origin of the multiwavelength emission from 3C 454.3 is investigated using the multiwavelength data accumulated during 2008-2018. The paper is structured as follows. Section 2 presents the multiwavelength data analyzed in the current study. The evolution of SED in time is presented in Section 3. The modeling of SEDs is presented in Section 4 and the discussions in Section 5. The conclusion is given in Section 6.

2 Multiwavelenth Observations
3C 454.3, being among the brightest -ray blazars, was frequently monitored in different energy bands. Here, the emission of 3C 454.3 in the optical/UV, X-ray and -ray bands is investigated using the data from Fermi-LAT, Swift UVOT and XRT telescopes.
2.1 Fermi-LAT data
Fermi-LAT on board the Fermi Gamma-ray Space Telescope is a pair-conversion telescope sensitive to -rays in the energy band from MeV to GeV. Scanning the entire sky every hours, it provides the deepest view of the -ray sky (Atwood
et al., 2009).
In the current study, the publicly available Fermi-LAT data accumulated between August 4, 2008 and August 4, 2018 are used. The Pass 8 (P8R3) Fermi-LAT events in the energy range from 100 MeV to 500 GeV extracted from a region of interest (ROI) around the -ray position of 3C 454.3 (RA and Dec ) have been analyzed using Fermi ScienceTools (1.2.1) and the P8R3_ SOURCE_ V2 instrument response functions (IRFs). With the help of gtselect tool the front and back events of type 3 and event class coming from zenith angles smaller than , to reduce contamination by photons from Earth’s atmosphere, were selected. Instead, the good time intervals are selected with gtmktime tool using the filter expression (DATAQUAL 0) and (LAT CONFIG1). The events are binned within a square region with a stereographic projection into pixels and into 37 equal logarithmically spaced energy bins with the help of gtbin tool. Then, an exposure map in the ROI with radius was computed using tasks gtltcube and gtexpmap. The background point sources from the Fermi-LAT fourth source catalog (4FGL; Ajello
et al., 2020) within ROI+5 from the position of 3C 454.3 were all included in the model file with the same spectral models as in the catalog. The normalization and spectral parameters of the sources within the ROI were set as free parameters, while that of the sources outside ROI were fixed to the catalog values. The model file contains the standard templates describing the diffuse emission from the Galaxy (gll_ iem_ v07) and the isotropic -ray background (iso_ P8R3_ SOURCE_ V2_ v1). The normalization of both components is considered as a free parameter in the analysis. Initially, the binned likelihood analysis is applied to the full time data set using the gtlike tool.
In the light curve calculations (shorter periods), the flux and photon index are estimated applying unbinned likelihood analysis. The photon indexes of all sources except 3C 454.3 are fixed, only keeping free the normalization of the sources within the ROI. As no variability is expected from background models, their normalization was fixed. Since the likelihood fitting is performed for short periods, the spectrum of 3C 454.3 was modeled as a power-law (PL) with the normalization and photon index as free parameters. The significance of the source emission in each interval is evaluated using test statistics defined as , where and are the likelihoods of the model without source (null hypothesis) and the alternative likelihood (with source), respectively.
3C 454.3 is a well known strongly variable -ray blazar, so the light curve is computed in two different ways. Initially, the light-curve with 3-day binning was calculated (Fig. 1 panel b), but at this fixed time binning the fast variation of the flux will be smoothed out and the true increase or the variation of the flux cannot be investigated. In the case of short time intervals, the flux can be estimated only in the active state when the source is bright. Thus, in order to have a deeper and detailed view of the -ray flux variation, the light curve was generated with the help of the adaptive binning method (Lott et al., 2012). In this case, the bin width is defined by requiring a constant relative flux uncertainty, so the time bins are longer during low flux levels and narrower when the source is in flaring state. The light curve generated by this method is a powerful tool for investigation of the flux variations in short time scales and identification of flaring periods as well as it contains maximum possible information on the flux variation (e.g., see Gasparyan et al., 2018; Sahakyan et al., 2018; Zargaryan et al., 2017; Baghmanyan et al., 2017; Britto et al., 2016; Rani et al., 2013b).
The adaptively binned light curve with 20% uncertainty and above MeV (for see Lott et al., 2012) is in Fig. 1 panel a) showing the complex behavior of 3C 454.3 in 2008-2018. The source is so bright that the flux and photon index were estimated in 11698 time intervals providing a possibility to investigate the -ray flux changes also in hour scales.

The source exhibited several substantial -ray flaring events during the considered period. In the low state (e.g., MJD 55800-56140) the -ray flux is of the order of , however, during the flares the flux was above . The major -ray flaring activity was observed during MJD 55517-55522 when the highest -ray flux of above 141.6 MeV was observed on MJD 55519.3 with significance which is times higher than the lowest -ray flux. Interestingly, there are in total 1657 time intervals when the source flux was above which were observed in different periods, showing that from time to time the source was in a powerful -ray emitting state. Fig. 2 shows the distribution of the -ray flux of 3C 454.3 estimated in 11698 intervals. The distribution shows three peaks which characterize different states of the source. The fit of these peaks with three Gaussian functions is shown with red line in Fig. 2. The first peak is at which is the average -ray flux of the source. The other two peaks are at and , respectively, when the source was in an active -ray emitting state. Especially interesting are the periods when the flux exceeded the third peak; for example, in 72 intervals the source was in a hyperactive state when the -ray flux varied within , corresponding to an apparent isotropic -ray luminosity of , which is the range of the highest -ray luminosity observed from blazars so far. It is interesting to note that the 3C 454.3 flux was for 30.8 days in total ( % of the considered ten years). This once more confirms that 3C 454.3 is extremely variable in the -ray band.
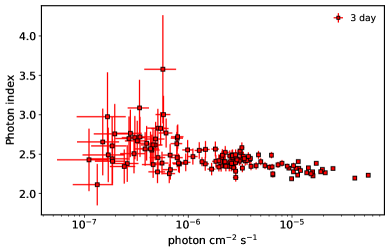

The evolution of the -ray photon index in the considered ten years was also investigated. Unlike the fast -ray flux variation, the photon index does not vary significantly. It is hard to investigate the photon index variation when adaptive bins are considered, as the time intervals are short and the photon index is estimated with large uncertainty; the simple test results in with a probability of , implying a relatively constant photon index. Instead, in the light curve with 3-day bins, the accumulation time is enough for precise estimation of the photon index showing that it varies as well. Considering only the intervals when TS 16, the hardest photon index of was observed on MJD with . The source flux was , implying the source was in an average -ray emitting state. Furthermore, the -ray photon index correlation was investigated. The correlation of the photon index and the flux is expected when the accelerated electrons are cooled down; the photon index is controlled by acceleration or cooling times, and depending on which of them is dominating, the photon index at the peak flux either softens or hardens (Kirk et al., 1998). Photon index hardening is observed for some blazars and radio galaxies when they get brighter (e.g., see Abdo et al., 2010a, c; Ackermann et al., 2010; Baghmanyan et al., 2017). In the long time scale, any trend will be smoothed out because of the mix of different flux levels, so the spectral variability and flux correlation was investigated using the data around the major -ray flare (MJD 55400-55800). The -ray photon index versus flux estimated in 3-day bins is presented in Fig. 3 (left panel) and the possible correlation is investigated using the linear-Pearson correlation test. The test yielded , implying a negative correlation between the flux and photon index, i.e., the flux increases with decreasing (hardening) photon index. It should be noted that a very moderate harder when brighter trend was measured using daily bins for the period covering the outbursts in 2009 December and 2010 April (Ackermann et al., 2010).
2.2 Swift XRT
The Swift satellite with three instruments on board, the UV and Optical Telescope (UVOT, Roming
et al., 2005), the X-Ray Telescope (XRT, Burrows
et al., 2005) sensitive to the 0.3-10.0 keV band, and the Burst Alert Telescope (BAT, Barthelmy
et al., 2005)
sensitive to the 15-150 keV band is an ideal instrument for simultaneous observation of blazars in the X-ray, Optical, and UV bands. 3C 454.3 was monitored by Swift 465 times during 2005 - 2016. In the current study the data collected by XRT and UVOT instruments has been analyzed.
The XRT data were taken both in photon counting mode (PC) or windowed timing mode (WT) with the single exposure ranging from 0.22 to 14.35 ks for a total exposure of Ms. All the XRT data were processed using Swiftxrtproc which is an automatic tool for XRT data analysis developed within the Open Universe initiative 111https://openuniverse.asi.it (Giommi
et al. (2020), Giommi et al. 2021, submitted). The raw event files (Level1) were reduced, calibrated and cleaned via the XRTPIPELINE script by applying the standard filtering criteria and the latest calibration files of CALDB. The source counts were extracted from a circular region of a radius of pixels () centered on the position of 3C 454.3, while the background counts are taken from an annular ring centered at the source, with inner and outer radii of pixels () and pixels (), respectively. For some observations, the source count rate was above and the data were significantly affected by the pile-up in the inner part of the point-spread function. These pile-up effects were removed by excluding events within the circle the radius of which is defined by the count rate and varying within --pixels. The ungrouped data were loaded in XSPEC (vesiopn 12.11) for spectral fitting using Cash statistics (Cash, 1979). The individual spectra were fitted adopting absorbed PL and log-parabola models with the galactic absorption column density of 222https://heasarc.gsfc.nasa.gov/cgi-bin/Tools/w3nh/w3nh.pl.
Fig. 1 d) shows the 2.0-10.0 keV X-ray flux variation during 2007-2016. The X-ray variation over different observations is evident, the lowest flux being and the highest . The source was observed many times around the major -ray brightening, showing the X-ray flux increased between MJD 55517-55520 when in seven observations the flux was above . Another period of bright X-ray emission was observed in MJD 55166-55174 when again the X-ray flux was . The X-ray flux varies albeit with lower amplitude also during the -ray flaring period in MJD 56800-57800.
Fig. 1 e) shows the variation of X-ray photon index measured in the keV band. The X-ray photon index is around and does not show substantial variation over different observations. However, occasionally harder or softer indexes are observed; the softest index of was observed on MJD 56829.60 while the hardest, , on MJD 54831.70. The photon index variation versus the flux is investigated using the data around the flares at MJD 55130-55250 and MJD 55400-55600. In the latter case, the linear-Pearson correlation test shows no correlation, while a negative correlation () is found during the first flare (Fig. 3 right panel). Along with the increase of the flux, the photon index hardens to .
| Period | Flux1 | |||||
| 54719.82 - 54730.50 | - - | 93.31 | 31.47 | |||
| 54808.37 - 54850.18 | - - | 63.71 | 26.53 | |||
| 54955.18 - 54990.41 | - - | 60.30 | 30.53 | |||
| 55051.41- | - - | 52.42 | 26.09 | |||
| 55104.72 - 55118.41 | - - | 79.08 | 30.29 | |||
| 55160.50 - 55166.10 | - - | 95.78 | 35.89 | |||
| 55177.89- | - - | 94.54 | 31.36 | |||
| 55213.93 - 55223.36 | - - | 85.59 | 37.13 | |||
| 55246.42 - 55264.45 | - - | 96.03 | 29.57 | |||
| 55280.79 - | - - | 92.52 | 25.52 | |||
| 55303.44 - 55308.62 | - - | 88.65 | 26.90 | |||
| 55371.82 - 55414.87 | - - | 88.15 | 52.14 | |||
| 55414.87 - 55422.58 | - - | 59.08 | 28.70 | |||
| 55464.76 - 55480.30 | - - | 68.19 | 34.55 | |||
| 55480.30 - 55494.20 | - - | 98.09 | 30.11 | |||
| 55494.20 - | - - | 87.34 | 28.15 | |||
| 55502.06 - 55510.51 | - - | 143.97 | 45.78 | |||
| 55517.05 - 55518.06 | - - | 143.71 | 40.02 | |||
| 55518.06 - 55518.68 | - - | 146.21 | 37.83 | |||
| 55519.59 - 55520.19 | - - | 128.32 | 26.71 | |||
| 55520.19 - 55520.80 | - - | 88.00 | 39.00 | |||
| 55521.30 - | - - | 114.86 | 27.45 | |||
| 55523.00 - 55525.35 | - - | 104.34 | 32.77 | |||
| 55529.04 - 55530.56 | - - | 74.78 | 25.08 | |||
| 55541.35 - 55542.68 | - - | 85.26 | 25.91 | |||
| 55543.94 - 55545.30 | - - | 94.92 | 28.50 | |||
| 55549.00 - 55553.46 | - - | 131.45 | 47.50 | |||
| 55587.20 - 55628.06 | - - | 119.14 | 44.66 | |||
| 56657.96 - 56744.44 | - - | 75.02 | 28.73 | |||
| 56829.85 - 56832.09 | - - | 114.77 | 37.68 | |||
| 56857.26 - | - - | 40.56 | 27.77 | |||
| 57267.66 - 57278.13 | - - | 72.78 | 27.99 | |||
| 57287.48 - | – | 81.17 | 25.05 | |||
| 57326.85 - | - - | 60.43 | 28.34 | |||
| 57400.81 - 57409.39 | - - | 88.21 | 56.42 | |||
| 57431.33 - | - - | 60.63 | 29.99 | |||
| 57558.20 - 57562.21 | - - | 55.20 | 26.14 | |||
| 57562.21 - 57562.71 | - - | 64.92 | 27.05 | |||
| 57563.01 - 57564.33 | - - | 89.99 | 47.61 | |||
| 57607.08 - 57635.05 | - - | 97.19 | 35.48 | |||
| 57743.77 - 57763.90 | - - | 76.37 | 34.49 | |||
| 1 The flux in units of . | ||||||
| 1 The cut-off energy in GeV. |
2.3 Swift UVOT
Simultaneously with XRT, 3C 454.3 was observed with the UVOT instrument in six filters, V (500-600 nm), B (380-500 nm), U (300-400 nm), W1 (220-400 nm), M2 (200-280 nm) and W2 (180–260 nm). All the single observations were processed. The source counts were extracted from a circular region of around the source, while the background - from a region away from the source not containing any significant pixel. The source magnitudes and fluxes were extracted using uvotsource. Magnitudes are corrected for the galactic extinction (Schlafly &
Finkbeiner, 2011) which were then converted to fluxes using the central wavelength values for each filter from Poole
et al. (2008).
Fig. 1 panels f) and g) show the light curves in optical and UV bands (separating V, B, U and W1, M2 and W2 filters for clarity). On the low state the optical/UV flux of the source is at the level of which increases above during the flares. The flux increased in all six filters with different amplitudes: the highest flux of was observed on MJD 53507.85 before the Fermi-LAT operation (not shown in Fig. 1). This coincides with the exceptional optical outburst observed in spring 2005 (Villata
et al., 2006). The flux increased almost to the same level, , also in band on MJD 56832.89. During the -ray major brightening around MJD 55500 and the flare in MJD 56800-57800, the UV flux in all bands substantially increased, being above .
The visual inspection of the light curves shown in Fig. 1 suggests that the flares in different bands are nearly correlated or appear with small legs. A cross correlation analysis of the 3C 454.3 emission in different bands has been performed in Amaya-Almazán
et al. (2021) where a detailed comparison of the emission in various bands is provided (see Table 2 and 3 in Amaya-Almazán
et al., 2021).

3 Evolution of Spectral Energy Distribution
The data presented in the previous section provide a detailed view of the long-term emission of 3C 454.3. The temporal evolution of the SEDs is investigated by generating SEDs with simultaneous or quasi simultaneous data. The SEDs are constructed in the following manner: for each interval the -ray data are plotted together with the Swift UVOT, XRT or, if available, archival data extracted from the ASI Space Science Data Centre (ASI/SSDC) 333https://tools.ssdc.asi.it/SED/. The archival data observed both at low and high frequencies are included, allowing to constrain the SEDs from Hz to Hz.
The intervals are selected based on the -ray data as the source is being continuously monitored since 2008. Yet, in the ideal case, the -ray spectral points should be generated for all adaptively binned intervals and compared with the Swift observations. However, for short intervals, in the -ray band the spectrum will extend only up to moderate energies of GeV not enough for theoretical modeling. So, in order to overcome the problem of low statistics, the adaptively binned light curve is divided into piecewise constant blocks (Bayesian blocks) by optimizing a fitness function (Scargle et al., 2013). This gives the optimal segmentation of the data into time intervals during which the data are statistically consistent with a constant flux. These blocks provide an objective way to detect significant local variations in the light curve. In this way, the -ray emitting intervals with the same flux level (weather flaring or constant) will be selected and separated. These intervals are shown in Fig. 1 c panel. By this statistical method, the selected intervals will be longer, allowing to calculate the -ray spectra up to reasonable energies necessary for theoretical modeling.
The Bayesian block algorithm applied to the adaptively binned light curve produces 388 intervals each with a constant flux level. Similarly, Bayesian blocks are computed also for the 3-day binned light curve, which in general produces similar results although with less intervals. In order to have a more detailed view of the SEDs evolution, the blocks from adaptively binned light curve are considered. The spectrum in each Bayesian block is computed by applying unbinned likelihood analysis assuming the spectrum of 3C 454.3 is a PL with the normalization and index as free parameters. Then, the SEDs are calculated by fixing the source PL index and running gtlike separately for 4 to 7 energy bins (depending on the source significance) of equal width in log scale.
The resultant SED evolution in time (SED/ligh curve animation) can be found in youtube.com/wNLVj3W6ZFg showing dramatic changes in the broadband spectrum of 3C 454.3 during 2008-2018. The flux amplification is nearly of two orders of magnitude in the optical/UV bands while in the X-ray band it is of two-three orders of magnitude. The major changes are observed in the -ray band when the flux changes by four orders of magnitude. Similar changes of the flux in the optical/UV and X-ray bands show that, perhaps, in these bands the same component is contributing, whereas in the -ray band another component is dominating. This fits well in the synchrotron and SSC/EIC scenario for the broadband emission from 3C 454.3.
3.1 Gamma-ray spectrum evolution in time
The periods when the -ray spectrum deviates from the simple PL model (red bowtie) can be identified in the time evolution of the multiwavelength SEDs. In order to identify whether the curvature is statistically significant, alternative fits with functions in the form of (power-law with exponential cut-off [PLEC]) and (log-parabola [LP]) were applied. These models are compared with PL modeling by applying a log likelihood ratio test where the significance is . In the 388 Bayesian blocks, there are 41 intervals when the significance of the curvature was . These periods are given in Table 1 for each interval, providing the -ray flux, photon index, cut-off energy or if the model is LP, detection significance and curvature significance.
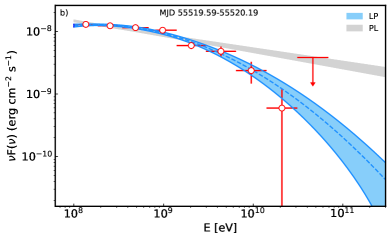
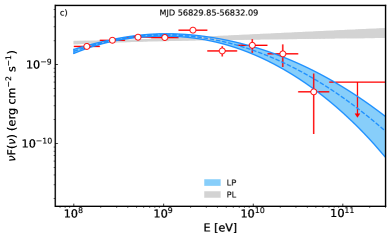
In all the periods, both PLEC and LP provide a statistically better representation of the data and only in nine periods (marked with ) only LP modeling was preferred over the simple PL model. In all the periods, the detection significance of the source was , convincingly high to test the curvature. In these periods the -ray spectrum is soft with a photon index of , except for five intervals when it was . Fig. 4 a) and b) panels show the 3C 454.3 spectra during two periods (with a high significance of the curvature) where the PLEC and LP are compared with PL model. Interestingly, curved spectra were observed also when the source was in active and hyperactive states (MJD 55502-55554 in Table 1). The spectrum in the hyperactive state with a flux of is shown in Fig. 4 b).
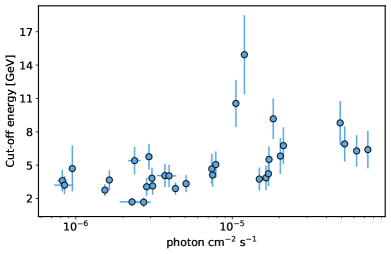
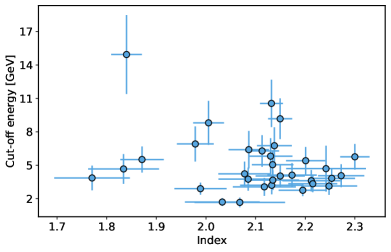
The cut-off energy variation versus the -ray flux and photon index is shown in Fig. 5. No strong cut-off energy variation is found as compared to the flux, i.e., the flux varies by a factor of , whereas the cut-off energy only by . Similarly, as the photon index occasionally can be as hard as , the break energy remains relatively constant. This is in agreement with the previous studies of 3C 454.3 (e.g., Abdo
et al., 2011; Ackermann
et al., 2010). The highest cut-off energy of GeV has been observed on MJD 56829.85-56832.09 when the source was in a bright -ray emission state with a flux of and the -ray photon index was .
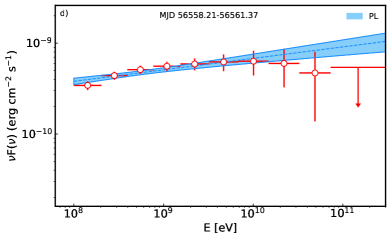
Interestingly, there are periods when the -ray spectrum substantially hardened shifting the peak of the second emission component towards higher energies. The spectrum of 3C 454.3 in such two periods in shown in Fig. 4 panels c) and d). In the first period (panel c), even if the -ray spectrum is initially hard, it starts to curve above a few GeV, and the LP model better explains the data. On the other hand, the -ray spectrum measured during MJD 56558.21-56561.37 is with a photon index of and extends above GeV with . Additional periods with harder -ray photon index of , and were observed during MJD 56834.20-56834.91, 56916.17-56916.64 and 56827.09-56827.52, respectively. Although, these are short intervals as compared with the period in Fig. 4 d) and the spectra were measured up to GeV, the hardening of the spectrum is evident.
4 Origin of multiwavelength emission
The multiwalength data obtained in Section 2 provide unprecedented detailed information on the emission spectrum of 3C 454.3 over different years. Yet, the large amount of the available data allows to investigate not only the emission in different states but also, through theoretical modeling, the evolution of different components of the SEDs. By modeling single snapshot SEDs constrained by (quasi) contemporaneous data, the main parameters describing the jet can be estimated, whereas modeling of the SEDs of the same source observed in different periods can provide a clue on the changes in the jet over different periods. Such an interpretation of the data is the backbone of any model aiming to self-consistently explain blazar emission. Thus, in all the periods shown in the SED/light curve animation when the data in the optical/UV, X-ray and -ray bands are available (362 periods) have been modeled and the corresponding parameters estimated.
The double-peaked SED of 3C 454.3 is modeled within a homogeneous one-zone leptonic scenario where the low energy component is interpreted as synchrotron emission of relativistic electrons, while the second component is due to inverse Compton up-scattering of various photon fields. The seed photons come from the jet itself (SSC model e.g., Maraschi et al., 1992; Bloom &
Marscher, 1996) and those from the accretion disk (external Compton scattering of direct disk radiation, EC disk; Dermer et al., 1992) or those reflected from the BLR clouds (EC BLR; Sikora
et al., 1994) or those of the dusty torus (Błażejowski et al., 2000), depending on the location of the emission region along the jet. However, the observed high energetics of 3C 454.3 as well as the short time variability in the -ray band suggest that the emission region is located close to the blazar central black hole where the dominant photon fields are those from the accretion disk and BLR. Similar assumption was made in Vercellone
et al. (2010), and Finke &
Dermer (2010) demonstrated that the combination of those two photon fields can explain the sharp break in the SED of 3C 454.3 and it gives a better fit to the quasi-simultaneous radio, optical/UV, X-ray and -ray data.
In this scenario, the emission is produced in a spherical blob of the jet with a size of filled with uniform magnetic field that moves with a Lorentz factor of at a small angle to the observer. The emission from the blob is enhanced by for small angles. The emission region is filled with a population of non-thermal electrons which have a broken power-law distribution in the form of
| (1) |
where and are the low and high indexes of electrons correspondingly below and above the break energy , is the minimum electron energy in the jet frame. is connected with the total energy of electrons which scales with the magnetic field energy density .
It is assumed that the emission region is within the BLR, at a distance of cm. Bonnoli et al. (2011) derived that for 3C 454.3 the BLR is located at a distance of cm. Therefore, the BLR is modeled as a spherical shell with a lower boundary of cm and an outer boundary of (Donea &
Protheroe, 2003) and which reflects 10% of the disk luminosity . The disk emission is approximated as a mono-temperature black body.
In order to reduce the number of free parameters, it is assumed that the emission region size is cm which corresponds to hour scale variability as observed in the -ray band. Next, in order to constrain the source parameters (e.g., the disk luminosity), the SED observed in MJD 54808.37-54750.83, where the disk contribution in the optical/UV band (blue bump) can be seen, is modeled. The fitting is performed with the open source package JetSet (Massaro et al., 2006; Tramacere et al., 2011, 2009).
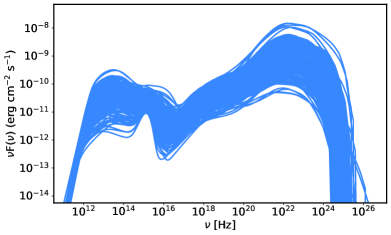
The SED well reproduced by the applied model is shown in Fig. 6 (upper panel). The sum of all components is shown in blue, while the disk component is in magenta peaking at K ( Hz) with the luminosity of similar to the values usually estimated for 3C 454.3. The X-ray emission is dominated by the contribution from SSC (green) while the EC of disk and BLR components (light blue and red, respectively) dominate at higher energies. The fitting resulted in which is typical for the bright blazars and implying that all electrons are cooling in the emitting region. The PL indexes of electrons change from 1.34 to 3.51 at the break energy of .
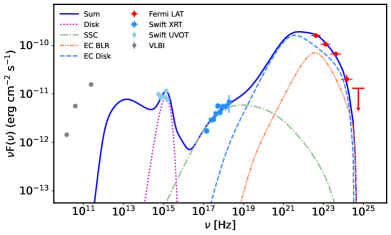
When modeling the SEDs in other periods, the disk luminosity and temperature are fixed to the values obtained from the fitting of the SED in MJD 54808.37-54750.83. The other model parameters (, , , , , and ) have been then estimated by fitting the SEDs. The SEDs modeling animation is available here youtube.com/dAqVjpO5Nb4. The synchrotron/SSC components account for the data up to the X-ray band and, in principle, SSC could extend to HEs. However, as demonstrated in Finke &
Dermer (2010), the SSC component cannot explain the sharp break observed in the -ray band and in such case the strong contribution from BLR photons should be neglected. Considering inverse Compton scattering of only BLR photons, which have a narrower distribution than the SSC component starts to decrease and cannot explain the Fermi-LAT data. Instead, the HE spectrum can be well reproduced when considering the joint contribution from EC of disk and BLR photons. The EC disk component dominates in the sub-GeV band, while the contribution of EC BLR is significant at HEs. However, the -ray data can be explained also when considering the joint inverse Compton scattering of BLR and torus photons (e.g., see Kang et al., 2021).
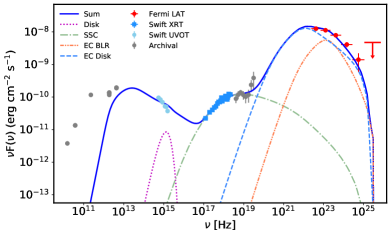
The modeling of the SED during the bright period in MJD 55519.59-55520.19 is shown in Fig. 6 (middle panel). In this active emission state, the source flux from radio to X-ray bands increased nearly by an order of magnitude while in the -ray band by nearly two orders of magnitude. As compared with the results of the modeling of the SED in MJD 54808.37-54750.83, the parameters describing the emitting electrons did not vary substantially (e.g., , and were estimated in MJD 55519.59-55520.19), but a higher was estimated. This implies that the flaring activity was caused by the changes in the bulk Lorentz factor of the emitting region.
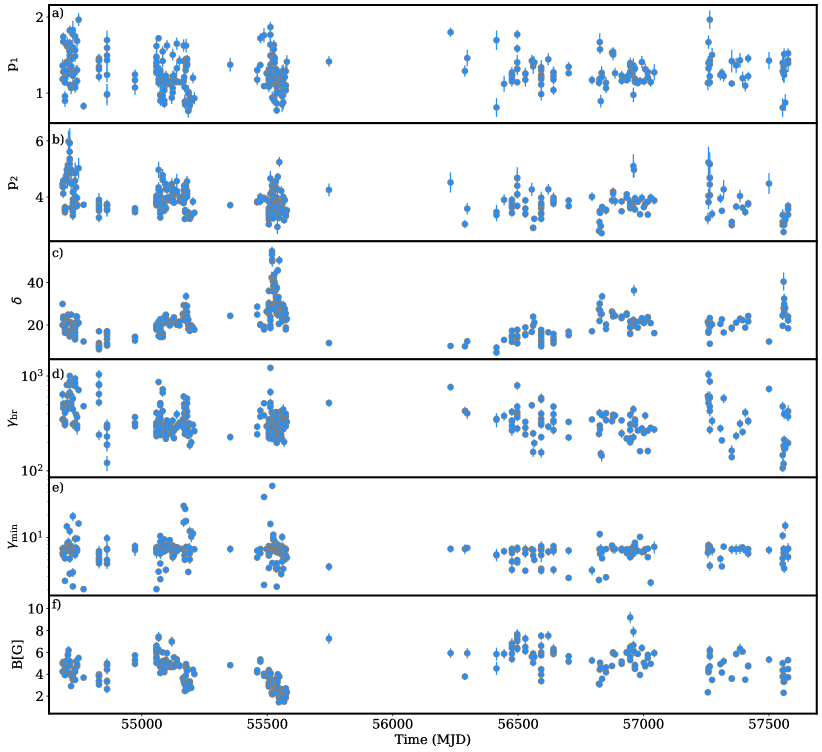
The evolution of model parameters is shown in Fig. 7. The photon indexes (panel a and b) are defined by different data sets and vary in the range of and . The emission in the X-ray band is due to inverse Compton up-scattering of synchrotron photons in the Thomoson regime and the PL index of the emitting electrons is defined by the X-ray data. Similarly, the -ray data which are due to inverse Compton scattering of disk and BLR photons are defining . The modeling shows that the -, so the index change is significantly larger than that expected from the standard cooling break. The break energy (panel d in Fig. 7) is in the range of defining the low and high energy peaks to be at Hz and Hz, respectively, which is characteristic for FSRQs. The minimum electron energy varies in the range of - which is shown in panel e) of Fig. 7. Along with this minimal energy is defined by the SSC modeling of the X-ray data.The magnetic field in the jet is in the range from to G (lower panel of Fig. 7) and the amplitude of its variation is lower than that of the parameters describing the emitting electrons. This implies that the observed flares are likely due to the changes in the emitting electrons rather than in the emitting region plasma.
5 Discussion
The broadband monitoring of 3C 454.3 in 2008-2018 reveals an interesting and complicated behaviour in all the considered bands. The highest amplitude flares are observed in the -ray band when the flux in several occasions was above which corresponds to an apparent isotropic -ray luminosity exceeding (for the 5.49 Gpc distance to 3C 454.3). In these active states, in the proper frame of the jet, the total power emitted in the -ray band would be which by nearly an order of magnitude exceeds the disk luminosity in agreement with the results of Ghisellini et al. (2014).
The -ray photon index of 3C 454.3 varies as well; occasionally the photon index can be as hard as measured during a 3-day period. During this period, the highest energy event with GeV has been observed in MJD 56559.89 within a circle of around 3C 454.3, with the probability of 0.99987 being associated with it (computed with gtsrcprob tool). Such hardening of the -ray spectrum is unusual for FSRQs which are characterized by a soft -ray photon index (e.g., the mean of FSRQ photon index distribution is in 4FGL). However, during the -ray flares, occasional hardening of the the -ray photon index of FSRQs have been already observed (e.g., see Pacciani
et al., 2014; Gasparyan et al., 2018; Sahakyan, 2020b; Paliya
et al., 2019; Angioni et al., 2019).
In some periods the -ray spectrum of 3C 454.3 deviates from the simple PL model and PLEC and LP models give a better explanation to the overall spectrum. Such modification of the spectrum was observed when the -ray emission of the source was in an average or active emitting state, but unlike the strong changes in the flux ( times), the cut-off energy is within GeV.
In the X-ray band 3C 454.3 behaves like a classical FSRQ with a hard X-ray photon index of . Unlike the changes in the X-ray flux, which can increase up to , the photon index is relatively constant. The linear-Pearson correlation test reveals a negative correlation () between the flux and photon index during the flare at MJD 55130-55250. In the optical/UV band 3C 454.3 is in an active state after the large outburst in 2005: in several occasions the flux was as high as . The available optical/UV data allows to shape the peak of the low energy component to be around and unlike the increase of the flux it remains relatively constant. In the past, short transition of the low energy component to higher frequencies during the flares was observed in several FSRQs (e.g., see Cavaliere &
D’Elia, 2002; D’Ammando
et al., 2011; Sbarrato et al., 2012b; Giommi et al., 2012; Cutini
et al., 2014). For 3C 454.3, in this band either the contribution of the disk is observed or, when the synchrotron jet emission dominates during the flares, it corresponds to the falling part of the low energy component which consequently defines the HE tail of the electron distribution. This implies that even during the flares, the processes limiting the maximum energy of the accelerated electrons (e.g., cooling or a limit from the accelerator size) do not change and produce the same effect on the electron acceleration.
The multiwavelength SEDs observed in various periods during the considered ten years are well modeled within one-zone leptonic model taking into account the inverse Compton scattering of synchrotron, disk and BLR photons. The adopted model with physically realistic parameters can satisfactorily reproduce the observed SEDs; the models obtained in 362 periods are in Fig. 6 (lower panel) which shows the multiwavelength behaviour of 3C 454.3 in 2008-2018. It is evident that the broadband emission varies significantly, except for the radio band which is most likely produced from electrons in more extended regions. This is more evident when comparing the SEDs in the upper and middle panels of Fig. 6 where two different emission states of the source are shown. Unlike the changes in the flux, the peak of both components remains relatively stable. Within the adopted scenario, this could be interpreted by strong cooling of the electrons, i.e., due to the existence of dense photon fields (internal and external), the injected particles cool down, limiting their maximum energy, thus affecting the emission of photons. The different rising and decaying spectra of both components are most likely related with the initial injection (cooling) of electrons.
The modeling reveals that the emitting electrons initially are distributed with a hard PL index with a mean of which substantially hardens to . The break energy varies in the range of and is defined by the interplay between the particle acceleration and cooling times. The electron cooling time is defined as
| (2) |
where . The densities of disk and BLR photons are constant whereas and , which depend on the synchrotron and SSC components, vary in different periods (Fig. 6 lower panel). Thus, the small variation of the break energy (see Fig. 7) is defined by the changes in and . Yet, in the vast majority of cases the ratio of is implying that the SSC cooling cannot be neglected, so the nonlinear effects are important for the formation of particle distribution, i.e., and . Because of these nonlinear effects the difference between and is larger than that expected from traditional cooling break (). Alternatively, large could be due to the nature of the injection process or due to the inhomogeneities in the source (Reynolds, 2009).
In the modeling, some SEDs can be modeled only when considering very hard electron spectra; is . This index depends on the combination of the data in the X-ray and -ray bands and sometimes because of their hard photon indexes, is required. In the fast electron cooling regime, a much softer spectrum will be formed below , whereas in the slow cooling regime the hard spectrum of electrons may be due to their initial injection. However, the PL index of is challenging for many particle acceleration scenarios. The diffuse shock acceleration of particles can form a spectrum as hard as depending on the parameters of the shocks (e.g., Summerlin &
Baring, 2012). Similarly, a very hard electron spectrum will be formed in the relativistic magnetic reconnection (Zenitani &
Hoshino, 2001; Guo
et al., 2014; Sironi &
Spitkovsky, 2014; Werner et al., 2016) only under extremely high magnetization conditions ().
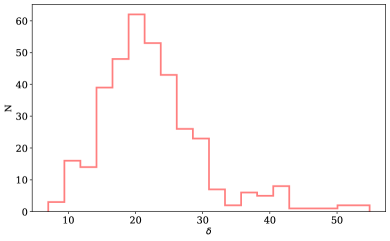
The distribution of Doppler boosting factor is presented in the upper panel of Fig. 8 which has a peak at which is characteristic for bright FSRQs (Ghisellini &
Tavecchio, 2015). However, in some periods substantially higher values for are estimated: there are 26 periods when . As can be seen from Fig. 7 (panel c), high were estimated around MJD 55500 when the source was in a bright -ray emission state. For example, the highest was estimated in MJD 55518.68-55519.10 when the -ray flux was as high as and that in the X-ray band- . So, in this period the emission region has a larger Doppler boosting factor which results in a strong increase in the Compton dominance (hence an increase of the HE component) as the external photon density in the comoving frame of the jet depends on the Doppler boosting factor. This faster moving emitting region could be either re-accelerated during the propagation or could be newly injected and emits close to the central source. Another possibility for the Doppler boosting factor increase can be due to geometrical effects, i.e, when the jet regions may have different orientations; e.g., jets in a jet (Giannios et al., 2009) or twisted inhomogeneous jet model (Raiteri
et al., 2017). So, during the flares the photons may be produced in a region viewed at smaller angles as compared to the entire jet, which increases the Doppler boosting factor.
The modeling provides also information on the power of the jet. The distribution of the jet luminosities in the form of magnetic field and electron kinetic energy computed as and is given in Fig. 8 (lower panel). is in the range of while in , implying the system is not far from the equipartition condition. The peak of is around and is at . For the majority of SEDs, the jet is slightly particle-dominated with and only in a few periods when the low energy components exceed the X-ray flux . The total jet luminosity defined as (Ghisellini &
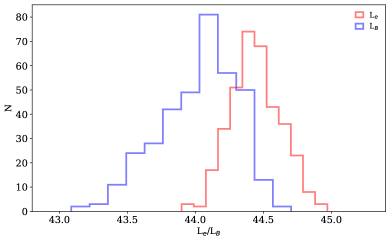
Celotti, 2001), where and are the power carried by the cold protons and the produced radiation, respectively, is , being smaller than the total Eddington luminosity of for the black hole mass of in 3C 454.3.
6 Conclusions
In this paper the broadband emission from 3C 454.3 during 2008-2018 is investigated. In this period the source was in active emission state displaying extraordinary flares in the -ray band. In several occasions the -ray flux exceeded corresponding to an apparent isotropic -ray luminosity of . Similarly, the source was active (although with lower amplitude) also in the X-ray and optical/UV bands.
The multiwavelength SEDs of 3C 454.3 (in 362 periods) constrained with contemporaneous data collected during 2008-2018 have been modeled within a one-zone leptonic scenario taking into account the inverse Compton scattering of synchrotron, disk and BLR reflected photons. Through the modeling, the main parameters describing the jet in different periods have been estimated providing an insight into the jet evolution in 2008-2018. It is shown that during the large -ray flares the Doppler boosting factor substantially increased which points that the emission during the flares comes most likely from a region which either moves faster or has a different geometrical orientation.
Acknowledgements
I thank the anonymous referee for constructive comments. I acknowledge the use of data, analysis tools and services from the Open Universe platform, the Astrophysics Science Archive Research Center (HEASARC) and the Fermi Science Tools.
This work was supported by the Science Committee of RA, in the frames of the research project No 20TTCG-1C015.
This work used resources from the ASNET cloud and the EGI infrastructure with the dedicated support of CESGA (Spain).
Data availability
The data underlying this article will be shared on reasonable request to the corresponding author.
References
- Abdo et al. (2009) Abdo A. A., et al., 2009, ApJ, 699, 817
- Abdo et al. (2010a) Abdo A. A., et al., 2010a, ApJ, 710, 810
- Abdo et al. (2010b) Abdo A. A., et al., 2010b, ApJ, 716, 30
- Abdo et al. (2010c) Abdo A. A., et al., 2010c, ApJ, 721, 1425
- Abdo et al. (2011) Abdo A. A., et al., 2011, ApJ, 733, L26
- Ackermann et al. (2010) Ackermann M., et al., 2010, ApJ, 721, 1383
- Ackermann et al. (2016) Ackermann M., Anantua R., et al. 2016, ApJ, 824, L20
- Ackermann et al. (2017) Ackermann M., et al., 2017, ApJ, 837, L5
- Ajello et al. (2020) Ajello M., et al., 2020, ApJ, 892, 105
- Aleksić et al. (2011) Aleksić J., et al., 2011, ApJ, 730, L8
- Amaya-Almazán et al. (2021) Amaya-Almazán R. A., Chavushyan V., Patiño-Álvarez V. M., 2021, ApJ, 906, 5
- Angioni et al. (2019) Angioni R., Nesci R., Finke J. D., Buson S., Ciprini S., 2019, A&A, 627, A140
- Ansoldi et al. (2018) Ansoldi S., et al., 2018, ApJ, 863, L10
- Atwood et al. (2009) Atwood W. B., et al., 2009, ApJ, 697, 1071
- Baghmanyan et al. (2017) Baghmanyan V., Gasparyan S., Sahakyan N., 2017, ApJ, 848, 111
- Barthelmy et al. (2005) Barthelmy S. D., et al., 2005, Space Sci. Rev., 120, 143
- Biteau et al. (2020) Biteau J., et al., 2020, Nature Astronomy, 4, 124
- Błażejowski et al. (2000) Błażejowski M., Sikora M., Moderski R., Madejski G. M., 2000, ApJ, 545, 107
- Bloom & Marscher (1996) Bloom S. D., Marscher A. P., 1996, ApJ, 461, 657
- Bonning et al. (2009) Bonning E. W., et al., 2009, ApJ, 697, L81
- Bonnoli et al. (2011) Bonnoli G., Ghisellini G., Foschini L., Tavecchio F., Ghirlanda G., 2011, MNRAS, 410, 368
- Böttcher et al. (2013) Böttcher M., Reimer A., Sweeney K., Prakash A., 2013, ApJ, 768, 54
- Britto et al. (2016) Britto R. J., Bottacini E., Lott B., Razzaque S., Buson S., 2016, ApJ, 830, 162
- Brown (2013) Brown A. M., 2013, MNRAS, 431, 824
- Burrows et al. (2005) Burrows D. N., et al., 2005, Space Sci. Rev., 120, 165
- Cash (1979) Cash W., 1979, ApJ, 228, 939
- Cavaliere & D’Elia (2002) Cavaliere A., D’Elia V., 2002, ApJ, 571, 226
- Cerruti et al. (2019) Cerruti M., Zech A., Boisson C., Emery G., Inoue S., Lenain J.-P., 2019, MNRAS, 483, L12
- Costamante et al. (2001) Costamante L., et al., 2001, A&A, 371, 512
- Cutini et al. (2014) Cutini S., et al., 2014, MNRAS, 445, 4316
- D’Ammando et al. (2011) D’Ammando F., et al., 2011, A&A, 529, A145
- Dermer & Schlickeiser (1993) Dermer C. D., Schlickeiser R., 1993, ApJ, 416, 458
- Dermer et al. (1992) Dermer C. D., Schlickeiser R., Mastichiadis A., 1992, A&A, 256, L27
- Donea & Protheroe (2003) Donea A.-C., Protheroe R. J., 2003, Astroparticle Physics, 18, 377
- Donnarumma et al. (2009) Donnarumma I., et al., 2009, ApJ, 707, 1115
- Finke & Dermer (2010) Finke J. D., Dermer C. D., 2010, ApJ, 714, L303
- Foschini et al. (2011) Foschini L., Ghisellini G., Tavecchio F., Bonnoli G., Stamerra A., 2011, A&A, 530, A77
- Foschini et al. (2013) Foschini L., Bonnoli G., Ghisellini G., Tagliaferri G., Tavecchio F., Stamerra A., 2013, A&A, 555, A138
- Gao et al. (2019) Gao S., Fedynitch A., Winter W., Pohl M., 2019, Nature Astronomy, 3, 88
- Gasparyan et al. (2018) Gasparyan S., Sahakyan N., Baghmanyan V., Zargaryan D., 2018, ApJ, 863, 114
- Ghisellini & Celotti (2001) Ghisellini G., Celotti A., 2001, MNRAS, 327, 739
- Ghisellini & Tavecchio (2009) Ghisellini G., Tavecchio F., 2009, MNRAS, 397, 985
- Ghisellini & Tavecchio (2015) Ghisellini G., Tavecchio F., 2015, MNRAS, 448, 1060
- Ghisellini et al. (1985) Ghisellini G., Maraschi L., Treves A., 1985, A&A, 146, 204
- Ghisellini et al. (2011) Ghisellini G., Tavecchio F., Foschini L., Ghirlanda G., 2011, MNRAS, 414, 2674
- Ghisellini et al. (2014) Ghisellini G., Tavecchio F., Maraschi L., Celotti A., Sbarrato T., 2014, Nature, 515, 376
- Giannios et al. (2009) Giannios D., Uzdensky D. A., Begelman M. C., 2009, MNRAS, 395, L29
- Giommi et al. (1999) Giommi P., Menna M. T., Padovani P., 1999, MNRAS, 310, 465
- Giommi et al. (2006) Giommi P., et al., 2006, A&A, 456, 911
- Giommi et al. (2012) Giommi P., Padovani P., Polenta G., Turriziani S., D’Elia V., Piranomonte S., 2012, MNRAS, 420, 2899
- Giommi et al. (2020) Giommi P., et al., 2020, in S. F., ed., Space Capacity Building in the XXI Century. Studies in Space Policy. Springer, pp 377–386 (arXiv:1805.08505), doi:10.1007/978-3-030-21938-3
- Guo et al. (2014) Guo F., Li H., Daughton W., Liu Y.-H., 2014, Phys. Rev. Lett., 113, 155005
- Hartman et al. (1993) Hartman R. C., et al., 1993, ApJ, 407, L41
- Hayashida et al. (2015) Hayashida M., Nalewajko K., et al. 2015, ApJ, 807, 79
- IceCube Collaboration et al. (2018a) IceCube Collaboration et al., 2018a, Science, 361, 147
- IceCube Collaboration et al. (2018b) IceCube Collaboration et al., 2018b, Science, 361, eaat1378
- Jorstad et al. (2013) Jorstad S. G., et al., 2013, ApJ, 773, 147
- Kang et al. (2021) Kang S.-J., Zheng Y.-G., Wu Q., Chen L., Yin Y., 2021, arXiv e-prints, p. arXiv:2102.08962
- Keivani et al. (2018) Keivani A., et al., 2018, ApJ, 864, 84
- Kirk et al. (1998) Kirk J. G., Rieger F. M., Mastichiadis A., 1998, A&A, 333, 452
- Liu et al. (2006) Liu Y., Jiang D. R., Gu M. F., 2006, ApJ, 637, 669
- Lott et al. (2012) Lott B., Escande L., Larsson S., Ballet J., 2012, A&A, 544, A6
- Mannheim (1993) Mannheim K., 1993, A&A, 269, 67
- Mannheim & Biermann (1989) Mannheim K., Biermann P. L., 1989, A&A, 221, 211
- Maraschi et al. (1992) Maraschi L., Ghisellini G., Celotti A., 1992, ApJ, 397, L5
- Massaro et al. (2006) Massaro E., Tramacere A., Perri M., Giommi P., Tosti G., 2006, A&A, 448, 861
- Mücke & Protheroe (2001) Mücke A., Protheroe R. J., 2001, Astroparticle Physics, 15, 121
- Mücke et al. (2003) Mücke A., Protheroe R. J., Engel R., Rachen J. P., Stanev T., 2003, Astroparticle Physics, 18, 593
- Murase et al. (2018) Murase K., Oikonomou F., Petropoulou M., 2018, ApJ, 865, 124
- Nalewajko (2013) Nalewajko K., 2013, MNRAS, 430, 1324
- Pacciani et al. (2010) Pacciani L., et al., 2010, ApJ, 716, L170
- Pacciani et al. (2014) Pacciani L., Tavecchio F., Donnarumma I., Stamerra A., Carrasco L., Recillas E., Porras A., Uemura M., 2014, ApJ, 790, 45
- Padovani & Giommi (1995) Padovani P., Giommi P., 1995, ApJ, 444, 567
- Padovani et al. (2017) Padovani P., et al., 2017, A&ARv, 25, 2
- Padovani et al. (2018) Padovani P., Giommi P., Resconi E., Glauch T., Arsioli B., Sahakyan N., Huber M., 2018, MNRAS, 480, 192
- Paggi et al. (2011) Paggi A., Cavaliere A., Vittorini V., D’Ammando F., Tavani M., 2011, ApJ, 736, 128
- Paliya et al. (2019) Paliya V. S., et al., 2019, ApJ, 871, 211
- Pian et al. (1998) Pian E., et al., 1998, ApJ, 492, L17
- Poole et al. (2008) Poole T. S., et al., 2008, MNRAS, 383, 627
- Poutanen & Stern (2010) Poutanen J., Stern B., 2010, ApJ, 717, L118
- Raiteri et al. (2008) Raiteri C. M., et al., 2008, A&A, 491, 755
- Raiteri et al. (2011) Raiteri C. M., et al., 2011, A&A, 534, A87
- Raiteri et al. (2017) Raiteri C. M., et al., 2017, Nature, 552, 374
- Rani et al. (2013a) Rani B., Lott B., Krichbaum T. P., Fuhrmann L., Zensus J. A., 2013a, A&A, 557, A71
- Rani et al. (2013b) Rani B., Lott B., Krichbaum T. P., Fuhrmann L., Zensus J. A., 2013b, A&A, 557, A71
- Reynolds (2009) Reynolds S. P., 2009, ApJ, 703, 662
- Righi et al. (2019) Righi C., Tavecchio F., Pacciani L., 2019, MNRAS, 484, 2067
- Roming et al. (2005) Roming P. W. A., et al., 2005, Space Sci. Rev., 120, 95
- Sahakyan (2018) Sahakyan N., 2018, ApJ, 866, 109
- Sahakyan (2019) Sahakyan N., 2019, A&A, 622, A144
- Sahakyan (2020a) Sahakyan N., 2020a, MNRAS, 496, 5518
- Sahakyan (2020b) Sahakyan N., 2020b, A&A, 635, A25
- Sahakyan & Gasparyan (2017) Sahakyan N., Gasparyan S., 2017, MNRAS, 470, 2861
- Sahakyan & Giommi (2021) Sahakyan N., Giommi P., 2021, MNRAS, 502, 836
- Sahakyan et al. (2018) Sahakyan N., Baghmanyan V., Zargaryan D., 2018, A&A, 614, A6
- Sahakyan et al. (2020) Sahakyan N., Israyelyan D., Harutyunyan G., Khachatryan M., Gasparyan S., 2020, MNRAS, 498, 2594
- Saito et al. (2013) Saito S., Stawarz Ł., et al. 2013, ApJ, 766, L11
- Sbarrato et al. (2012a) Sbarrato T., Ghisellini G., Maraschi L., Colpi M., 2012a, MNRAS, 421, 1764
- Sbarrato et al. (2012b) Sbarrato T., Ghisellini G., Maraschi L., Colpi M., 2012b, MNRAS, 421, 1764
- Scargle et al. (2013) Scargle J. D., Norris J. P., Jackson B., Chiang J., 2013, ApJ, 764, 167
- Schlafly & Finkbeiner (2011) Schlafly E. F., Finkbeiner D. P., 2011, ApJ, 737, 103
- Shukla et al. (2018) Shukla A., et al., 2018, ApJ, 854, L26
- Sikora et al. (1994) Sikora M., Begelman M. C., Rees M. J., 1994, ApJ, 421, 153
- Sikora et al. (2009) Sikora M., Stawarz Ł., Moderski R., Nalewajko K., Madejski G. M., 2009, ApJ, 704, 38
- Sironi & Spitkovsky (2014) Sironi L., Spitkovsky A., 2014, ApJ, 783, L21
- Summerlin & Baring (2012) Summerlin E. J., Baring M. G., 2012, ApJ, 745, 63
- Tramacere et al. (2009) Tramacere A., Giommi P., Perri M., Verrecchia F., Tosti G., 2009, A&A, 501, 879
- Tramacere et al. (2011) Tramacere A., Massaro E., Taylor A. M., 2011, ApJ, 739, 66
- Urry & Padovani (1995) Urry C. M., Padovani P., 1995, PASP, 107, 803
- Vercellone et al. (2010) Vercellone S., et al., 2010, ApJ, 712, 405
- Vercellone et al. (2011) Vercellone S., et al., 2011, ApJ, 736, L38
- Villata et al. (2006) Villata M., et al., 2006, A&A, 453, 817
- Werner et al. (2016) Werner G. R., Uzdensky D. A., Cerutti B., Nalewajko K., Begelman M. C., 2016, ApJ, 816, L8
- Woo & Urry (2002) Woo J.-H., Urry C. M., 2002, ApJ, 579, 530
- Zargaryan et al. (2017) Zargaryan D., Gasparyan S., Baghmanyan V., Sahakyan N., 2017, A&A, 608, A37
- Zenitani & Hoshino (2001) Zenitani S., Hoshino M., 2001, ApJ, 562, L63