Linking nearby stellar streams to more distant halo overdensities
Abstract
Context. It has been recently shown that the halo near the Sun contains several kinematic substructures associated to past accretion events. For the more distant halo, there is evidence of large-scale density variations – in the form of stellar clouds or overdensities.
Aims. We study the link between the local halo kinematic groups and three of these stellar clouds: the Hercules-Aquila cloud, the Virgo Overdensity, and the Eridanus-Phoenix overdensity.
Methods. We perform orbital integrations in a standard Milky Way potential of a local halo sample extracted from Gaia EDR3, with the goal of predicting the location of the merger debris elsewhere in the Galaxy. We specifically focus on the regions occupied by the three stellar clouds and compare their kinematic and distance distributions with those predicted from the orbits of the nearby debris.
Results. We find that the local halo substructures have families of orbits that tend to pile up in the regions where the stellar clouds have been found. The distances and velocities of the cloud’s member stars are in good agreement with those predicted from the orbit integrations, particularly for Gaia-Enceladus stars. This is the dominant contributor of all three overdensities, with a minor part stemming from the Helmi streams and to an even smaller extent from Sequoia. The orbital integrations predict no asymmetries in the sky distribution of halo stars, and they pinpoint where additional debris associated with the local halo substructures may be located.
Key Words.:
Galaxy: halo, kinematics and dynamics1 Introduction
The importance of accretion in the build up of the Galactic stellar halo was made evident by wide-field photometric surveys such as the Sloan Digital Sky Survey (SDSS; Yanny et al. 2000; Ivezić et al. 2012). This revealed a plethora of overdensities in the sky distribution of distant stars such as the Sagittarius streams. Other notorius examples are the Virgo Overdensity and Hercules-Aquila Cloud (VOD and HAC; Vivas et al. 2001; Newberg et al. 2002; Belokurov et al. 2007; Jurić et al. 2008; Bonaca et al. 2012; Conroy et al. 2018); and the more recently discovered Eridanus-Phoenix Overdensity (EriPhe; Li et al. 2016). These three structures are sparse, span several hundreds of deg2 and have similar galactocentric distances of kpc.
The photometrically identified overdensities unambiguously demonstrate that the outer halo of the Milky Way was built via mergers and accretion. For the inner halo, the evidence was less compelling until the advent of large samples of stars with 6D phase-space information, particularly from Gaia DR2 (Gaia Collaboration et al. 2018). This dataset revolutionised our view of the nearby halo, and revealed that this is dominated by debris from Gaia-Enceladus (a.k.a. the Sausage; hereafter G-E) (Helmi et al. 2018; Belokurov et al. 2018; Haywood et al. 2018; Mackereth et al. 2019; Myeong et al. 2019), and from the disk that was present at the time and was dynamically perturbed (Helmi et al. 2018; Gallart et al. 2019; Di Matteo et al. 2019, see also Haywood et al. 2018; Mackereth et al. 2019; Myeong et al. 2019; Grand et al. 2020; Belokurov et al. 2020).Besides these major contributors, smaller kinematic substructures have been identified, such as the Helmi streams (HStr hereafter; Helmi et al. 1999; Koppelman et al. 2019a), Thamnos (Koppelman et al. 2019b), Sequoia (Myeong et al. 2019) and several others (see e.g. Naidu et al. 2020).
It is natural to ask what the link is between the overdensities identified at large distances, and the substructures nearby. For example, Deason et al. (2018) has argued that the break in the counts of halo stars at kpc (Deason et al. 2013) corresponds to the piling up of stars from G-E at the apocentre of their orbits. Simion et al. (2018, 2019) have used the distances, line-of-sight velocities and proper motion information of stars associated to the VOD and HAC to argue that these are likely the distant counterparts of Gaia-Enceladus, because of their radially elongated orbits. Donlon et al. (2019, 2020); Naidu et al. (2021) suggest a similar association based on N-body simulations, although the merger time inferred by Donlon et al. (2020) does not match that estimated for G-E using nearby stars (Helmi et al. 2018; Chaplin et al. 2020). Also EriPhe (Li et al. 2016; Donlon et al. 2019, 2020), has been linked to those overdensities because of its similar heliocentric distance. Here we take a complementary approach, and integrate the orbits of halo stars in the solar vicinity associated to various kinematic groups to predict where other stars with a different orbital phase, but following similar orbits (as expected if they originate from the same progenitor), would be located. We also compare their proper motions and line-of-sight velocities where available to those predicted by the orbit integrations. As we show in this paper, although many of the stars in the overdensities can be linked to G-E, this is likely not the only contributor.
This paper is organised as follows. In Sec. 2 we define our local halo sample and a set of distant tracers compiled from literature. We also describe the framework which we use to integrate the orbits of nearby halo stars. In Sec. 3 we explore the overlap, in observable space, of the nearby halo substructures’ orbits with known stellar over-densities. Finally, in Sec. 4 we discuss and summarise our findings.
2 Data and Methods
2.1 Nearby halo sample, streams and orbit integration
We build a halo sample from the Gaia EDR3 6D subset (Gaia Collaboration et al. 2020), with a quality cut on parallax of , and with distances computed by inverting the parallaxes after applying a zero-point correction of as as recommended by Lindegren et al. (2020). To obtain Galactocentric velocities, we assume = (McMillan 2017), and a peculiar motion for the Sun of km/s (Schönrich et al. 2010). We also assume the Sun is located at = kpc from the Galactic centre, and = pc above the plane (Bennett & Bovy 2019). We identify as nearby halo-like stars those with distances 2.5 kpc, and that satisfy —- — 210 km/s. This selects 20010 stars.
For this halo sample, we compute their total energy , the angular momentum in the -direction , (which we set to be positive in the direction of Galactic rotation), and the circularity , where is the angular momentum of a circular orbit in the Galactic plane with energy (see Wetzel 2011). We assume the MWPotential from the dynamics package gala111http://gala.adrian.pw/ (Price-Whelan 2017). This Galactic potential has a spherical nucleus and bulge, a Miyamoto-Nagai disk (with parameters from Bovy 2015), and a spherical NFW dark matter halo, where the values of the parameters have been obtained by fitting to a compilation of mass measurements of the Milky Way, from 10 pc to kpc.
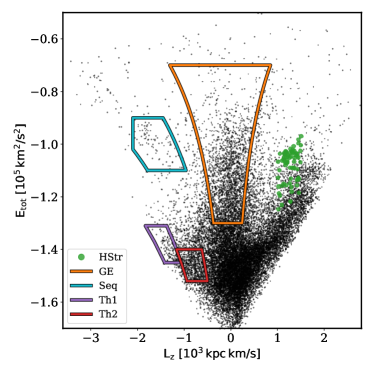
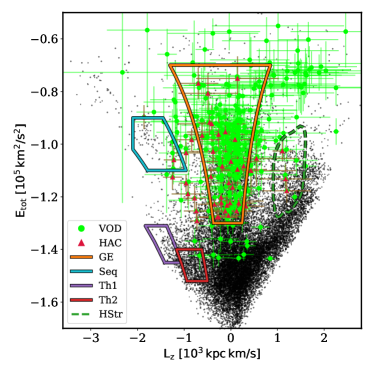
We use , and to isolate four substructures following the work of Koppelman et al. (2019b), namely Gaia-Enceladus, Sequoia, the Helmi streams and Thamnos. These authors split Thamnos into two groups, although for our analysis we will treat them as one. In the top panel of Figure 1 we show their distribution in – space, with the various substructures colour-coded. The selection criteria adopted for each of them are:
- G-E:
-
and ;
- Helmi streams:
-
(where ) and and ;
- Sequoia:
-
and and ;
- Thamnos 1:
-
and ,
- Thamnos 2:
-
and
where km2/s2, and kpc km/s.
We integrate the orbits of the stars in our sample backwards in time for 8 Gyr with a time sampling of 10 Myr in the same Galactic potential using a Dormand & Prince (1980) integrator. We refer to the time-sampled positions and velocities as orbital points. We expect in this way to pinpoint the location of other stars sharing the same progenitor as the substructures mentioned above, but having a different orbital phase.
2.2 Distant tracers and overdensities
We compile a set of distant tracers that have reliable distance estimates that go beyond the Gaia EDR3 6D sample. For the VOD we take the combined sample of Vivas et al. (2016) and Sesar et al. (2017) that contains distances and radial velocity measurements for RR Lyrae stars. We note that this sample also contains stars associated to the Sagittarius stream, which can be filtered out by selecting only stars with kpc.
For the HAC we use the sample from Simion et al. (2018) which comprises RR Lyrae derived distances plus radial velocities for 45 stars. This sample concentrates on a small portion of the reported extent of the HAC (see Grillmair & Carlin 2016).
Due to its recent discovery, the EriPhe overdensity (Li et al. 2016) has not had any extensive spectroscopic follow-up, implying that there are no radial velocity measurements. Here we define a list of possible members from the Dark Energy Survey (DES) Year 6 RR Lyrae catalogue (Stringer et al. 2020). We find 41 stars in the reported region and distance range for EriPhe (Li et al. 2016). The stars in the VOD and HAC samples were positionally cross-matched to Gaia EDR3 astrometry, while the EriPhe was cross-matched using the DES-provided Gaia DR2 source_id, which was transformed to Gaia EDR3 id via the dr2_neighbourhood table, where the closest angular distance neighbour was selected as the best-neighbour.
In the bottom panel of Figure 1 we show the - distribution of distant tracers associated with the stellar clouds discussed above. We assume a 10% uncertainty in distances for the RR Lyrae. The radial velocity uncertainties are provided by each catalogue and range from 5-20 km/s. We consider the correlation of uncertainties in and , while assuming the uncertainty in the on-sky position to be negligible. Although the total uncertainties are sizeable, we note from Fig. 1 that many of the stars, particularly those from the VOD appear to be associated to G-E (as previously reported by Simion et al. 2019, on the basis of their angular momenta).
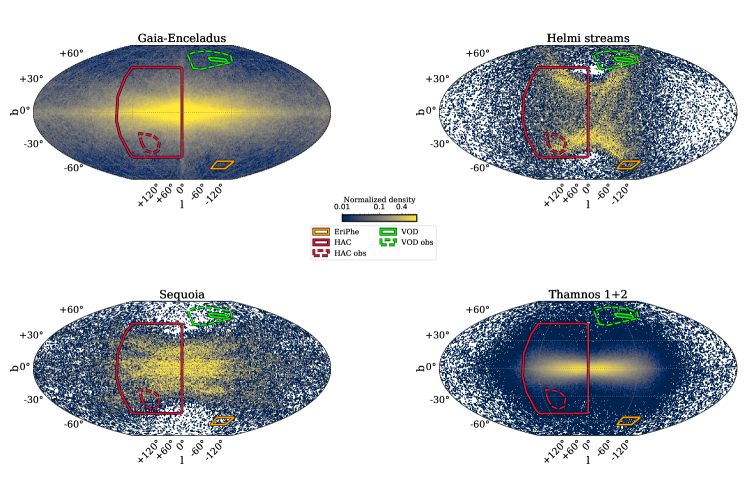
We compute the reported extent of the overdensities on the sky in Galactic coordinates using the galstreams package (Mateu et al. 2018), as shown in Figure 2 with solid lines. For each of samples described above, we also defined a region on the sky (in dashed) based on the convex hull of their observed members. We note that for the HAC the locus of spectroscopically confirmed members (in dashed) is smaller than the full extent of the cloud. The opposite is true for VOD due to the inclusion of the more recent samples from Vivas et al. (2016); Sesar et al. (2017).
3 Results
We now compare the spatial and kinematic characteristics of the orbits of the nearby halo substructures identified in - (Sec. 2.1) in the regions of the sky occupied by the more distant overdensities (Sec. 2.2). The hypothesis behind this comparison is that stars from a given progenitor have similar orbits, and that by selecting the stars near the Sun we sample objects with a specific orbital phase, i.e. those that happen to pass currently through the Solar volume. We thus expect other stars from that same progenitor to be located presently elsewhere in the Galaxy, along the similar orbital tracks but with different orbital phases.
In Figure 2 we show an all-sky HEALpix222http://healpix.sourceforge.net map of the density orbital points for the 4 nearby substructures mentioned in Sec. 2.1. The density is normalized for each panel separately and displayed in scale, and serves to indicate where we might expect to find contributions from the different substructures. The sky distributions for G-E and Sequoia cover a large range in latitudes () but reveal as well the presence of stars on low inclination orbits, which are presumably due to ”contaminants” (that follow a very different orbital family).
Fig. 2 shows that the position on the sky of the VOD, HAC, and EriPhe overdensities, coincide with regions with a high density of orbital points, from at least one of the halo substructures, which explains why the surveys have detected them in the first place. The occurrence of such stellar clouds is also related to the availability of high-quality homogeneous photometric data in low dust extinction regions. Given the lack of coverage in some regions, namely between -60 and 280 we would predict these to hold undiscovered debris. This region is also occupied by the Magellanic Clouds, which would make the detection of a sparse stellar cloud very difficult without extensive spectroscopic data. The “missing” stellar clouds would link the VOD – which is known to extend down to in the northern galactic cap (Bonaca et al. 2012; Conroy et al. 2018) – to EriPhe, in a similar way as HAC has been detected on both sides of the disk.
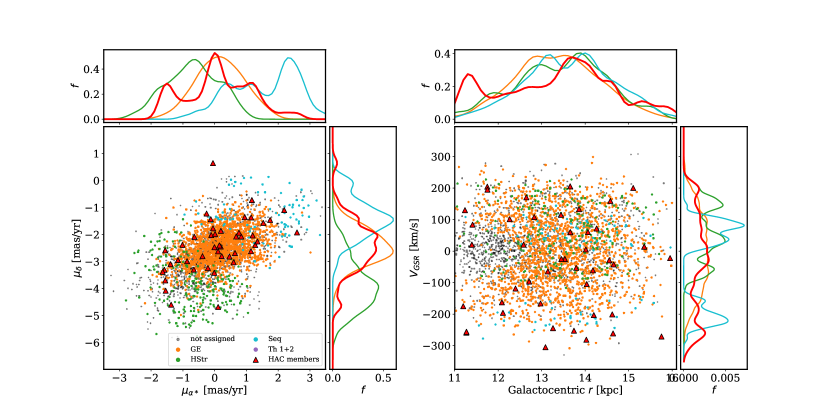
We now explore the distribution of orbital points in the spaces of proper motion (PM), Galactocentric distance (), and line-of-sight velocities corrected for the Galactic Standard of Rest frame (). Figure 3 shows the distribution of orbital points and observed members of the HAC in two of these spaces. In PM we observe that the HAC shows a distribution that peaks at the expected value for G-E, and also overlaps with the HStr. The Galactocentric distance range for Thamnos is not consistent with that of the HAC members, although note that the sample of Simion et al. (2018) was selected to have /kpc . Furthermore, although the orbital points from Sequoia match the tail of the distribution, these points do not match the PM measured for the HAC stars. The most negative radial velocities of stars in HAC appear to be related to G-E stars that have their orbital apocentre well-beyond the distance range selected by Simion et al. (2018).
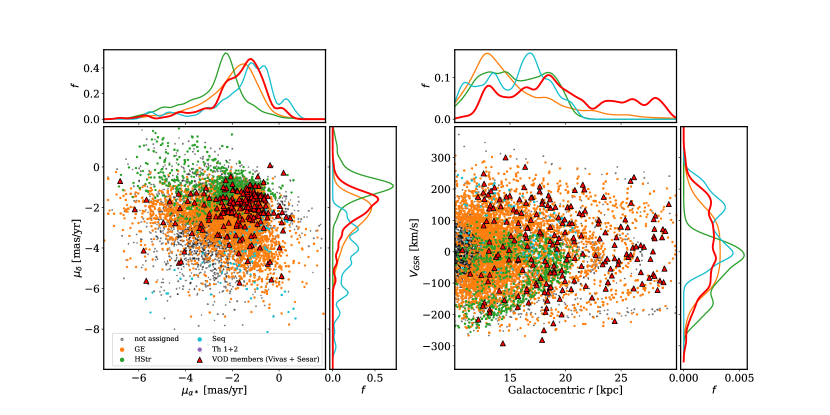
Figure 4 shows the same analysis as above but now for the VOD. We observe that its distribution in PM seems to be consistent with a combination of contributions, mostly from the HStr and G-E, and to some extent also Sequoia as there is one group of stars with mas/yr and positive , that matches also in distance. The stars that overlap with the HStr orbital points in PM, have distances and that confirm an association to this object. Nonetheless, the majority of the VOD stars follow most closely the distribution of the orbital points for G-E.
4 Discussion and Conclusions
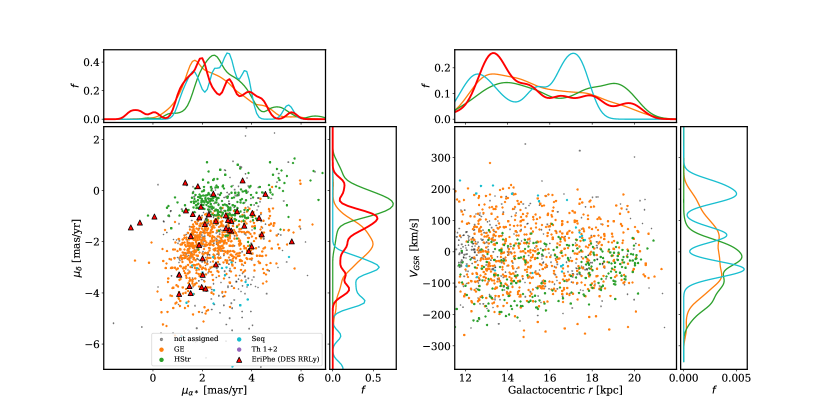
Finally, in Figure 5 we present the comparison for EriPhe. This stellar cloud has limited data, and its members were selected based solely on their distances. We observe however, that the distribution in PM seems to match quite well the predicted contributions of G-E and the HStr. While there is some overlap in PM with Sequoia’s orbital points, this is for less than a handful EriPhe stars (with mas/yr, at distances 16-17.5 kpc) and on average EriPhe members tend to have smaller compared to what is expected from Sequoia’s orbital points. Just like for the VOD, EriPhe does not seem to be linked to Thamnos.
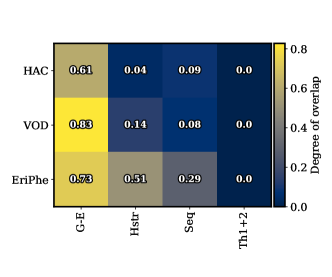
To better assess the association of clouds to halo substructures we devise a test to map the degree of overlap in velocity space of these objects. At the region of the sky occupied by a cloud, we compute a kernel density estimation for the orbital points in space, with the exception of EriPhe, where only proper motions are available. We determine volume in velocity-space where 95% of the orbital points lie. Finally, we count how many observed data points fall within this volume. In Figure 6 we show the degree of overlap for each cloud-substructure pair. We find the degree of overlap to be consistent with our qualitative analysis, indicating a stronger link between GE and all the clouds, while also hinting at a connection between VOD and EriPhe with the HStr.
On the basis of the very good match between the PM, distances and radial velocities of HAC members to orbital integrations of nearby members of G-E debris we argue that they likely stem from this progenitor. Some minor overlap is present with Hstr and Sequoia, however, only detailed chemical abundances could reveal the relative contributions of these accreted objects in the region of the Galaxy occupied by the HAC, and put constraints on their (internal) properties.
The link between the majority of the stars in the VOD and nearby G-E debris, is similarly also very clear. In particular, many of the VOD members appear to be associated with streams of stars wrapping around in their orbits, and encompassing debris coming from and going towards their orbital apocentres. Some, but not all, of the groups identified by Vivas et al. (2016) on the basis of distances and radial velocities seem to correspond to different wraps of debris (some others do not, because their measured proper motions are not consistent with clustering in phase-space). A small fraction of the stars in the VOD appears to be related to the Helmi streams. This is to some extent also apparent from the sky map of the orbit integrations of VOD member stars shown in Simion et al. (2019, their Fig. 6, central panel).
Finally, EriPhe could be a mixture of debris from the Helmi streams and G-E, as both again are expected to contribute in the region of the sky where this structure is located. The orbital points obtained from the integration of the trajectories of nearby stars from these objects jointly reproduce the proper motions measured for stars in EriPhe. To confirm this and distinguish more clearly to which progenitor they might belong, line-of-sight velocity information as well as chemical abundances would be very helpful. The contribution of Sequoia to both for EriPhe and the VOD appears to be marginal, while an association to Thamnos can be ruled out on the basis of very different distance distributions.
Our study confirms earlier suggestions that the 3 overdensities are related, and shows how in a standard Galactic potential (in our case, the MWPotential from provided by the gala package) it is possible to match qualitatively the orbital distributions of stars from nearby substructures to those of distant overdensities. This lends support to their true association; the next step is to combine the distant and nearby tracers to constrain the properties of the Galactic potential in detail, using methods such as made-to-measure (Hunt & Kawata 2014) or Schwarzschild’s orbital superposition (as in Magorrian 2019), the latter in essence being similar to the approach presented in this paper.
Our orbital integrations are allowing us to pinpoint the regions of the Galaxy most likely to be occupied by different halo substructures and can thus be used to direct spectroscopic follow-up efforts to most efficiently probe them. They also show that after 8 Gyr of integration and starting from the phase-space distribution of nearby stars, we expect a predominantly symmetric distribution of stars on the sky, both with respect to the Galactic plane as well as to the Galactic centre. For G-E debris the distribution on the sky is relatively smooth already after 2 Gyr of integration, implying that the debris is fully phase-mixed. In this context the asymmetries reported by Iorio & Belokurov (2019) if attributed to the merger of G-E, must be interpreted as being due to incompleteness in the sky distribution. N-body simulations that model this merger which have too short integration times (Donlon et al. 2020), or which do not include the growth of a massive (Galactic) disk that brings axial symmetry to the gravitational potential after the merger is completed (as in, e.g. Villalobos & Helmi 2008; Naidu et al. 2021), predict unevenness in the spatial distribution of the distant debris. This unevenness should be apparent in asymmetries in e.g. the distribution for nearby G-E stars, which are in fact, not seen in the data (see e.g. Koppelman et al. 2019b). On the other hand, such kinematic asymmetries are seen for the HStr (and manifest themselves in feebly uneven sky distributions, as shown in the top right panel of Fig. 2), and have been used to constrain this accretion event to have taken place 5-8 Gyr ago (Koppelman et al. 2019a).
The established associations are also useful for probing different regions inside the progenitor before this was disrupted (Koppelman et al. 2020; Naidu et al. 2021). Comparisons in terms of stellar populations, their ages and chemistry could for example constrain the presence of gradients in the parent systems, and in this way, determine the characteristics of the building blocks at the time of accretion.
Acknowledgements.
We thank the anonymous referee for a constructive and useful report. We acknowledge support from a Vici grant and a Spinoza prize from the Netherlands Organisation for Scientific Research (NWO). We are also grateful to Thijs Möllenkramer for first explorations that put this work on firmer grounds. We have made use of data from the European Space Agency (ESA) mission Gaia (https://www.cosmos.esa.int/gaia), processed by the Gaia Data Processing and Analysis Consortium (DPAC, https://www.cosmos.esa.int/web/gaia/dpac/consortium). Funding for the DPAC has been provided by national institutions, in particular the institutions participating in the Gaia Multilateral Agreement. The following software packages where used in this publication: Astropy (Astropy Collaboration et al. 2013, 2018), healpy (Górski et al. 2005; Zonca et al. 2019), IPython (Pérez & Granger 2007), matplotlib (Hunter 2007), numpy (Walt et al. 2011), scipy (Jones et al. 2001–), vaex (Breddels & Veljanoski 2018)References
- Astropy Collaboration et al. (2018) Astropy Collaboration, Price-Whelan, A. M., Sipőcz, B. M., et al. 2018, AJ, 156, 123
- Astropy Collaboration et al. (2013) Astropy Collaboration, Robitaille, T. P., Tollerud, E. J., et al. 2013, A&A, 558, A33
- Belokurov et al. (2018) Belokurov, V., Erkal, D., Evans, N. W., Koposov, S. E., & Deason, A. J. 2018, MNRAS, 478, 611
- Belokurov et al. (2007) Belokurov, V., Evans, N. W., Irwin, M. J., et al. 2007, ApJ, 658, 337
- Belokurov et al. (2020) Belokurov, V., Sanders, J. L., Fattahi, A., et al. 2020, MNRAS, 494, 3880
- Bennett & Bovy (2019) Bennett, M. & Bovy, J. 2019, MNRAS, 482, 1417
- Bonaca et al. (2012) Bonaca, A., Jurić, M., Ivezić, Ž., et al. 2012, AJ, 143, 105
- Bovy (2015) Bovy, J. 2015, ApJS, 216, 29
- Breddels & Veljanoski (2018) Breddels, M. A. & Veljanoski, J. 2018, A&A, 618, A13
- Chaplin et al. (2020) Chaplin, W. J., Serenelli, A. M., Miglio, A., et al. 2020, Nature Astronomy, 4, 382
- Conroy et al. (2018) Conroy, C., Bonaca, A., Naidu, R. P., et al. 2018, ApJ, 861, L16
- Deason et al. (2013) Deason, A. J., Belokurov, V., Evans, N. W., & Johnston, K. V. 2013, ApJ, 763, 113
- Deason et al. (2018) Deason, A. J., Belokurov, V., Koposov, S. E., & Lancaster, L. 2018, ApJ, 862, L1
- Di Matteo et al. (2019) Di Matteo, P., Haywood, M., Lehnert, M. D., et al. 2019, A&A, 632, A4
- Donlon et al. (2020) Donlon, Thomas, I., Newberg, H. J., Sanderson, R., & Widrow, L. M. 2020, ApJ, 902, 119
- Donlon et al. (2019) Donlon, Thomas, I., Newberg, H. J., Weiss, J., Amy, P., & Thompson, J. 2019, ApJ, 886, 76
- Dormand & Prince (1980) Dormand, J. R. & Prince, P. J. 1980, Journal of Computational and Applied Mathematics, 6, 19
- Gaia Collaboration et al. (2018) Gaia Collaboration, Brown, A. G. A., Vallenari, A., et al. 2018, A&A, 616, A1
- Gaia Collaboration et al. (2020) Gaia Collaboration, Brown, A. G. A., Vallenari, A., et al. 2020, arXiv e-prints, arXiv:2012.01533
- Gallart et al. (2019) Gallart, C., Bernard, E. J., Brook, C. B., et al. 2019, Nature Astronomy, 3, 932
- Górski et al. (2005) Górski, K. M., Hivon, E., Banday, A. J., et al. 2005, ApJ, 622, 759
- Grand et al. (2020) Grand, R. J. J., Kawata, D., Belokurov, V., et al. 2020, MNRAS, 497, 1603
- Grillmair & Carlin (2016) Grillmair, C. J. & Carlin, J. L. 2016, Stellar Streams and Clouds in the Galactic Halo, ed. H. J. Newberg & J. L. Carlin, Vol. 420, 87
- Haywood et al. (2018) Haywood, M., Di Matteo, P., Lehnert, M. D., et al. 2018, ApJ, 863, 113
- Helmi et al. (2018) Helmi, A., Babusiaux, C., Koppelman, H. H., et al. 2018, Nature, 563, 85
- Helmi et al. (1999) Helmi, A., White, S. D. M., de Zeeuw, P. T., & Zhao, H. 1999, Nature, 402, 53
- Hunt & Kawata (2014) Hunt, J. A. S. & Kawata, D. 2014, MNRAS, 443, 2112
- Hunter (2007) Hunter, J. D. 2007, Computing in Science and Engineering, 9, 90
- Iorio & Belokurov (2019) Iorio, G. & Belokurov, V. 2019, MNRAS, 482, 3868
- Ivezić et al. (2012) Ivezić, Ž., Beers, T. C., & Jurić, M. 2012, ARA&A, 50, 251
- Jones et al. (2001–) Jones, E., Oliphant, T., Peterson, P., et al. 2001–, SciPy: Open source scientific tools for Python
- Jurić et al. (2008) Jurić, M., Ivezić, Ž., Brooks, A., et al. 2008, ApJ, 673, 864
- Koppelman et al. (2020) Koppelman, H. H., Bos, R. O. Y., & Helmi, A. 2020, A&A, 642, L18
- Koppelman et al. (2019a) Koppelman, H. H., Helmi, A., Massari, D., Price-Whelan, A. M., & Starkenburg, T. K. 2019a, A&A, 631, L9
- Koppelman et al. (2019b) Koppelman, H. H., Helmi, A., Massari, D., Roelenga, S., & Bastian, U. 2019b, A&A, 625, A5
- Li et al. (2016) Li, T. S., Balbinot, E., Mondrik, N., et al. 2016, ApJ, 817, 135
- Lindegren et al. (2020) Lindegren, L., Klioner, S. A., Hernández, J., et al. 2020, arXiv e-prints, arXiv:2012.03380
- Mackereth et al. (2019) Mackereth, J. T., Schiavon, R. P., Pfeffer, J., et al. 2019, MNRAS, 482, 3426
- Magorrian (2019) Magorrian, J. 2019, MNRAS, 484, 1166
- Mateu et al. (2018) Mateu, C., Read, J. I., & Kawata, D. 2018, MNRAS, 474, 4112
- McMillan (2017) McMillan, P. J. 2017, MNRAS, 465, 76
- Myeong et al. (2019) Myeong, G. C., Vasiliev, E., Iorio, G., Evans, N. W., & Belokurov, V. 2019, MNRAS, 488, 1235
- Naidu et al. (2020) Naidu, R. P., Conroy, C., Bonaca, A., et al. 2020, ApJ, 901, 48
- Naidu et al. (2021) Naidu, R. P., Conroy, C., Bonaca, A., et al. 2021, arXiv e-prints, arXiv:2103.03251
- Newberg et al. (2002) Newberg, H. J., Yanny, B., Rockosi, C., et al. 2002, ApJ, 569, 245
- Pérez & Granger (2007) Pérez, F. & Granger, B. E. 2007, Computing in Science and Engineering, 9, 21
- Price-Whelan (2017) Price-Whelan, A. M. 2017, The Journal of Open Source Software, 2, 388
- Schönrich et al. (2010) Schönrich, R., Binney, J., & Dehnen, W. 2010, MNRAS, 403, 1829
- Sesar et al. (2017) Sesar, B., Hernitschek, N., Dierickx, M. I. P., Fardal, M. A., & Rix, H.-W. 2017, ApJ, 844, L4
- Simion et al. (2019) Simion, I. T., Belokurov, V., & Koposov, S. E. 2019, MNRAS, 482, 921
- Simion et al. (2018) Simion, I. T., Belokurov, V., Koposov, S. E., Sheffield, A., & Johnston, K. V. 2018, MNRAS, 476, 3913
- Stringer et al. (2020) Stringer, K. M., Drlica-Wagner, A., Macri, L., et al. 2020, arXiv e-prints, arXiv:2011.13930
- Villalobos & Helmi (2008) Villalobos, Á. & Helmi, A. 2008, MNRAS, 391, 1806
- Vivas et al. (2001) Vivas, A. K., Zinn, R., Andrews, P., et al. 2001, ApJ, 554, L33
- Vivas et al. (2016) Vivas, A. K., Zinn, R., Farmer, J., Duffau, S., & Ping, Y. 2016, ApJ, 831, 165
- Walt et al. (2011) Walt, S. v. d., Colbert, S. C., & Varoquaux, G. 2011, Computing in Science and Engg., 13, 22
- Wetzel (2011) Wetzel, A. R. 2011, MNRAS, 412, 49
- Yanny et al. (2000) Yanny, B., Newberg, H. J., Kent, S., et al. 2000, ApJ, 540, 825
- Zonca et al. (2019) Zonca, A., Singer, L., Lenz, D., et al. 2019, Journal of Open Source Software, 4, 1298