Critical pore radius and transport properties
of disordered hard- and overlapping-sphere models
Abstract
Transport properties of porous media are intimately linked to their pore-space microstructures. We quantify geometrical and topological descriptors of the pore space of certain disordered and ordered distributions of spheres, including pore-size functions and the critical pore radius . We focus on models of porous media derived from maximally random jammed sphere packings, overlapping spheres, equilibrium hard spheres, “quantizer” sphere packings, and crystalline sphere packings. For precise estimates of the percolation thresholds, we use a strict relation of the void percolation around sphere configurations to weighted bond percolation on the corresponding Voronoi networks. We use the Newman-Ziff algorithm to determine the percolation threshold using universal properties of the cluster size distribution. The critical pore radius is often used as the key characteristic length scale that determines the fluid permeability . A recent study [Torquato. Adv. Wat. Resour. 140,103565 (2020)] suggested for porous media with a well-connected pore space an alternative estimate of based on the second moment of the pore size , which is easier to determine than . Here, we compare to the second moment of the pore size , and indeed confirm that, for all porosities and all models considered, is to a good approximation proportional to . However, unlike , the permeability estimate based on does not predict the correct ranking of for our models. Thus, we confirm to be a promising candidate for convenient and reliable estimates of the fluid permeability for porous media with a well-connected pore space. Moreover, we compare the fluid permeability of our models with varying degrees of order, as measured by the order metric. We find that (effectively) hyperuniform models tend to have lower values of than their nonhyperuniform counterparts. Our findings could facilitate the design of porous media with desirable transport properties via targeted pore statistics.
I Introduction
The statistics that structurally or topologically characterize the pore space of disordered porous media are intimately linked to their effective transport properties, such as the effective electrical conductivity Torquato (2002), mean survival time Prager (1963); Torquato and Avellaneda (1991); Note (1), principal (largest) diffusion relaxation time Prager (1963); Torquato and Avellaneda (1991), and principal viscous relaxation time Avellaneda and Torquato (1991). For example, the first and second moments of the pore-size probability density function , and , respectively, bound and from above for diffusion-controlled reactions in which the interface of the porous medium is perfectly absorbing for a solute species diffusing in the pore space, where is the probability that a randomly chosen point in the pore space lies at a distance between and from the nearest point on the pore-solid interface Torquato (2002).
An especially important pore characteristic is the critical pore radius of a heterogeneous material, which is the maximal radius of an impenetrable test sphere so that the sphere can percolate through the void space. Interestingly, as detailed below, the critical pore radius is related not only to all of the aforementioned effective transport properties () of the porous medium but also to its fluid permeability.
The fluid permeability associated with slow viscous flow through an isotropic porous medium is defined by Darcy’s law, which can be rigorously derived using homogenization theory Rubinstein and Torquato (1989). The permeability has dimensions of the square of length and, roughly speaking, may be regarded as an effective pore channel area of the “dynamically connected part of the pore space” Torquato (2002). Avellaneda and Torquato Avellaneda and Torquato (1991) used the solutions of unsteady Stokes equations for the fluid velocity vector field to derive a general rigorous relation connecting the fluid permeability to the formation factor of the porous medium and a length scale that is determined by the eigenvalues of the Stokes operator:
| (1) |
where is a certain weighted sum over the viscous relaxation times (i.e., inversely proportional to the eigenvalues of the Stokes operator), and is the formation factor, where is the effective electrical conductivity of a porous medium with a conducting fluid of conductivity and a solid phase that is perfectly insulating. Roughly speaking, the formation factor quantifies the degree of “windiness” for electrical transport pathways across a macroscopic sample Torquato (2020). (Note that the length scale appearing in (1) absorbs a factor of 8 compared to the definition given in Ref. Avellaneda and Torquato (1991); specifically, .)
The prediction of the fluid permeability via theoretical methods is a notoriously difficult problem, largely because it is nontrivial to estimate the length scale in (1) for general porous media. Thus, the majority of previous analytical studies attempt to provide closed-form estimates of . For example, the length scale can be rigorously bounded from above by length scales associated with the mean survival time Torquato (1990), principal diffusion relaxation time Torquato and Avellaneda (1991), and principal viscous relaxation time Avellaneda and Torquato (1991). There is a panoply of approximation formulas for Scheidegger (1974); Katz and Thompson (1986); Johnson et al. (1986); Torquato (2002). An estimate due to Katz and Thompson Katz and Thompson (1986) approximates to be proportional to the capillary radius at breakthrough during mercury injection in the pore space, which is directly related to the critical pore radius Martys and Garboczi (1992). Empirical correlations between permeability and critical pore radius have also been found using the water expulsion method Nishiyama and Yokoyama (2017).
The critical pore radius is a complex structural characteristic that encodes both nontrivial geometrical and topological information. Motivated by rigorous bounds on the principle relaxation time and its link to the permeability, Torquato (2020) suggested the second moment of the pore size as an easily measurable approximation of for models where the pore space is well connected. The approximation was verified for BCC sphere packings Torquato (2020). Thus, is expected to be closely related to the critical pore radius, which we verify below.
Here, we study the critical pore radius and void percolation for disordered and ordered models of porous media derived from either overlapping or hard spheres (HS) with a constant radius . Such configurations of overlapping or hard spheres are effective models of a broad range of heterogeneous materials and many-particle systems Finney (1977); Zallen (1998); Chaikin and Lubensky (2000); Manoharan et al. (2003); Hansen and McDonald (2013); Torquato (2002). Our models exhibit a varying degree of long- and short-range order, from completely random overlapping spheres to the crystalline densest packing of hard spheres.
Importantly, we determine the critical pore radius of maximally random jammed (MRJ) packings of identical spheres Torquato et al. (2000), which are, intuitively speaking, the maximally disordered among all mechanically stable packings. More precisely, MRJ sphere packings minimize among jammed packings an order metric Torquato et al. (2000); Torquato and Stillinger (2010); O’Hern et al. (2002); Karayiannis and Laso (2008); Xu and Rice (2011); Ozawa et al. (2012); Baranau et al. (2013); Tian et al. (2015). Previously studied structural characteristics of MRJ sphere packings include their two-point statistics, average contact numbers, fractions of rattlers, Voronoi cell statistics and correlation functions, pore-size distributions, etc. Torquato and Stillinger (2010); Jiao et al. (2011); Atkinson et al. (2013); Klatt and Torquato (2014, 2016). Bounds on transport properties of MRJ packings have been recently characterized in Ref. Klatt and Torquato (2018). Ziff and Torquato (2017) determined the site and bond percolation threshold of MRJ sphere packings.
We compare the critical pore radius of the MRJ sphere packings to three crystalline sphere packings and to three models with disordered microstructures. The first model is that of overlapping spheres that are completely random and independent (also known as the Swiss-cheese model) Torquato (2002), and the second model is that of equilibrium hard spheres Hansen and McDonald (2013). For the third model, we assign overlapping spheres to the points of amorphous inherent structures of the quantizer energy Klatt et al. (2019), where the quantizer energy is proportional to the first moment of the void exclusion probability (which is the probability that a randomly placed spherical cavity of radius contains no points) Torquato (2010). Hence, the quantizer energy is also related to the pore-size distribution Klatt and Torquato (2018). We therefore suggest it as an interesting model for studying transport properties. For both the overlapping spheres (or Swiss-cheese model) and the quantizer model, we consider two different diameters of the spheres: (i) the average nearest-neighbor distance and (ii) diameters that result in the same porosity as MRJ sphere packings.
We quantify the degree of short-, intermediate-, and long-range order in our four systems using the order metric Torquato et al. (2015). It measures how the two-point statistics deviate from those of the Poisson point process:
| (2) | ||||
where is the pair-correlation function and the structure factor Hansen and McDonald (2013); Torquato (2002). The systems are compared at unit number density (with a cut-off value for the integration in Fourier space).
Here, we estimate the void percolation threshold using Kerstein’s method Kerstein (1983), as described in Sec. II, and the Newman-Ziff algorithm Newman and Ziff (2001). The latter is based on the second moment of the cluster sizes and allows for a convenient finite-size scaling.
As mentioned above, Torquato Torquato (2020) recently suggested suggested for porous media with a well-connected pore space to use the second moment of the pore size, , as a convenient estimate of , which in turn allows an estimation of the fluid permeability . Here, we compare the critical pore radius to and confirm that to a good approximation . In fact, we find that an estimation of based on is superior to an estimate based on in that only the former provides the correct ranking of for our models.
We also compare the fluid permeability of models with different large-scale density fluctuations, i.e., nonhyperuniform and hyperuniform models. A hyperuniform porous medium is defined by an anomalous suppression of long-wavelength volume-fraction fluctuations compared to those of typical disordered media Torquato and Stillinger (2003); Torquato (2018); Zachary and Torquato (2009). In agreement with the analysis of Torquato (2020), we find that the estimates of fluid permeabilities for our hyperuniform models tend to be smaller than those of their nonhyperuniform counterparts.
In the following, we first define our models, construction of Voronoi networks, and clustering analysis in Sec. II. Then, we present our results on the critical pore radius, the pore statistics, and estimates of the fluid permeability in Sec. III. In Sec. IV, we give concluding remarks and an outlook to future research.
II Models and structure characterization
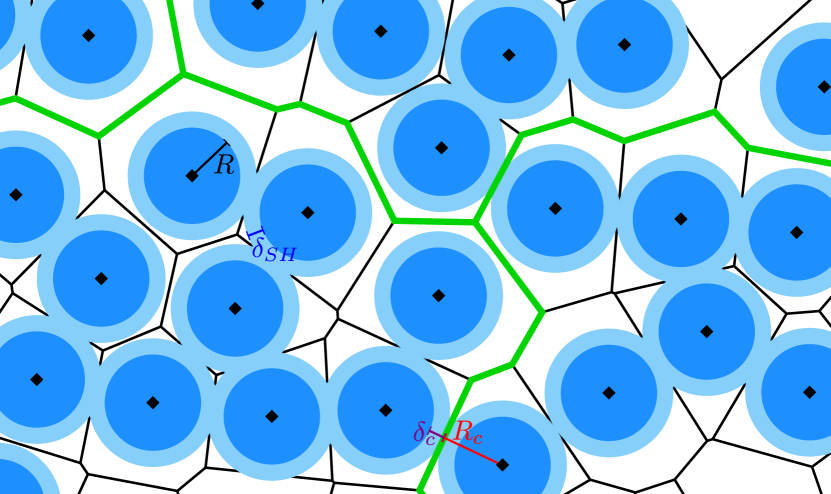
We use periodic boundary conditions for all of our samples, the construction of the Voronoi network, and the percolation analysis. Figure 1 schematically shows how the pore space is related to the Voronoi network.
Models.
The first model is that of overlapping spheres that are randomly and uniformly distributed in the simulation box without interaction. Hence, the sphere centers are a snapshot of the ideal gas in the canonical ensemble, i.e., the number of points per sample is fixed. Mathematically speaking, the points follow a binomial point process. The order metric for this model is 0, by definition.
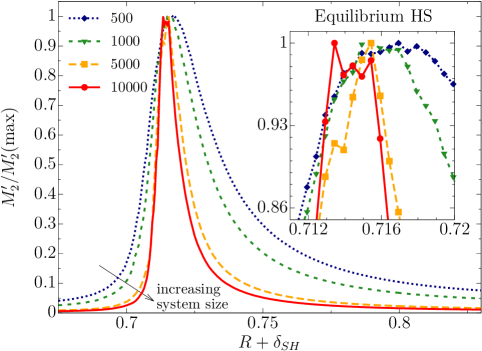
The second model that we study is an equilibrium fluid of hard spheres. The equal-sized spheres are impenetrable but do not interact otherwise. Each sample has a packing fraction of 45%. The order metric is 9.45(1).
Determining the critical pore radius of equilibrium hard spheres is closely related to the so-called cherry-pit model Torquato (2002), where each hard sphere of radius is surrounded by a penetrable spherical shell of thickness . The thickness at which the void space (outside the penetrable spheres) stops percolating is the critical pore radius . It is, therefore, strictly related to the void percolation threshold . The same principle applies to any other monodisperse sphere configuration; see Fig. 1 for a two-dimensional schematic.
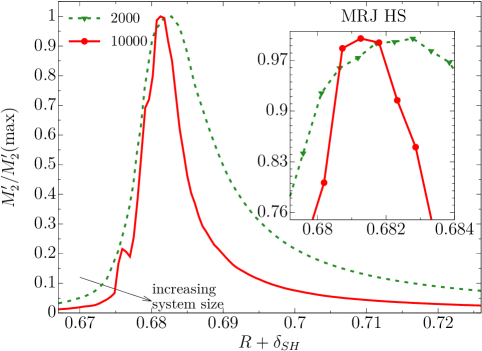
The third model is that of maximally random jammed (MRJ) packings of hard spheres. Here, we analyze packings generated by Atkinson et al. (2013). The average packing fraction is 63.6%. The order metric is 23.7(1) Klatt et al. (2019).
The fourth model is based on amorphous inherent structures of the quantizer energy Klatt et al. (2019). This energy functional is defined for Voronoi tessellations of arbitrary point configurations Liu et al. (2009); Du et al. (2010); Torquato (2010); Zhang et al. (2012); Ruscher et al. (2015, 2018); Klatt et al. (2019); Ruscher et al. (2020); Hain et al. (2020), and it is proportional to a sum of the second moments of inertia of all Voronoi cells (each computed with respect to the corresponding Voronoi center). The quantizer energy can be interpreted as a many-body interaction with a certain soft-core repulsion Torquato (2010). It has been studied both as a ground-state problem Torquato (2010) and at finite temperature Ruscher et al. (2015, 2018, 2020); Hain et al. (2020).
More precisely, the quantizer energy can be defined as the first moment of the void exclusion probability of the point configuration. For a point pattern at unit number density, the rescaled quantizer energy (or error) is given by Torquato (2010):
| (3) |
where is the dimension (here ). For monodisperse sphere packings with radius , the complementary cumulative distribution function of the pore size is trivially related to the exclusion probability via for , where is the volume fraction of the pore space (and is the volume fraction of the spheres) Torquato (2002). Hence, the quantizer energy is closely related to the second moment of the pore size ; in fact, for point particles with : ; and for nonoverlapping spheres, the following relation can be straightforwardly derived by using Eq. (5.68) in Torquato (2002):
| (4) |
Optimizing the quantizer energy for the centers of a sphere packing is, therefore, closely related to an optimization of its pore statistics.
To construct our samples of amorphous inherent structures, we start from a binomial point process and locally minimize the quantizer energy using the Lloyd algorithm Klatt et al. (2019). In each step of the algorithm and for each cell, the Voronoi center is replaced by the center of mass of the cell Lloyd (1982). We apply 10,000 steps, after which the algorithm converges to an amorphous inherent structure with a strong suppression of density fluctuations Klatt et al. (2019). The final states are (effectively) centroidal Voronoi tessellations, where in each cell the Voronoi center coincides with the center of mass. The quantizer energy of the disordered inherent structures () is only slightly larger than that of the (conjectured) crystalline ground-state, the body-centered cubic (BCC) lattice () Klatt et al. (2019). The order metric of the amorphous inherent structures of the quantizer energy is 31.6(2) Klatt et al. (2019), i.e., larger than the value for MRJ sphere packings by about a factor of .
The corresponding ground-state problem, known as the “quantizer problem,” is also related to another tessellation optimization problem, known as the “covering problem” Torquato (2010). The latter problem is the search for a point configuration that minimizes the radius of overlapping circumscribed spheres to cover the space. This covering radius is always an upper bound on the critical radius . Since MRJ sphere packings are saturated, they have a finite covering radius, like a crystal. A finite covering radius implies that the exclusion probability has compact support, specifically, for . As for the quantizer problem, the BCC lattice is believed to be the optimum of the covering problem. Both the quantizer and covering problems have relevance in numerous applications, from wireless communication and network layouts, to data compression and cryptography; see Torquato (2010) and references therein.
We compare the pore statistics and transport properties of our four disordered models to those of three perfectly ordered crystalline structures. Specifically, we here consider dense lattice packings of spheres with simple cubic (SC), body-centered cubic (BCC), and face-centered cubic (FCC) symmetries.
Simulation details.
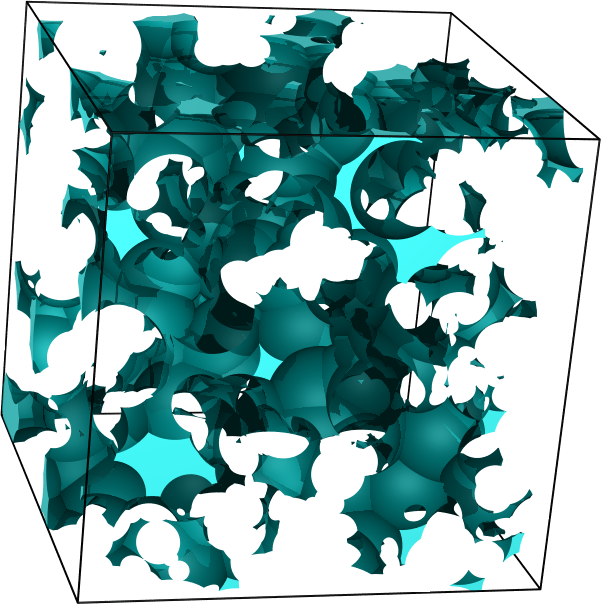
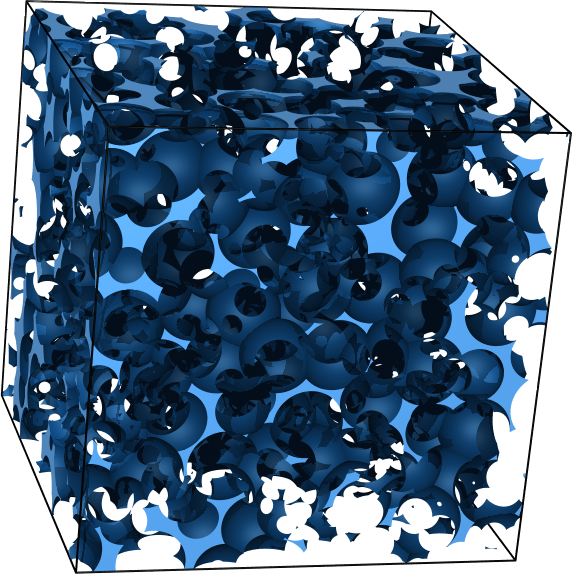
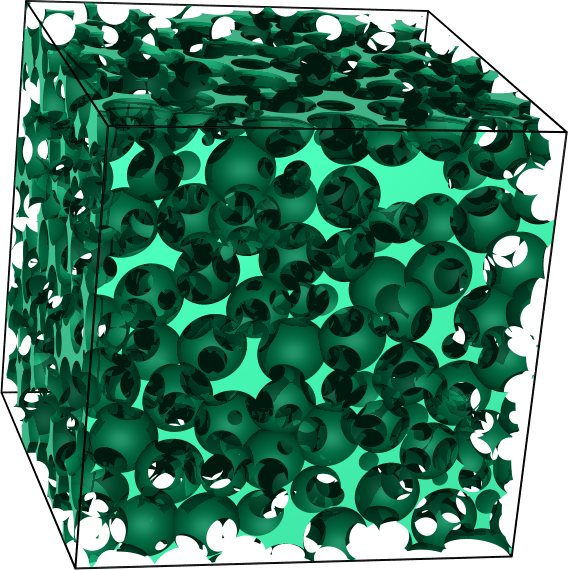
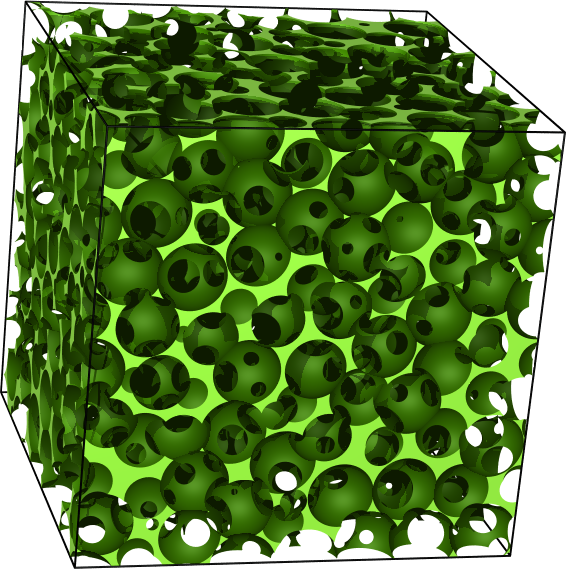
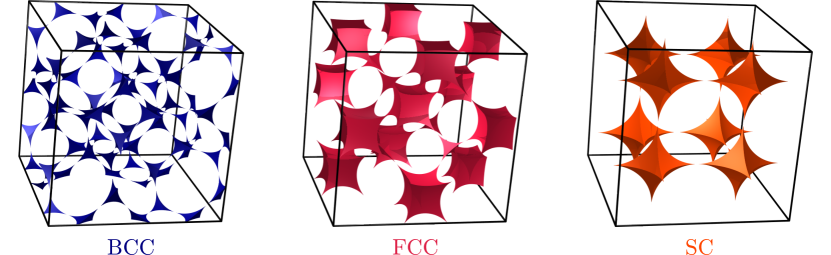
The MRJ samples are simulated in unit cells with a nonorthogonal basis. All other samples are simulated in cubic unit cells. Table 1 lists the number of samples and the number of points per sample. The total number of points in our samples is more than . The number density is the average number of points per unit volume. We choose the unit of the length such that for all of our models. For the overlapping and equilibrium hard spheres and for the quantizer sphere configurations, the number density is fixed for each sample. For the MRJ spheres packings, the radius of the spheres is fixed, but the number density slightly fluctuates around unity. Figures 2–6 show for each of our models a sample of the void space.
| Overlapping spheres | Equilibrium HS | ||||||||||
|---|---|---|---|---|---|---|---|---|---|---|---|
| points | points | ||||||||||
| points | points | ||||||||||
| points | points | ||||||||||
| points | points | ||||||||||
| MRJ HS | Quantizer spheres | ||||||||||
| points | |||||||||||
| points | points | ||||||||||
| points | |||||||||||
| points | points | ||||||||||
Voronoi network.
For monodisperse sphere configurations, the void percolation can be accurately studied by reformulating it as a “weighted bond percolation” on the Voronoi network, as discussed by Kerstein Kerstein (1983); see Fig. 1. The topology of the void space is related to that of the Voronoi network, i.e., the network formed by the edges of the Voronoi diagram. Each channel in the void space corresponds to a bond in the Voronoi network. The channel vanishes when is larger or equal to the distance of the bond to its Voronoi neighbors. Kerstein’s method Kerstein (1983) has been previously used to study void percolation for overlapping spheres Elam et al. (1984); Rintoul (2000); Höfling et al. (2008); Priour and McGuigan (2018) and hard-sphere packings (both jammed and in equilibrium) Spanner et al. (2016), including models for protein structures Treado et al. (2019).
Following this idea by Kerstein (1983), we construct for each sample the Voronoi diagrams using voro++ Rycroft et al. (2006); Rycroft (2009). By identifying vertices within an accuracy of about , we determine the Voronoi network (of cell edges) and assign to each edge the smallest distance to its neighboring Voronoi centers. The void percolation problem is thus equivalent to a weighted bond percolation problem on the Voronoi network.
Newman-Ziff method.
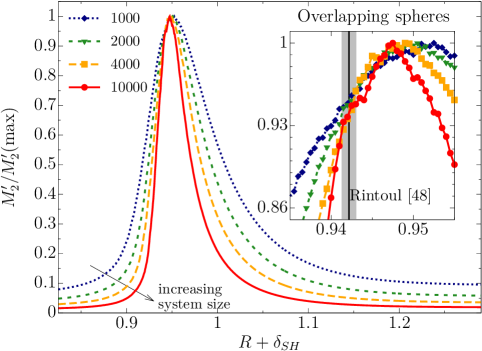
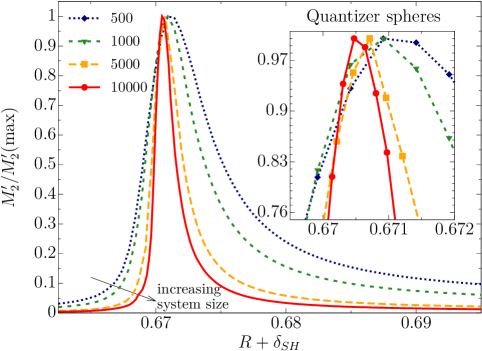
Our goal was to find the critical percolation threshold of the void system. Along each bond in the Voronoi network, we assigned a weight equal to the distance of the bond to the neighboring Voronoi centers (which is directly related to the radius of a sphere that can just pass through that pore throat), and the goal is to find the critical radius of a sphere where the system percolates. Various criteria can be used to determine the percolation point. A common one has been the point where a single cluster of connected vertices spans from one side of the system to the other, or for a periodic system, where it wraps around. However, various other criteria can be used, including Binder-type ratios Wang et al. (2013) involving moments of the size of the largest cluster. The goal in these is to find something universal so that its value is independent of the size of the system under finite-size scaling (although the corrections to scaling will cause a size dependence visible for smaller systems.) Here we use another universal quantity: the second moment of the size distribution leaving out the largest cluster, , divided by its value at the maximum of the curve . The idea behind this is that is a peaked function whose peak is near the percolation threshold but not exactly at . Finite-size scaling theory implies that becomes a function of in the scaling limits and . If we divide the value at by the value at the maximum, for example, then we get a ratio, which is universal (the same for all systems of the same dimensionality and shape). Thus, if we consider plots of , the crossing of the curves will indicate the critical point. For very precise determinations of the critical point, one would also have to worry about the corrections-to-scaling contribution, but to the precision available for the systems here, this is not necessary.
In the Newman-Ziff algorithm, bonds are added one at a time, and the union-find computer science algorithm is used to keep track of the evolving cluster size distribution in a very efficient manner, including the moments such as . This is, in fact, much easier than determining crossing or wrapping, which requires extra components in the data structure. Before carrying out the algorithm, we sort all the bonds from large to small weights and then add the bonds one at a time (largest weights first). Thus, for a given sample of a lattice, we could only carry out one test of the percolation threshold, unlike in typical lattices where we could create many measurements by occupying the bonds in random order. Here the order of the bonds is fixed by their weight. The algorithm works in a “microcanonical” space where averaged quantities are determined as a function of the number of bonds made occupied. Usually, one carries out a convolution of the microcanonical measurements with a binomial distribution to get the “canonical” behavior that gives results as a function of . Here we do not do that, because for one thing there is no random bond occupation probability here, and, secondly, the difference between the two is slight and would not be observable with the precision of the results that we are able to get here. Since can strongly fluctuate between samples, we first bin, for each model and system size separately, all weights that we find (using a constant bin width). Then, we average the corresponding values of within each bin.
The crossing point of is used to find the threshold. Its value should be universal and the same for all systems of the same shape and boundary conditions. We verified this by considering bond percolation on the simple cubic lattice, and confirm the threshold of with a crossing point of , consistent with the values found here (about 0.94–0.96) for these quite different systems.
Pore size.
The pore size can be easily estimated from both simulated data and three-dimensional images of real porous media Coker et al. (1996). Here, we determine the mean pore size and the second moment of the pore size using a straightforward Monte Carlo sampling. Points are placed randomly and uniformly distributed in the pore space surrounding the spheres. For each point, we determine the smallest distance to a sphere and estimate the first and second moment of using the arithmetic mean. We estimate the statistical error using the standard error of the mean. The number of Monte Carlo points per sample is , where for each model we analyze each sample of the two largest system sizes. For overlapping spheres, the pore-size distribution is known analytically. We also determine the pore sizes for lattice packings of spheres, where we use sampling points for each lattice. For the tabulated values of and of the dense hard-sphere lattice packings, we use the values from Eqs. (B24)–(B39) in Ref. Klatt and Torquato (2018), which were obtained by numerical integration of exact formulas Note (3). For the SC and BCC sphere packings, we also confirm these values by numerical integration of the exact formulas for from Eqs. (84) and (87) in Ref. Torquato (2010). An exact formula of also allows for precise values of the critical void porosity of the void space surrounding the soft shells at the critical radius.
| Model | ||||||
|---|---|---|---|---|---|---|
| Overlapping spheres | 0.9148… | 0.943(3) | 0.0298(10) | 0.666(3) | 1.274… | |
| 0.3640… | 0.943(3) | 0.0298(10) | 0.320(3) | 3.321… | ||
| Equilibrium HS | 0.550 | 0.714(2) | 0.0257(12) | 0.239(2) | 1.5562(5) | |
| SC HS | 0.4764… | 0.707… | 0.0349… | 0.207… | 1.388… | |
| Quantizer spheres | 0.430 | 0.670(1) | 0.0179(8) | 0.156(1) | 6.793(2) | |
| 0.364 | 0.670(1) | 0.0179(8) | 0.136(1) | 5.269(2) | ||
| MRJ HS | 0.364 | 0.681(2) | 0.0303(16) | 0.148(2) | 7.177(2) | |
| BCC HS | 0.3198… | 0.668… | 0.0055… | 0.122… | 3.718… | |
| FCC HS | 0.2595… | 0.648… | 0.0358(6) | 0.086… | 3.592… | |
III Results
Figures 2–5 show for our four models of disordered sphere configurations the curves of the rescaled cluster index as a function of the sphere radii . The insets zoom into the region where the curves of different system sizes intersect, i.e., at the percolation threshold in the infinite-system size limit (where is the critical value of ). Each figure also shows a sample of the void space for radii below the percolation threshold (about 90% of ).
Table 2 lists our estimates of the critical radius , critical void porosity , and critical pore radius . The table compares the values for the disordered sphere configurations to those of the crystalline sphere configurations. Our results for and of the overlapping sphere model and equilibrium hard spheres agree within statistical errors with previous results Elam et al. (1984); Rintoul (2000); Höfling et al. (2008); Spanner et al. (2016); Priour and McGuigan (2018); Note (2). In particular, for the overlapping spheres and agree with the estimates and by Rintoul (2000), and by Höfling et al. (2008), and and by Priour and McGuigan (2018). Moreover, our estimate for the equilibrium hard spheres agrees with the estimate of that we obtain from Fig. S1 in Spanner et al. (2016).
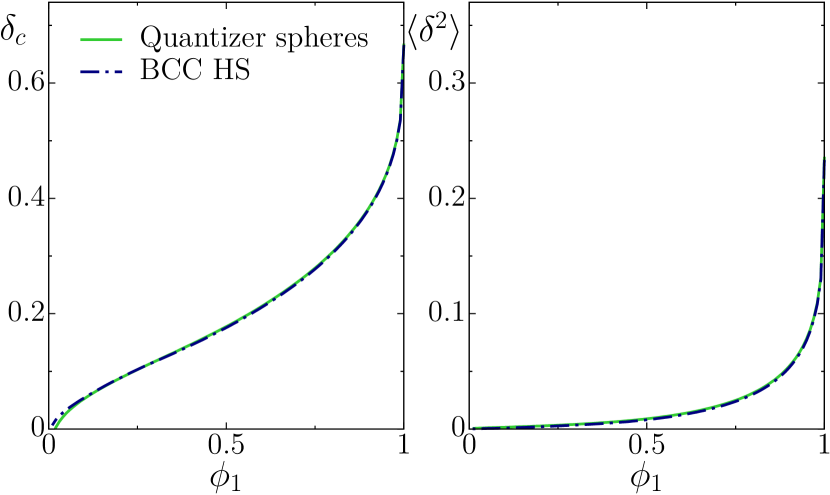
For our disordered sphere models, we find that the percolation threshold decreases with increasing order, as measured by the order metric. Moreover, while the amorphous hard-sphere packings have a distinctly larger value of than the optimal FCC packing, the amorphous quantizer states have about the same as the (conjectured) optimal quantizer, a BCC lattice. The values agree within 0.3%. For the corresponding dispersions of spheres, we find for all radii considered here that the second moment of the pore size, agrees within 0.2% (even if the spheres overlap); see Fig. 7.
Among the disordered models, the critical porosity is lowest for the quantizer spheres []. For the lattices, the lowest value is attained by the BCC lattice (). In contrast, the critical porosity of the FCC lattice [] is even larger than that of overlapping spheres []. The large difference between for BCC and FCC lattices is related to the shape of the holes between the overlapping soft sphere shells. For the BCC lattice, there are only small, so-called ‘tetrahedral’ holes, but for the FCC lattice, there is an additional, relatively large type of hole, called ‘octahedral.’ These octahedral holes are formed by six neighboring spheres, whose centers form a regular octahedron; the interstice between the spheres has a shape that resembles a cube (which is the dual polyhedron of an octahedron); see Fig. 6.
Next, we compare the critical pore radius to the pore-size statistics. We have found the following mean pore sizes (compared at unit number density): for overlapping spheres, at and at ; for equilibrium hard spheres, ; for SC HS, ; for quantizer spheres, at and at ; for MRJ HS, ; for BCC HS, ; and for FCC HS, . Table 2 lists the second moments of the pore sizes for our models.
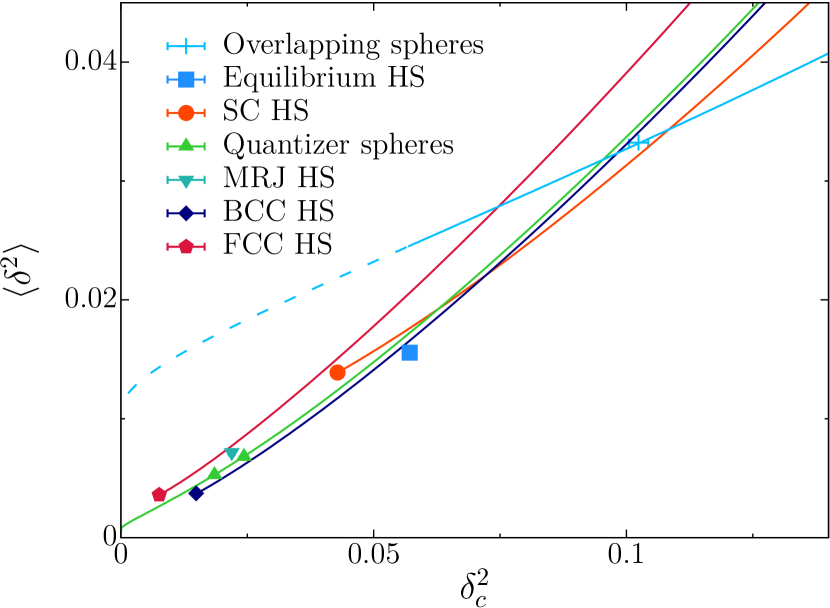
Following the suggestion by Torquato (2020), Fig. 8 compares the square of the critical pore radius to the second moments of the pore size. To compare the models for a broad range of porosities, we here vary the sphere radii for each model (from to ). In agreement with the suggestion, we find that is, to a good approximation, proportional to over our entire range of models and porosities. However, and lead to different predictions of the rankings of the fluid permeability for dispersions of spheres at a given volume fraction, as discussed below.
The approximation of by was suggested by Torquato (2020) for models in which the pore space is well connected. We, therefore, distinguish between overlapping sphere configurations above (solid line) and below (dashed line) a porosity of 0.23. The approximation is most accurate for overlapping spheres if the porosity is similar to that of MRJ spheres.
For an estimate of the fluid permeability , we additionally need to approximate the formation factor . Torquato (1985) derived a tight lower bound on for any three-dimensional porous medium that accounts for up to four-point information. For both ordered and disordered dispersions of particles, the four-point parameter vanishes to a very good approximation, which yields the following approximation for the formation factor:
| (5) |
Here is a three-point microstructural parameter, which is a weighted integral involving the one-, two-, and three-point correlation functions , , and . The high predictive power of Eq. (5) has already been validated by excellent agreement with computer simulations of for a variety of ordered and disordered dispersions of spheres in a matrix Torquato (1985); Kim and Torquato (1991); Robinson and Friedman (2005); Gillman and Matouš (2014); Gillman et al. (2015); Nguyen et al. (2016). When , Eq. (5) reduces to the well-known two-point Hashin-Shtrikman lower bound on (which is optimal for given one- and two-point correlation functions and ) Hashin and Shtrikman (1963); Torquato (2002).
Here we use for our lattice sphere packings the tabulated values of up to the maximal packing fractions from Table 20.1 (on p. 523) in Torquato (2002), which is based on data from McPhedran and Milton (1981). We interpolate the values of using fourth-order polynomials. For overlapping and equilibrium hard spheres, we use the tabulated values of from Table 22.1 (on p. 598) in Torquato (2002), which is based on data from Torquato et al. (1985) and Miller and Torquato (1990), respectively. In these two cases of disordered spheres, an interpolation with third-order polynomials was sufficient. We use the polynomial fit to the equilibrium hard-sphere data also for an extrapolation to , i.e., to estimate for the MRJ sphere packings. Since no data for is yet available for our quantizer packings, we use the Hashin-Shtrikman lower bound in this case.
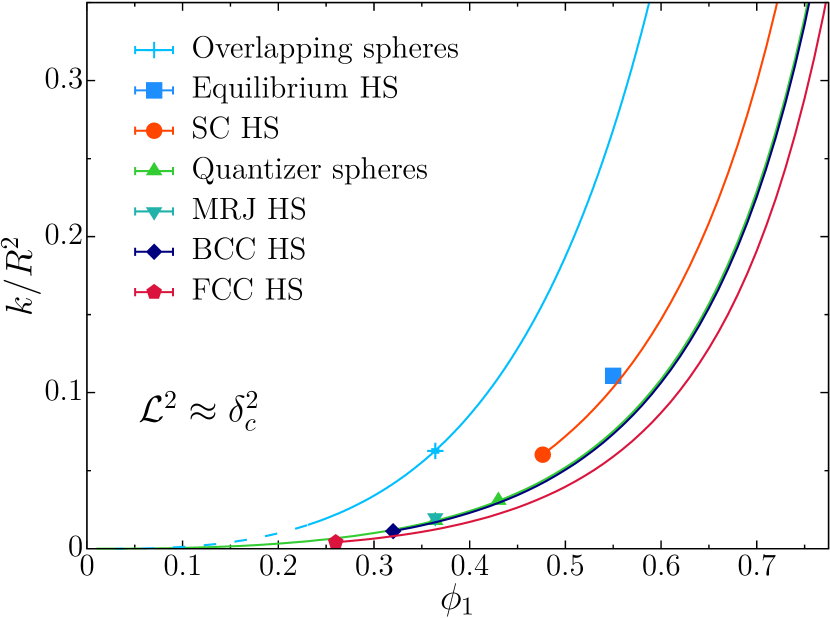
Figure 9 shows the resulting estimate of the fluid permeability using the approximation by Katz and Thompson Katz and Thompson (1986), where we choose the empirical proportionality constant between and to be unity, i.e., . The estimate of is highest for the uncorrelated overlapping spheres (among our models and range of porosities); in particular, is higher for the overlapping spheres than for the hard-sphere models (both ordered and disordered), which is consistent with the theoretical predictions from Ref. Torquato (2020).
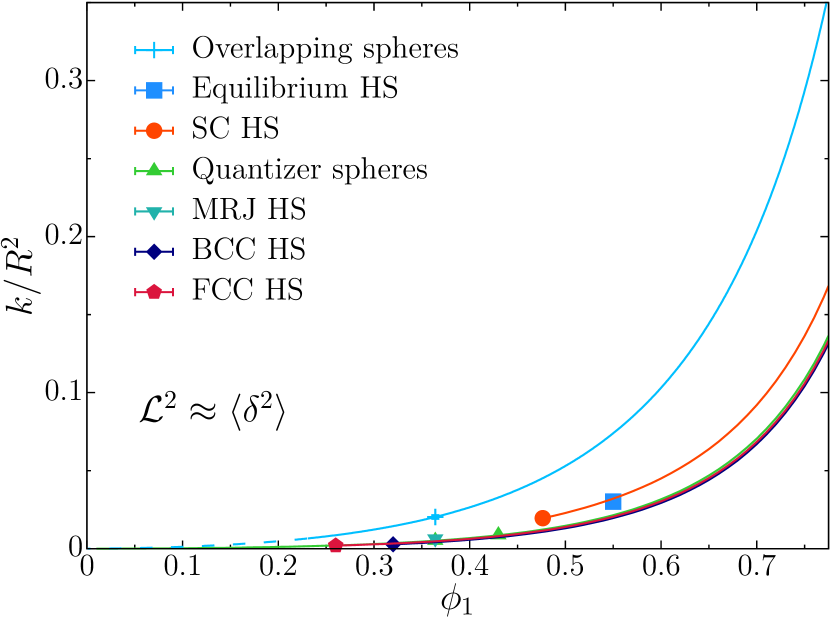
Notably, the approximation by in Fig. 9 provides an inaccurate ranking of the fluid permeability of BCC and FCC sphere packings compared to theoretical calculations of the fluid permeability Sangani and Acrivos (1982). This inaccuracy is due to the approximation of by rather than the approximation of , since we obtain the same ranking using the Hashin-Shtrikman and three-point approximations. In contrast, the approximation results in the correct ranking of the fluid permeability for FCC and BCC sphere packings, as shown in Fig. 10. Moreover, except for the quantizer model that was not studied in Ref. Torquato (2020), it was shown that the approximation provides the correct ranking for all other models shown in Figs. 9 and 10. Thus, it is reasonable to expect that this approximation would properly rank the quantizer model.
IV Conclusion and outlook
We have determined the percolation threshold for void percolation around sphere configurations for models of both hard and overlapping spheres. Our examples include the MRJ packings of spheres, equilibrium fluids of hard spheres, overlapping spheres, and inherent structures of the quantizer energy, as well as ordered lattice packings of hard spheres.
To accurately determine the critical pore radius for our models, we use the strict relation to a weighted bond percolation on the Voronoi network. Moreover, we employ the Newman-Ziff algorithm and carefully take finite-system size effects into account. We compare our results in Table 2 to the second moment of the pore size .
We find in Fig. 8 a remarkably good correlation between and across our broad spectrum of highly ordered and disordered sphere configurations, confirming the suggestion by Torquato (2020). Since can be easily measured from two- or three-dimensional digitized images of heterogeneous materials, this recent approximation of by allows for a simple yet reliable prediction of the permeability . In fact, we find that, in contrast to the critical pore size , the second moment of the pore size, , predicts the correct ranking of for our models.
Moreover, we observe that the hyperuniform and effectively hyperuniform models, like the most hyperuniform BCC sphere packing or the disordered MRJ and quantizer packings, tend to have smaller estimates of than the nonhyperuniform overlapping or equilibrium hard spheres. This again agrees with theoretical arguments from Torquato (2020) that can be expected to be lower in hyperuniform than in nonhyperuniform porous media because the latter exhibit a greater variability in the sizes and geometries of the pore channels. Hence, the velocity fields will be generally more uniform throughout the pore space for hyperuniform two-phase media compared to their nonhyperuniform counterparts. This is also consistent with the fact that the BCC sphere packings have the lowest fluid permeabilities, since the BCC lattice is the structure with the lowest value of the hyperuniformity order metric, implying that it suppresses large-scale density fluctuations to the greatest degree Torquato and Stillinger (2003); Torquato (2018). It is interesting to point out that the BCC lattice is also the optimum of the covering and quantizer problems Torquato (2010). Our results provide additional confirmation for the analysis presented in Torquato (2020) for the aforementioned link between these optimization problems, the pore statistics, and fluid permeability.
Since the empirical Katz-Thomson formula has already been applied to a broad variety of microstructures Katz and Thompson (1986); Martys and Garboczi (1992); Nishiyama and Yokoyama (2017), a possible direction for future research is to test the approximation of by for polydisperse sphere configurations and more complex particle shapes, that is, for more general models of porous media as long as the pore-space remains well-connected. This condition is important for the theoretical arguments of the approximation of by .
An important outstanding problem is then to directly determine fluid permeabilities from Stokes-flow simulations (as suggested in Ref. Torquato (2020)). Another direction for future research is the determination of other transport properties besides the permeability, e.g., the effective electrical or thermal conductivity of void space (possibly represented by the Voronoi network).
Acknowledgements.
We thank Jaeuk Kim for his samples of equilibrium hard spheres. M. A. K. and S. T. were supported in part by the Princeton University Innovation Fund for New Ideas in the Natural Sciences and by the Air Force Office of Scientific Research Program on Mechanics of Multifunctional Materials and Microsystems under Award No. FA9550-18-1-0514. M. A. K. also acknowledges funding by the Volkswagenstiftung via the Experiment-Projekt Mecke.References
- Torquato (2002) S. Torquato, Random Heterogeneous Materials, 2nd ed., edited by S. S. Antman, L. Sirovich, J. E. Marsden, and S. Wiggins, Interdisciplinary Applied Mathematics, Vol. 16 (Springer, New York, 2002).
- Prager (1963) S. Prager, Chemical Engineering Science 18, 227 (1963).
- Torquato and Avellaneda (1991) S. Torquato and M. Avellaneda, J. Chem. Phys. 95, 6477 (1991).
- Note (1) We depart from the usual notation of for the mean survival time to avoid a conflict in notation with the order metric.
- Avellaneda and Torquato (1991) M. Avellaneda and S. Torquato, Physics of Fluids A: Fluid Dynamics 3, 2529 (1991).
- Rubinstein and Torquato (1989) J. Rubinstein and S. Torquato, J. Fluid Mech. 206, 25 (1989).
- Torquato (2020) S. Torquato, Adv. Wat. Res. 140, 103565 (2020).
- Torquato (1990) S. Torquato, Phys. Rev. Lett. 64, 2644 (1990).
- Scheidegger (1974) A. E. Scheidegger, The Physics of Flow Through Porous Media (University of Toronto Press, Toronto, 1974).
- Katz and Thompson (1986) A. J. Katz and A. H. Thompson, Phys Rev B 34, 8179 (1986).
- Johnson et al. (1986) D. L. Johnson, J. Koplik, and L. M. Schwartz, Phys. Rev. Lett. 57, 2564 (1986).
- Martys and Garboczi (1992) N. Martys and E. J. Garboczi, Phys. Rev. B 46, 6080 (1992).
- Nishiyama and Yokoyama (2017) N. Nishiyama and T. Yokoyama, J. Geophys. Res. Solid Earth 122, 6955 (2017).
- Finney (1977) J. L. Finney, Nature 266, 309 (1977).
- Zallen (1998) R. Zallen, The Physics of Amorphous Solids (Wiley, New York, 1998).
- Chaikin and Lubensky (2000) P. M. Chaikin and T. C. Lubensky, Principles of Condensed Matter Physics (Cambridge University Press, Cambridge, 2000).
- Manoharan et al. (2003) V. N. Manoharan, M. T. Elsesser, and D. J. Pine, Science 301, 483 (2003).
- Hansen and McDonald (2013) J.-P. Hansen and I. R. McDonald, Theory of Simple Liquids: With Applications to Soft Matter, 4th ed. (Academic Press, Amsterdam, 2013).
- Torquato et al. (2000) S. Torquato, T. M. Truskett, and P. G. Debenedetti, Phys. Rev. Lett. 84, 2064 (2000).
- Torquato and Stillinger (2010) S. Torquato and F. H. Stillinger, Rev. Mod. Phys. 82, 2633 (2010).
- O’Hern et al. (2002) C. S. O’Hern, S. A. Langer, A. J. Liu, and S. R. Nagel, Phys. Rev. Lett. 88, 075507 (2002).
- Karayiannis and Laso (2008) N. C. Karayiannis and M. Laso, Phys. Rev. Lett. 100, 050602 (2008).
- Xu and Rice (2011) X. Xu and S. A. Rice, Phys. Rev. E 83, 021120 (2011).
- Ozawa et al. (2012) M. Ozawa, T. Kuroiwa, A. Ikeda, and K. Miyazaki, Phys. Rev. Lett. 109, 205701 (2012).
- Baranau et al. (2013) V. Baranau, D. Hlushkou, S. Khirevich, and U. Tallarek, Soft Matter 9, 3361 (2013).
- Tian et al. (2015) J. Tian, Y. Xu, Y. Jiao, and S. Torquato, Sci. Rep. 5, 16722 (2015).
- Jiao et al. (2011) Y. Jiao, F. H. Stillinger, and S. Torquato, Journal of Applied Physics 109, 013508 (2011).
- Atkinson et al. (2013) S. Atkinson, F. H. Stillinger, and S. Torquato, Phys. Rev. E 88, 062208 (2013).
- Klatt and Torquato (2014) M. A. Klatt and S. Torquato, Phys. Rev. E 90, 052120 (2014).
- Klatt and Torquato (2016) M. A. Klatt and S. Torquato, Phys. Rev. E 94, 022152 (2016).
- Klatt and Torquato (2018) M. A. Klatt and S. Torquato, Phys. Rev. E 97, 012118 (2018).
- Ziff and Torquato (2017) R. M. Ziff and S. Torquato, J. Phys. A: Math. Theor. 50, 085001 (2017).
- Klatt et al. (2019) M. A. Klatt, J. Lovrić, D. Chen, S. C. Kapfer, F. M. Schaller, P. W. A. Schönhöfer, B. S. Gardiner, A.-S. Smith, G. E. Schröder-Turk, and S. Torquato, Nature Commun. 10, 811 (2019).
- Torquato (2010) S. Torquato, Phys. Rev. E 82, 056109 (2010).
- Torquato et al. (2015) S. Torquato, G. Zhang, and F. H. Stillinger, Phys. Rev. X 5, 021020 (2015).
- Kerstein (1983) A. R. Kerstein, J. Phys. A: Math. Gen. 16, 3071 (1983).
- Newman and Ziff (2001) M. E. J. Newman and R. M. Ziff, Phys. Rev. E 64, 016706 (2001).
- Torquato and Stillinger (2003) S. Torquato and F. H. Stillinger, Phys. Rev. E 68, 041113 (2003).
- Torquato (2018) S. Torquato, Phys. Rep. 745, 1 (2018).
- Zachary and Torquato (2009) C. E. Zachary and S. Torquato, J. Stat. Mech. 2009, P12015 (2009).
- Liu et al. (2009) Y. Liu, W. Wang, B. Lévy, F. Sun, D.-M. Yan, L. Lu, and C. Yang, ACM Trans. Graph. 28, 1 (2009).
- Du et al. (2010) Q. Du, M. Gunzburger, and L. Ju, Numer. Math. Theor. Meth. Appl. 3, 119 (2010).
- Zhang et al. (2012) J. Zhang, M. Emelianenko, and Q. Du, Int. J. Numer. Anal. Model. 9, 950 (2012).
- Ruscher et al. (2015) C. Ruscher, J. Baschnagel, and J. Farago, EPL 112, 66003 (2015).
- Ruscher et al. (2018) C. Ruscher, J. Baschnagel, and J. Farago, Phys. Rev. E 97, 032132 (2018).
- Ruscher et al. (2020) C. Ruscher, S. Ciarella, C. Luo, L. M. C. Janssen, J. Farago, and J. Baschnagel, J. Phys.: Condens. Matter 33, 064001 (2020).
- Hain et al. (2020) T. M. Hain, M. A. Klatt, and G. E. Schröder-Turk, J. Chem. Phys. 153, 234505 (2020).
- Rintoul (2000) M. D. Rintoul, Phys. Rev. E 62, 68 (2000).
- Lloyd (1982) S. Lloyd, IEEE Trans. Inf. Theory 28, 129 (1982).
- Elam et al. (1984) W. T. Elam, A. R. Kerstein, and J. J. Rehr, Phys. Rev. Lett. 52, 1516 (1984).
- Höfling et al. (2008) F. Höfling, T. Munk, E. Frey, and T. Franosch, J. Chem. Phys. 128, 164517 (2008).
- Priour and McGuigan (2018) D. J. Priour and N. J. McGuigan, Phys. Rev. Lett. 121, 225701 (2018).
- Spanner et al. (2016) M. Spanner, F. Höfling, S. C. Kapfer, K. R. Mecke, G. E. Schröder-Turk, and T. Franosch, Phys. Rev. Lett. 116, 060601 (2016).
- Treado et al. (2019) J. D. Treado, Z. Mei, L. Regan, and C. S. O’Hern, Phys. Rev. E 99, 022416 (2019).
- Rycroft et al. (2006) C. H. Rycroft, G. S. Grest, J. W. Landry, and M. Z. Bazant, Phys Rev E 74, 021306 (2006).
- Rycroft (2009) C. H. Rycroft, Chaos 19, 041111 (2009).
- Wang et al. (2013) J. Wang, Z. Zhou, W. Zhang, T. M. Garoni, and Y. Deng, Phys. Rev. E 87, 052107 (2013).
- Coker et al. (1996) D. Coker, S. Torquato, and J. Dunsmuir, J. Geophys. Res. B Solid Earth 101, 17497 (1996).
- Note (3) Note the different scaling of the first and second moment of the pore size in Ref. Klatt and Torquato (2018). There, the values are given for unit diameter of the spheres; here, we list the values for unit number density.
- Note (2) For the overlapping sphere model (also known as Boolean model), where the sphere centers are uncorrelated, is strictly related to the critical porosity of the percolating void phase, , where is the volume of a ball with radius Torquato (2002).
- Torquato (1985) S. Torquato, Journal of Applied Physics 58, 3790 (1985).
- Kim and Torquato (1991) I. C. Kim and S. Torquato, Journal of Applied Physics 69, 2280 (1991).
- Robinson and Friedman (2005) D. A. Robinson and S. P. Friedman, Physica A: Statistical Mechanics and its Applications 358, 447 (2005).
- Gillman and Matouš (2014) A. Gillman and K. Matouš, Physics Letters A 378, 3070 (2014).
- Gillman et al. (2015) A. Gillman, G. Amadio, K. Matouš, and T. L. Jackson, Proceedings of the Royal Society A: Mathematical, Physical and Engineering Sciences 471, 20150060 (2015).
- Nguyen et al. (2016) M.-T. Nguyen, V. Monchiet, G. Bonnet, and Q.-D. To, Phys. Rev. E 93, 022105 (2016).
- Hashin and Shtrikman (1963) Z. Hashin and S. Shtrikman, Journal of the Mechanics and Physics of Solids 11, 127 (1963).
- McPhedran and Milton (1981) R. C. McPhedran and G. W. Milton, Appl. Phys. A 26, 207 (1981).
- Torquato et al. (1985) S. Torquato, G. Stell, and J. Beasley, International Journal of Engineering Science 23, 385 (1985).
- Miller and Torquato (1990) C. A. Miller and S. Torquato, Journal of Applied Physics 68, 5486 (1990).
- Sangani and Acrivos (1982) A. Sangani and A. Acrivos, International Journal of Multiphase Flow 8, 343 (1982).