Low-Frequency Characterization of Music Sounds
- Ultra-Bass Richness from the Sound Wave Beats -
Abstract
Orchestra performance is full of sublime rich sounds. In particular, the unison of violins sounds different from the solo violin. We try to clarify this difference and similarity of unison and solo numerically analyzing the beat of ‘violins‘ with timbre, vibrato, melody, and resonance. Characteristic properties appear in the very low-frequency part in the power spectrum of the wave amplitude squared. This ultra-buss richness (UBR) can be a new characteristic of sound on top of the well-known pitch, loudness, and timbre, although being inaudible directly. We find this UBR is always characterized by a power-law at low-frequency with the index around and appears everywhere in music and thus being universal. Furthermore, we explore this power-law property towards much smaller frequency regions and suggest possible relation to the 1/f noise often found in music and many other fields in nature.
I introduction
The orchestra sound is very different from the solo-played sound. In particular, the unison of the violin part sounds clearly different from the solo violin. What is the difference and similarity between the unison and the solo? The loudness of sound is apparently increased in the orchestra, however, the violin unison in the orchestra has mild tension and the sound quality is different from the solo sound. The pitch and timbre of the violin seem to be the same for unison and solo. We first study a possibility to introduce a new characteristic of sound that may distinguish unison and solo.
An important implication is the fact that there are few piano ensembles (unison) except duets. One of the reasons would be the fact that the piano cannot change its pitch while the violin and other instruments can easily control its pitch. Therefore we speculate that the pitch slightly different in the violin unison may be the key to solve this problem. Actually, the multiple sound sources with slightly different pitches with each other would cause the low-frequency beat. Larger the number of sound sources, beat pattern appears and the whole sound would become more complex and rich. We explore this possibility: the low-frequency beat generated by the unison of music instruments like a violin would characterize sound besides loudness, pitch, and timbre.
The superposition of the two simple sound sources, with slightly different frequencies, can be described by trigonometric functions as , where . This is expressed as and the factor provides us with the low-frequency beat. However, this beat cannot appear in a simple Fourier transformation of the above formula; it trivially yields the frequency signal at and only. However, if we take the square of the sound wave amplitude, proportional to the intensity of the wave, the beat does appear,
| (1) |
It often happens that the beat frequency or is too small as an audible sound in the usual sense although it strongly affects the musical impression as a modulation of the sound amplitude. We call this characteristic the ultra-buss richness (UBR) property. The above is the simple origin of the UBR of unison.
Then what is the actual form of UBR in the case of many instruments? In order to clarify the detail of the UBR, we need to take into account the specific properties of the instrument and also the performance style properties. There would be at least two such properties when we study unison.
a) One is the timbre of the sound, a superposition of higher harmonics on top of the fiducial pitch. Each higher harmonics yields a bunch of beats at ultra-low-frequency regions in the power spectrum . Therefore the UBR reflects the power spectrum of higher harmonics, which intrinsically depends on the musical instruments. b) Another is the vibrato, a continuous modulation of low-frequency for each note, a popular musical technique widely used nowadays. If applied, the vibrato drastically increases the variety of frequency differences in the ensemble even infinitely. This would make the UBR richer.
On the other hand, is UBR really specific to the unison? In order to answer this question, we further consider the specific properties of instruments and performance style properties in the case of solo. There would be at least two such properties when we study solo.
a) One is the melody flow. We would like to consider a sequence of notes, a melody, and the possibility of overall UBR, even if each note of solo instrument may not possess UBR. It may be particularly interesting, for example, to try to make each adjacent notes slightly overlap with each other in the melody to observe any UBR. Since this is a typical case of musical instruments, such as multi-string violin, this example is also practical. b) Another is the resonance of a single instrument. Even if a single string posses a single fiducial frequency , as well as overtones, the resonating box attached to the string would have some finite range of resonance frequency around . If these continuous resonance modes are excited and cause beats with each other, then we can expect UBR even for a single sound source instrument.
The emphasis in this paper is the sound property UBR, the low-frequency characteristic in the power spectrum. This makes UBR unique distinguished from the other three characteristics of sound: loudness, pitch, and timbre, all of these characterize the sound at the frequency or higher in the power spectrum. Further, our interest naturally continues toward much lower frequency regions.
In this context, it is widely known that 1/f or pink noise appears very often in the ultra low-frequency regions and is characterized by the universal power-law in the power spectrum: with Milotti2002 . In particular, this 1/f fluctuation is reported also to appear in music especially in classical musicMusha1981 .
The case is particularly interesting since the integrated fluctuation would diverge in both low and high frequency ends. Similar case appears in the early Universe in the spatial domain. The density fluctuations of (dark) matter generated from quantum mechanics have divergent integrated fluctuation in both the small and large scale ends (Zel’dovich spectrum)Dodelson2020 . Since our sound beat creates UBR, we may be able to expect some relation between UBR and the 1/f noise. We would like to explore to some extent this relation.
This paper is composed as follows. Section 2 describes how UBR appears in the unison of the sound sources which have timbre and vibrato. Section 3 describes the possibility of the UBR in the solo sound for the cases of melody and resonance. In section 4, we analyze real music in the same way as above and try to verify our point of view. In section 5, we explore the possibility that the wave beat yields the 1/f fluctuations in general. The last section 6 summarizes our study showing possible extensions of the present calculations.
II UBR from unison
II.1 Unison with timbre (tone color)
We first study the unison of multiple sound sources which have timbre or overtones. The timbre is made from the superposition of multiple harmonics. In the case of the violin, the wave amplitude of the -th harmonics can be approximated to be proportional to with yokoyama2016 , although actually, some overtones deviate from this power-law and the power index itself varies from to in numerous literature.
We simply superpose trigonometric overtone wave with the weight ,where to form a ‘violin‘ sound ,
| (2) |
where is the fiducial frequency, is a random phase, and we superpose up to -th overtone. Then, times superposing them with random modulation (within some range),
| (3) |
we obtain a unison sound of ‘violins‘ with timbre.
Now we analyze this sound in the Fourier power spectrum. Analytic Fourier transformation is possible but the results are a collection of cumbersome terms and are intractable. Thus we use, in this paper, discrete Fourier transformation with sufficient sampling points. As was explained in the previous section, a simple Fourier transformation of trivially yields no signal in the low-frequency regions. Thus we always take discrete Fourier transformation for the square of the data . There is another indicator that also characterizes the power distribution: zero-crossing which simply counts the zero of the data. The power spectrum of this zero-crossing shows similar behavior as although we do not discuss this zero-crossing indicator in this paper.
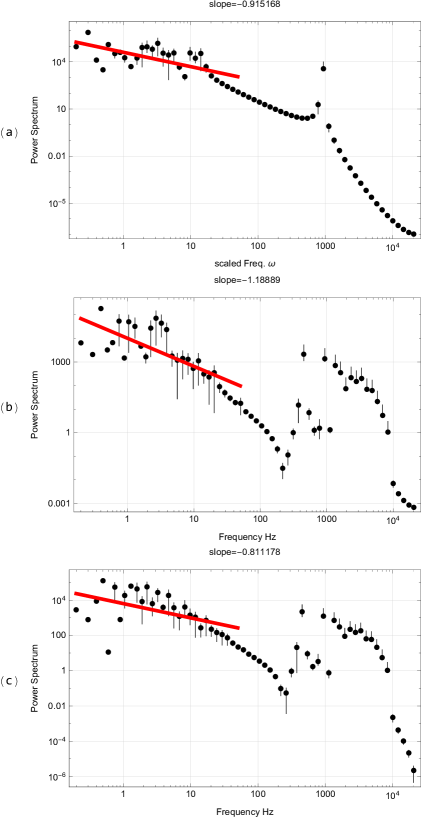
A single ‘violin‘ with timbre never shows any signal in ultra bass (UB) region in the power spectrum (as well as zero-crossing data). This is shown in Fig. 1 (a), where we take the parameters , where is the time duration, in second, of the sound data.
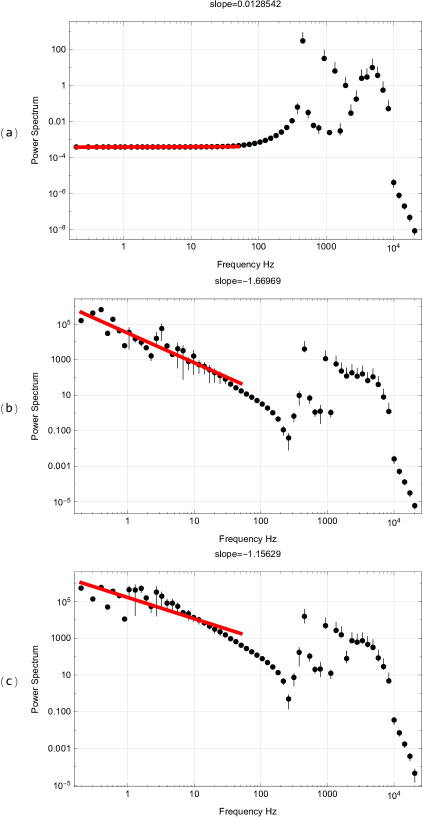
a) PS of violin solo (). It never yield low-frequency signal enhancement UBR.
b) same but violin quintet (). UBR starts to appear in the form of power-law with negative index about
c) same but 10 violins (0). UBR develops in the form of power-law but becomes shallower with the index about .
The parameters used in the numerical calculation of Eq.(3) are, . Each violin has different pitch within 0.7% from the fiducial Hz. The data time series is prepared with the sampling rate , i.e. times sampling within a second before the discrete Fourier transformation of the data . The data is generated by Wolfram Mathematica12.
On the other hand, when we superpose the sounds of 5 ‘violins‘, the strong signal appears in the low-frequency regions, as is shown in Fig. 1 (b). The UBR starts to appear. This UBR is well characterized by the power-law with the power index of about within the 3 decades, while the timbre range, for , is about 1.5 decades. This long-decade power-law of UBR comes from the variety of all possible beat pairs. Although the modulation range is fixed within in the present case, a real player in an orchestra tries to tune to the fiducial pitch as much as possible. Then the variety of beat continuously increase and therefore the UBR will extend much lower frequency regions.
II.2 Unison with vibrato
We now study unison with vibrato, a popular performance style, being a pitch fluctuation technique by the player. A uniform vibrato of frequency with amplitude on top of the fiducial frequency can be expressed as
| (4) | ||||
where is a random phase. Then, times superposing them with random phases ,
| (5) |
we obtain a unison sound of ‘violins‘ with vibrato.
Now we analyze this sound in the Fourier power spectrum as before. A single ‘violin‘ with vibrato never shows any signal in ultra bass (UB) region in the power spectrum as previously. This is shown in Fig. 2 (a), where we take the parameters .
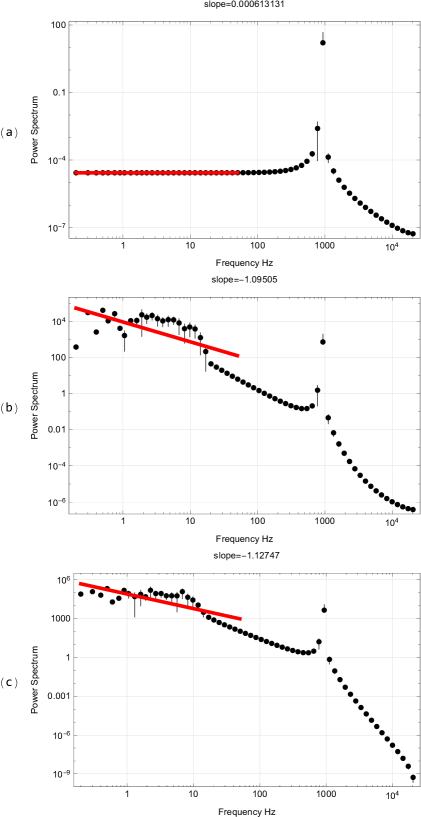
a) PS of a single violin (). It never yield UBR alone.
b) same but violin quintet ().UBR starts to appear in the form of power-law with negative index about
c) same but 10 violins(0). UBR develops in the form of power-law with negative index about .
UBR is characterized by the power-law with power index about for unison. The parameters are .
On the other hand, if we add the sounds of 5 violins (b), or of 10 violins (c), UBR evolves in the form of a power-law with characteristic power indexes about as in Fig.2(b)(c).
II.3 Unison with timbre and vibrato
We now consider unison with timbre and vibrato together for more realistic violin performance. Combining Eq.(4) and Eq.(3), and randomly superposing them to make unison, we have the sound wave,
| (6) |
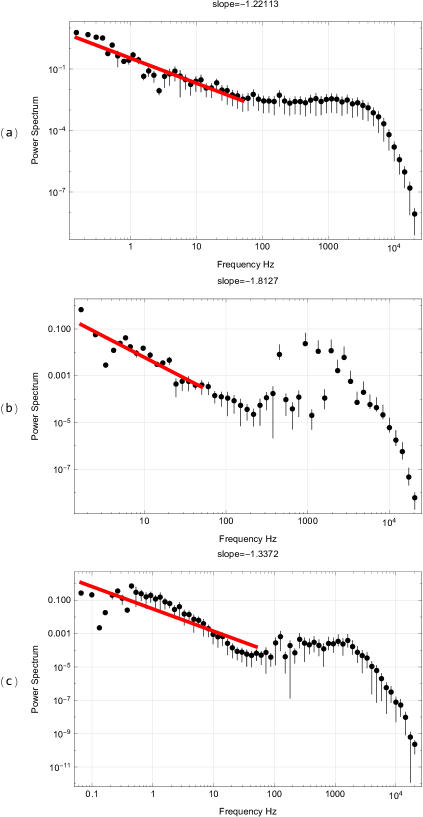
The square of this data yields the PS as in Fig.3. In all the panels (a)(b)(c), UBR is clearly observed in the form of power-law with indexes Further, the dispersion of low-frequency data seems to be smaller for larger number of violins as in panels (a)and (b).
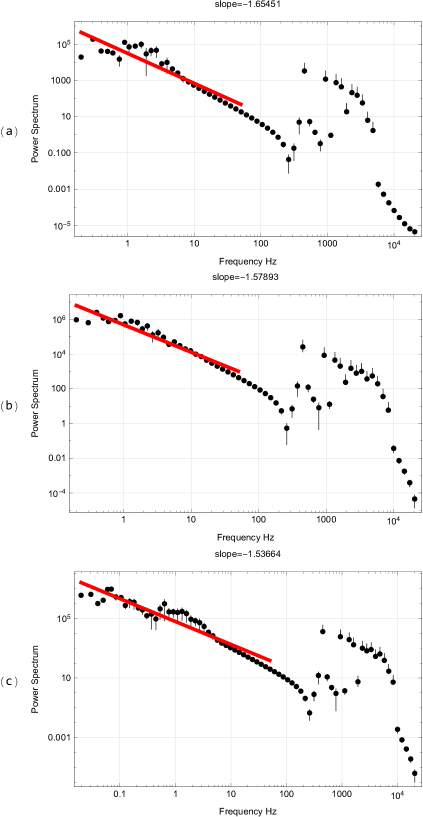
(a) 5 violins superposed with the parameters:
.
(b)10 violins, of more overtones, superposed with the parameters:
.
(c)long time scale data for 10 violin sound superposed, with the parameters:
.
We set the pitch fluctuation smaller than that for shorter time scale . This makes the dispersion of the data small. The power index, which characterize UBR, is about .
We tried to take data longer in time in Fig.3(c). UBR seems to continue toward much smaller frequencies although we set the frequency fluctuation small to reduce the dispersion of the data. It may happen that the violinists in an orchestra may try to do the same; to tune more for longer unison.
In conclusion of this section, unison always seems to yield UBR and characterized by a power-law with index .
III UBR from Solo
We have always found UBR in unison(Fig.1(b)(c), Fig.2(b)(c)) but not in solo(Fig.1(a), Fig.2(a)), within our study so far. Then, can we finally conclude that no UBR is observed in solo? Is UBR really limited to unison? Or, can UBR be universal to some extent? To answer these questions, in this section, we study solo cases considering more realistic conditions than the previous simplest settings.
III.1 melody of solo violin
A solo ‘violin‘ so far we artificially constructed did not show UBR at all(panels (a) of Figs.1,2). However, music sounds always appear in a melody or a sequence of notes. Quoting a short melody from J.S.Bach Partita No.2 in D Minor, BWV 1, we first make a sequence of sounds ,.
We first simply adjoined each note to form a melody data and the square of it is analyzed by the discrete Fourier Transformation to get the power spectrum. As expected, this does not show UBR at all (Fig. 4 (a)).
However, the actual instrument performance of melody may not make each note finish exactly before the beginning of the next note. Therefore, we simply make tiny overlap adjacent notes with each other. If we take this overlap as 1% of each note segment length, we have the PS in Fig.4 (b). There drastically appears clear UBR only by 1% segment overlap.
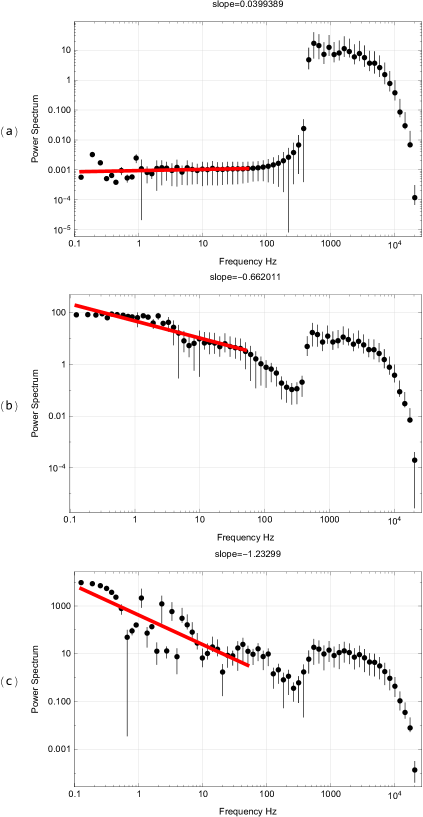
(a) PS of a simple melody without overlap. UBR does not appear.
(b) Same as (a) but each note has 1% overlap with the adjacent notes. UBR does appear and the power index is .
(c) Same as (b) but with 10% overlap. UBR is enhanced and the power index is .
A note of in the melody is generated by the ‘violin‘ note with timbre Eq.(3) and the parameters are, . Based on this, we made the other notes in equal temperament, i.e. multiplying necessary powers of to the fiducial pitch.
If we further superpose each note to 10%, we have the PS in Fig.4 (c). The UBR is enhanced than case (b). Further, in these cases, UBR is characterized by the power-law with the power index .
The reason that a melody as a simple sequence of notes does not show UBR will be the notes are statistically independent with each other. If they follow some statistical rule, then UBR may appear. We will examine this possibility in section V. The key reason that a melody with each adjacent segment is overlapped a bit does show UBR will be the existence of any statistical correlation among very small overlapped notes. There is a possibility that an each element seems to be random but the whole sound data may follow any statistical rule. In this case, there may appear long period correlations that characterize the very low-frequency regions in PS. This point will be further studied in section V.
An important caution should be made here. We have treated the melody composed from the notes of equal strength in our analysis and have concentrated on the UBR from the sound beat. However, real music is rich and has its own expression, crescendo/decrescendo or swinging tempo, as well as the hierarchical structures as a composed piece, from motive to the entire symphony. This musical structure itself may yield UBR in particular at very-low-frequency regionsMusha1981 . This latter UBR should be separated from our present analysis.
III.2 resonance of solo violin
A string of a violin is not isolated but is attached to a wooden box which makes resonance and emits many notes with slightly different frequency from the string pitch. We consider the possibility of unison made from the resonance. By solving a forced harmonic oscillator, a simple resonance would yield the following sound,
| (7) |
where is the forcing frequency, corresponding to the string frequency, and is the coupling to yield resonance.
If we include timbre, then the sound is given by
| (8) |
If the resonance is further dissipative, we replace the factor and obtain
| (9) |
where is the dissipation constant.
These sound data Eqs.(7, 8, 9) yield PS in Fig.5 in order. We found that even a solo ‘violin‘ with resonance can yield UBR, and again this UBR is characterized by the approximate power-law with index .
(a)PS of a simple case along with Eq.7 with parameters .
(b)PS of a case also with timbre along with Eq.8 with parameters .
(c)PS of a case also with timbre and dissipation along with Eq.9 with parameters .
Although we have examined only a few cases for solo instruments in this paper, there will be many cases that solo instruments that may yield UBR. For example, reflection from a wall in a hall can easily form a superposition of sounds, resonance with the hall, and the other instruments can naturally form a superposition of sounds. Therefore, music performance is thought to be full of UBR.
Concluding this section, even a single ‘violin‘ can yield UBR and it is again characterized by a power-law with an index of about .
IV Some verification in real music
The study so far is based on the artificial sound generated by computers. We briefly examine UBR in real music performances in this section.
In the case of orchestra unison, it is difficult to find a pure unison of a single pitch. Therefore, instead, we randomly clip a segment from the full performance for the analysis. The data is from you-tube provided in the wav-format and we used a single channel from stereo-recorded data. The sampling rate is 44100 Hz for all the data, sufficient to analyze the low-frequency regions.
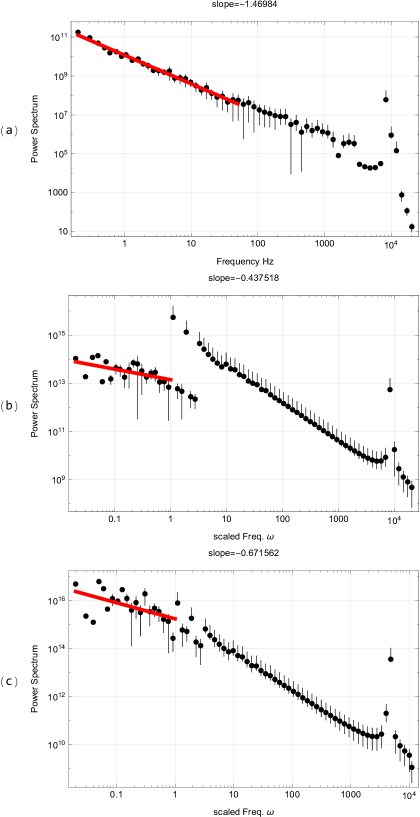
Results are in Fig.6 which shows PS obtained from the sound data squared applying the discrete Fourier transformation. The top panel (a) shows the PS of a 13-second clip of orchestra performance. We choose Tchaikovsky Serenade for Strings conducted by S. Ozawa played by the Saitoh Kinen Orchestra from YouTube Ozawa1992 . This shows clear UBR in the form of power-law with the index . However, the actual orchestra performance, including the concert hall and the location of the audience, is very complex and therefore cannot directly be compared with our analysis.
(a)PS of the sound of orchestra performance. A 13-second clip from "Tchaikovsky Serenade for Strings Ozawa Saitoh-Kinen Orchestra"Ozawa1992 .
(b)PS of solo violin sound 1.2-second clip of a single toneKuboki2014 .
(c)PS of solo violin sound 30-second clip from J. S. Bach Partita for Solo Violin No. 3Perlman2012 .
In the case of solo violin, we first clip a pure segment of sound with a single pitch. The power spectrum is in Fig.6 (b). The data is a short clip of 1.2 seconds at the scene of almost constant pitchKuboki2014 . Clearly, we observe UBR with power-law but with a slightly steep power index . The other clips also show a similar tendency with the power index . This should be compared with section III.B Fig.5, the resonance of solo violin. In particular, in the corresponding region of 1 to hundred Hz, the slope becomes steeper and the index is about . in Fig.5. This tendency should be compared with the above slightly steep power indexes.
In the case of solo violin with melody, we choose J. S. Bach Partita for Solo Violin No.3 - from YouTube Perlman2012 . The power spectrum is in Fig.6(c) which shows UBR. This should be compared with the arguments in III.A., in particular, Fig. 4 (c).
Although we also tried to use the sound data itself, not squared, no UBR was found. We further tried to use the zero-point method as explained before and obtained a similar behavior as in Fig.6. These properties are the same as all our analyses in the previous sections.
V Beyond music
We have so far studied the beat of multiple sound waves at low-frequency regions and found the ultra-bass richness (UBR) in the power-law form in PS. The essence of UBR is the wave beat and this simple principle makes the UBR universal. The UBR for the sound waves is characterized by a power-law with its index . This power-law may extend further much lower frequency regions as we have seen in Fig. 3(c).
These properties remind us of 1/f fluctuations or pink noise characterized by the low-frequency power-law with index distinct from the white noise (index ) or Brownian noise (index ). This pink noise seems to appear everywhere in nature and to have many kinds of originsMilotti2002 .
We pick up some typical examples of 1/f fluctuation: vacuum tube, semiconductor, human heart, squid giant axon, brain MEG and EEGJohnson1925 ; Linkenkaer2001 ; Musha1981 ; Novikov1997 ,… The first two of these directly measure the electric current. The others are related to the nerve of living creatures and the signal passing through the nerves should be in the form of an electric current. Therefore, all of these seem to be related to the fluctuations of the electric current. Further, the electric current density is the square of the electron wave functions in the fundamental level. Therefore, it will be natural to speculate that the electron waves in the object make beats to yield UBR. In particular, the beats are produced by the electromagnetic scattering process with photon, which has common dispersion relation with soundHandel1980 at low-frequency, and therefore infrared-divergent noise arises. However, these electron waves, at least, cannot be the quantum mechanical wave functionsNieuwenhuizen1987 ; Kiss1986 .
Here in this section, we explore a general possibility that UBR caused by infrared-divergent noise, reserving the quantum mechanical origin.
The infrared-divergent distribution function, with cutoff is and the inverse function of it’s cumulative distribution function generates such infrared-divergent random field from the uniform random field. The N-superposed data is thus given by
| (10) |
The power spectrum of this data is shown in Fig.7, in which there appear UBR that is expressed as the power-law. The top panel (a) is the PS of the square of full data Eq.(10), and shows a clear power-law with index .
(a) PS for a single data of time duration second. The parameters are . It shows a clear power-law with index .
(b) PS of data which is a sequence of independent 100 segments each of it is generated by Eq. 10 with time duration second. There seems to appear another power with shallower slope in the low-frequency region below 1 Hz which goes beyond the causality limit 1 second. The parameters are .
(c) PS generated by the data of (b) but adjacent segments are 50% superposed with each other.
When we consider the finite size of the sound source , it seems natural to raise an objection for the above appearance of UBR below the critical frequency which corresponds to the scale . However, it should be noted that the noise is generated by an infrared-divergent distribution function which has no fixed finite mean nor standard deviations for a finite-size sample. Therefore, even if we construct the whole data directly connecting many independent segments of size , the whole data will show any statistical property reflecting the infrared diverging noise toward the lower scale beyond the critical frequency . Thus we expect some kind of UBR, which may not be the original type, in such data composed from many independent segments. A typical example is shown in Fig.7(b) where another type of UBR seems to appear separately in the lowest frequency regions.
This low-frequency UBR becomes more prominent when we allow an overlap of each adjacent segment in the data as we did before in the melody section III.1. A typical example is shown in Fig.7(c), where the PS is shown for the same data of (b) but allowing 50% overlap for each segment.
Thus, we confirm that the size of the sound source will not be a limitation for the appearance of UBR toward the lower-frequency regions below . This may be a challenge to one of the physical objections Nieuwenhuizen1987 ; Kiss1986 for quantum 1/f noiseHandel1980 .
VI Summary and Future prospects
We started our study with a naive question: how unison is different from solo. At first, we expected the unison or a superposition of slightly different many pitches would make a beat and naturally yields a clear signal in the low-frequency regions UBR, while solo does not have this property. However, it turned out that even solo can yield UBR through a superposition of slightly overlapped notes (melody) or resonance, though the signal is not so strong as the unison case. We found UBR is often characterized by a power-law with index . Then we have briefly verified these general arguments by using actual music sound sources.
Then we examined a possible link from our study on musical sound to the general 1/f noise, expecting that the 1/f noise is generated by wave beats. We have demonstrated this possibility within limited examples. Introducing an infrared-divergent noise, we studied how it can yield UBR. We found clear UBR in the data even if it is decomposed into independent segments, in particular when we allow superposition among adjacent segments.
The UBR we studied in this paper may be the fourth element to characterize the sound as well as the traditional three elements; sound loudness, pitch, and timbre. All of these traditional elements characterize sound, in the PS, at the original frequency (pitch, loudness) and higher (timbre) while UBR at all lower frequency regions than the original. If allowed to be personal and emotional, UBR can be described as a profound dignified sound with comfortable mild tension. Our perspective is that multiple sound beats awaken these emotions.
Our study of UBR has just started from this paper and there remain many subjects necessary for extensions and versification. Such issues are in order below.
-
1.
Investigations for various musical instruments are necessary. For timbre, we made a violin-like sound by superposing th overtones with specific weight with . However, the value of is different for other instruments. UBR power index depends on . If the flute has larger , then the same for and the low-frequency power will steeper, thus UBR will not prominent for flute. A slightly different pitch was essential for UBR. For example, the keyboard instruments have fixed pitch and the player cannot control the frequency thus UBR cannot be expected for them. Therefore there may be no ensemble of keyboard instruments.
-
2.
In quantum mechanics, a typical double slit experiment can yield large-scale interference or beat pattern for the propagating electron wave function. In the same way, the spatial distribution of the sound sources may also control the feature of UBR although we have not included this effect in our present paper. The spatial arrangement of various instruments in the orchestra, as well as the location of the audience, would be essential for the variety of UBR.
-
3.
We made our sound samples by using Wolfram Mathematica12. It would be interesting to use an electronic synthesizer for the analysis of UBR because the synthesizer may produce more realistic sound well mimicking the real musical instruments. We did not use it this time simply because we do not know artificial filtering used in typical synthesizers.
-
4.
The indicator UBR should be defined more elaborately. We have so far characterized UBR by the power law and its power index. We probably need the amplitude of the signal. For example, In Fig.4, we may define the indicator as the ratio of the PS amplitudes at 0.1Hz and the maximum amplitude at beyond 100Hz. The panels (a),(b),(c) respectively show about . This is reasonable since the overlap regions between the notes are increasing in this order, .
-
5.
We have utilized numerical calculations in this paper, but a more analytic approach will be possible. Although simple Fourier transformation of the sound superposition only yields tremendous terms of Dirac-delta functions, any sophisticated rearrangement of them may make the data tractable. Further, the analytic approach is more necessary in some situations in our analysis. For example, in the resonance case, continuous eigenmodes contribute to the unison with the weight described by the Cauchy–Lorentz distribution function.
-
6.
UBR we studied is characterized by the power-law of index in the PS, and the power-law seems to continue much lower frequency domain. This feature reminds us of 1/f fluctuations which appear everywhere in nature. If our sound beat is accepted as a class of 1/f fluctuations, we would like to examine how extent the wave beats can be a general mechanism of 1/f fluctuations. We then further generalize UBR to the wave function of the electron in semi-conductors. To proceed, we need to answer the objections raised in Nieuwenhuizen1987 ; Kiss1986 . Probably, we need to extend the ensemble to the stable distribution Cizek2005 characterized by the property that a partial sum of the random fields, if scaled, follows the same distribution.
-
7.
We have studied wave beat from the viewpoint of unison. This can also be understood from the viewpoint of synchronization of many active elements. For example, solar dynamo activity can be described by the synchronization of many macro-spins each of which has a local magnetic momentNakamich2012 . This macro-spin model well describes observed features of the solar activities. In particular, it describes the 11year periodicity as well as 1/f fluctuations in the solar magnetism. Actually, the PS of the sunspot record shows the power of index on top of the 11year periodNakamich2012 . In this way, any synchronizing system may show 1/f fluctuations by the interference of elements.
-
8.
We have studied wave beat within the time domain; high-frequency sound sources synchronize with each other to yield the low-frequency structure UBR. If further extended also to the spatial domain, we notice that this mechanism can be understood as the transition from the microscopic to macroscopic structures.
In this context, we can understand the generation of density fluctuations in the early universe as the quantum beat of almost mass-less inflaton field which also drove the inflationary cosmic expansion. This mechanism will be deeply related to the quantum 1/f noise proposed inHandel1980 . Actually, the present cosmic observations support the Zel’dovich spectrum in the density fluctuations. This spectrum diverges both in ultraviolet and infrared regions, the same as 1/f fluctuations in the time domain. We need to clarify a possible common mechanism, if any, among primordial density fluctuations, quantum 1/f noise, and UBR.
These extensions and applications are now under study in our group and I hope we can report some of them soon.
Acknowledgements.
The author would like to thank many researchers and students of a variety of expertise: members of the Astrophysics group, summer lecture students 2021 organized by Mei Odo; Yayoi Abe, Katsuyoshi Kobayashi, at Ochanomizu Univ.; Yutaka Shikano at Gunma Univ.; Koichiro Umetsu and Toshiki Hanyu at Nihon Univ; and many others.References
- (1) Edoardo Milotti, 1/f noise: https://arxiv.org/abs/physics/0204033, 2002.
- (2) T. Musha, 1/f fluctuations in biological systems. In P.H.E. Meijer, R.D. Mountain & R.J. Soulen, Jr. (Eds.), Sixth International Conference on Noise in Physical Systems 143, 1981.
- (3) Scott Dodelson and Fabian Schmidt, Modern Cosmology Academic Press 2020.
- (4) Masao Yokoyama et al., Relation between violin timbre and harmony overtone, proceedings of 172nd Meeting of the Acoustical Society of America, 28, 5pMU, 2016.
- (5) S. Ozawa, https://www.youtube.com/watch?v=5y_Z0u_LvJc, 1992.
- (6) T. Kuboki, https://www.youtube.com/watch?v=hLKZwvE5r_A, 2014.
- (7) I. Perlman, https://www.youtube.com/watch?v=KpYUaRg0aDw&t=224s, 2012.
- (8) J. B. Johnson, The Schottky effect in low frequency circuits, Phys. Rev.26 71, 1925.
- (9) M. A. Caloyannides, Microcycle spectral estimates of 1/f noise in semiconductors, J. Appl. Phys. 45, 307, 1974.
- (10) E. Novikov, A. Novikov, D. Shannahoff-Khalsa, Schwartz B Wright J. Scale-similar activity in the brain, Phys. Rev. E56, R2387, 1997.
- (11) K. Linkenkaer-Hansen, V. V. Nikouline, J. M. Palva, and R. J. Ilmoniemi, Long-range temporal correlations and scaling behavior in human brain oscillations, J. Neurosci.21, 1370, 2001.
- (12) P.H. Handel: Quantum Approach to 1/f Noise, Phys. Rev. 22A, 745, 1980.
- (13) Th. M. Nieuwenhuizen, D. Frenkel, N. G. van Kampen, Objections to Handel’s quantum theory of1/fnoise, Physical Review A. American Physical Society (APS). 35 (6), 2750, 1987.
- (14) L. B. Kiss, P. Heszler, An exact proof of the invalidity of ’Handel’s quantum 1/f noise model’, based on quantum electrodynamics, Journal of Physics C: Solid State Physics. IOP Publishing. 19 (27), L631, 1986.
- (15) P. Cížek, W. Härdle, and R. Weron, Statistical Tools for Finance and Insurance, Springer-Verlag Berlin Heidelberg, 2005.
- (16) A. Nakamichi et al., Coupled spin models for magnetic variation of planets and stars, MNRAS 423, 2977, 2012.