11email: mlampon@iaa.es 22institutetext: Hamburger Sternwarte, Universität Hamburg, Gojenbergsweg 112, 21029 Hamburg, Germany 33institutetext: Leiden Observatory, Leiden University, Postbus 9513, 2300 RA, Leiden, The Netherlands 44institutetext: Centro de Astrobiología (CSIC-INTA), ESAC, Camino bajo del castillo s/n, 28692 Villanueva de la Cañada, Madrid, Spain 55institutetext: Max-Planck-Institut für Astronomie, Königstuhl 17, 69117 Heidelberg, Germany 66institutetext: Landessternwarte, Zentrum für Astronomie der Universität Heidelberg, Königstuhl 12, 69117 Heidelberg, Germany 77institutetext: Instituto de Astrofísica de Canarias (IAC), Calle Vía Láctea s/n, 38200 La Laguna, Tenerife, Spain 88institutetext: Departamento de Astrofísica, Universidad de La Laguna, 38026 La Laguna, Tenerife, Spain 99institutetext: Institut für Astrophysik, Georg-August-Universität, Friedrich-Hund-Platz 1, 37077 Göttingen, Germany 1010institutetext: Departamento de Física de la Tierra y Astrofísica & IPARCOS-UCM (Instituto de Física de Partículas y del Cosmos de la UCM), Facultad de Ciencias Físicas, Universidad Complutense de Madrid, 28040 Madrid, Spain 1111institutetext: Institut de Ciències de l’Espai (CSIC-IEEC), Campus UAB, c/ de Can Magrans s/n, 08193 Bellaterra, Barcelona, Spain 1212institutetext: Institut d’Estudis Espacials de Catalunya (IEEC), 08034 Barcelona, Spain
Evidence of energy-, recombination-, and photon-limited escape regimes in giant planet H/He atmospheres
Hydrodynamic escape is the most efficient atmospheric mechanism of planetary mass loss and has a large impact on planetary evolution. Three hydrodynamic escape regimes have been identified theoretically: energy-limited, recombination-limited, and photon-limited. However, no evidence of these regimes had been reported until now. Here, we report evidence of these three regimes via an analysis of a helium i triplet at 10830 Å and Ly absorption involving a 1D hydrodynamic model that allows us to estimate hydrogen recombination and advection rates. In particular, we show that HD 209458 b is in the energy-limited regime, HD 189733 b is in the recombination-limited regime, and GJ 3470 b is in the photon-limited regime. These exoplanets can be considered as benchmark cases for their respective regimes.
Key Words.:
planets and satellites: atmospheres – planets and satellites: gaseous planets – planets and satellites: individual: HD 209458 b – planets and satellites: individual: HD 189733 b – planets and satellites: individual: GJ 3470 b1 Introduction
Understanding the diversity, evolution, and formation of planets requires a profound knowledge of their atmospheric escape. This statement especially applies to planets that, at some stage in their history, experience the most effective atmospheric process of mass loss, the hydrodynamic atmospheric escape (also known as blow-off escape). A planetary atmosphere is in hydrodynamic escape when the absorbed stellar high-energy flux is strong enough to produce substantial heating of the atmosphere, which triggers a massive gas outflow, driving the escaping gas to supersonic bulk velocities. This process can lead from a loss of a fraction of the original atmosphere to its complete removal (see e.g. Baraffe et al., 2004, 2005; Muñoz & Schneider, 2019) and hence can shape the current planetary population (e.g. forming the sub-Jovian desert and the evaporation valley; Owen & Wu, 2013; Lopez & Fortney, 2013). Hydrodynamic escape can also significantly change the composition of the primordial atmospheres and thus affects the planetary mass-radius relationship (see e.g. Hu et al., 2015; Malsky & Rogers, 2020).
Several models have been developed for studying planetary atmospheres undergoing hydrodynamic escape (e.g. Watson et al., 1981; Lammer et al., 2003; Yelle, 2004; Tian et al., 2005; García-Muñoz, 2007; Murray-Clay et al., 2009; Owen & Alvarez, 2016; Salz et al., 2016a; Bourrier & Lecavelier des Etangs, 2013; Shaikhislamov et al., 2020). In particular, Murray-Clay et al. (2009) studied atmospheric mass loss as a function of the incident ultraviolet (UV) flux for a typical hot Jupiter. They found that, under high irradiation, the mass-loss rate was not limited by the radiative energy deposited in the atmosphere, but by the radiation-recombination equilibrium of the escaping gas. When the mass-loss rate is limited by the energy deposition, it scales linearly with the incident UV flux, which is efficiently converted into the work that lifts the gas. When the mass-loss rate is limited by the radiation-recombination equilibrium, it approximately scales to the square root of the incident UV flux since a large fraction of the absorbed energy is lost via radiative cooling. Owen & Alvarez (2016) found that the mass-loss rate of moderately irradiated low gravity planets can be limited by the number of incoming ionising photons, instead of the absorbed energy or the radiation-recombination equilibrium. In this limit, the mass-loss rate scales to the square of the effective absorption radius of the planet. Therefore, it is theoretically possible to identify three distinct hydrodynamic atmospheric escape regimes in hydrogen-dominated atmospheres: energy-limited, recombination-limited, and photon-limited.
This classification is important when using the energy-limited approximation for estimating the planetary mass-loss rate (see e.g. Murray-Clay et al., 2009; Bear & Soker, 2011; Owen & Alvarez, 2016; Salz et al., 2016b; Wang & Dai, 2018). This approach, used together with an average heating efficiency of 10–20% (the most probable range in hydrogen-dominated atmospheres; Shematovich et al., 2014), largely overestimates the mass-loss rate of planets that are in the recombination-limited regime. It might also lead to significantly inaccurate results if applied to atmospheres in the photon-limited regime as the effective absorption radius could differ considerably from the planetary radius. Hence, the applicability of this approach largely depends on the hydrodynamic escape regime.
Despite the central role of hydrodynamic escape regimes, a lack of suitable observations has prevented their confirmation. While Ly absorption measurements are promising tracers of this process, they can only be carried out from space and are adversely affected by interstellar absorption and geocoronal emission. This is not the case for the recent observations of the He i 23S–23P triplet transitions111At wavelengths 10832.06, 10833.22, and 10833.31 Å in a vacuum; it is often referred to as their air wavelengths of 10830 Å., hereafter He(23S) transitions; they provide new opportunities to explore the hydrodynamic atmospheric escape because these lines can be observed with ground-based telescopes and they are not affected by interstellar absorption (e.g. Spake et al., 2018; Nortmann et al., 2018; Allart et al., 2018). Some examples of how these measurements help to better characterise the escaping atmospheres of gas giants were provided by Allart et al. (2018), Mansfield et al. (2018), Lampón et al. (2020, 2021), and Shaikhislamov et al. (2020).
In this work we study the hydrodynamic escape regimes of the giant planets HD 209458 b, HD 189733 b, and GJ 3470 b. The hot Jupiters HD 209458 b and HD 189733 b undergo hydrodynamic escape, as shown by the detection of heavy species escaping in large amounts, such as O i and C ii in HD 209458 b as reported by Vidal-Madjar et al. (2004) and O i in HD 189733 b as documented by Ben-Jaffel & Ballester (2013). GJ 3470 b also undergoes hydrodynamic escape as the outflow bulk radial velocities derived from the He(23S) measurements far exceed the sound speed (see Sect. 4.1.3 of Lampón et al., 2021). These planets have different bulk parameters and stellar irradiation levels, which makes studying their escape regimes very interesting.
The letter is organised as follows. In Sect. 2 we discuss the three regimes that have been theoretically proposed as well as the parameters required to distinguish between them: the ratio of recombination to advection rates and, equivalently, the heating efficiency. In Sect. 3 we summarise the previous modelling and analysis of the three planets on which the calculations of these parameters have been based. In Sect. 4 we present the results and discussion, and in Sect. 5 we provide a summary and our main conclusions.
2 Criteria to differentiate the hydrodynamic atmospheric escape regimes
Physically, the three regimes can be distinguished by the production and losses of neutral H (see Murray-Clay et al., 2009; Bear & Soker, 2011; Owen & Alvarez, 2016) as well as by the conversion of the absorbed stellar radiative energy into the work that drives the escape (see Murray-Clay et al., 2009; Salz et al., 2016b).
2.1 Ratio of recombination to advection rates
The steady-state continuity equation of neutral H species, H0, can be expressed as (see Appendix A)
| (1) |
where is the distance from the centre of the planet; is the bulk radial velocity of the gas; and are the mole fractions of H0 and the ionised H, H+, respectively; n is the H+ number density; and and are the H recombination and photo-ionisation rates. We define the recombination production rate as P = and the advection rate as P = .
Similarly, and like Owen & Alvarez (2016), we consider the ionisation front (IF) as the region where the atmosphere is partially ionised, that is, from the altitude where is close to one – 0.95, where the optical depth of the X-ray and extreme UV (XUV) radiation, , is 1 – up to the altitude where the atmosphere is almost fully ionised – 0.05 and . In this region, the photo-ionisation rate is greater than the recombination rate and advection is non-negligible.
Following Murray-Clay et al. (2009) and Owen & Alvarez (2016), we characterise the different hydrodynamic atmospheric escape regimes as follows: (1) In the recombination-limited regime, the IF region is very narrow compared with the scale of the flow. The gas is almost in radiation-recombination equilibrium (i.e. advection is negligible, 1) in practically all of the upper atmosphere. (2) In the photon-limited regime, the photo-ionisation rate is much faster than the recombination rate such that the recombination process is negligible in the whole upper atmosphere and 1. Consequently, the IF region occupies the whole upper atmosphere of the planet. (3) The energy-limited regime is an intermediate case in between the recombination- and the photon-limited regimes. The IF is wide, although it does not encompass the entire flow as in the photon-limited regime. The advection and the recombination rates are non-negligible in the whole upper atmosphere.
2.2 Heating efficiency criterion
Although the ratio of recombination to advection rates provides us with a direct way of determining the hydrodynamic escape regime, it is also useful to look at these ratios from the point of view of heating efficiency, as previously done by several authors. This has the advantage of providing us with better insight into the physical processes behind the escape. The heating efficiency, , is usually defined as the fraction of the absorbed stellar radiative energy, W, which is converted into the kinetic energy of the gas, namely,
| (2) |
where W is the rate of energy lost by photo-ionisation and photo-electron impact processes (as the excitation and ionisation of atoms by collisions with photoelectrons; see e.g. Shematovich et al., 2014) and W is the radiative cooling rate, mostly produced by Ly and free-free emission (Salz et al., 2016b). Thus, W W W represents the energy from the absorbed stellar radiation that is converted into the kinetic energy of the gas species (atoms, ions, and electrons), the so-called thermal heating.
In the energy- and photon-limited regimes, radiative cooling is moderate or negligible, while in the recombination-limited regime it is a considerable fraction of the absorbed energy. If radiative cooling is neglected, the heating efficiency of stellar XUV radiation is about 0.1–0.2 in hydrogen-dominated planetary upper atmospheres (see e.g. Shematovich et al., 2014; Salz et al., 2016b). Consequently, the heating efficiency of the energy-limited and the photon-limited regimes is expected to be in the range of 0.1–0.2. In contrast, the heating efficiency of the recombination-limited regime is expected to be much less than 0.1 (see e.g. Salz et al., 2016b).
3 Recombination and advection rates and heating efficiencies
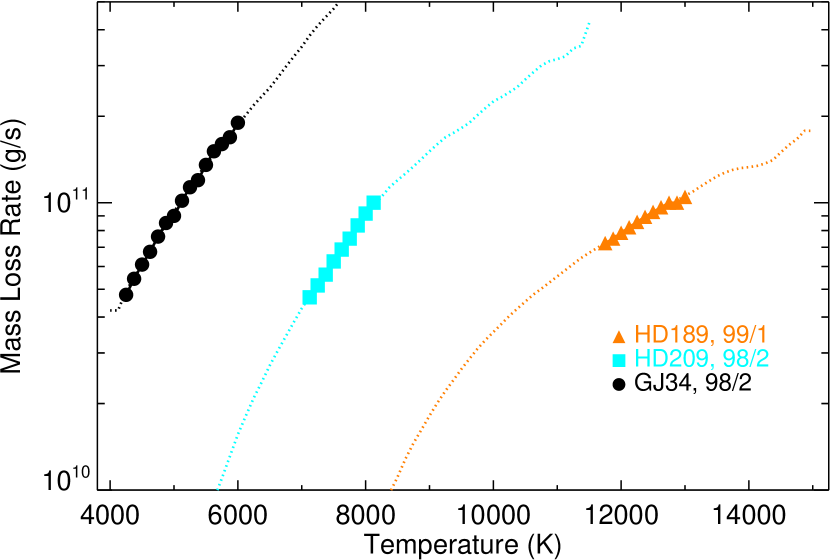
The recombination and advection rates of H0 and the heating efficiencies analysed here are based on the modelling of the observations of the He(23S) absorption of HD 209458 b, HD 189733 b, and GJ 3470 b that were performed by Lampón et al. (2020, 2021). They used a 1D hydrodynamic model with a non-local thermodynamic equilibrium treatment for the He(23S) state, and, by comparing the simulated and observed He(23S) absorption, they derived well-constrained relationships and narrow intervals between the mass-loss rate, , and the temperature, , in the upper atmosphere of these exoplanets. Additionally, by comparing the H0 density distribution with those derived from Ly measurements, they constrained the H/He mole-fraction ratio.
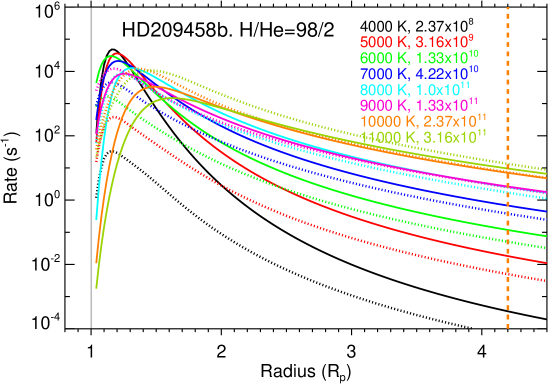
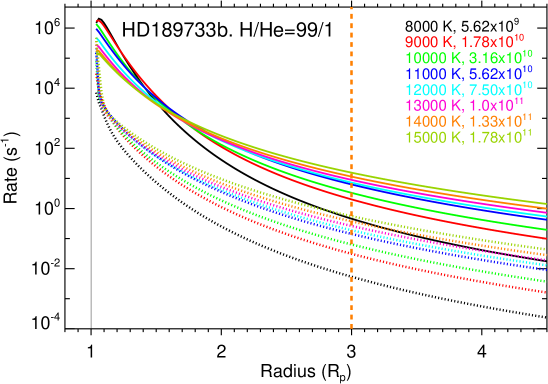
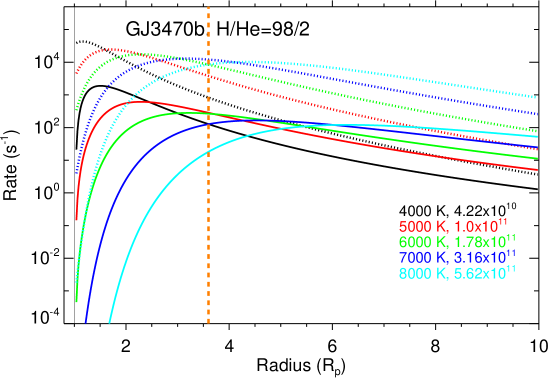
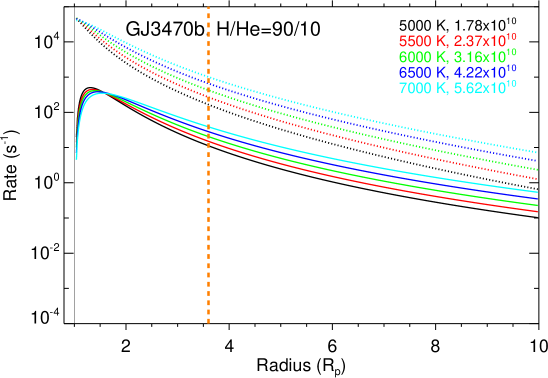
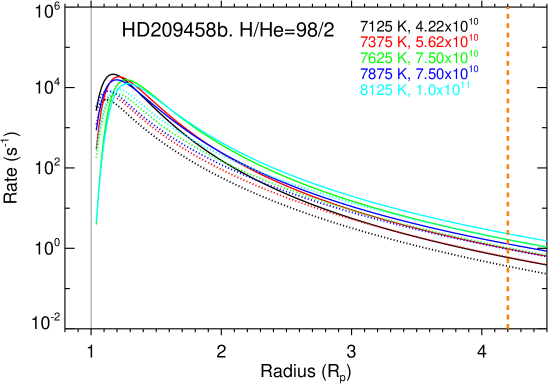
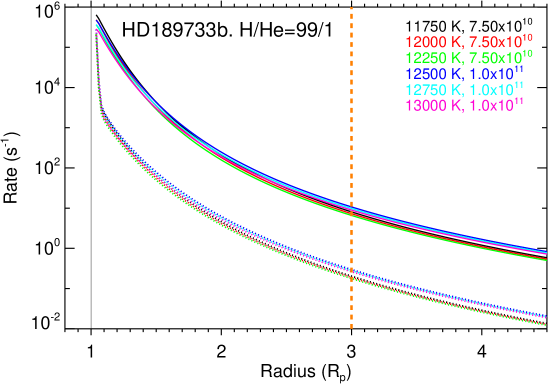
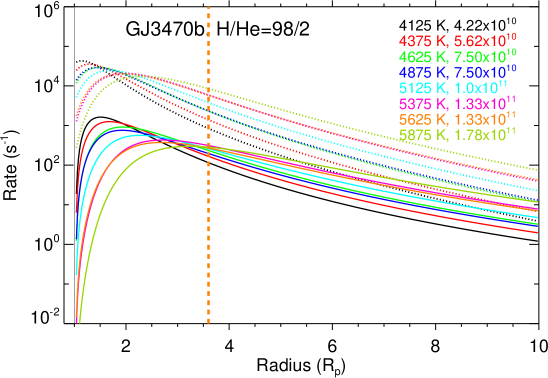
The He(23S) production is controlled by electron concentration via recombination with He+ as well as by electron collision excitation of He(11S) (see Oklopčić & Hirata, 2018; Lampón et al., 2020). As electrons are predominantly produced by the photo-ionisation of H and lost by advection and H+ recombination, the He(23S) concentration profile is thus mainly controlled by the H production and loss rates. Therefore, by constraining the He(23S) concentration profile, as was done by Lampón et al. (2020, 2021), we simultaneously constrain the production and loss rates of H. Hence, in this work we analysed the production and loss rates of H corresponding to the - ranges and H/He ratios of 99/1 for HD 189733 b and 98/2 for HD 209458 b and GJ 3470 b, which were previously obtained by Lampón et al. (2020, 2021) and are summarised in Fig. 1.
4 Results and discussion
In this section we discuss the hydrodynamic escape regimes on the basis of the H0 and H+ distributions as well as on the basis of the heating efficiencies for the three planets.
4.1 Structure, production, and losses of the neutral H
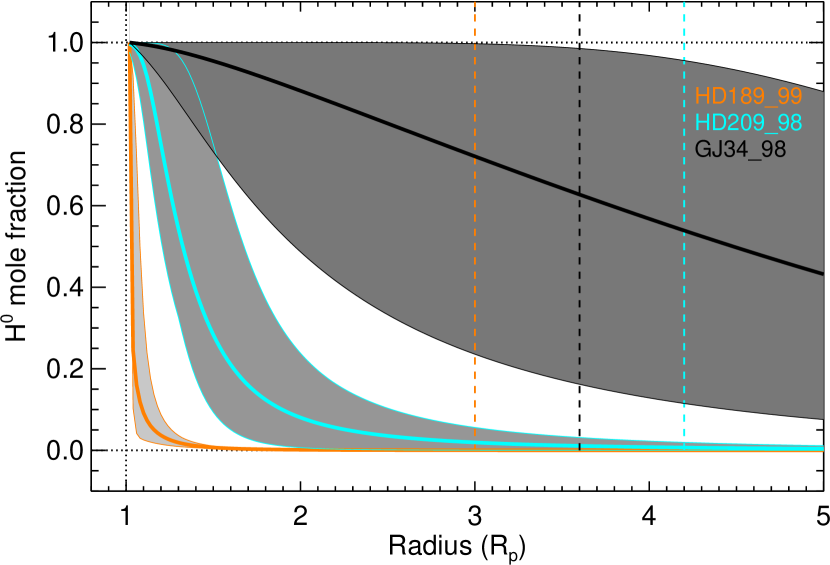
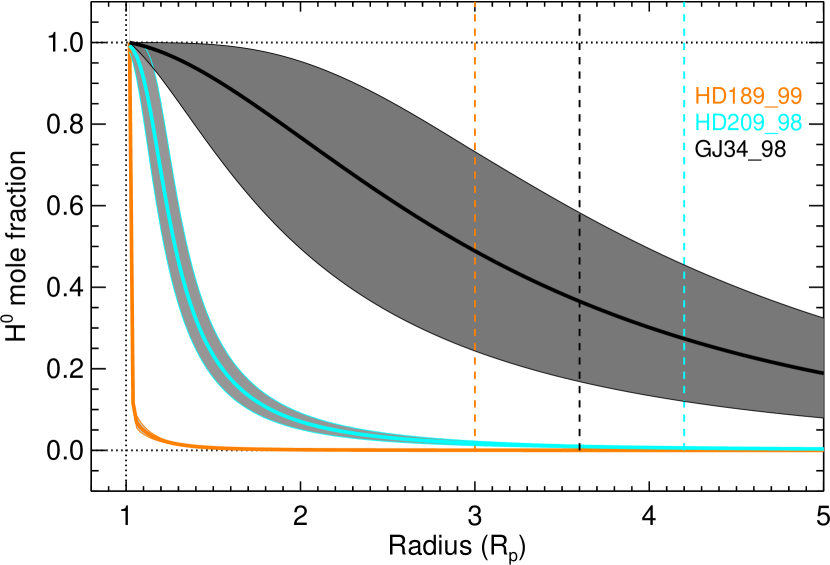
The H0 mole fractions that result from the derived – ranges (see the symbols in Fig. 1) are shown in Fig. 2. The profiles for HD 189733 b show a very narrow IF; it is confined at the lower boundary (set at 1.02 for all three planets), well below its Roche lobe, which is located at 3.0 . Accordingly, this planet shows a wide, fully ionised region. In contrast, GJ 3470 b shows a very extended IF, from about 1.2 to far beyond its Roche lobe at 3.6 . Therefore, no atmospheric region of GJ 3470 b is fully ionised. The H0 structure of HD 209458 b shows a relatively wide IF, extending from the lower boundary to about 2.3 , which is below its Roche lobe (at 4.2 ); this IF is thus wider than that of HD 189733 b and narrower than that of GJ 3470 b. Therefore, as in HD 189733 b, there is a region that is almost fully ionised below the Roche lobe, although it is narrower than the corresponding region in HD 189733 b.
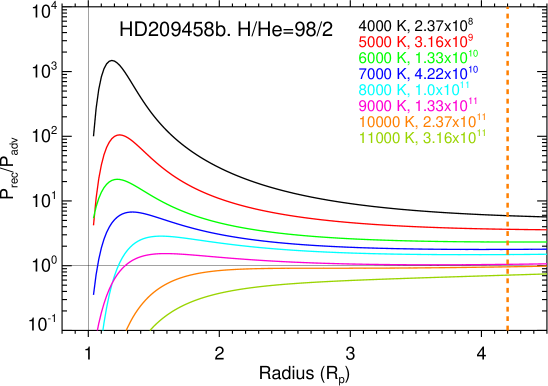
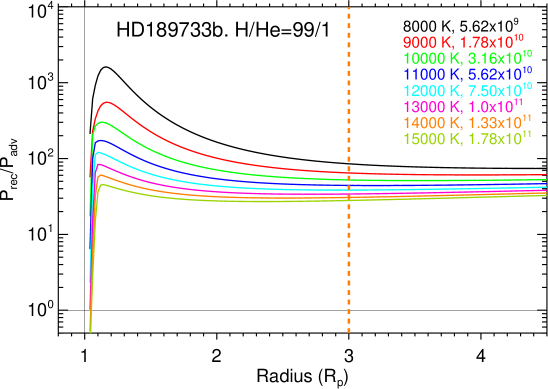
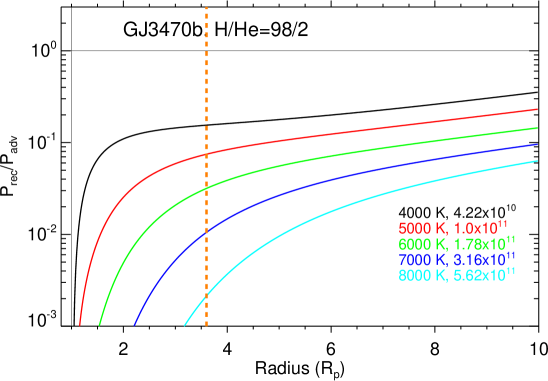
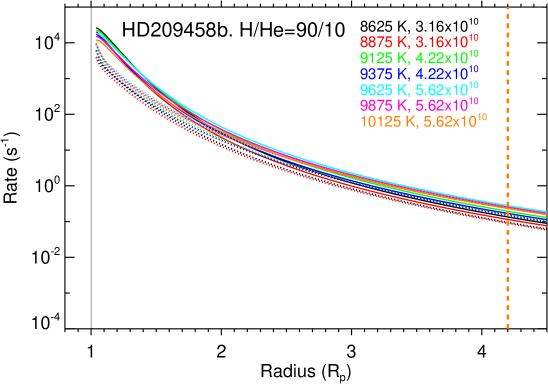
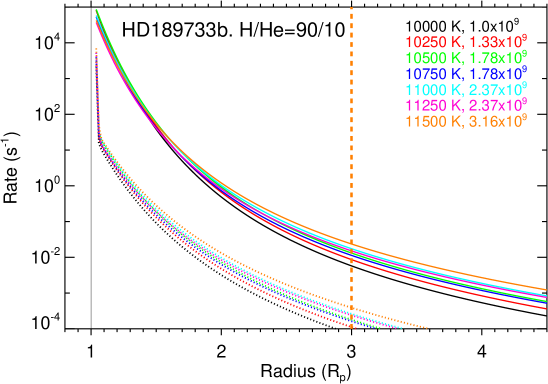
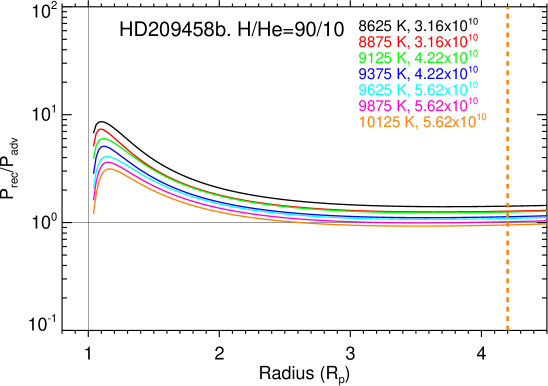
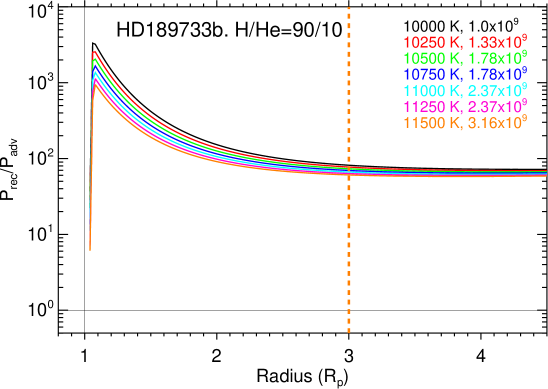
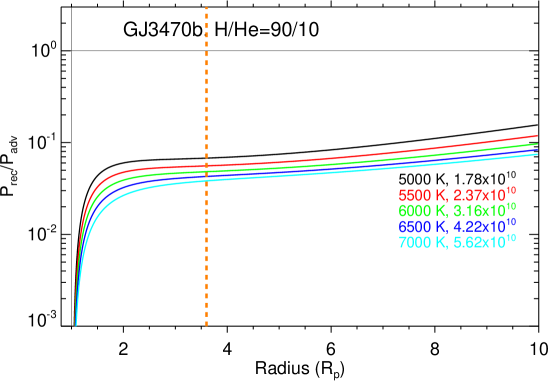
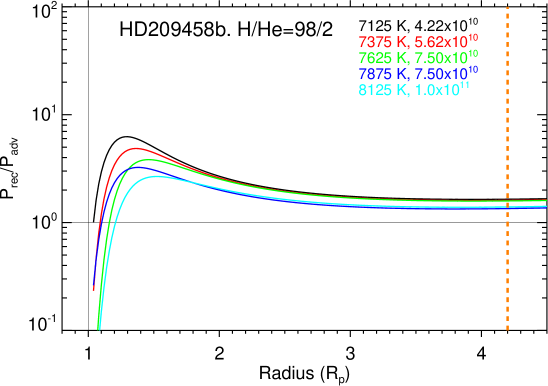
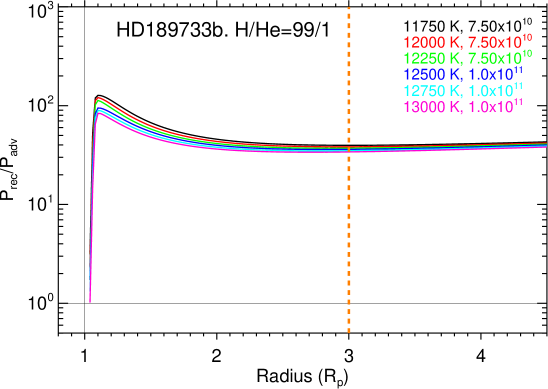
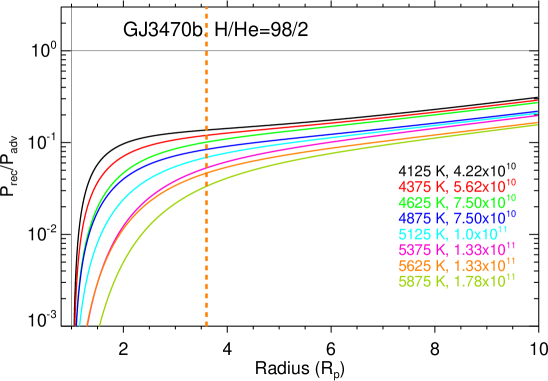
Figure 3 shows the ratio of recombination to advection terms, P/P, for the derived – range of the measured He(23S) and Ly absorption spectra for HD 209458 b, HD 189733 b, and GJ 3470 b (see Fig. 1). For the case of HD 189733 b, recombination dominates in practically the whole upper atmosphere. In contrast, the H0 density is dominated by advection in the whole upper atmosphere of GJ 3470 b. In HD 209458 b, the H0 density is dominated by advection (P/ P 1) in the lower part of the IF, but by recombination (P/ P 1) in the upper part of the IF and above. That is, neither advection nor recombination rates are negligible in the upper atmosphere of HD 209458 b. Hence, according to the criteria discussed in Sect. 2.1, these results show that HD 189733 b is in the recombination-limited regime, GJ 3470 b is in the photon-limited regime, and HD 209458 b is in the energy-limited regime.
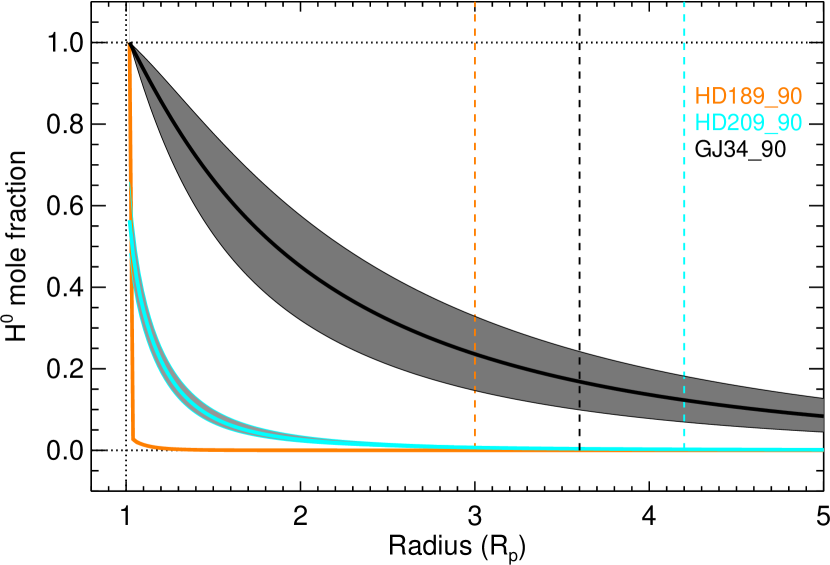
We also analysed other plausible – values beyond the derived interval, hereafter the ‘extended’ – range (see the dotted lines in Fig. 1). These – values are still compatible with the measured He(23S) and Ly absorption; however, they are less likely as they yield a higher . With this, we aim to determine if they would affect the classification with respect to the escape regime. Figures 5 and 7 show the results for the P/P ratios and the corresponding H0 mole fractions, respectively. We found that the extended – ranges for HD 189733 b and GJ 3470 b exhibit the same behaviour as that of the corresponding derived – ranges (see Fig. 3). In contrast, production terms for HD 209458 b at temperatures below 7000 K (see Fig. 5) are at the limit between the energy-limited and recombination-limited regimes, with advection becoming less important relative to recombination. However, when comparing the H density profiles for these conditions with those derived from the Ly measurements by García-Muñoz (2007), Koskinen et al. (2013), and Salz et al. (2016a), we found that the H0 density profiles are significantly smaller. We thus conclude that the hydrodynamic regimes discussed above for the three planets are not altered when considering the extended – ranges. We find that the classification of the escape regimes also remains unchanged in these exoplanets if the commonly used H/He fraction of 90/10 is assumed instead of the ratios derived from He(23S) and Ly transmission spectroscopy (see Figs. 6 and 8).
For HD 189733 b, we used an XUV flux that accounts for several small flares to provide an average model of active and non-active periods (see Sect. 3.2 in Lampón et al., 2021). In order to explore the hydrodynamic regime of this planet in quiescent stages, we conducted a test using the XUV flux from the X-exoplanets model in Sanz-Forcada et al. (2011), which is about a factor of three smaller than the one used here. We found that the hydrodynamic regime remains recombination-limited despite such a considerable XUV flux decrease.
4.2 Heating efficiencies
To calculate the heating efficiencies of the upper atmospheres of the planets, we followed the method from Salz et al. (2016b). Essentially, we used the relationship between the heating efficiency, , and the mass-loss rate for the energy-limited approximation, (Watson et al., 1981; Erkaev et al., 2007), together with the relationship / = 4/5 derived by Salz et al. (2016b) to obtain
| (3) |
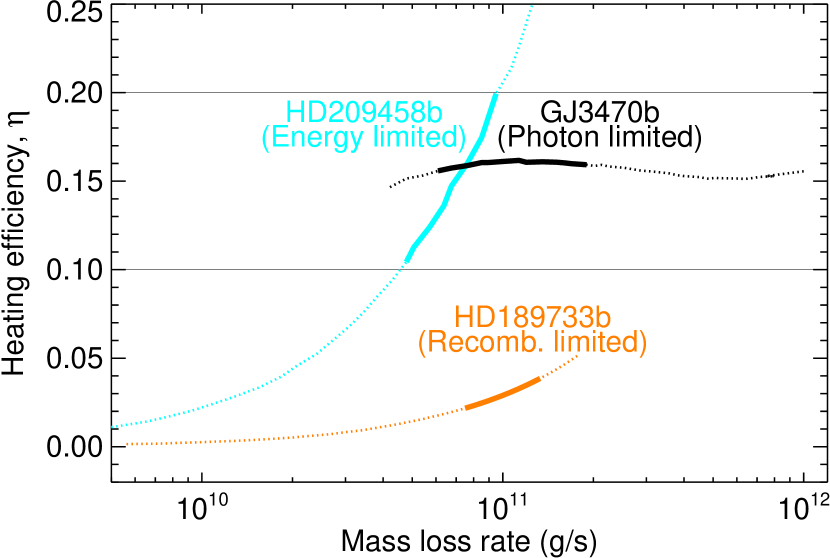
where and are the planetary mass and radius, respectively; is the XUV stellar flux at the planetary orbital separation; is the effective absorption radius, the altitude where the XUV optical depth is unity; and is the gravitational constant. Here, = 1–1.5 is the potential energy reduction factor, with = , where is the planetary orbital separation and the stellar mass. Therefore, taking the and obtained from the He(23S) measurements and the required system parameters from Table 1, we calculated their corresponding values (see Fig. 4). The values are taken from Fig. 1 (ranges limited by the symbols), and the values are 1.02 for HD 189733 b (i.e. the lower boundary), about 1.16–1.30 for HD 209458 b, and about 1.38–2.46 for GJ 3470 b.
As shown by the thick lines in Fig. 4, reaches high values in HD 209458 b and GJ 3470 b but remains very low ( 0.04) for HD 189733 b. This indicates that HD 189733 b is in the recombination-limited regime, as predicted (e.g. by Salz et al., 2016b).
We note that the derived – range for HD 209458 b was obtained by limiting the heating efficiency to the range of 0.1–0.2 (Lampón et al., 2020), as shown in Fig. 4. Values of 0.1 would indicate a recombination-limited regime (see Sect. 2.2). However, they correspond to temperatures below T 7000 K, which, as discussed in Sect. 4.1, were discarded on the basis of Ly observations. This as well as the heating efficiency argument led us to conclude that HD 209458 b is not in the recombination-limited regime.
Heating efficiency remains almost constant with in GJ 3470 b, in contrast to HD 209458 b. As the upper atmosphere of GJ 3470 b is highly extended, an increase in implies higher (i.e. a higher planetary XUV cross-section), which prevents from increasing. The fact that is nearly constant is equivalent to stating that R (see Eq. 3), which, according to Owen & Alvarez (2016), indicates that GJ 3470 b is in the photon-limited regime.
5 Summary
Several theoretical studies have identified three distinct hydrodynamic atmospheric escape regimes in hydrogen-dominated planetary atmospheres: energy-limited, recombination-limited, and photon-limited. In addition to the importance from a theoretical point of view, the classification of the hydrodynamic escape regimes has important consequences for the estimation of the mass-loss rate by models based on the energy-limited approach. However, no evidence of these regimes had been reported to date.
In this work, we studied the recombination to advection rates of the upper atmospheric H obtained in a previous analysis of the measured absorption spectrum of the He i triplet lines at 10830 Å and Ly of HD 189733 b, HD 209458 b, and GJ 3470 b, which was performed by Lampón et al. (2020, 2021). Furthermore, based on these results, we also calculated the heating efficiencies, following Salz et al. (2016b).
We found that in HD 189733 b the neutral H production is governed by recombination in the whole upper atmosphere, giving rise to a very narrow IF. In contrast, advection dominates the neutral H density in the entire upper atmosphere of GJ 3470 b, leading to a very extended IF. HD 209458 b is an intermediate case between HD 189733 b and GJ 3470 b: The advection and the recombination processes are non-negligible, which forms a relatively extended IF.
The derived heating efficiencies for HD 209458 b and GJ 3470 b are similar to those expected from heating via photoelectrons, while those of HD 189733 b are much lower. Therefore, HD 209458 b and GJ 3470 b show little loss by radiative cooling, in contrast to HD 189733 b. Additionally, we found that R in GJ 3470 b, which leads to a nearly constant heating efficiency in the range of 0.15–0.17. Following two criteria, one based on the productions and losses of the neutral H and the other based on energy balance considerations, we have shown that HD 189733 b is in the recombination-limited regime, GJ 3470 b is in the photon-limited regime, and HD 209458 b is in the energy-limited regime.
Our analysis involves a series of important model assumptions, such as the use of 1D models without an explicit solution of the energy budget equation and assumed lower boundary conditions. We have shown that these assumptions do not significantly affect the derived bulk properties, such as thermospheric temperatures, mass-loss rates, radial velocities, H/He ratios, and, in particular, the recombination and advection rates. Consequently, we are confident that our analysis of measured He(23S) and Ly absorption provides robust evidence for the existence of the three theoretically predicted hydrodynamic escape regimes in hydrogen-dominated atmospheres. Accordingly, HD 209458 b, HD 189733 b, and GJ 3470 b can be considered as benchmark cases for their respective regimes.
Acknowledgements.
We thank the referee for very useful comments. CARMENES is an instrument for the Centro Astronómico Hispano-Alemán (CAHA) at Calar Alto (Almería, Spain), operated jointly by the Junta de Andalucía and the Instituto de Astrofísica de Andalucía (CSIC). CARMENES was funded by the Max-Planck-Gesellschaft (MPG), the Consejo Superior de Investigaciones Científicas (CSIC), the Ministerio de Economía y Competitividad (MINECO) and the European Regional Development Fund (ERDF) through projects FICTS-2011-02, ICTS-2017-07-CAHA-4, and CAHA16-CE-3978, and the members of the CARMENES Consortium (Max-Planck-Institut für Astronomie, Instituto de Astrofísica de Andalucía, Landessternwarte Königstuhl, Institut de Ciències de l’Espai, Institut für Astrophysik Göttingen, Universidad Complutense de Madrid, Thüringer Landessternwarte Tautenburg, Instituto de Astrofísica de Canarias, Hamburger Sternwarte, Centro de Astrobiología and Centro Astronómico Hispano-Alemán), with additional contributions by the MINECO, the Deutsche Forschungsgemeinschaft through the Major Research Instrumentation Programme and Research Unit FOR2544 “Blue Planets around Red Stars”, the Klaus Tschira Stiftung, the states of Baden-Württemberg and Niedersachsen, and by the Junta de Andalucía. We acknowledge financial support from the Agencia Estatal de Investigación of the Ministerio de Ciencia, Innovación y Universidades and the ERDF through projects ESP2016–76076–R, ESP2017–87143–R, BES–2015–074542, PID2019-110689RB-I00/AEI/10.13039/501100011033, PGC2018-099425–B–I00, PID2019-109522GB-C51/2/3/4, PGC2018-098153-B-C33, AYA2016-79425-C3-1/2/3-P, ESP2016-80435-C2-1-R, and the Centre of Excellence “Severo Ochoa” and “María de Maeztu” awards to the Instituto de Astrofísica de Canarias (SEV-2015-0548), Instituto de Astrofísica de Andalucía (SEV-2017-0709), and Centro de Astrobiología (MDM-2017-0737), and the Generalitat de Catalunya/CERCA programme. T.H. acknowledges support from the European Research Council under the Horizon 2020 Framework Program via the ERC Advanced Grant Origins 832428. A.S.L. acknowledges funding from the European Research Council under the European Union’s Horizon 2020 research and innovation program under grant agreement No 694513.References
- Agol et al. (2010) Agol, E., Cowan, N. B., Knutson, H. A., et al. 2010, ApJ, 721, 1861
- Allart et al. (2018) Allart, R., Bourrier, V., Lovis, C., et al. 2018, Science, 362, 1384
- Baluev et al. (2015) Baluev, R. V., Sokov, E. N., Shaidulin, V. S., et al. 2015, MNRAS, 450, 3101
- Baraffe et al. (2005) Baraffe, I., Chabrier, G., Barman, T. S., et al. 2005, A&A, 436, L47
- Baraffe et al. (2004) Baraffe, I., Selsis, F., Chabrier, G., et al. 2004, A&A, 419, L13
- Bear & Soker (2011) Bear, E. & Soker, N. 2011, MNRAS, 414, 1788
- Ben-Jaffel & Ballester (2013) Ben-Jaffel, L. & Ballester, G. E. 2013, A&A, 553, A52
- Bonfils et al. (2012) Bonfils, X., Gillon, M., Udry, S., et al. 2012, A&A, 546, A27
- Bourrier & Lecavelier des Etangs (2013) Bourrier, V. & Lecavelier des Etangs, A. 2013, A&A, 557, A124
- Bourrier et al. (2018) Bourrier, V., Lecavelier des Etangs, A., Ehrenreich, D., et al. 2018, A&A, 620, A147
- de Kok et al. (2013) de Kok, R. J., Brogi, M., Snellen, I. A. G., et al. 2013, A&A, 554, A82
- Eggleton (1983) Eggleton, P. P. 1983, ApJ, 268, 368
- Erkaev et al. (2007) Erkaev, N. V., Kulikov, Y. N., Lammer, H., et al. 2007, A&A, 472, 329
- García-Muñoz (2007) García-Muñoz, A. 2007, Planetary and Space Science, 55, 1426
- Hu et al. (2015) Hu, R., Seager, S., & Yung, Y. L. 2015, ApJ, 807, 8
- Koskinen et al. (2013) Koskinen, T., Harris, M., Yelle, R., & Lavvas, P. 2013, Icarus, 226, 1678
- Lammer et al. (2003) Lammer, H., Selsis, F., Ribas, I., et al. 2003, ApJ, 598, L121
- Lampón et al. (2020) Lampón, M., López-Puertas, M., Lara, L. M., et al. 2020, A&A, 636, A13
- Lampón et al. (2021) Lampón, M., López-Puertas, M., Sanz-Forcada, J., et al. 2021, A&A, 647, A129
- Lopez & Fortney (2013) Lopez, E. D. & Fortney, J. J. 2013, ApJ, 776, 2
- Malsky & Rogers (2020) Malsky, I. & Rogers, L. A. 2020, ApJ, 896, 48
- Mansfield et al. (2018) Mansfield, M., Bean, J. L., Oklopčić, A., et al. 2018, ApJ, 868, L34
- Muñoz & Schneider (2019) Muñoz, A. G. & Schneider, P. C. 2019, ApJ, 884, L43
- Murray-Clay et al. (2009) Murray-Clay, R. A., Chiang, E. I., & Murray, N. 2009, ApJ, 693, 23
- Nortmann et al. (2018) Nortmann, L., Palle, E., Salz, M., et al. 2018, Science, 362, 1388
- Oklopčić & Hirata (2018) Oklopčić, A. & Hirata, C. M. 2018, ApJ, 855, L11
- Owen & Alvarez (2016) Owen, J. E. & Alvarez, M. A. 2016, ApJ, 816, 34
- Owen & Wu (2013) Owen, J. E. & Wu, Y. 2013, ApJ, 775, 105
- Pallé et al. (2020) Pallé, E., Nortmann, L., Casasayas-Barris, N., et al. 2020, A&A, 638, A61
- Salz et al. (2016a) Salz, M., Czesla, S., Schneider, P. C., & Schmitt, J. H. M. M. 2016a, A&A, 586, A75
- Salz et al. (2016b) Salz, M., Schneider, P. C., Czesla, S., & Schmitt, J. H. M. M. 2016b, A&A, 585, L2
- Sanz-Forcada et al. (2011) Sanz-Forcada, J., Micela, G., Ribas, I., et al. 2011, A&A, 532, A6
- Shaikhislamov et al. (2020) Shaikhislamov, I. F., Khodachenko, M. L., Lammer, H., et al. 2020, MNRAS, staa2367
- Shematovich et al. (2014) Shematovich, V. I., Ionov, D. E., & Lammer, H. 2014, A&A, 571, A94
- Spake et al. (2018) Spake, J. J., Sing, D. K., Evans, T. M., et al. 2018, Nature, 557, 68
- Tian et al. (2005) Tian, F., Toon, O. B., Pavlov, A. A., & De Sterck, H. 2005, ApJ, 621, 1049
- Torres et al. (2008) Torres, G., Winn, J. N., & Holman, M. J. 2008, ApJ, 677
- Vidal-Madjar et al. (2004) Vidal-Madjar, A., Désert, J.-M., des Etangs, A. L., et al. 2004, ApJ, 604, 69
- Wang & Dai (2018) Wang, L. & Dai, F. 2018, ApJ, 860, 175
- Watson et al. (1981) Watson, A. J., Donahue, T. M., & Walker, J. C. 1981, Icarus, 48, 150
- Yelle (2004) Yelle, R. V. 2004, Icarus, 170, 167
Appendix A The steady-state continuity equation of neutral H
The hydrodynamic continuity equation of mass can be expressed as
| (4) |
where ; and are the number densities of H and He, respectively; and and are the atomic masses of H and He, respectively. Assuming that (hereafter H/He) is constant with respect to , then . Therefore, , where , is constant. As such, the mass-loss rate can be expressed as
| (5) |
The continuity equation of H0 can be written as
| (6) |
and, deriving, as
| (7) |
Taking from Eq. 5 and re-arranging Eq. A.4, we have
| (8) |
Taking into account that
| (9) |
and including it in Eq. 8, we obtain
| (10) |
Assuming = , and re-arranging Eq. 10, we finally obtain Eq. 1.
Appendix B Other tables and figures
In Table 1 we provide the most relevant system parameters used in our calculations. In Figs. 5 to 8 we show ratios of recombination to advection and H0 mole fraction profiles for the extended – ranges (dotted lines in Fig. 1) as well as for the H/He composition of 90/10 (see the symbols in Fig. 5 of Lampón et al. 2021).
| System | HD 209458 | HD 189733 | GJ 3470 |
|---|---|---|---|
| M⋆ (M⊙) (a) | 1.119 | 0.846 | 0.476 |
| (au) (b) | 0.04707 | 0.0332 | 0.0348 |
| M (M) (c) | 0.685 | 1.162 | 0.036 |
| (R) (c) | 1.359 | 1.23 | 0.360 |
| () (d) | 0.504 | 0.944 | 0.100 |
| R () (e) | 4.2 | 3.0 | 3.6 |
| FXUV (f) | 2.358 | 56.740 | 3.928 |