Critical dynamics and phase transition of a strongly interacting warm spin-gas
Abstract
Phase transitions are emergent phenomena where microscopic interactions drive a disordered system into a collectively ordered phase. Near the boundary between two phases, the system can exhibit critical, scale-invariant behavior. Here, we report on a second-order phase transition accompanied by critical behavior in a system of warm cesium spins driven by linearly-polarized light. The ordered phase exhibits macroscopic magnetization when the interactions between the spins become dominant. We measure the phase diagram of the system and observe the collective behavior near the phase boundaries, including power-law dependence of the magnetization and divergence of the susceptibility. Out of equilibrium, we observe a critical slow-down of the spin response time by two orders of magnitude, exceeding five seconds near the phase boundary. This work establishes a controlled platform for investigating equilibrium and nonequilibrium properties of magnetic phases.
I Introduction
Investigation of correlated states of matter and their macroscopic phases are at the frontier of inter-disciplinary physical research. The macroscopic phase of interacting particles is determined by an interplay between the energy and the entropy of the system. When the entropy dominates, the system becomes disordered whereas, for energy dominated system, the ordered phase dominates as it minimizes the free energy [1, 2]. Various phases are commonly described by macroscopic order-parameters such as density, conductivity, or magnetization. The transition between different phases is commonly accompanied by non-analytic behavior of some properties of the system, e.g., the susceptibility, correlation length, and time. These non-analytic properties are often associated with critical exponents, which can be categorized into universality classes that depend only on robust properties, such as the dimensionality and symmetries of the system [1, 2, 3]. Although first discussed in the context of equilibrium statistical mechanics, phase transitions with characteristic critical exponents commonly appear also in driven, non-equilibrium systems, and the properties of these transitions are often quite different from those of equilibrium systems [4, 5].
Spin systems are used as key examples for magnetic phase transitions as they are often relatively easy to study [6, 7, 8, 9, 10]. In condensed matter systems, strong interactions between neighboring spins can overcome their entropy and consequent with ordered magnetic phases, as manifested in the rich phase diagrams of a wide range of materials and temperatures [11, 12, 13, 14]. In gaseous systems in contrast, the particles typically interact sporadically, leading to prevalence of entropy over the interaction energy and consequent with a magnetically disordered phase. Only at ultra-cold temperatures in which entropy is sufficiently low and quantum effects become dominant, atomic gases can exhibit magnetically ordered phase [15, 16]. As atomic gases feature both long spin lifetimes and high degree of control by optical means, they have prominent applications in physical studies of equilibrium and non-equilibrium critical phenomena [17, 18, 19, 20]. However, non-trivial phases of optically controlled spin gases at ambient conditions have never been characterized.
The specific system we study in this manuscript is a vapor of neutral alkali atoms, above room temperature. These atoms have a nonzero spin at their electronic ground level and could thus sustain steady magnetization. The spin, a composite of the electronic and nuclear spins, can be prepared, controlled, and monitored by optical means utilizing the strong spin-orbit coupling provided by the single valence electron [21, 22]. Frequent spin-exchange collisions between pairs of atoms in the vapor manifest a local spin-dependent interaction. This interaction often leads to decoherence and relaxation [23] but can also enable coherent coupling and facilitate optical pumping and sensing in various applications [24, 25, 26, 27, 28, 29, 30, 31, 32, 33, 34, 35, 36]. In particular, a pioneering work by Forston et al. has demonstrated the emergence of spontaneous spin-polarization and magnetic bi-stability upon absorption of linearly-polarized light [37, 38, 39]. Forston et al. have characterized the spin state by measuring the hysteresis appearing for slow variation of the light polarization. However, the critical and collective behavior at the conditions where spontaneous polarization occurs has not been systematically studied.
Here, we report on the observation of critical behavior of strongly interacting, warm cesium vapor. We measure the power-law dependence of the macroscopic magnetization on both the light intensity and gas density, as well as divergence of the susceptibility to an external spin imbalance. We identify these phenomena as a second-order magnetic phase transition and measure the phase diagram of the system. We observe divergence of the spin response time up to a few seconds when crossing the phase transition, two orders of magnitude longer than the millisecond spin lifetime. Furthermore, we observe a nine-fold improvement of the collective-spin lifetime near the phase boundary. Finally, we discuss interesting potential avenues for this accessible platform, including the exploration of new phases in gaseous systems, simulations of magnetic phenomena, and applications to quantum magnetic sensing.
II Results
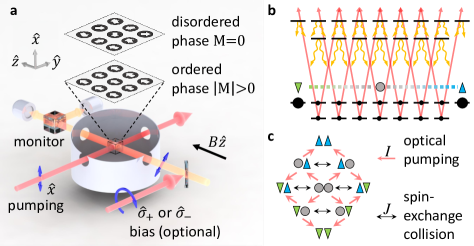
Figure 1 presents the physical system. The cesium atoms, enclosed in a glass cell at near-ambient temperature, are unpolarized in the absence of optical fields. In this magnetically disordered phase, the cesium spins equally populate all 16 sub-states of the electronic ground level. To stimulate the transition into an ordered phase, we introduce linearly-polarized pumping light and increase the atomic density. The quantization axis is set by an external magnetic field. We tune the optical frequency of the pumping light near the optical transition from the lower hyperfine manifold () and set its polarization perpendicular to . This configuration aligns the spins along [38]. It preferentially and symmetrically populates the two maximally-polarized states (with spin projection along , in the upper hyperfine manifold ), marked by triangles in Fig. 1(b). It does so at a rate linearly proportional to the intensity of the optical field (see Methods).
We maintain a constant temperature , which we can vary in the range of . The temperature sets the vapor pressure, originating from a reservoir (droplet) of cesium atoms, allowing us to control the atomic density and thus to determine the rate of spin-exchange collisions . During a collision, the electronic spins of the two colliding atoms experience random, mutual precession, which conserves the total spin. The collisions change the internal atomic spin states, generate correlations between the atoms, and repopulate the lower hyperfine manifold. They comprise the microscopic inter-atomic interaction in our system necessary for the formation of an ordered phase. The interplay between optical pumping and spin-exchange collisions, leading to an alignment of the spins, is schematically illustrated in Fig. 1c for the case of two atoms. It is important to note that the system does not reach equilibrium, but rather a non-equilibrium steady state, as there is a constant flow of energy from the pumping light through the system to the surrounding environment, which breaks the detailed balance condition.
The cell also contains buffer gas that renders the atomic motion diffusive, yielding an average spin relaxation rate that is limited by collisions with the walls (see Methods). We monitor the macroscopic magnetization of the vapor using Faraday rotation measurements of off-resonant probe light [21, 40].
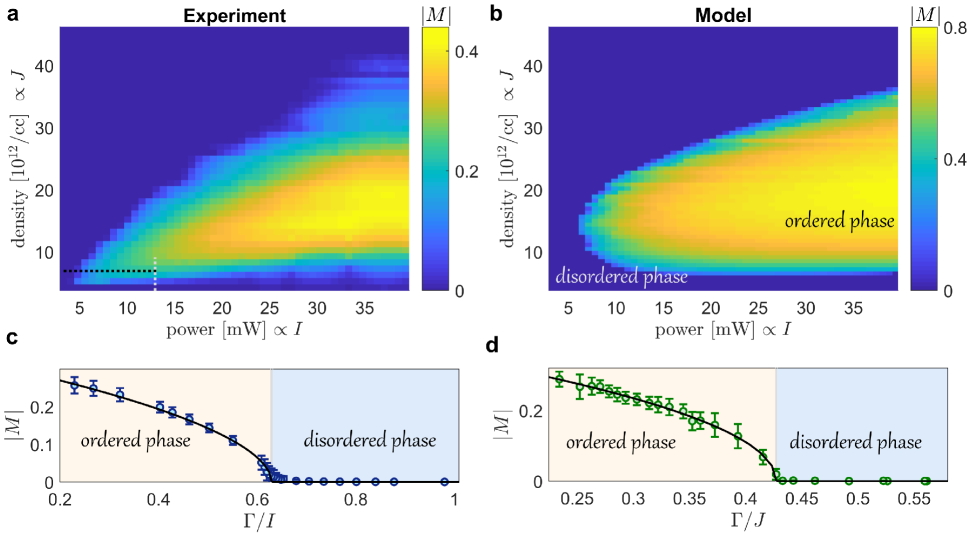
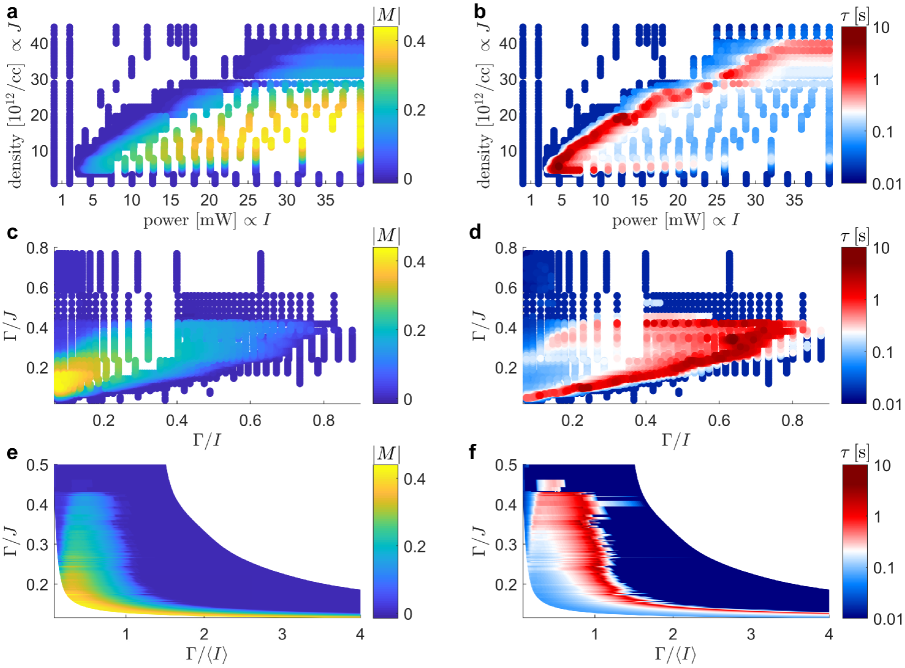
The cesium vapor becomes magnetized in the experiment for a range of collision rates and optical pumping (spin alignment) rates . The spins then end up pointing either at the direction of the magnetic field () or opposite to it (), with the sign varying randomly between experimental realizations. The measured absolute magnetization of the vapor at steady state is shown in Fig. 2a as a function of the pumping power and collision rate, which are respectively proportional to and . We find a well-defined region in which the spins are ordered and . We reach a magnetization as high as in the ordered phase, where unity corresponds to maximal magnetization (all spins in the vapor maximally oriented along ).
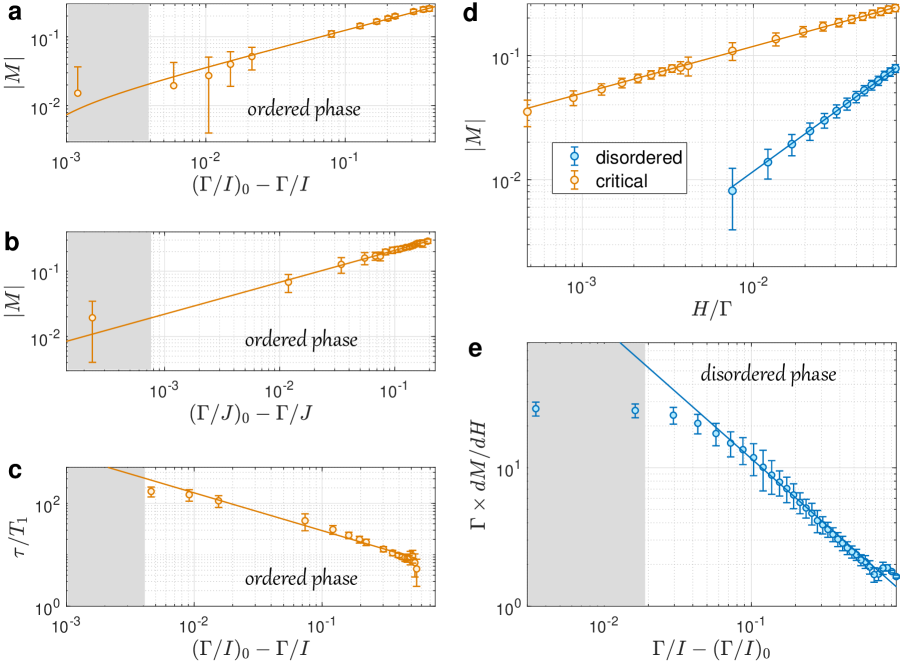
For other values of and , the spins remain in a disordered phase with vanishing net magnetization in each realization. In Figs. 2c and 2d, we present the magnetization as a function of and along two contours crossing the phase boundary (marked by dashed lines in Fig. 2a). We observe a critical dependence of the magnetization near the transition between the disordered and ordered phases. The continuous but sharp transition of the magnetization, which acts as an order parameter, indicates that the process is associated with a second-order phase transition. The data fits well to power-law functions with critical exponents and (see Methods).
One might expect that the magnetization only increases with the collision rate . However, as clearly evident in Figs.2a, the magnetization decreases for large , i.e., at elevated atomic densities. This is a result of the attenuation of the pumping light along the medium at high densities, which decreases the spatially-averaged spin-alignment rate below the critical value. Moreover, even when the spin-alignment rate is high, the critical behavior might be compromised by the large spatial inhomogeneity (along the axis) due to this attenuation at elevated densities. Finally, at high pump powers, off-resonant excitation of the maximally-polarized states becomes a dominant relaxation mechanism of the magnetization. Together, these factors limit the parameter range at which we expect to observe the phase transition in our system. Nevertheless within a range of around the conditions highlighted in Fig. 2, we find that the critical exponents vary with standard deviations of and . These are extracted from horizontal and vertical cuts of Fig. S1e, which takes into account the attenuation of the spin-alignment rate at elevated densities.
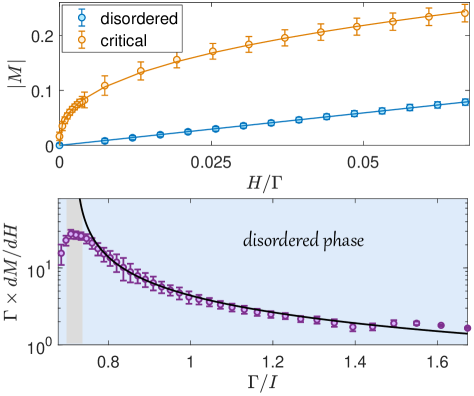
To further explore the critical behavior near the boundary between the two phases, we measure the dependence of the magnetization on an external bias. The bias towards positive or negative is introduced by an auxiliary optical beam with circular polarization or , respectively, see Fig. 1a. The magnitude of the bias is given by the optical pumping rate , which is linear in the bias beam’s intensity. In Fig. 3a, we present the steady absolute magnetization as a function of near the phase boundary at (orange circles) compared with the disordered phase at (blue circles). In the disordered phase, the steady magnetization is determined by and, for a weak bias, grows linearly as (blue line). Importantly, the linear dependence of the magnetization on the bias beam’s intensity is a universal property of weak resonant optical-pumping of uncorrelated atoms, independent of the transition strength or the particular atomic species. In contrast, near the phase boundary, we find a critical dependence of the magnetization on the bias beam, with a much sharper response. We fit the data to the power-law function and find the critical exponent . The deviation from the standard optical-pumping relation indicates the emergence of correlations between the atoms.
Next, we measure the susceptibility function near , which determines the response of the system to a small external bias. Figure 3b presents as a function of at . We observe a striking increase of the susceptibility by more than an order of magnitude near the phase transition. Fitting to a divergent power-law function, we find the critical exponent (see Methods). The power-law dependence of the magnetization and the divergence of the susceptibility near the phase boundary testify for the critical behavior of a magnetic, second-order phase transition.
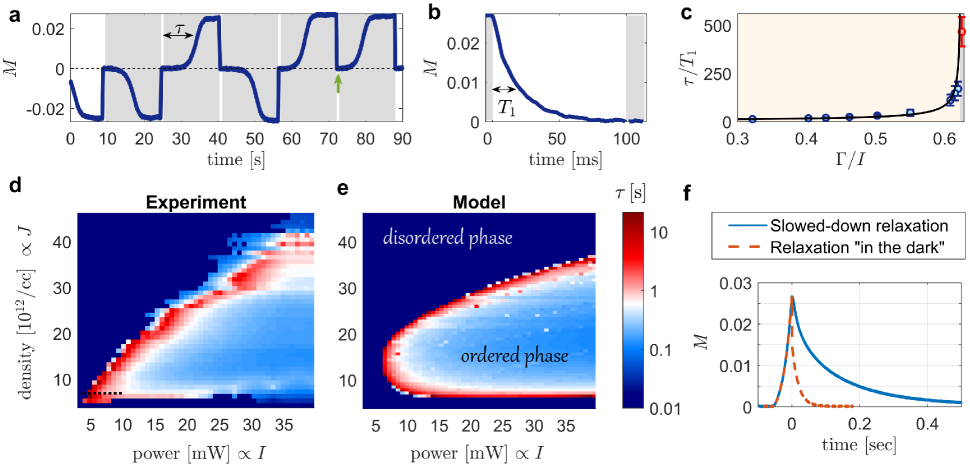
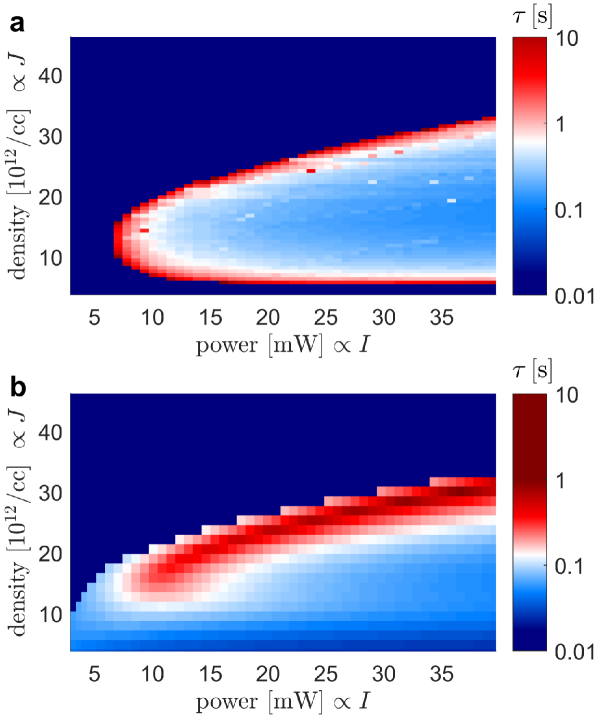
Second-order phase transitions exhibit critical, scale-invariant behavior even out of equilibrium. Here we explore the dynamical transition from a disordered to an ordered phase by temporally varying in a pulsed waveform. We add no bias and use a fixed , for which the critical value of is . For , a magnetization initially at builds up to a finite steady value, randomly in either of the two directions. Figure 4a shows an example of the measured magnetization subject to a periodic sequence of pumping pulses (gray areas) tuned slightly above . We observe a slowdown of the polarization process, with an average response time of seconds. Between the pumping pulses (white areas), the magnetization rapidly vanishes, with a decay rate corresponding to the spin lifetime in the dark ( ms at that temperature), as shown in Fig. 4b. Importantly, as absorption of photons contributes to the spin relaxation, the response time of uncorrelated spins by resonant optical pumping is always shorter than their lifetime in the dark . In contrast, here near the phase boundary, becomes longer than by a remarkable factor of 460. The observed response time varies between the pulses due to the critical nature of the phenomenon, and nevertheless, it is always at least two orders of magnitude larger than .
The slow down of the spin response time is a critical phenomenon associated with the phase transition. Figure 4c shows the dependence of on along the contour crossing the phase boundary (dashed line in Fig. 2a and Fig. 4d). We observe a divergence of near and find the critical exponent by fitting to a divergent power-law function (see Methods). The critical exponent varies with a standard deviation of within a range of around . The spin response time diverges at the entire phase boundary, as shown in Fig. 4d. The observation of a critical divergence of the response time (Fig. 4d) near the boundary of the ordered phase (Fig. 2a) attests to the collective nature of the phase transition.
Finally, in addition to the elongation of the spin buildup time discussed above, one expects near the phase transition boundary an elongation of the spin relaxation time. We explore this by first initializing the spins in the ordered phase (using a strong circularly-polarized beam) and subsequently monitoring the spin relaxation in the presence of a linearly-polarized light slightly below the phase transition, i.e., in the disordered-phase region near the phase boundary. We compare the relaxation near the phase boundary (Fig. 4f, solid blue line) to the standard relaxation away from the boundary (Fig. 4f, dashed orange line). Fitting the data to a decaying exponent, we find that the slowed-down relaxation time ms is longer by a factor of nine than the lifetime in the dark ms at the same temperature.
To model the observed phenomena, we employ a nonlinear mean-field model that describes the evolution of the density matrix of the mean cesium spin in the vapor. The theoretical model, described in Methods, captures the main features of the emergent phase transition, including the bi-stability, the power-law dependencies, and the divergence of the susceptibility and the spin response time. In Figs. 2b and 4e, we present the numerically calculated phase diagram and the spin response time, which agree with the measured results reasonably well.
III Discussion
In summary, we observe a magnetic phase transition of warm cesium atoms stimulated by linearly-polarized light and by frequent spin-exchange collisions. We characterize the phase diagram, reveal a critical power-law behavior near the phase transition, and observe a critical slow-down of the spin response time. The substantial deviation of our observations from standard experiments, in which the atoms are uncorrelated, testifies for the collective nature of the ordered phase and the transition.
This work opens new avenues for studying correlated phases in gaseous systems at ambient conditions. First, it is remarkable that a simple optical driving affecting each spin independently renders the inter-particle interactions dominant over the gas entropy, resulting in an emerging correlated phase. It would be interesting to explore optical-driving techniques that can enhance this dominance further in various atomic and molecular gases, potentially resulting in correlated phases at elevated temperatures. Engineering the range of interactions between the spins is a second avenue, which could lead to nontrivial spatial correlations in the gas and potentially to the formation of spatial domains, e.g., via the Kibble-Zurek mechanism. The critical exponents we measured fall into the universality class of mean-field models [1] (cf. Table 1) due to rapid diffusion of the atoms. In our system, the atoms diffuse on a short time scale (), thus enabling spin-exchange interaction between initially distant atoms and effectively rendering the range of the interaction long. Slowing down the diffusion (e.g., by increasing the buffer-gas pressure) can reduce the interaction range. A third avenue can exploit the long spin coherence of the gas to explore other possible nonequilibrium phases. For example, a periodic variation of the magnetic field combined with the effectively long-range interaction between the spins can potentially make the system resilient to disorder (e.g. in the magnetic field or the beam intensity) and drive the system into a time-crystalline phase.
The new platform can potentially be utilized in applications such as sensing and spin simulators. Warm atomic spins are useful sensors as they strongly couple to light and have long coherence times (up to hundreds of milliseconds) and a large number of particles at or above room-temperature [41]. These sensors often measure the response of the spins to small external fields using optical means. Divergence of the spins’ response to external fields near the phase boundary can considerably enhance the signal over the noise up to the standard quantum limit (which is typically hard to reach). For example, the critical behaviour observed in Fig. 3 enables enhanced detection of the optical polarization and circularity of the beam with respect to a standard measurement in a disordered phase. Furthermore, longer spin lifetimes often improve the performance of spin sensors, both in transient and in steady-state operation [42]. Therefore, the elongation of the spin lifetime near the phase boundary, which is optically controllable, can potentially improve sensing performance.
Simulation of complex many-body phenomena and computation of optimization problems utilize various platforms, such as ultracold atomic gases and coupled laser arrays. These simulators consist of a network of spins, whose evolution under a controllable interaction Hamiltonian is studied. The new platform can be employed in several configurations for constructing efficient networks in a relatively simple setup at room temperature. One configuration can use a large but thin vapor cell, illuminated by a wide beam whose optical polarization is spatially modulated. In such a network, spin-exchange and diffusion lead to interaction between neighboring domains, each initialized in a correlated ordered phase, whereas the light modulation enables local engineering of the desired interaction Hamiltonian. Other configurations can use arrays of miniature cells, each acting as a single computational spin, and an array of optical beams for the network linkage, exploiting the strong bi-directional coupling between spins and light which is enhanced near the phase boundary. The long spin lifetimes of this platform could be particularly interesting in simulations of out-of-equilibrium phenomena such as anomalous thermal relaxations in magnetic systems [43, 44, 45, 46, 47] as well as in computation of a wide class of optimization problems [48, 49, 50].
| Exponent | Measured value | Mean-field value | Relation |
|---|---|---|---|
| 0.5 | |||
| 0.5 | |||
| 3 | |||
| 1 | |||
| 1 |
Acknowledgements.
We acknowledge financial support by the estate of Emile Mimran, the Israel Science Foundation, the US-Israel Binational Science Foundation (BSF) and US National Science Foundation (NSF), the Minerva Foundation with funding from the Federal German Ministry for Education and Research, the Shlomo and Michla Tomarin career development chair, the Abramson Family Center for Young Scientists, and the Laboratory in Memory of Leon and Blacky Broder. This research was facilitated by the Talpiot Program 18-19-30-36.Methods
Detailed experimental setup
We use a cubic borosilicate glass cell of length mm containing cesium vapor, and a buffer-gas mixture of and neon, Torr each. These gases slow down the diffusion of cesium atoms to the cell walls, and the additionally enables the non-radiative decay (quenching) of electronically-excited cesium atoms. The buffer gases broaden the cesium optical lines to (HWHM), yet the four optical transitions of the line remain resolved. We heat the cell using high-frequency electrical current at 390 kHz flowing through high-resistance twisted-pair wires in a custom oven. We control the magnetic field in the cell using three pairs of Helmholtz coils and set a constant magnetic field of along . The coils are located within four -metal layers, shielding the cell from external magnetic fields.
The linearly-polarized pumping beam originates from a free-running DBR diode laser at 895 nm. The laser frequency is blue-detuned by from the optical transition. We control the beam power using a commercial noise-eater consisting of a liquid crystal, polarizing beam splitter, and a photodetector. The beam then passes through a mechanical shutter and a high-quality linear polarizer, which sets the polarization of the beam to be linear along , and finally through a waveplate mounted on a precision, computer-controlled rotating mount. For most of the experiments, the fast axis of the waveplate is carefully aligned with the direction of the linear polarization, unaffecting the linear polarization of light. Nevertheless, when needed, rotation of the waveplate enables rapid calibration of the maximal magnetization within the experimental sequence (as detailed below). The Gaussian beam is then expanded to a radius of cm to cover the entire cell area and enter the cell in the direction. We measure the magnetization in a set of measurements varying the vapor density in the range of and the optical intensity of the pumping field in the range of .
We monitor the magnetization using a -polarized, -mW probe beam that propagates along . The beam originates from another free-running DBR diode laser at 895 nm. It has a Gaussian profile with radius of cm, covering much of the atoms in the cell. The beam is blue-detuned by from the lines to avoid photon absorption. It probes the -component of the electron spin of the gas via Faraday rotation. The beam then goes into a balanced polarimetry setup, which outputs a signal proportional to the magnetization along .
The bias beam originates from a third free-running DBR diode-laser at 895 nm, whose power is controlled by an acusto-optic modulator and a commercial intensity noise-eater. A waveplate renders the polarization of the beam circular, and it is combined with the probe beam using a non-polarizing beam splitter, as shown in Fig. 1. The beam has a Gaussian profile with radius of cm. It is 1.2-GHz blue-detuned from the transition for the critical behavior experiments, and it is set to resonance with the for calibration experiments.
Our measurements are found sensitive both to the detuning of the pumping beam and to the magnitude of the magnetic field. Drift in the detuning predominantly affects the rate , while drift in the magnetic field was found to vary the spin response time. Therefore, both quantities are monitored and kept constant during the experiment.
Experimental calibrations
The spin lifetime is determined by measuring the decay rate of spins oriented along the magnetic field in the absence of resonant optical fields (measurement in the dark). In this measurement, the spins are first optically pumped by two circularly polarized beams resonant with the and transitions along , then rotated to the axis by a magnetic field pulse, and finally measured with the off-resonant probe while the pumping beams are off. The relaxation rate has a small, linear dependence on the cell’s temperature, satisfying in the tested range (), predominantly due to the temperature dependence of the diffusion coefficient of the cesium atoms. In the entire analysis and figures, we use the constant value . Furthermore, in the measured and simulated response-time data (Figs. 4d,e), we set for all measurements where the spin response was smaller than of the maximal measured magnetization.
The spin-alignment rate is independently determined by measuring the excess decay rate of the spins in the presence of the pumping beam at . We find a linear dependence on the intensity of the beam , with a ratio . Note that the local spin-alignment rate varies across the profile of the pumping beam, and therefore we always refer to an average rate across the beam. The pumping beam is also attenuated along the propagation direction () due to absorption by the atoms. The -dependent spin-alignment rate is therefore given by where is the vapor density and is the absorption cross-section of the beam.
The spin-exchange rate is independently determined by a measurement of the relaxation of the spins transverse to the magnetic field, in the absence of resonant optical fields. In this measurement, we weakly pump the spins along , apply a magnetic field along , and monitor the precession of the spins, decaying at a decoherence rate . At each temperature, we determine the spin-exchange rate from the measured relaxation at high magnetic field and by subtracting the effect of other field-independent relaxations [26, 51]. Here is the numerical slow-down factor that accounts for the reduction of the rate by coupling to the nuclear spin [26].
The bias rate is independently determined by measuring the magnetization as a function of the intensity of the bias (circularly-polarized) beam. We fit the measured magnetization to the function with and determine the linear coefficient .
As we increase the temperature of the cell to increase , the vapor density, and therefore the number of gaseous spins in the cell, increase as well. We thus calibrate for the maximal polarization of the vapor at each temperature to properly determine the magnetization , which describes the portion of polarized spins in the gas. For that, we use two strong circularly polarized beams that cover the entire cell and optically pump the spins along . We then turn the beams off and apply a magnetic field along that stimulates the precession of the spins. The precession amplitude corresponds to the maximal signal obtained by our probe beam, which is identified as the maximal polarization and used to calibrate the magnetization in the experiments.
The residual circularity of the polarization of the pumping field is automatically zeroed within each experimental sequence by applying the same technique as in the spin-exchange rate calibration for varying waveplate angles around the known optimal point. Since the waveplate is mounted on a precision, computer-controlled rotating mount, we automatically repeat this process until the procession amplitude is minimal. This ensures the beam has a minimal circular polarization.
Critical behavior
Near the phase boundary, the data exhibit power-law dependence with critical exponents. Here we describe the fitting procedure we use to determine these exponents.
We determine the critical exponent by fitting the data in Fig. 2c to the function and . For proper fitting, we first estimate the initial guess for and by fixing the value of one parameter and fitting for the other and use those results for the final fit. For (black horizontal dashed line in Fig. 2a), we find the critical exponent and the critical spin-alignment rate . Similarly, we determine the critical exponent by fitting the data in Fig. 2d to the function and . For (white vertical dashed line in Fig. 2a), We find the critical exponent and the critical spin-exchange rate .
We determine the critical exponent by fitting the measured susceptibility in Fig. 3b to the function in the disordered phase for . As with the critical exponent fitting, we first estimate the initial guess for and by fixing the value of one parameter and fitting for the other and use those results for the final fit. We also exclude points that are close to the maximal measured one and use weights in order to compensate for the finite values of the data around the critical point compared with the divergent values of the model. For , we find the critical exponent and the critical spin-alignment rate in the disordered phase.
We determine the critical exponent by fitting the spin response time in Fig. 4c to the power-law function . We fit the functions to 11 measurements in the range of exchange rates (equivalent to ) in order to comprehend the deviation of the model parameters. As before, we use a three-step fitting scheme, exclude points that are close to the maximal measured one, and use weights. We then find the critical exponent and the critical spin-alignment rate .
Spin-alignment by linearly polarized light
The linearly-polarized pumping light resonantly interacts with the optical transition . As the electric field is perpendicular to the magnetic field, upon absorption of a photon, the atom is excited and its spin projection along the magnetic field changes by either or . Importantly, this interaction preferably increases the absolute spin projection [37]. An atom with would preferably be excited while increasing its spin to , and, symmetrically, an atom with would preferably decrease its spin to . This preference is quantified in Table 2, which presents the probability for changing the ground-level spin projection by absorption of a linearly-polarized photon. The on-average increase of drives the spins towards either or , thus generating symmetric alignment.
| 0 | 1/2 | 1/2 | 0 |
| 1 | 15/21 | 6/21 | 9/21 |
| 2 | 7/8 | 1/8 | 6/8 |
| 3 | 28/29 | 1/29 | 27/29 |
Theoretical model
We implement a mean-field model describing the dynamics of the mean density matrix of a single atom in the vapor, following the model by Happer et al. [21]. The density matrix
| (3) |
consists of the 16 spin state in the ground level denoted by , the 16 spin states in the excited level denoted by , and the optical-coherence matrices between the two and . We describe the evolution of the density matrix by solving the non-linear Liouville equation
| (4) |
is the spin Hamiltonian of an alkali atom. Both ground () and excited-level () Hamiltonians consist of the hyperfine interaction and the interaction with a magnetic field, predominantly of the electron spin . Here denotes the electronic spin operator and denotes the nuclear spin operator. We use and in , and we use and in . The second term in Eq. (4) describes the atom-photon interaction , coupling the oscillating electric field of the optical pumping field with the atomic dipole operator . The term denotes the Doppler shift due to the finite velocity of that atom. The third term describes the coupling of the spins to other degrees of freedom via radiative or collisional channels in the ground and excited levels , as well as dephasing of the optical coherences at a rate .
Rapid collisions with buffer-gas atoms increase significantly (pressure broadening) with respect to both the spontaneous emission rate and the Rabi frequency of the optical pumping fields. In a frame rotating near the light frequency at a detuning , the optical coherence is hence maintained in a quasi-steady state, satisfying . The operator denotes the fraction of optical coherence, with accounting for the optical detuning and dephasing of the different transitions. The operation denotes thermal averaging using the Maxwell-Boltzmann distribution, to properly account for Doppler broadening of the optical transition.
Atoms in the excited level experience rapid relaxation, which we model by
| (5) |
The first term denotes de-excitation (quenching) of the population from the excited level to the ground level at a rate , including both spontaneous emission and collisions with molecules. The second term describes the destruction of the electron spin in the excited-level manifold by collisions with buffer gas atoms at a rate . As an approximation, our numerical calculation assumes a quasi-steady-state solution of in Eq. (4), which adiabatically follows the dynamics of the ground-level density matrix . We then numerically solve only the dynamics of the density matrix .
The dynamics of the ground-level density matrix is modeled by
| (6) | ||||
The first term describes the repopulation of the ground level by quenched excited atoms, where is the amplitude of the dipole moment of the optical transition. The second term describes the destruction of the total spin at a rate , predominantly due to diffusion to the cell walls. The last term describes the effect of spin-exchange collisions, affecting the electron spin at a rate . Importantly, the spin-exchange interaction has a nonlinear (quadratic) dependence on the density matrix, since the magnetization of the vapor is given by . The quadratic dependence enables the emergence of bi-stable steady solutions and manifests the correlations induced by different atoms via the exchange interaction. It is therefore crucial for the emergence of the ordered phase and the observed critical phenomena.
We numerically calculate the steady state and the buildup of the magnetization of the vapor by solving Eqs. (4-6) using an initially unpolarized state. We use , , , , , and to model the parameters of the experiment [21]. We run the simulation for a range of 70 vapor densities and 270 optical intensities . In terms of the model parameters, the effective rates used in the main text are given by and . Here , , and the optical depth is given by the measured value at each vapor density.
To alleviate the numerical complexity of the model, we zero the rapidly oscillating hyperfine coherences of at every step of the simulation. This approximation corresponds to the rapid decay of these coherences due to spin-exchange relaxation in the experiment. In the simulations presented in Fig. 2b and Fig. 4e, we further zero the Zeeman coherences of at every step of the simulation to speed up the calculation. Indeed in practice, spin-exchange collisions at a large magnetic field partially relax these coherences. We demonstrate in Supplementary Fig. S3 that the effect of these coherences is limited to variations of the spin response time at the phase boundary at lower densities.
References
- Mermin [1972] N. D. Mermin, Introduction to Phase Transitions and Critical Phenomena. H. Eugene Stanley. Oxford University Press, New York, 1971. xx, 308 pp., illus. International Series of Monographs on Physics, 4034 (American Association for the Advancement of Science, 1972) pp. 502–502, https://science.sciencemag.org/content/176/4034/502.1.full.pdf .
- Ma [1985] S. Ma, Statistical Mechanics (WORLD SCIENTIFIC, 1985).
- Schneider and [Hrsg.] C. D. Schneider, G. M. and M. S. G. (Hrsg.), Phase Transitions and Critical Phenomena, 5 (Academic Press Inc., London, New York, 1973) pp. 380–380, https://onlinelibrary.wiley.com/doi/pdf/10.1002/bbpc.19730770517 .
- Marro and Dickman [2005] J. Marro and R. Dickman, Nonequilibrium phase transitions in lattice models (Cambridge University Press, 2005).
- Henkel et al. [2008] M. Henkel, H. Hinrichsen, S. Lübeck, and M. Pleimling, Non-equilibrium phase transitions, Vol. 1 (Springer, 2008).
- Glauber [1963] R. J. Glauber, Journal of mathematical physics 4, 294 (1963).
- Blundell [2001] S. Blundell, Magnetism in Condensed Matter, Oxford Master Series in Condensed Matter Physics (OUP Oxford, 2001).
- Carrasquilla and Melko [2017] J. Carrasquilla and R. G. Melko, Nature Physics 13, 431 (2017).
- Gyorffy et al. [1985] B. L. Gyorffy, A. J. Pindor, J. Staunton, G. M. Stocks, and H. Winter, Journal of Physics F: Metal Physics 15, 1337 (1985).
- Collins [1989] M. F. Collins, Magnetic critical scattering, Vol. 4 (Oxford University Press, 1989).
- ELMERS [1995] H.-J. ELMERS, International Journal of Modern Physics B 09, 3115 (1995), https://doi.org/10.1142/S0217979295001191 .
- Sato et al. [1996] O. Sato, T. Iyoda, A. Fujishima, and K. Hashimoto, Science 271, 49 (1996), https://science.sciencemag.org/content/271/5245/49.full.pdf .
- Atiq et al. [2015] S. Atiq, M. Javid, S. Riaz, and S. Naseem, Materials Today: Proceedings 2, 5262 (2015), international Conference on Solid State Physics 2013 (ICSSP’13).
- Arajs and Colvin [1964] S. Arajs and R. V. Colvin, Journal of Applied Physics 35, 2424 (1964), https://doi.org/10.1063/1.1702873 .
- Jo et al. [2009] G.-B. Jo, Y.-R. Lee, J.-H. Choi, C. A. Christensen, T. H. Kim, J. H. Thywissen, D. E. Pritchard, and W. Ketterle, Science 325, 1521 (2009), https://science.sciencemag.org/content/325/5947/1521.full.pdf .
- Simon et al. [2011] J. Simon, W. S. Bakr, R. Ma, M. E. Tai, P. M. Preiss, and M. Greiner, Nature 472, 307 (2011).
- Mazurenko et al. [2017] A. Mazurenko, C. S. Chiu, G. Ji, M. F. Parsons, M. Kanász-Nagy, R. Schmidt, F. Grusdt, E. Demler, D. Greif, and M. Greiner, Nature 545, 462 (2017).
- Guardado-Sanchez et al. [2018] E. Guardado-Sanchez, P. T. Brown, D. Mitra, T. Devakul, D. A. Huse, P. Schauß, and W. S. Bakr, Phys. Rev. X 8, 021069 (2018).
- Bernien et al. [2017] H. Bernien, S. Schwartz, A. Keesling, H. Levine, A. Omran, H. Pichler, S. Choi, A. S. Zibrov, M. Endres, M. Greiner, V. Vuletić, and M. D. Lukin, Nature 551, 579 (2017).
- Gross and Bloch [2017] C. Gross and I. Bloch, Science 357, 995 (2017), https://science.sciencemag.org/content/357/6355/995.full.pdf .
- Happer et al. [2010] W. Happer, Y.-Y. Jau, and T. Walker, Optically pumped atoms (John Wiley & Sons, 2010).
- Auzinsh et al. [2010] M. Auzinsh, D. Budker, and S. Rochester, Optically polarized atoms: understanding light-atom interactions (Oxford University Press, 2010).
- Novikova et al. [2012] I. Novikova, R. Walsworth, and Y. Xiao, Laser & Photonics Reviews 6, 333 (2012).
- Chalupczak et al. [2012] W. Chalupczak, R. M. Godun, P. Anielski, A. Wojciechowski, S. Pustelny, and W. Gawlik, Physical Review A 85, 043402 (2012).
- Romalis [2010] M. Romalis, Physical review letters 105, 243001 (2010).
- Happer and Tam [1977] W. Happer and A. C. Tam, Phys. Rev. A 16, 1877 (1977).
- Katz et al. [2019] O. Katz, R. Shaham, and O. Firstenberg, Quantum interface for noble-gas spins (2019), arXiv:1905.12532 [quant-ph] .
- Kominis et al. [2003] I. Kominis, T. Kornack, J. Allred, and M. V. Romalis, Nature 422, 596 (2003).
- Babcock et al. [2003] E. Babcock, I. Nelson, S. Kadlecek, B. Driehuys, L. W. Anderson, F. W. Hersman, and T. G. Walker, Phys. Rev. Lett. 91, 123003 (2003).
- Katz and Firstenberg [2018] O. Katz and O. Firstenberg, Nature Communications 9, 2074 (2018).
- Mouloudakis and Kominis [2021] K. Mouloudakis and I. K. Kominis, Phys. Rev. A 103, L010401 (2021).
- Kong et al. [2020] J. Kong, R. Jiménez-Martínez, C. Troullinou, V. G. Lucivero, G. Tóth, and M. W. Mitchell, Nature communications 11, 1 (2020).
- Katz et al. [2015] O. Katz, O. Peleg, and O. Firstenberg, Phys. Rev. Lett. 115, 113003 (2015).
- Ripka et al. [2018] F. Ripka, H. Kübler, R. Löw, and T. Pfau, Science 362, 446 (2018), https://science.sciencemag.org/content/362/6413/446.full.pdf .
- Wang et al. [2018] T. Wang, D. F. J. Kimball, A. O. Sushkov, D. Aybas, J. W. Blanchard, G. Centers, S. R. O. Kelley, A. Wickenbrock, J. Fang, and D. Budker, Physics of the Dark Universe 19, 27 (2018).
- Katz et al. [2020] O. Katz, R. Shaham, E. S. Polzik, and O. Firstenberg, Phys. Rev. Lett. 124, 043602 (2020).
- Fortson and Heckel [1987] N. Fortson and B. Heckel, Phys. Rev. Lett. 59, 1281 (1987).
- Klipstein et al. [1996] W. M. Klipstein, S. K. Lamoreaux, and E. N. Fortson, Phys. Rev. Lett. 76, 2266 (1996).
- Andalkar et al. [2002] A. Andalkar, R. B. Warrington, M. V. Romalis, S. K. Lamoreaux, B. R. Heckel, and E. N. Fortson, Phys. Rev. A 65, 023407 (2002).
- Mathur et al. [1970] B. S. Mathur, H. Y. Tang, and W. Happer, Phys. Rev. A 2, 648 (1970).
- Kitching et al. [2011] J. Kitching, S. Knappe, and E. Donley, Sensors Journal, IEEE 11, 1749 (2011).
- Degen et al. [2017] C. L. Degen, F. Reinhard, and P. Cappellaro, Rev. Mod. Phys. 89, 035002 (2017).
- Gal and Raz [2020] A. Gal and O. Raz, Physical review letters 124, 060602 (2020).
- Yang and Hou [2020] Z.-Y. Yang and J.-X. Hou, Physical Review E 101, 052106 (2020).
- Klich et al. [2019] I. Klich, O. Raz, O. Hirschberg, and M. Vucelja, Physical Review X 9, 021060 (2019).
- Lu and Raz [2017] Z. Lu and O. Raz, Proceedings of the National Academy of Sciences 114, 5083 (2017).
- Baity-Jesi et al. [2019] M. Baity-Jesi, E. Calore, A. Cruz, L. A. Fernandez, J. M. Gil-Narvión, A. Gordillo-Guerrero, D. Iñiguez, A. Lasanta, A. Maiorano, E. Marinari, et al., Proceedings of the National Academy of Sciences 116, 15350 (2019).
- Inagaki et al. [2016] T. Inagaki, Y. Haribara, K. Igarashi, T. Sonobe, S. Tamate, T. Honjo, A. Marandi, P. L. McMahon, T. Umeki, K. Enbutsu, et al., Science 354, 603 (2016).
- McMahon et al. [2016] P. L. McMahon, A. Marandi, Y. Haribara, R. Hamerly, C. Langrock, S. Tamate, T. Inagaki, H. Takesue, S. Utsunomiya, K. Aihara, et al., Science 354, 614 (2016).
- Takata et al. [2016] K. Takata, A. Marandi, R. Hamerly, Y. Haribara, D. Maruo, S. Tamate, H. Sakaguchi, S. Utsunomiya, and Y. Yamamoto, Scientific reports 6, 1 (2016).
- Katz et al. [2013] O. Katz, M. Dikopoltsev, O. Peleg, M. Shuker, J. Steinhauer, and N. Katz, Physical review letters 110, 263004 (2013).
.