Raining in MKW 3s: a Chandra-MUSE analysis of X-ray cold filaments around 3CR 318.1
Abstract
We present the analysis of X-ray and optical observations of gas filaments observed in the radio source 3CR 318.1, associated with NGC 5920, the Brightest Cluster Galaxy (BCG) of MKW 3s, a nearby cool core galaxy cluster. This work is one of the first X-ray and optical analyses of filaments in cool core clusters carried out using MUSE observations. We aim at identifying the main excitation processes responsible for the emission arising from these filaments. We complemented the optical VLT/MUSE observations, tracing the colder gas phase, with X-ray Chandra observations of the hotter highly ionized gas phase. Using the MUSE observations, we studied the emission line intensity ratios along the filaments to constrain the physical processes driving the excitation, and, using the Chandra observations, we carried out a spectral analysis of the gas along these filaments. We found a spatial association between the X-ray and optical morphology of these filaments, which are colder and have lower metal abundance than the surrounding intra-cluster medium (ICM), as already seen in other BCGs. Comparing with previous results from the literature for other BCGs, we propose that the excitation process that is most likely responsible for these filaments emission is a combination of star formation and shocks, with a likely contribution from self-ionizing, cooling ICM. Additionally, we conclude that the filaments most likely originated from AGN-driven outflows in the direction of the radio jet.
1 Introduction
The Third Cambridge Catalog of radio sources and its revised versions (3C, 3CR, 3CRR, Edge et al. 1959; Bennett 1962; Spinrad et al. 1985; Laing et al. 1983) constitute one of the most valuable samples of radio-loud active galactic nuclei (AGN). In 2018, Balmaverde et al. started the MUse RAdio Loud Emission line Snapshot (MURALES) survey to observe all southern 3CR sources with the Multi-Unit Spectroscopic Explorer (MUSE; Bacon et al. 2010) and enrich the multifrequency coverage of the 3CR catalog.
During the MURALES survey, an optical filamentary structure was detected in 3CR 318.1 (Balmaverde et al. 2019), the brightest cluster galaxy (BCG) of the galaxy cluster MKW 3s (Morgan et al. 1975), in agreement with observations by Edwards et al. (2009). This structure consists of two ionized gas filaments extending 25 kpc in the south and the south-west directions, both with almost constant velocities along their projected lengths (230 km s-1 and 280 km s-1, respectively). The filament that points to the south presents a bright knot at its southern end. In contrast with the typical narrow-line regions seen in other radio galaxies, these filaments extend beyond tens of kiloparsecs and present drastically different emission line ratios (e.g., [O III]/H0.1 instead of the typical value of 10).
Similar filamentary structures were discovered in other BCGs, as NGC 1275 in the center of the Perseus galaxy cluster (Lynds 1970, Conselice et al. 2001 and Fabian et al. 2008), spatially associated with an X-ray excess (Fabian et al., 2011). The same situation occurs for other BCGs, where a tight connection between X-ray and optical filament emission was found (McDonald et al., 2010).
However, the physical processes responsible for the ionization in these optical filaments is still debated. While Voit et al. (1994) proposed ionization due to hot cooling ICM as the excitation mechanism behind these filaments; McDonald et al. (2010), who analyzed a sample of 23 filaments around BGCs, suggested that these types of filaments are due to ICM thermal conduction. In the case of the Perseus cluster, Fabian et al. (2011) rejected this scenario, due to the lack of a thick interface between the cold and hot gas, proposing that the origin of cold X-ray filaments is due to penetration of cold gas by the hot surrounding gas through reconnection diffusion.
Here we present a comparison between optical and X-ray images of 3CR 318.1 to investigate the main ionization processes underlying the origin of these optical filaments, thus focusing only on the first 30 kpc at the center of MKW 3s (for works on the large scale structures see e.g., Mazzotta et al. 2002, 2004 and Bîrzan et al. 2020).
This manuscript is organized as follows. A brief description of 3CR 318.1 is given in § 2. Optical and X-ray data analyses are reported in § 3. Results are presented in § 4 while § 5 is devoted to our conclusions.
Unless otherwise stated, we adopted cgs units for numerical results and assumed a flat cosmology with km s-1 Mpc-1, and (Bennett et al., 2014). Spectral indices, , are defined by flux density, S.
2 3CR 318.1
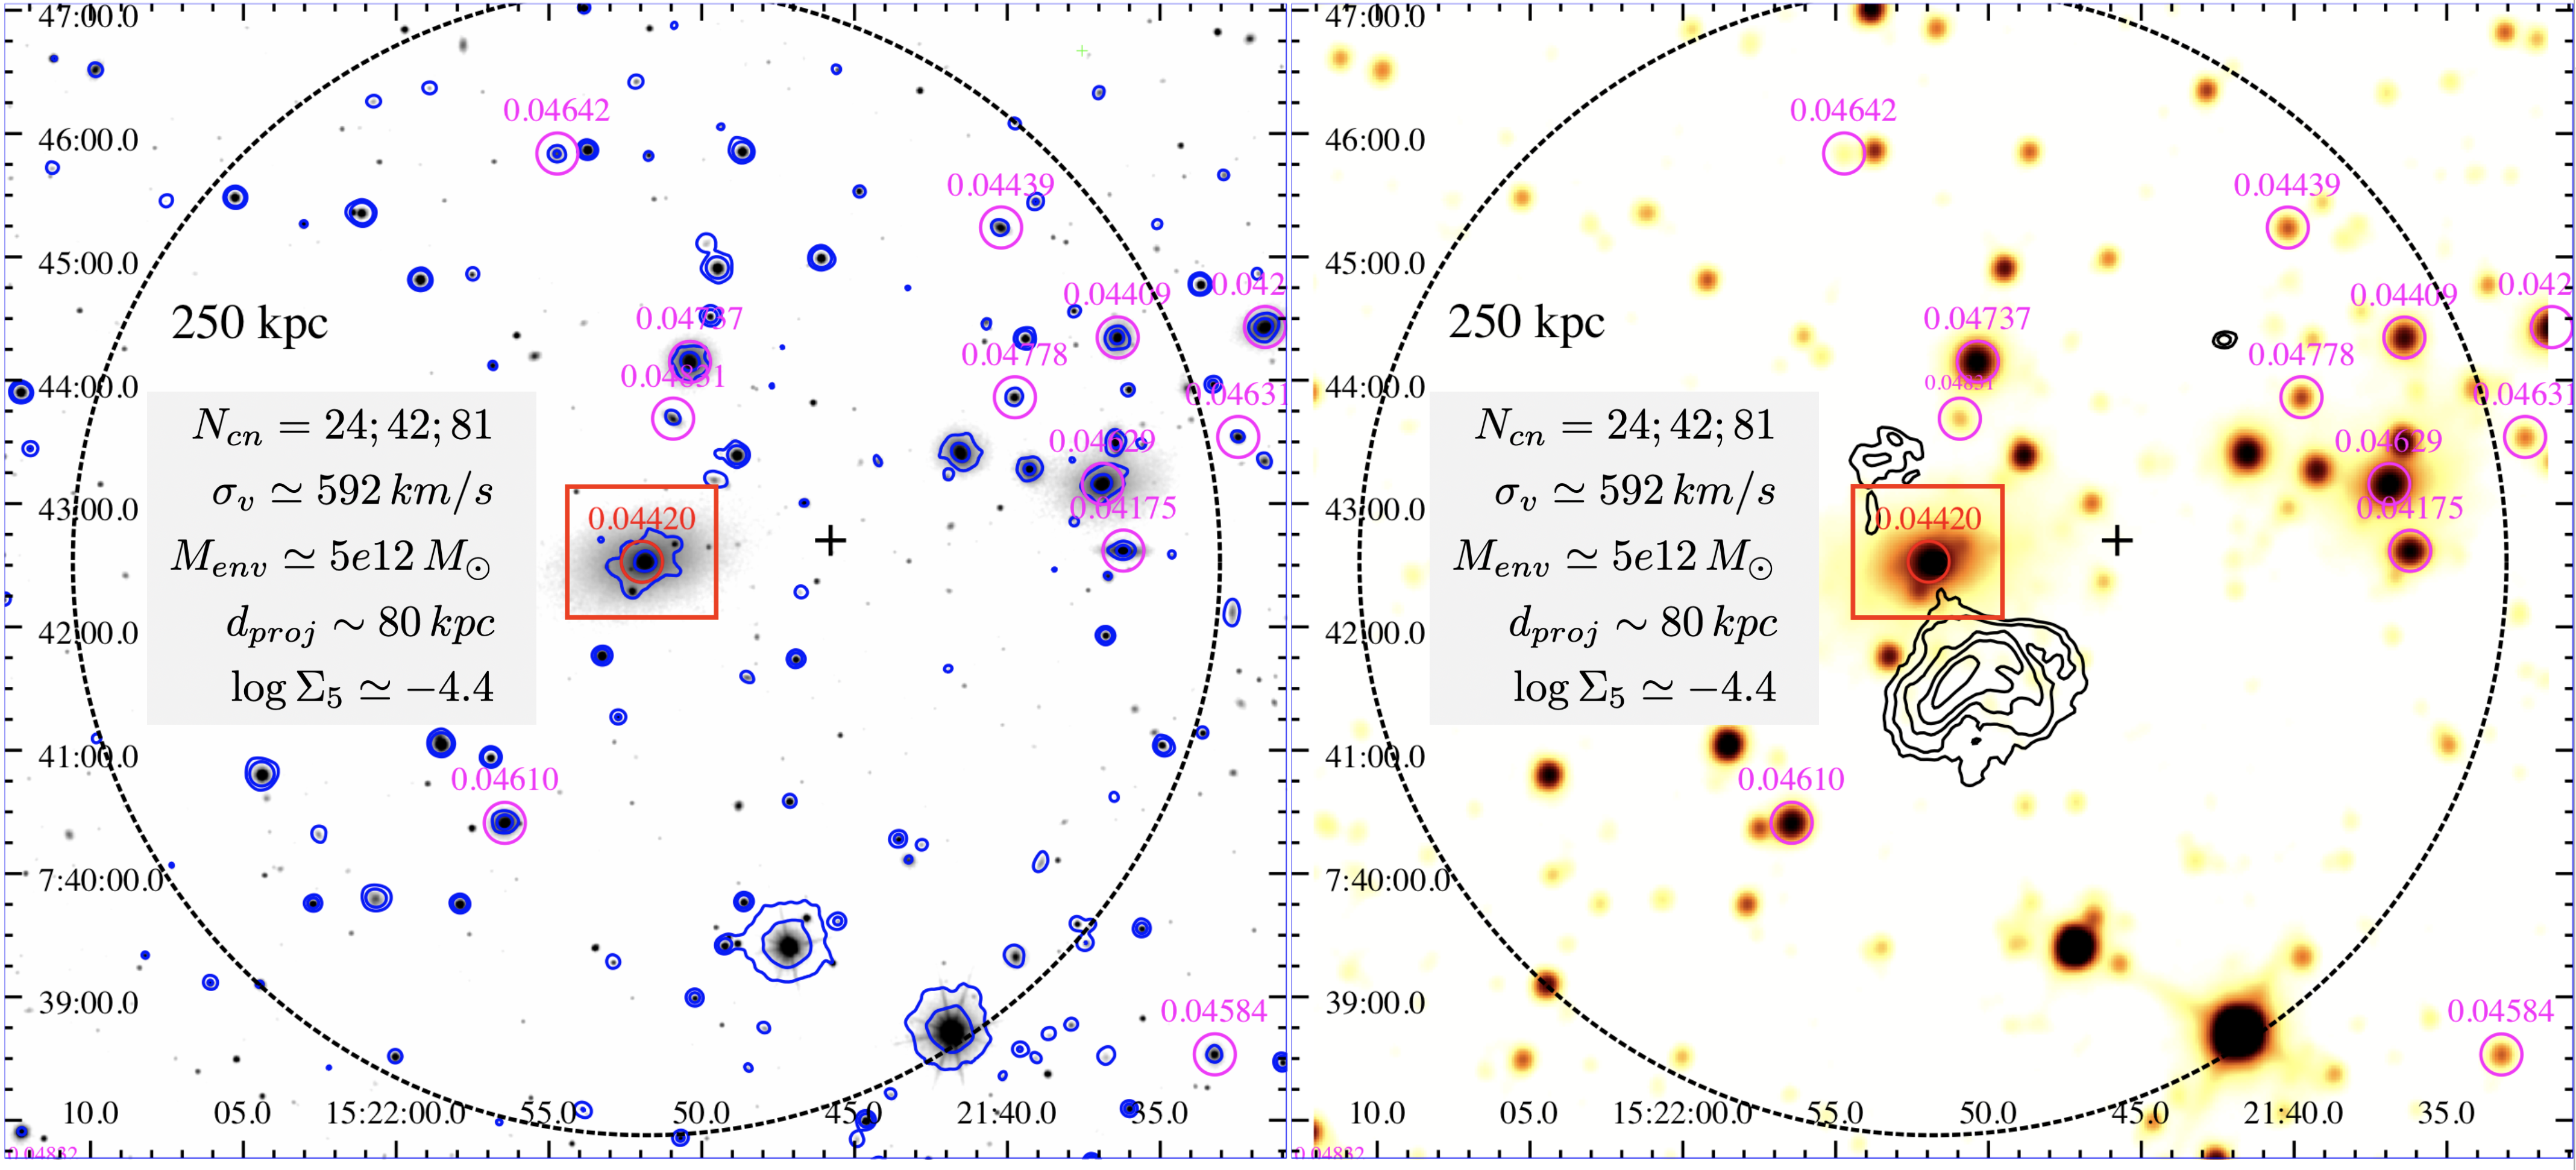
3CR 318.1 is the radio source associated with the nearby (, which corresponds to 0.896 kpc/arcsec) galaxy NGC 5920, the BCG of the galaxy cluster MKW 3s. Based on its optical line emission, it can be classified as an extremely low-excitation galaxy (see Capetti et al. 2013). The central source presents a steep spectrum at low radio frequencies (i.e., ) with a luminosity of W Hz-1 (Capetti et al. 2020). The surrounding diffuse radio emission also shows an extremely steep radio spectrum (), leading to a classification of relic radio galaxy by Giacintucci et al. (2007). The host galaxy of 3CR 318.1 presents an AB UV magnitude at 2600 Å of 19.04 0.04, corrected for Galactic reddening (Cardelli et al. 1989), with 111https://irsa.ipac.caltech.edu/applications/DUST/. This magnitude yields a UV luminosity at 2600 Å of erg s-1. An overview of 3CR 318.1 and its environment is shown in Fig. 1.
Peres et al. (1998) found that MKW 3s presents a moderate “cooling flow” (170 M⊙ yr-1). Using deep (57 ks) Chandra X-ray observations of the central 200 kpc, Mazzotta et al. (2002) identified the presence of a cavity, located at 90 kpc south of the X-ray nucleus, hotter than the 3 keV average cluster temperature and filled by radio emission arising from the southern lobe (Mazzotta et al. 2004), as recently confirmed by Bîrzan et al. (2020) using Low Frequency Array observations.
3 Data reduction and analysis
X-ray data reduction was performed following standard procedures of the Interactive Analysis of Observations v4.10 (CIAO; Fruscione et al. 2006) threads222http://cxc.harvard.edu/ciao/threads/, adopting the Chandra Calibration Database v4.8.4.1, and using the 57 ks Chandra observation (ObsID 900). The MUSE dataset was obtained from the MURALES survey (ID 099.B-0137(A); two exposures of 10 min each), with a mean seeing in the V band at zenith of 1.38″(see Balmaverde et al. 2019 for details on the data reduction and analysis). Here we focus on the analysis of the [N II] emission since it is more luminous and extended than the H emission. The [N II]/H ratio is constant along filaments with [N II]/H1.9.
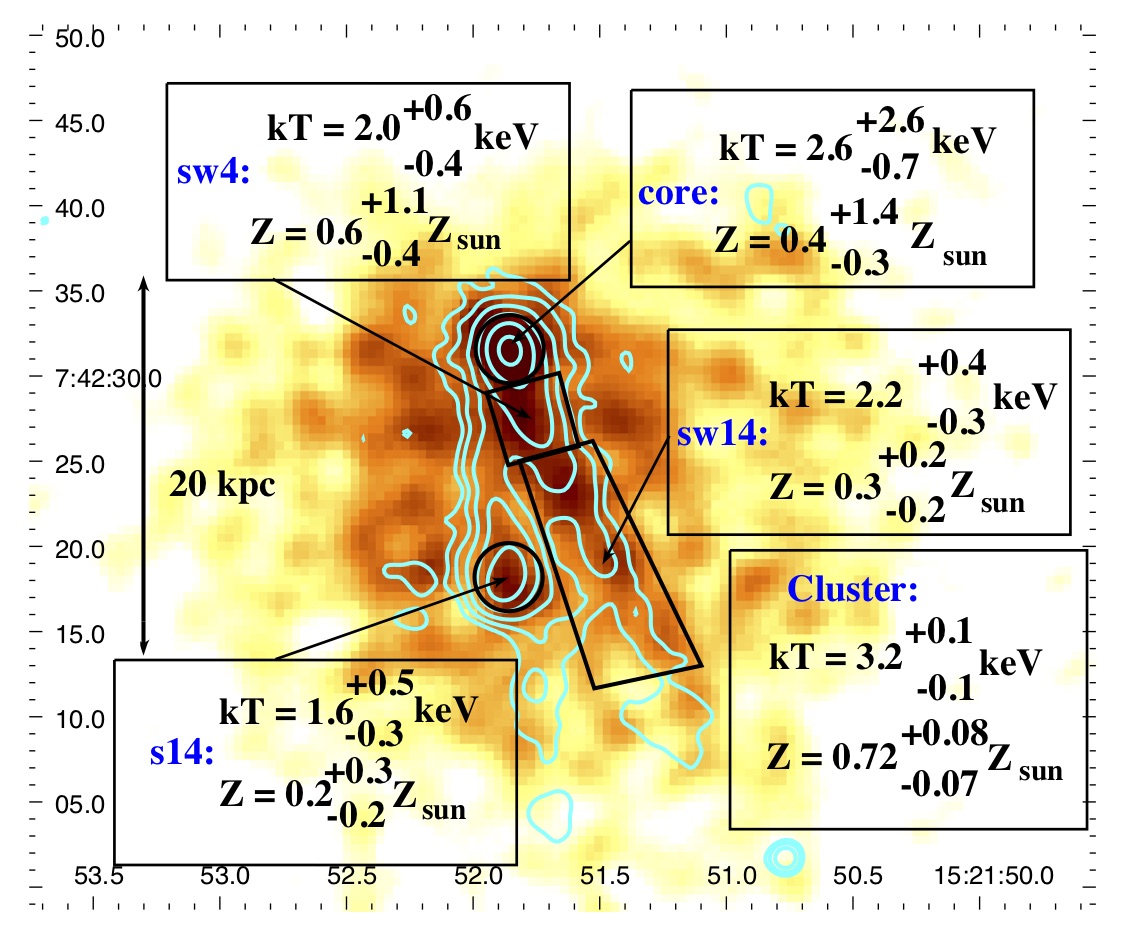
Astrometric registration to align radio, optical and X-ray images was performed by measuring the radio centroid at 1.4 GHz (beam size of 4.5″), and the X-ray centroid in the 0.5–7 keV energy range and then aligning them following the procedure from Massaro et al. (2011). We shifted the X-ray image 0.568″ to the north-east, then, we aligned the position of the optical host galaxy in the MUSE continuum image with the radio centroid shifting it by 1.62″. These shifts are consistent with those previously reported for the 3CR Chandra Snapshot Survey (Massaro et al. 2011, 2013, 2015, 2018; Jimenez-Gallardo et al. 2020). Registration was then verified by checking the alignment of other point-like field sources in the Sloan Digital Sky Survey (SDSS) and in the MUSE continuum images. The comparison between registered X-ray and [NII] optical images is shown in Fig. 2.
In the same figure, we show the regions selected to perform X-ray spectral analysis, based on the morphology of the [N II] emission. These, labeled according to the nomenclature of Massaro et al. (2011), are:
-
1.
two circles of 2″ radius, centered on (i) the radio core and (ii) the [N II] emission line knot at the end of the south filament (core and s14, respectively);
-
2.
two polygons along the south-west filament, namely: sw4 (inner 4 kpc) and sw14 (remaining 13 kpc).
We chose, as background for the spectral analysis of the filament regions, a larger circle located 45″ to the north-east where no point-like and/or extended X-ray sources are detected, to obtain the spectrum of the excess emission only instead of the line-of-sight average. We also performed the spectral analysis of the galaxy cluster emission, considering two polygonal regions, one at each side of the filaments and a background region at 100″ to compare the inner and outer galaxy cluster emission.
Background subtracted X-ray spectra in the 0.5–4 keV energy range were extracted using the CIAO routine specextract and the background region containing neighboring ICM emission to the filament and analyzed using Sherpa v4.12.1 (Freeman et al. 2001). To ensure the validity of Gaussian statistics, spectral data were binned to at least 25 photons per bin.
We tried fitting the final spectra using an absorbed bremsstrahlung model, however, it failed to reproduce the soft X-ray excess below 2 keV. Thus, we adopted a collisional ionisation gas model (xsapec333https://cxc.cfa.harvard.edu/sherpa/ahelp/xsapec.html), absorbed by Galactic hydrogen column density (xswabs444https://cxc.cfa.harvard.edu/sherpa/ahelp/xswabs.html; cm-2; Kalberla et al. 2005). The xsapec model had three free parameters: normalization, plasma temperature , and metal abundance .
We confirmed the presence of a soft X-ray (i.e., 0.5 - 3 keV) excess spatially coincident with the [N II] filament (regions sw4 and sw14) at a level of confidence with respect to the surrounding ICM emission. Detection significance, reported in Gaussian equivalent, was computed assuming a Poisson distribution of photons in the inner background region.
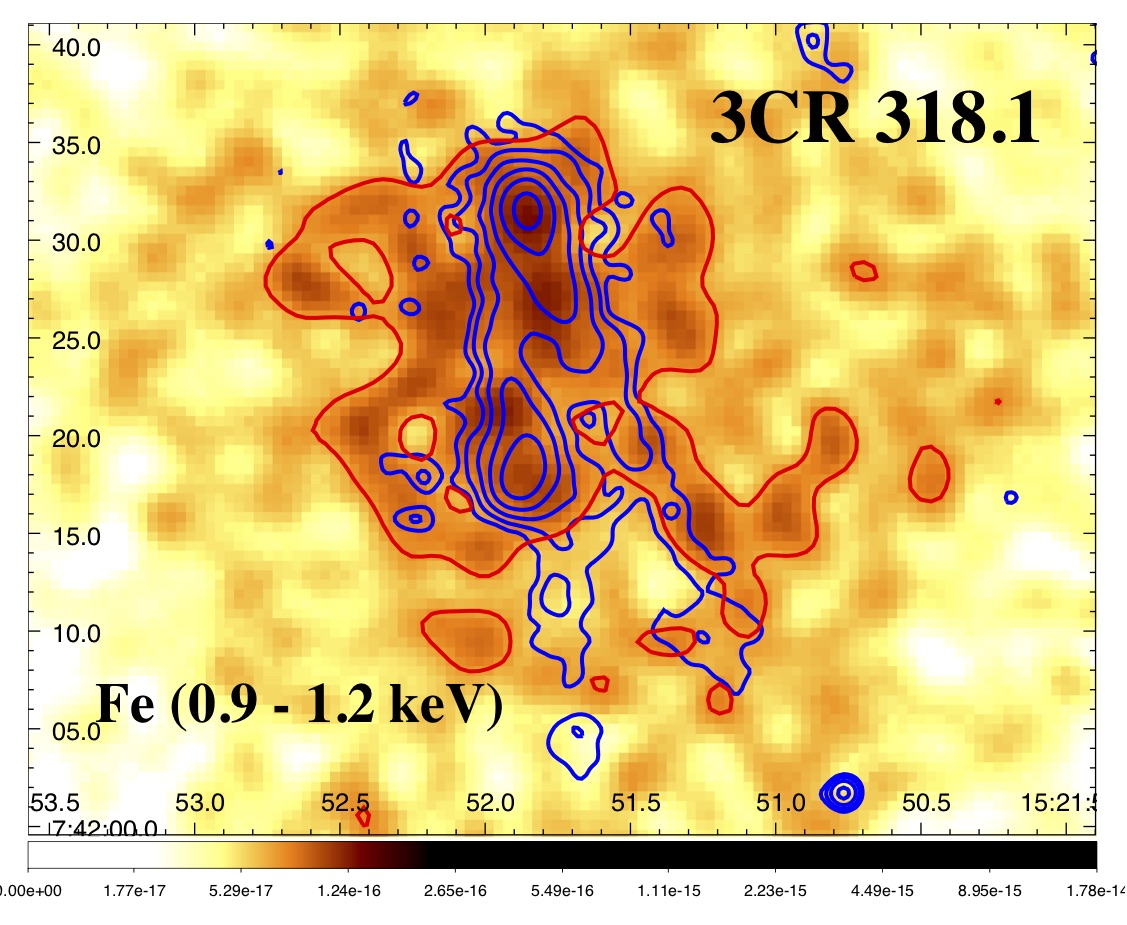
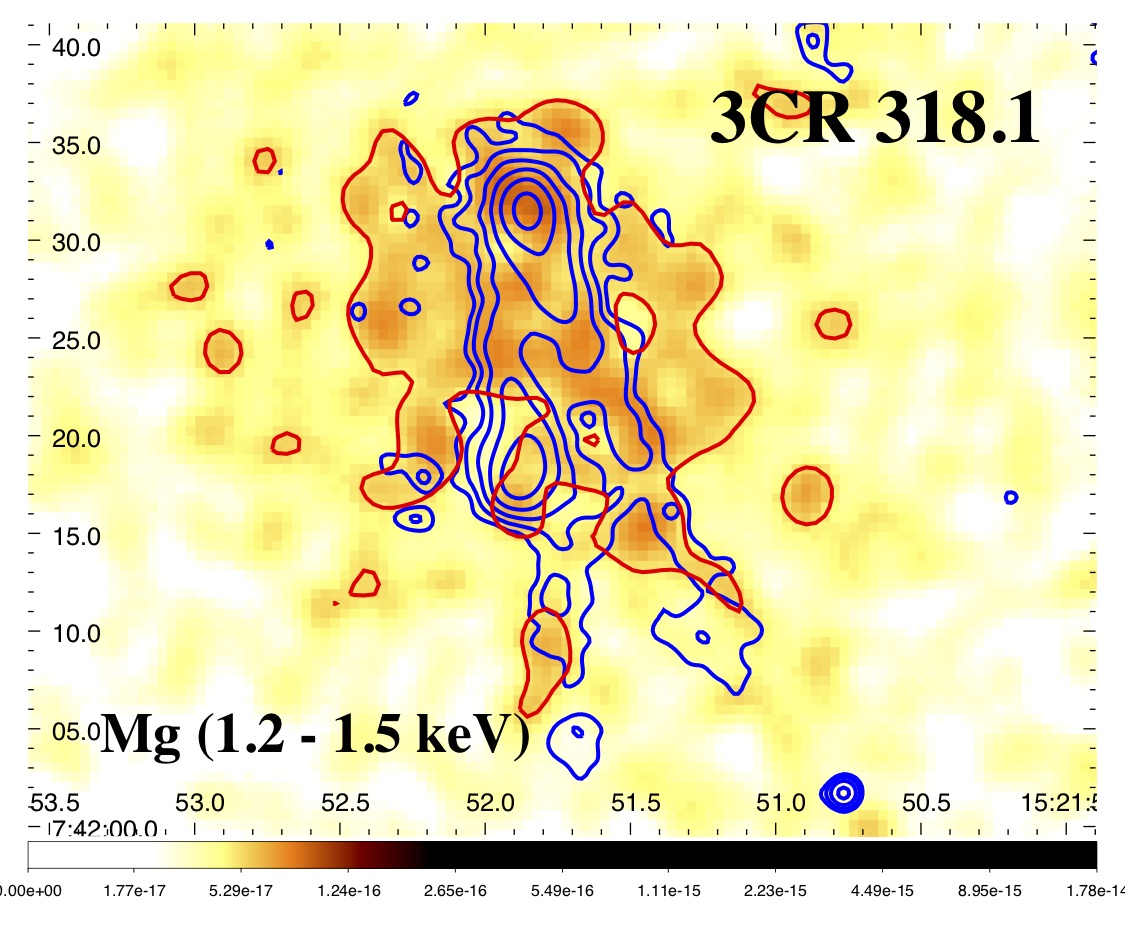
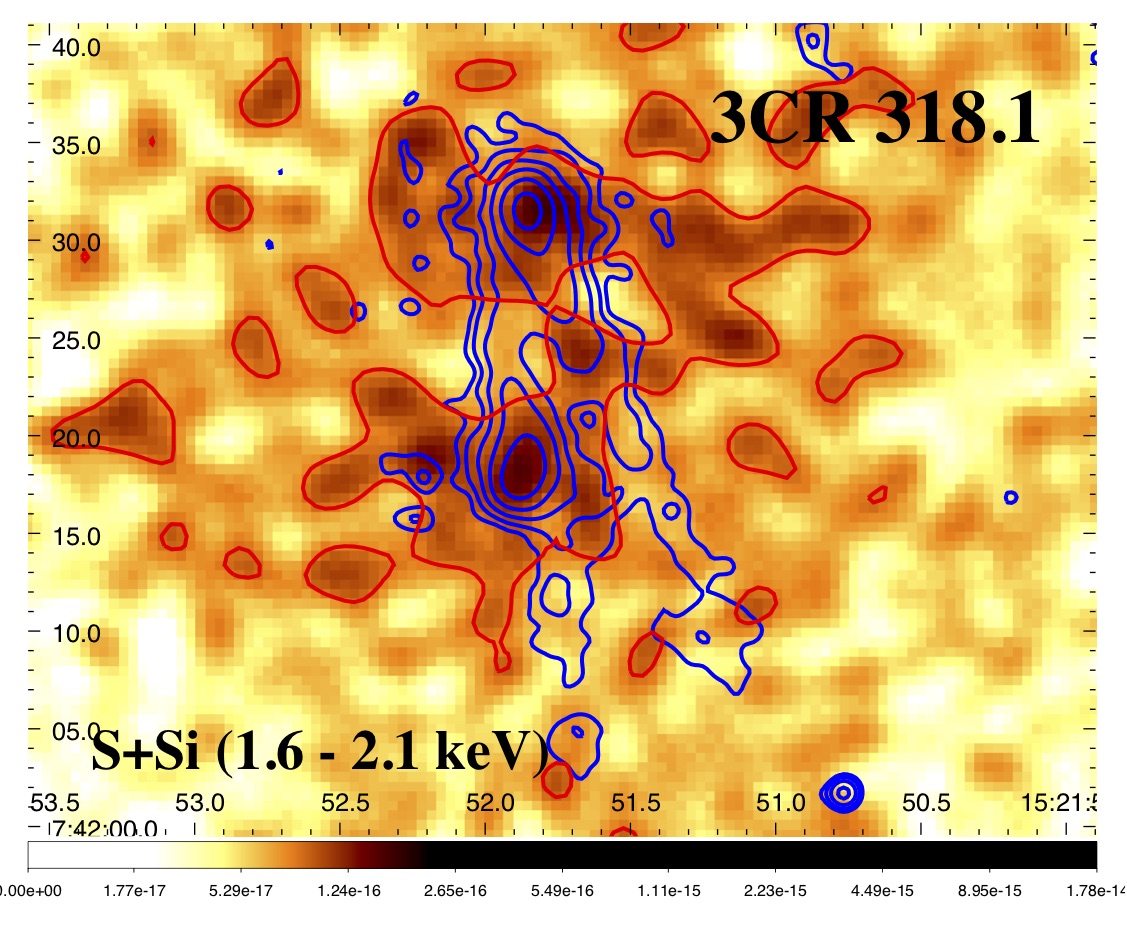
Assuming the presence of emission lines below 2 keV (see § 4), we created narrow band X-ray images, shown in Fig. 3 (see e.g., Massaro et al. 2013, 2015, 2018). We chose three energy ranges mainly attributable to (i) Fe (0.9–1.2 keV), (ii) Mg (1.2–1.5 keV) and (iii) S+Si (1.6–2.1 keV) ionized elements. X-ray flux maps were created by using monochromatic exposure maps set to the nominal energies of 1, 1.3 and 1.8 keV for the Fe, Mg, S+Si, respectively, to take into account the detector effective area at different energies.
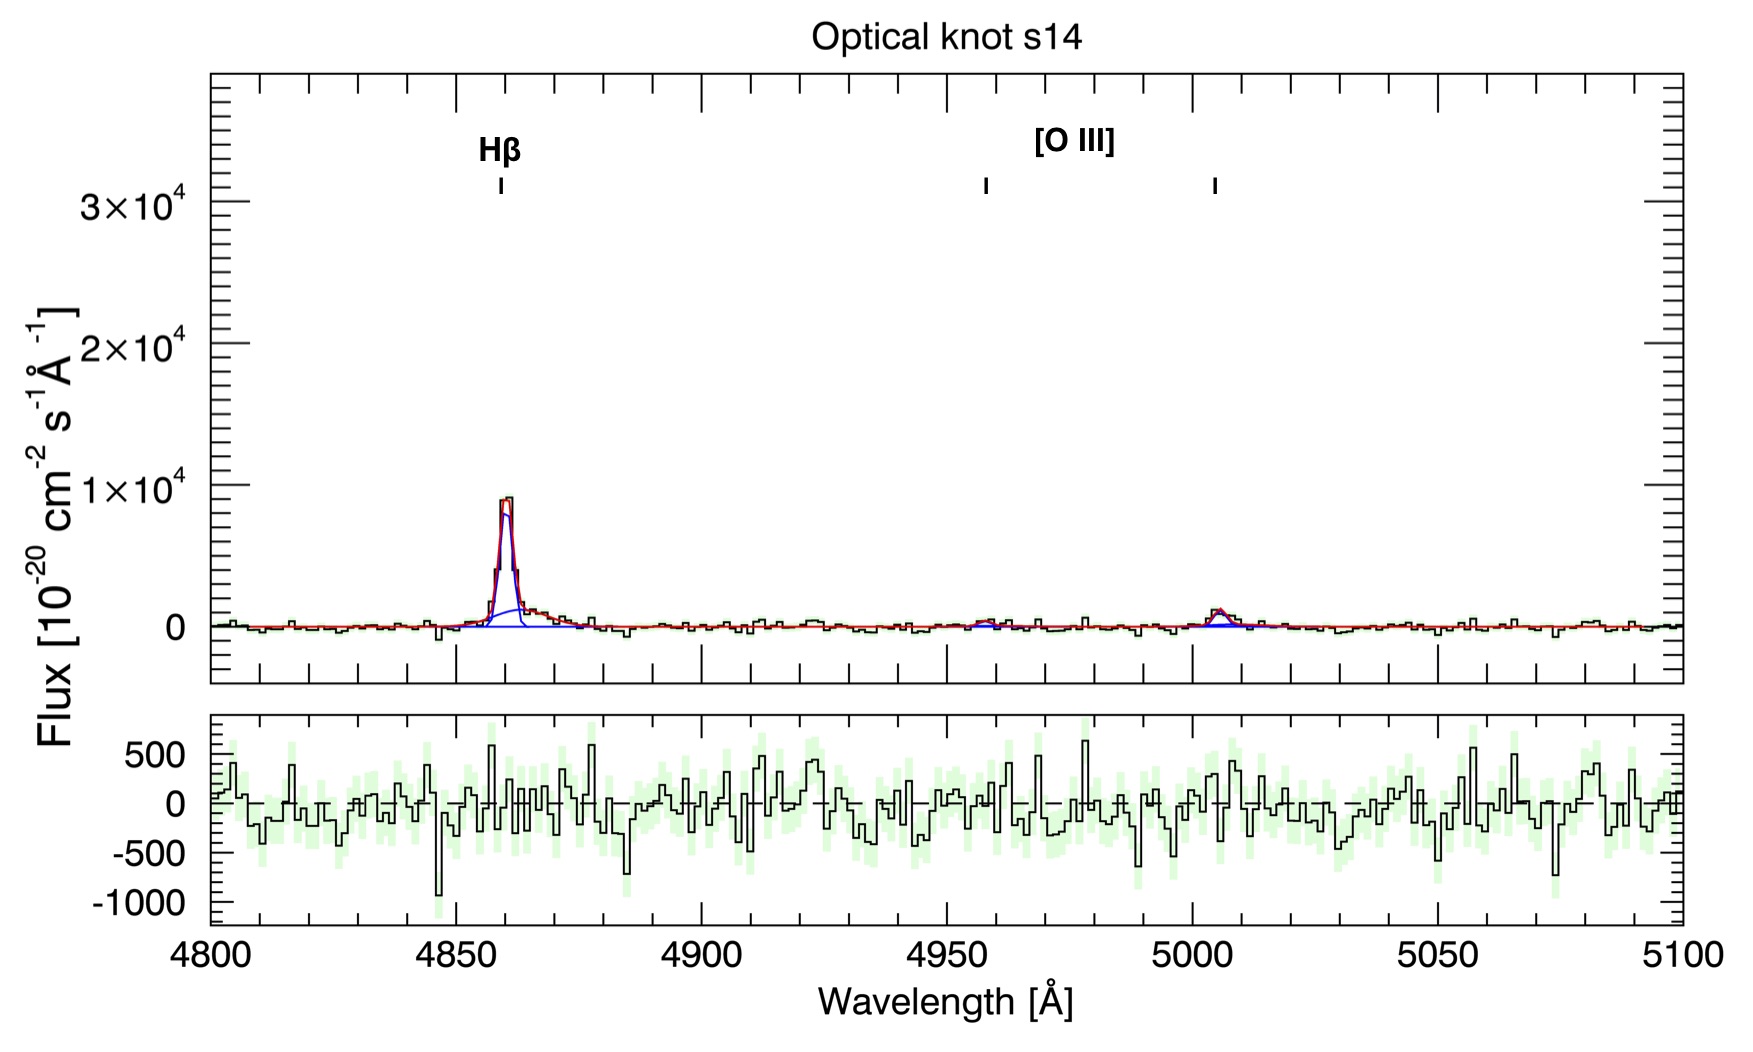
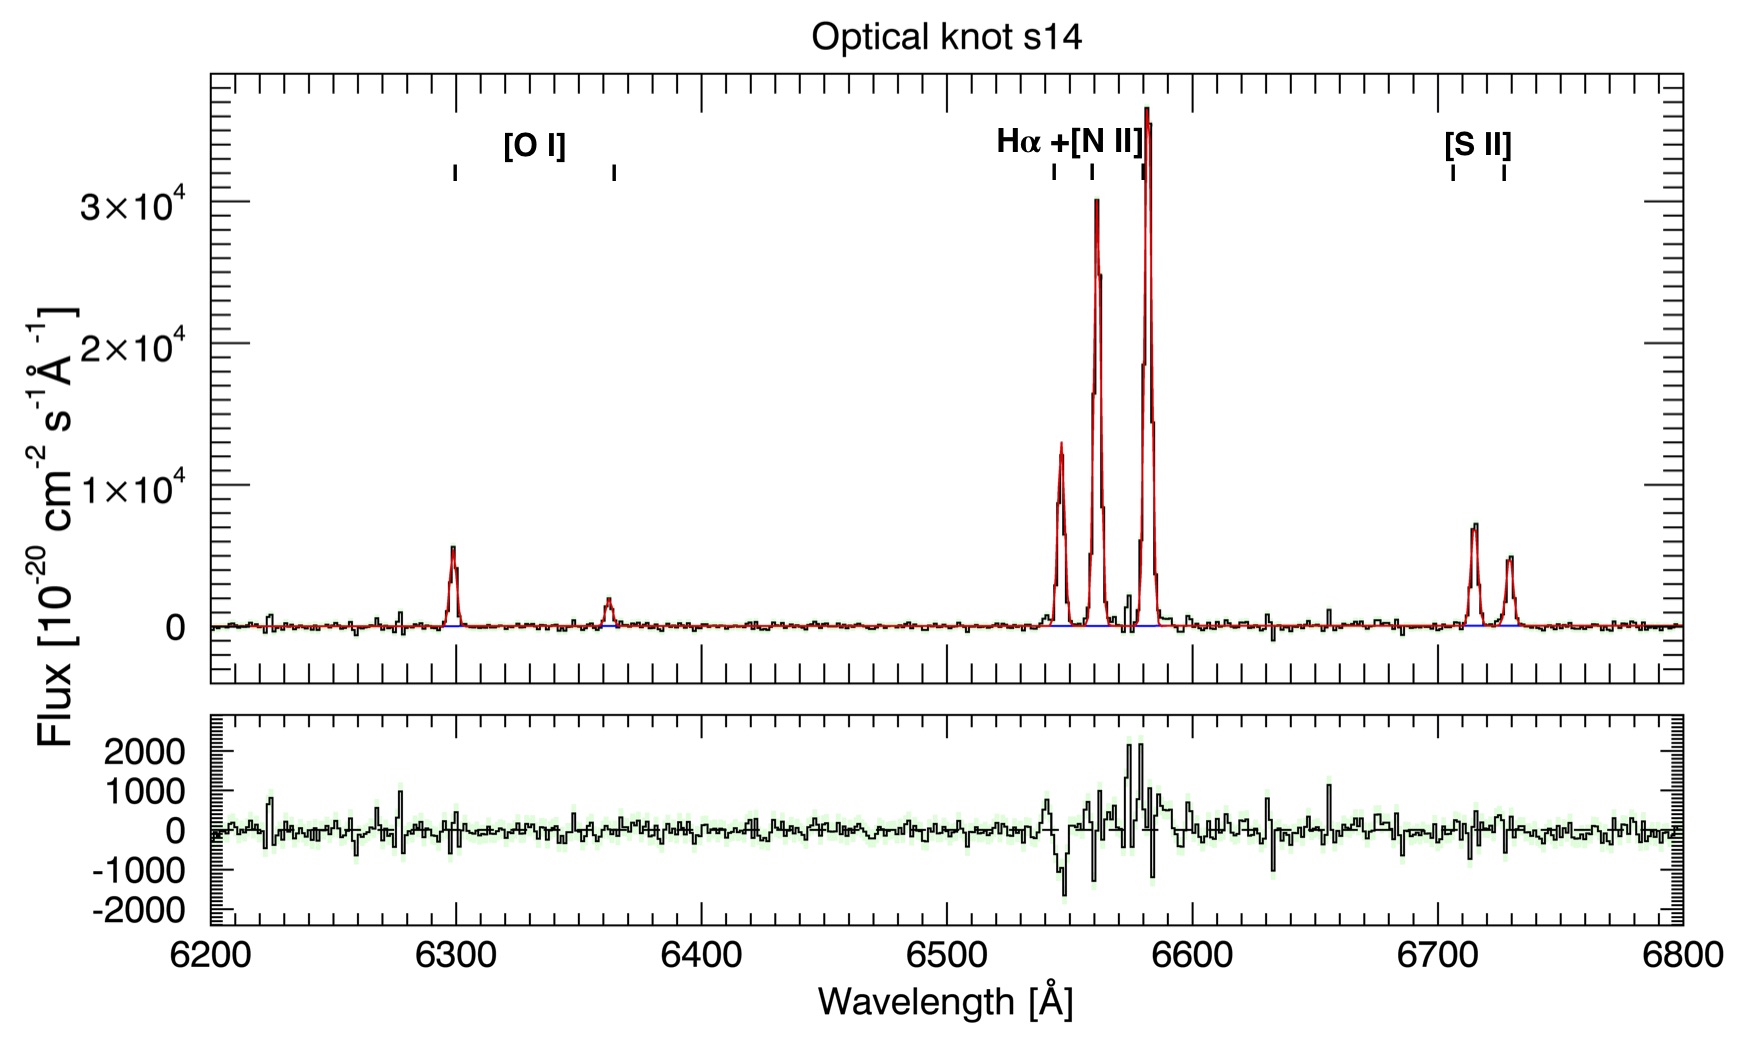
From the optical perspective, we modeled the main emission lines present in the MUSE spectra, i.e., , , [O III]5007, [O I]6300, [N II] and the [SII] doublet at 6716, 6731 using Gaussian functions at different locations across the filament and the knot. Top panel of Fig. 4 shows the MUSE spectrum of the optical knot sw14, as an example. The line was modelled using an additional broad component only present in the core and in region s4.
4 Results
4.1 Optical
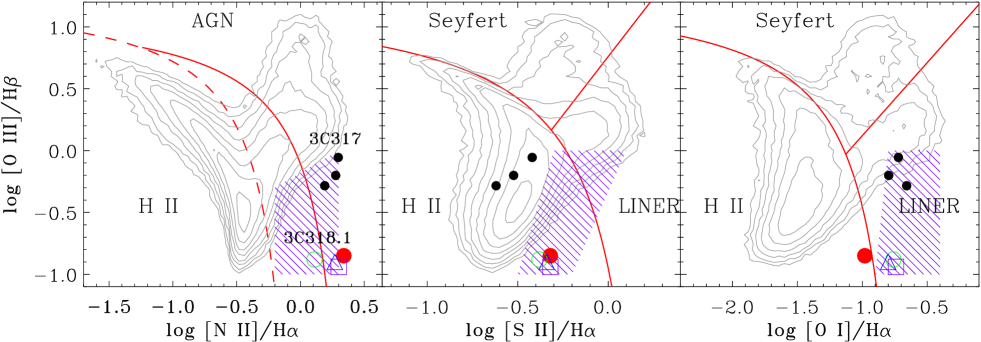
We computed the emission line intensity ratios for all regions (see Fig. 2) and plotted them in the diagnostic diagrams defined by the intensity ratios shown in Fig. 4, used to distinguish between different ionization mechanisms occurring in H II regions, AGN, or LINER/shocks (Baldwin et al. 1981 and Dopita & Sutherland 1995). Measurements obtained for all four regions in 3CR 318.1 are closely clustered and located where no emission line galaxies are found (see e.g., Kewley et al. 2006 and Capetti & Baldi 2011).
Similarly to what was found for filaments in different BCGs by McDonald et al. (2012), line ratios provide a contradictory classification: at the boundary between LINER and H II from the [O III]/H vs [N II]/H and [O I]/H diagrams and in the region of ionization due to star-formation from the [S II]/H ratio.
We also estimated the gas density along the filaments, using the ratio of the [S II]6716 and the [S II]6731 lines (see Osterbrock 1989). Assuming a typical temperature of K, we obtained cm-3 in the core and cm-3 in s14 and along the filament (sw4 and sw14). We estimated the total mass of the ionized gas as M⊙, where is the H luminosity (see Osterbrock 1989). Thus, we estimated a total ionized gas mass of M⊙ in the core, M⊙ in s14, and M⊙ along the filament.
Simulations carried out by Qiu et al. (2019, 2020) show that cold filaments in cool core clusters can originate from warm AGN-driven outflows with shorter cooling than rising times. These simulations are consistent with the filaments in 3CR 318.1 extending in the direction of the southern radio lobe.
4.2 X-rays
We performed the X-ray spectral analysis in all regions described in § 3, along optical filaments and in the galaxy cluster (excluding filaments, core and knots). Best fit results, obtained with the absorbed xsapec model, are reported in Fig. 2. We also fitted regions sw4 and sw14 together and obtained a gas temperature of keV (with and reduced with degrees of freedom) for the south-western filament. This is colder than the surrounding ICM, which has keV (reduced ; ). The ICM temperature is consistent with the average temperature found by Mazzotta et al. (2002) for the inner regions of MKW 3s.
Metal abundance of the optical filament, for sw14 (with reduced ; ), appears to be marginally lower than that of the surrounding ICM (). This is in agreement with literature results on other filaments (see e.g., Fabian et al. 2011 and McDonald et al. 2010).
Assuming that narrow band images trace the X-ray emission lines, the Mg emission has a better spatial association with the optical filaments, while Fe and S+Si show X-ray emission more extended than the filaments, as well as strong emission at the core and the s14 (knot) regions (see Fig. 3). We computed the X-ray flux along the filament (regions sw4 and sw14) in the Fe, Mg and S+Si band and compared them with optical and X-ray fluxes. The X-ray fluxes along the filament (regions sw4 and sw14) are erg s-1 cm-2 in the Fe band, erg s-1 cm-2 in the Mg band, erg s-1 cm-2 in the S+Si band, and erg s-1 cm-2 in the soft band (0.5 - 3 keV). Detection significance of the excess X-ray emission along optical filaments is above confidence level for both Mg and Fe, while it is not significant for the S+Si narrow band image, thus the S+Si emission along the filament is consistent with the ICM emission.
We also obtained = 2.9 and = 6.5. In contrast with the filaments of 3CR 318.1, Sanders & Fabian (2007) and Fabian et al. (2011) found that those in Perseus have soft X-ray emission of the same order as the H emission, while the H emission is an order of magnitude above the Fe emission, which highlights the much lower ionization state here. Additionally, we obtained = 1.15, which is three orders of magnitude below the value obtained by Balmaverde et al. (2012) for the emission line regions in nine 3CR radio galaxies.
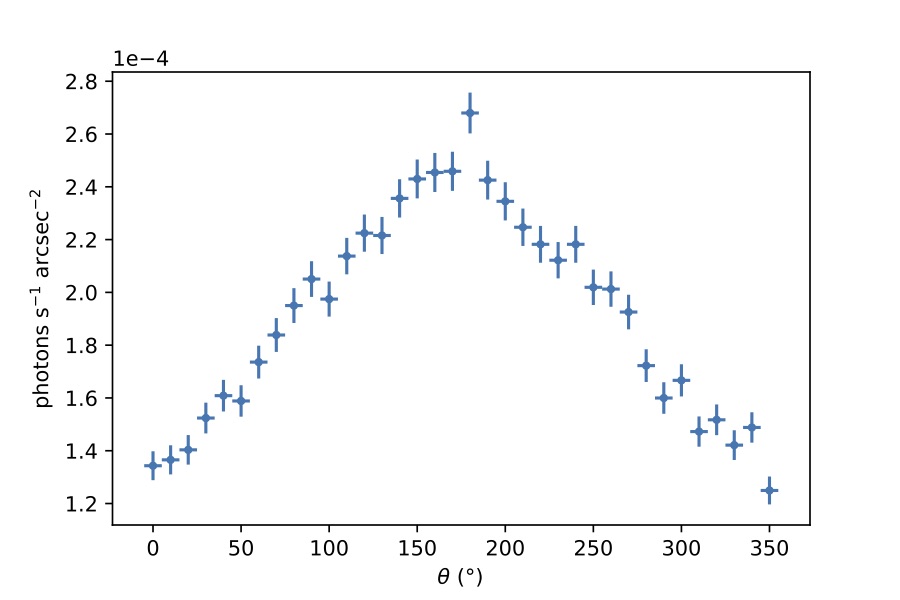
Lastly, we derived the 0.5–3 keV, exposure corrected, X-ray surface brightness profile with azimuthal bins of 10° centered on 3CR 318.1 core, excluding the inner 2″ and extending up to kpc (see Jimenez-Gallardo et al. 2021 for additional details). We chose to make the bin containing the [N II] filament correspond to the 180° bin. The resulting X-ray surface brightness profile is shown in Fig. 5. The background level is two orders of magnitude below the filament emission. The smooth increase of the surface brightness towards the [N II] filament supports the hypothesis that the filament could have originated due to outflows in the direction of the radio jets.
5 Discussion and conclusions
The MURALES survey revealed the presence of optical filaments in 3CR 318.1, the BCG of MKW 3s. Here we compared optical VLT/MUSE and X-ray Chandra observations to shed light on their physical origin.
From an optical perspective, intensity ratios of various rest-frame emission lines were used to distinguish between different ionization mechanisms. Possible explanations of filamentary emission include: ionization due to hot cooling ICM (Voit et al. 1994), ICM thermal conduction (McDonald et al. 2010) and reconnection diffusion (Fabian et al. 2011). However, individually, none of the ionization mechanisms listed can account for all line ratios simultaneously. As shown in Fig. 4, line ratios measured in 3CR 318.1 show extremely low values of [O III]/H in the diagnostic diagrams, similarly, McDonald et al. (2012) found systematically lower [O III]/H values in filaments of cool core galaxy clusters and higher values of [N II]/H, [O I]/H and [S II]/H than those found in galaxies in the SDSS. Although the diagnostic diagrams are used to discriminate between star-forming and AGN-dominated galaxies, they tend to fail when the ionization is due to more complex situations and/or different ionization mechanisms (see e.g., Stasińska et al. 2008, Capetti & Baldi 2011 and Balmaverde et al. 2018) and therefore they may have a limited validity in assessing the ionisation conditions of BCGs. Thus, the line ratios in 3CR 318.1 imply that the emission from the filaments is due to a combination of ionization mechanisms. McDonald et al. (2012) suggested that line ratios are due to a combination of star formation and ionization from slow shocks (100 - 400 km s-1; see also Allen et al. 2008). Since our results are similar to those of McDonald et al. (2012), we argue that their conclusion applies also to the case of 3CR 318.1. An additional contribution from self-ionizing cooling ICM is suggested by the low velocity dispersion ( km s-1) of the optical filaments in 3CR 318.1, which implies a small contribution of shocks to the total ionization. Therefore, we conclude that the underlying ionization mechanisms include a combination of photoionization due to star formation, self-ionizing cooling ICM, and a small contribution of ionization due to slow shocks. Additionally, although McDonald et al. (2012) already found a decrease of the emission line width with radius, thanks to the MUSE data, it was discovered that this decrease occurs sharply in the case of 3CR 318.1 (from 200 km s-1 in the core to 60 km s-1 along the filaments; see Balmaverde et al. 2019).
We detected an excess of X-ray emission above the ICM along the [N II] filaments. This X-ray filament is colder and despite the large uncertainties, appears to have a lower metal abundance than the surrounding ICM, in agreement with literature results (McDonald et al. 2010). The association between the X-ray and optical filamentary morphologies, together with the radio structure, suggests that the filaments could have originated from AGN-driven outflows in the direction of the radio jet. This scenario is in agreement with the smooth 0.5 - 3 keV X-ray surface brightness profile at the location of the [N II] filament and with simulations carried out by Qiu et al. (2019, 2020), in which cold filaments originate from warm outflows (104 - 107 K). Additionally, works such as Gaspari et al. (2018) and Voit (2021) predict that optical emission line nebulae would present velocity dispersions of 100 - 200 km s-1 in the cases where the nebulae originated from compression and catastrophic cooling (see also Gaspari et al. 2012, 2013, 2015, 2017 and Voit et al. 2017 for previous works on multiphase condensation). However, the [N II] filaments in 3CR 318.1 present very low velocity dispersions (60 km s-1; see Fig. 8 in Balmaverde et al. 2019), so the AGN uplift scenario could be favoured.
References
- Allen et al. (2008) Allen, M. G., Groves, B. A.,Dopita, M. A., et al. 2008, ApJS, 178, 20
- Bacon et al. (2010) Bacon, R., Accardo, M., Adjali, L., et al. 2010, in Society of Photo-Optical Instrumentation Engineers (SPIE) Conference Series, Vol. 7735, Proc. SPIE, 773508
- Baldwin et al. (1981) Baldwin, J. A., Phillips, M. M. & Terlevich, R. 1981, PASP, 93, 5
- Balmaverde et al. (2012) Balmaverde, B., Capetti, A., Grandi, P., et al. 2012, A&A, 545, A143
- Balmaverde et al. (2018) Balmaverde, B., Capetti, A., Marconi, A., et al. 2018, A&A, 612, A19
- Balmaverde et al. (2019) Balmaverde, B., Capetti, A., Marconi, A., et al. 2019, A&A, 632, A124
- Bennett (1962) Bennett, A. S. 1962, MNRAS, 125, 75
- Bennett et al. (2014) Bennett, C. L., Larson, D., Weiland, J. L. & Hinshaw, G. 2014, ApJ, 794, 135
- Bîrzan et al. (2020) Bîrzan, L. and Rafferty, D. A. and Brüggen, M., et al. 2020, MNRAS, 496, 2613
- Capetti & Baldi (2011) Capetti, A. & Baldi, R. D. 2011, A&A, 529, A126
- Capetti et al. (2013) Capetti, A., Robinson, A., Baldi, R. D., et al. 2013, A&A, 551, A55
- Capetti et al. (2020) Capetti, A., Brienza, M., Baldi, R. D., et al. 2020, A&A, 642, A107
- Cardelli et al. (1989) Cardelli, J. A., Clayton, G. C. & Mathis, J. S. 1989, ApJ, 345, 245
- Conselice et al. (2001) Conselice, C. J., Gallagher, J. S., III & Wyse, R. F. G. 2001, AJ, 122, 2281
- Dopita & Sutherland (1995) Dopita, M. A. & Sutherland, R. S. 1995, ApJ, 455, 468
- Edge et al. (1959) Edge, D. O., Shakeshaft, J. R., McAdam, W. B., et al. 1959, MmRAS, 69, 37
- Edwards et al. (2009) Edwards, L. O. V., Robert, C., Mollá, M., et al. 2009, MNRAS, 396, 1953
- Fabian et al. (2008) Fabian, A. C., Johnstone, R. M., Sanders, J. S., et al. 2008, Nature, 454, 968
- Fabian et al. (2011) Fabian, A. C., Sanders, J. S., Williams, R. J. R., et al. 2011, MNRAS, 417, 172
- Ferland et al. (2009) Ferland, G. J., Fabian, A. C., Hatch, N. A., et al. 2009, MNRAS, 392, 1475
- Freeman et al. (2001) Freeman, P., Doe, S., & Siemiginowska, A. 2001, Proc. SPIE, 4477, 76
- Fruscione et al. (2006) Fruscione, A., McDowell, J. C., Allen, G. E., et al. 2006, Society of Photo-Optical Instrumentation Engineers (SPIE) Conference Series, 6270, 62701V
- Gaspari et al. (2012) Gaspari, M., Ruszkowski, M. &Sharma, P. 2012, ApJ, 746, 94
- Gaspari et al. (2013) Gaspari, M., Ruszkowski, M. & Oh, S. Peng 2013, MNRAS, 432, 3401
- Gaspari et al. (2015) Gaspari, M., Brighenti, F. & Temi, P. 2015, A&A, 579, A62
- Gaspari et al. (2017) Gaspari, M., Temi, P. & Brighenti, F. 2017, MNRAS, 466, 677
- Gaspari et al. (2018) Gaspari, M., McDonald, M., Hamer, S. L., et al. 2018, ApJ, 854, 167
- Giacintucci et al. (2007) Giacintucci, S., Venturi, T., Murgia, M., et al. 2007, A&A, 476, 99
- Kauffmann et al. (2003) Kauffmann, G., Heckman, T. M., Tremonti, C., et al. 2003, MNRAS, 346, 1055
- Kewley et al. (2001) Kewley, L. J., Heisler, C. A., Dopita, M. A, et al. 2001, ApJS, 132, 37
- Kewley et al. (2006) Kewley, L. J., Groves, B., Kauffmann, G., et al. 2006, MNRAS, 372, 961
- Jimenez-Gallardo et al. (2020) Jimenez-Gallardo, A., Massaro, F., Prieto, M. A., et al. 2020, ApJS, 250, 7
- Jimenez-Gallardo et al. (2021) Jimenez-Gallardo, A., Massaro, F., Paggi, A., et al. 2021, ApJS, 252, 31
- Kalberla et al. (2005) Kalberla, P. M. W., Burton, W. B., Hartmann, D., et al. 2005, A&A, 440, 775
- Laing et al. (1983) Laing, R. A. and Riley, J. M. and Longair, M. S. 1983, MNRAS, 204, 151
- Lynds (1970) Lynds, R. 1970, ApJ, 159, L151
- Massaro et al. (2008a) Massaro, F., Tramacere, A., Cavaliere, A., et al. 2008a, A&A, 478, 395
- Massaro et al. (2008b) Massaro, F., Giommi, P., Tosti, G., et al. 2008b, A&A, 489, 1047
- Massaro et al. (2011) Massaro, F., Harris, D. E. & Cheung, C. C. 2011, ApJS, 197, 24
- Massaro et al. (2013) Massaro, F., Harris, D. E., Tremblay, G. R., et al. 2013, ApJS, 206, 7
- Massaro et al. (2015) Massaro, F., Harris, D. E., Liuzzo, E., et al. 2015, ApJS, 220, 5
- Massaro et al. (2018) Massaro, F., Missaglia, V., Stuardi, C., et al. 2018, ApJS, 234, 7
- Massaro et al. (2019) Massaro, F., Álvarez-Crespo, N., Capetti, A., et al. 2019, ApJS, 240, 20
- Massaro et al. (2020a) Massaro, F., Capetti, A., Paggi, A., et al. 2020a, ApJS, 247, 71
- Massaro et al. (2020b) Massaro, F., Capetti, A., Paggi, A., et al. 2020b, ApJ, 900, L34
- McDonald et al. (2010) McDonald M., Veilleux, S., Rupke, D. S. N., et al. 2010, ApJ, 721, 1262
- McDonald et al. (2012) McDonald M., Veilleux, S. & Rupke, D. S. N. 2012, ApJ, 746, 153
- Morgan et al. (1975) Morgan, W. W., Kayser, S. & White, R. A. 1975, ApJ, 199, 545
- Mazzotta et al. (2002) Mazzotta, P., Kaastra, J. S., Paerels, F. B., et al. 2002, ApJ, 567, L37
- Mazzotta et al. (2004) Mazzotta, P., Brunetti, G., Giacintucci, S., et al. 2004, Journal of Korean Astronomical Society, 37, 381
- Osterbrock (1989) Osterbrock, D. E. 1989, Astrophysics of gaseous nebulae and active galactic nuclei (Mill Valley, CA: University Science Books)
- Peres et al. (1998) Peres, C. B., Fabian, A. C., Edge, A. C., et al. 1998, MNRAS, 298, 416
- Sabater et al. (2013) Sabater, J., Best, P. N. & Argudo-Fernández, M. 2013, MNRAS, 430, 638
- Sanders & Fabian (2007) Sanders, J. S. & Fabian, A. C. 2007, MNRAS, 381, 1381
- Spinrad et al. (1985) Spinrad, H., Djorgovski, S., Marr, J. & Aguilar, L. 1985, PASP, 97, 932
- Stasińska et al. (2008) Stasińska, G., Vale Asari, N., Cid Fernandes, R., et al. 2008, MNRAS, 391, L29
- Voit et al. (1994) Voit, G. M., Donahue, M. & Slavin, J. D. 2012, ApJS, 759, 86
- Voit et al. (2017) Voit, G. M., Meece, G., Li, Y., et al. 2017, ApJ, 845, 80
- Voit (2021) Voit, G. M. 2021, ApJ, 908, L16
- Worpel et al. (2013) Wilkes, Worpel, H., Brown, M. J. I., Jones, D. H., et al. 2013, ApJ, 772, 64
- Qiu et al. (2019) Qiu, Y., Bogdanović, T., Li, Y., et al. 2019, ApJ, 872, L11
- Qiu et al. (2020) Qiu, Y., Bogdanović, T., Li, Y., et al. 2020, Nature Astronomy, 4, 900