Change Detection in Synthetic Aperture Radar Images Using a Dual-Domain Network
Abstract
Change detection from synthetic aperture radar (SAR) imagery is a critical yet challenging task. Existing methods mainly focus on feature extraction in spatial domain, and little attention has been paid to frequency domain. Furthermore, in patch-wise feature analysis, some noisy features in the marginal region may be introduced. To tackle the above two challenges, we propose a Dual-Domain Network. Specifically, we take features from the discrete cosine transform domain into consideration and the reshaped DCT coefficients are integrated into the proposed model as the frequency domain branch. Feature representations from both frequency and spatial domain are exploited to alleviate the speckle noise. In addition, we further propose a multi-region convolution module, which emphasizes the central region of each patch. The contextual information and central region features are modeled adaptively. The experimental results on three SAR datasets demonstrate the effectiveness of the proposed model. Our codes are available at https://github.com/summitgao/SAR_CD_DDNet.
Index Terms:
Deep learning; synthetic aperture radar; change detection; neural network; frequency domain.I Introduction
Rcent years have witnessed the rapid growth of synthetic aperture radar (SAR) sensors, inducing many researchers to work on SAR image segmentation, texture analysis and change detection [1]- [3]. As an essential task of SAR image interpretation, change detection, focusing on identifying the changed regions between multitemporal SAR images, has attracted increasing attention in remote sensing communities.
Change detection using SAR images is more challenging than optical ones due to the existence of speckle noise [4]. Some pioneer efforts have been made to tackle the problem of noise in multitemporal image analysis [5]. Traditionally, the mainstream methods commonly compare multitemporal images to generate a difference image (DI) and analyze the DI to obtain the change map [6]. Though some pixel-wise changed information can be captured, these methods can hardly adaptively exploit the rich feature representations in the original data.
Currently, due to the popularity of deep neural networks, remote sensing image change detection methods have achieved a performance boost. Samadi et al. [7] employed Deep Belief Network (DBN) for SAR image feature learning. The change detection performance has been greatly improved compared with traditional DI clustering methods. Wang et al. [8] presented a general end-to-end convolutional neural network (CNN) for hyperspectral image change detection. Li et al. [9] proposed a well-designed CNN to learn the spatial characteristics from raw images. In [10], a local restricted CNN was proposed to enforce local similarity between neighboring pixels in change maps.
The above-mentioned deep learning-based methods have achieved great success by exploiting deep feature representations. However, it is non-trivial to build a robust SAR change detection model, due to the following two challenges: 1) Mutual reinforcement of spatial and frequency features. Existing models are mainly based on feature extraction in the spatial domain, and little attention has been paid to the frequency domain. It has been recently shown that the compressed representation in the frequency domain is capable of suppressing the noise in the spatial domain and enriching the patterns for image understanding [11] [12]. Thereby, reinforcing spatial and frequency features in a unified framework should be considered. 2) Enhancement of the central region features. The contextual information is crucial to the performance of SAR image change detection, and hence existing methods commonly use patch-wise features for classification. However, some noisy features in the marginal region of each patch may be introduced. Therefore, how to emphasize the central region in each patch while retaining the contextual information is a tough challenge.
To tackle the above two issues, we propose a Dual-Domain Network, DDNet for short, which jointly exploits the spatial and frequency features for SAR change detection task. Specifically, we first take into consideration features from the discrete cosine transform (DCT) domain. Reshaped DCT coefficients are integrated into a CNN model as a branch for inference. Therefore, feature representations from both frequency and spatial domain are exploited to alleviate the speckle noise. In addition, we further proposed a multi-region convolution (MRC) module, which emphasizes the central region of each patch. Intuitively, the contextual information and central region features are adaptively modeled efficiently.
The contributions of this letter can be summarized as follows:
-
•
To the best of our knowledge, we are the first to introduce features in the DCT domain to solve the SAR image change detection problem. Features from both frequency and spatial domain are exploited. Therefore, the speckle noise is suppressed efficiently.
-
•
We propose a MRC module, which jointly emphasizes the central area of each image patch while keeping the contextual information. The central region features and contextual information are adaptively organized for the classification task.
-
•
Experimental results on three real SAR datasets demonstrate the effectiveness of the proposed DDNet and promising results are observed. To benefit other researches along remote sensing image change detection, the PyTorch code of the proposed DDNet has been made publicly available.
II Methodology
Given two SAR images and captured at different times over the same geographical region, the objective is to generate a binary change map in which the changed pixels are marked as “1” and unchanged pixels are marked as “0”.
The proposed model works in an unsupervised manner. The preclassification is the first step. The main purpose of this step is to find samples which have a high probability to be changed or unchanged. The log-ratio operator [13] is first employed to generate a difference image (DI). Then, hierarchical FCM clustering [14] is implemented to classify the DI into three clusters: , , and . Pixels belonging to and are reliable pixels which have high probability to be changed or unchanged, respectively. Pixels in are uncertain and need to be further classified. 10% of the image patches centered at pixels in and are randomly chosen as the training samples for DDNet. It should be noted that the number of positive samples and negative samples are equal. For a given pixel, image patches centered at the pixel are extracted from and , respectively. The size of each patch is ( in this work). Both patches are combined to form a new image patch with the size of . The generated new patches are fed into the DDNet for training. After training, image patches centered at pixels in will be classified by the network. The whole process is unsupervised.
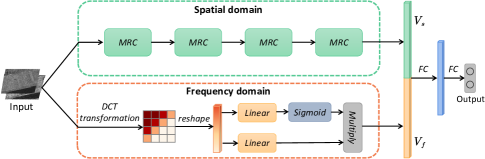
The framework of the proposed DDNet is illustrated in Fig. 1. The network is comprised of a spatial domain branch and a frequency domain branch. The spatial domain branch is designed to capture multi-region features, while the frequency domain branch is used to encode the DCT coefficients. Next, we introduce the spatial and frequency domain feature extraction, respectively. Afterwards, we show how to combine the features from both domains for further classification.
II-A Spatial Domain Feature Extraction
In the spatial domain, the network contains 4 multi-region convolution (MRC) modules as illustrated in Fig.1. Details of the MRC module are shown in Fig.2. Since the contextual information is essential for SAR image change detection, existing methods commonly adopt a windows with fixed size (33, 55, 77, etc) to determine whether the position has changed. We argue that if we abandon some marginal regions in feature extraction, the central region can be emphasized and the noise in marginal regions can be potentially eliminated. Toward this end, we propose to extract features of multi-regions to enhance the feature representation in SAR change detection.
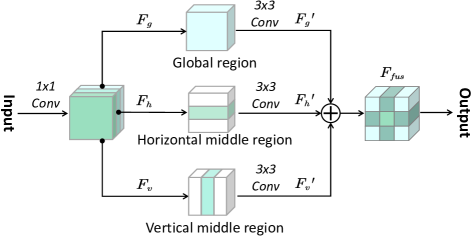
The follows are three representative situations: 1) Global region. As illustrated in Fig. 2, it is a candidate of square-shaped patch, where the CNN is guided to capture the global contextual information of the central pixel. 2) Horizontal middle region. The image patch is designed to concentrate on the center area, and pixels on the top and bottom have been removed. 3) Vertical middle region. The image patch is designed to concentrate on the center area, and pixels on the left and right have been removed. If the above-mentioned regions are considered in CNN model, the central region will be emphasized and the noisy pixels on the margin will be effectively suppressed.
Given an image patch , we feed it into a convolution layer to generate new feature map . Then, is divided into three groups , and according to the channel dimension. Hence, the shape of , , and is , respectively. represents the global region features. denotes the horizontal middle region feature, where several top and bottom rows are set to 0. denotes the vertical middle region feature, where several left and right columns are set to 0. It should be noted that is set to 7 in this work, two top rows and two bottom rows are set to 0 in , while two left and two right columns are set to 0 in .
After the convolution layer, we obtain three groups of features , and , respectively. These features are fused by element-wise summation as:
| (1) |
where represents the spatial fused features. is set to be 15 in our implementations, and we therefore obtain the final spatial fused feature map with the size of . The features are then reshaped to a vector , and the vector is in length. Hence, has a global context view and the center region information has been enhanced.
II-B Frequency Domain Feature Extraction
Due to the presence of speckle noise, it is difficult to extract robust discriminative features from the DI in the spatial domain. Recently, researchers have verified that the compressed representation in the frequency domain is capable of suppressing the speckle noise [11]. Inspired by Xu’s work [12], discrete cosine transform (DCT) is employed for frequency feature extraction.
An input image patch of size is resized to by bilinear interpolation. Then, the image patch is converted to the frequency domain by DCT. Afterwards, the obtained DCT coefficient vector is in length. It has been confirmed that DCT proves highly effective in noise suppression in the spatial domain. In order to further select the critical components of the DCT coefficients, we employ an “on-off switch” which generates an informative vector and an attention gate with two linear transformations, as illustrated in Fig. 1. The informative vector and attention gate are generated as:
| (2) |
| (3) |
where and are the weight matrix, and are the bias in linear transformation, and denotes the sigmoid activation function.
Then, the DCTB employs the attention gate to the information vector using element-wise multiplication and obtains the final frequency feature vector as:
| (4) |
where is the element-wise multiplication.
II-C Final Change Map Generation
After obtaining the spatial domain feature and frequency domain feature , they are concatenated and fed into a fully connected (FC) layer. Then, the possibility of changed or unchanged is calculated by a softmax layer to generate the output. After training, pixels in will be classified by the network, and the final change map can be obtained.
III Experimental Results and Analysis
In this section, extensive experiments are conducted using three real SAR datasets. First, we describe the datasets used in the experiment and give the evaluation criteria. Then, the critical parameters that affect the change detection result are discussed. Finally, the DDNet is compared with several state-of-the-art methods.
III-A Dataset and Evaluation Metric
To verify the effectiveness of the proposed DDNet, we use three co-registered and geometrically corrected multitemporal SAR datasets acquired by different sensors. The first dataset is the Ottawa dataset, which was captured by the RADARSAT SAR sensor in May and August 1997. The size of each image is pixels. The second dataset is the Sulzberger dataset with the size of pixels. It is a part of Sulzberger Ice Shelf which was provided by the European Space Agency’s Envisat satellite. This image shows the breakup of an ice shelf caused by a tsunami in March 2011. The last dataset is the Yellow River dataset, which is from the Yellow River Estuary in China. It is acquired by the Radarsat-2 satellite in June 2008 and June 2009. The size of the dataset is pixels. It is worth noting that it is difficult to identify the changed regions accurately since speckle noise is much stronger in the Yellow River dataset.
We measure the performance of the proposed DDNet with five common evaluation metrics in change detection, including false positives (FP), false negatives (FN), overall error (OE), percentage of correct classification (PCC) and kappa coefficient (KC).
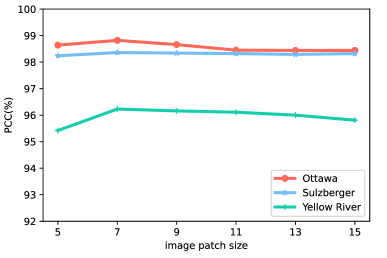
III-B Analysis of the Patch Size
The spatial contextual information is captured by an image patch with the size of . We evaluate the performance of the proposed DDNet by taking 5, 7, 9, 11, 13, and 15, respectively. Fig. 4 shows that the relationship between and PCC. It can be observed that, as gradually increases, the value of PCC first rises and then tends to be stable. The PCC curves show that the spatial contextual information is significant for the change detection task. However, a large patch size increases the computational burden, and it may introduce some noise information that affects the change detection performance. Therefore, we take in our following implementation.
III-C Ablation Study
In order to explore the effectiveness of MRC module and frequency domain features, ablation studies are conducted on three datasets. We designed three variants: 1) CNN denotes the traditional CNN, 2) w/o DCT refers to the model removing the frequency domain branch, and 3) w/o MRC denotes the model excluding the spatial domain branch. From Table. I, it can be observed that removing either the DCT or MRC module affects the feature expressions and degrades the change detection performance.
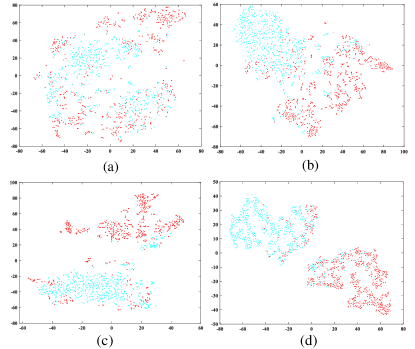
To further demonstrate the effectiveness of the MRC and DCT, we visualize the features of both domain in Fig. 5. The representations learned in the dual domain are significantly better than the input with more separated and clearly bounded clusters.
| Method | Ottawa | Sulzberger | Yellow River |
| CNN | 98.26 | 98.36 | 95.60 |
| w/o DCT | 98.34 | 98.63 | 95.91 |
| w/o MRC | 98.32 | 98.42 | 95.38 |
| Proposed DDNet | 98.36 | 98.82 | 96.23 |
| Method | Results on the Ottawa dataset | Results on the Sulzberger dataset | Results on the Yellow River dataset | ||||||||||||
| FP | FN | OE | PCC | KC | FP | FN | OE | PCC | KC | FP | FN | OE | PCC | KC | |
| PCAKM [6] | 955 | 1515 | 2470 | 97.57 | 90.73 | 711 | 429 | 1190 | 98.18 | 93.90 | 1829 | 2806 | 4635 | 93.76 | 78.32 |
| NR-ELM [15] | 695 | 1076 | 1771 | 98.26 | 93.38 | 719 | 832 | 1551 | 97.63 | 91.95 | 1059 | 3777 | 4836 | 93.49 | 76.14 |
| DBN [16] | 995 | 704 | 1699 | 98.33 | 93.76 | 149 | 764 | 913 | 98.61 | 95.18 | 659 | 2674 | 3333 | 95.51 | 83.91 |
| DCNet [17] | 679 | 1051 | 1730 | 98.30 | 93.54 | 529 | 364 | 893 | 98.64 | 95.64 | 790 | 2137 | 2927 | 96.06 | 86.16 |
| MSAPNet [18] | 805 | 952 | 1757 | 98.27 | 93.47 | 503 | 396 | 899 | 98.63 | 95.60 | 817 | 2157 | 2974 | 96.00 | 85.94 |
| Proposed DDNet | 641 | 1027 | 1668 | 98.36 | 93.77 | 264 | 511 | 775 | 98.82 | 96.17 | 952 | 1846 | 2798 | 96.23 | 86.95 |
III-D Performance Comparison
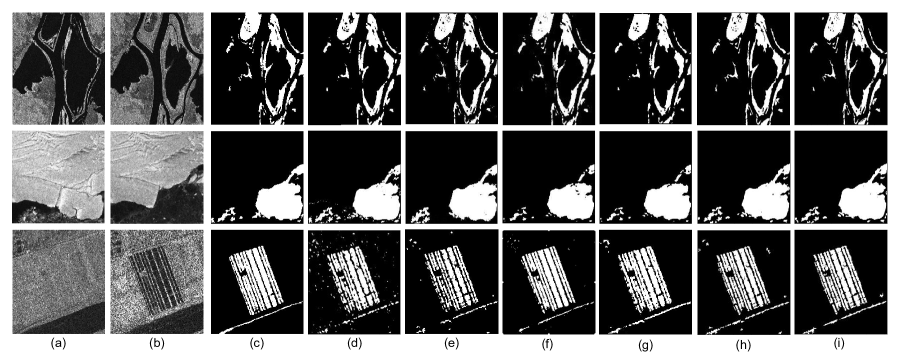
To verify the effectiveness of the proposed model, we compared DDNet with the following state-of-the-art baselines: PCAKM [6], NR-ELM [15], DBN [16] , DCNet [17] and MSAPNet [18]. It is worth mentioning that above methods are implemented with the default parameters described in their works. Table II and Fig. 3 summarize the quantitative and visualized results of different methods, respectively.
On the Ottawa dataset (first row of Fig. 3), we can observe that the result of PCAKM suffers from high FN value, which means that many changed regions are missed. The proposed DDNet achieves the best performance. The KC value of the proposed method is improved by 3.04%, 0.39%, 0.01% , 0.23% and 0.3% over PCAKM, NR-ELM, DBN, DCNet and MSAPNet, respectively. Meanwhile, on the Sulzberger dataset (second rows of Fig.3), it can be seen that the change maps generated by PCAKM and NR-ELM contain many noisy areas, and thereby the overall performance is affected. For NR-ELM, DBN and DCNet, the final change maps miss many changed regions, and they are afflicted with high FN values. Furthermore, deep learning-based methods have better performance than shallow model methods. The KC value of the proposed DDNet increased by 0.99%, 0.53% and 0.57% over DBN, DCNet and MSAPNet on the Sulzberger dataset, respectively. From the above comparisons, it is evident that the proposed DDNet is capable of extracting features from the spatial and frequency domains in parallel effectively on the Ottawa and Sulzberger datasets.
The speckle noise on the Yellow River dataset is much stronger, and hence it is rather challenging to identify the changed regions accurately. On the Yellow River dataset (the third row of Fig. 3), there are many small noisy areas in the final changed maps generated by PCAKM and NR-ELM. Therefore, the FN values of both methods are extremely high in Table II. Compared with other methods, the proposed DDNet obtains 8.63%, 10.18%, 3.04%, 0.79% and 1.01% gains in KC over PCAKM, NR-ELM, DBN, DCNet, and MSAPNet, respectively.
Experimental results on the three datasets demonstrate that the proposed DDNet achieves the best performance, substantially surpassing all baselines. Besides, our model gains an advantage over traditional CNN-based models, which is mainly due to the joint learning of spatial and frequency domain features.
IV Conclusion and Futuer Work
In this letter, we present a novel DDNet to tackle the SAR change detection task. In the DDNet, the features of spatial and frequency domain are fused to improve the classification performance. In the spatial domain, we design a multi-region convolution module to enhance the central region features in the input image patches. In the frequency domain, we employ DCT and gating mechanism to extract the frequency features. Experimental results on three datasets demonstrated that the proposed DDNet is superior to several excellent change detection methods. In the future, we plan to work on large scale dataset to verify our change detection method.
References
- [1] R. J. Radke, S. Andra, O. Al-Kofahi, and B. Roysam, “Image change detection algorithms: A systematic survey,” IEEE Transsactions on Image Processing, vol. 14, no. 3, pp. 294-–307, Mar. 2005.
- [2] Z. Tirandaz, and G. Akbarizadeh, “A two-phase algorithm based on kurtosis curvelet energy and unsupervised spectral regression for segmentation of SAR images,” IEEE Journal of Selected Topics in Applied Earth Observations and Remote Sensing, vol. 9, no. 3, pp. 1244-1264, Mar. 2015.
- [3] G. Akbarizadeh, “A new statistical-based kurtosis wavelet energy feature for texture recognition of SAR images,” IEEE Transactions on Geoscience and Remote Sensing. vol. 50, no. 11, pp. 4358–4368, Nov. 2012
- [4] N. Davari, G. Akbarizadeh, and E. Mashhour, “Intelligent diagnosis of incipient fault in power distribution lines based on corona detection in UV-visible videos,” IEEE Transactions on Power Delivery, Dec. 2020.
- [5] X. Li, Z. Yuan, and Q. Wang, “Unsupervised deep noise modeling for hyperspectral image change detection,” Remote Sensing, vol. 11, no. 3, Jan. 2019.
- [6] T. Celik, “Unsupervised change detection in satellite images using principal component analysis and k-means clustering,” IEEE Geoscience and Remote Sensing Letters, vol. 6, no. 4, pp. 772–776, Oct. 2009.
- [7] F. Samadi, G. Akbarizadeh, and H. Kaabi, “Change detection in SAR images using deep belief network: a new training approach based on morphological images,” IET Image Processing, vol. 13, no. 12, pp. 2255-–2264, Oct. 2019.
- [8] Q. Wang, Z. Yuan, Q. Du and X. Li, “GETNET: A general end-to-end 2-D CNN framework for hyperspectral image change detection,” IEEE Transactions on Geoscience and Remote Sensing, vol. 57, no. 1, pp. 3–13, Jan. 2019.
- [9] Y. Li, C. Peng, Y. Chen, L. Jiao, L. Zhou and R. Shang, “A deep learning method for change detection in synthetic aperture radar images,” IEEE Transactions on Geoscience and Remote Sensing, vol.57, no. 8, pp. 5751–5763, Aug. 2019.
- [10] F. Liu, L. Jiao, X. Tang, S. Yang, W. Ma, and B. Hou, “Local restricted convolutional neural network for change detection in polarimetric SAR images,” IEEE Transactions on Neural Networks and Learning Systems, vol. 30, no. 3, pp. 818–-833, Mar. 2019.
- [11] C. Wu, M. Zaheer, H. Hu, R. Manmatha, A. J. Smola and P. Krähenbühl, “Compressed video action recognition,” IEEE Conference on Computer Vision and Pattern Recognition (CVPR), 2018, pp. 6026–6035.
- [12] K. Xu, M. Qin, F. Sun, Y. Wang, Y.-K. Chen, F. Ren, “Learning in the frequency domain,” IEEE Conference on Computer Vision and Pattern Recognition (CVPR), 2020, pp. 1740–1749.
- [13] Bazi Y, Bruzzone L, Melgani F. “Automatic identification of the number and values of decision thresholds in the log-ratio image for change detection in SAR images,” IEEE Geoscience and Remote Sensing Letters, vol. 3, no. 3, pp. 349-353, Jul. 2006.
- [14] F. Gao, J. Dong, B. Li and Q. Xu, “Automatic change detection in synthetic aperture radar images based on PCANet,” IEEE Geoscience and Remote Sensing Letters, vol. 13, no. 12, pp. 1792–1796, Dec. 2016.
- [15] F. Gao et al., “Change detection from synthetic aperture radar images based on neighborhood-based ratio and extreme learning machine,” J. Appl. Remote Sens., vol. 10, no. 4, 084684, Dec. 2016.
- [16] M. Gong, J. Zhao, J. Liu, Q. Miao, and L. Jiao, “Change detection insynthetic aperture radar images based on deep neural networks,” IEEE Transactions on Neural Networks and Learning Systems, vol. 27, no. 1, pp. 125–138, Jan. 2016.
- [17] Y. Gao, F. Gao, J. Dong and S. Wang, “Change detection from synthetic aperture radar images based on channel weighting-based deep cascade network,” IEEE Journal of Selected Topics in Applied Earth Observations and Remote Sensing, vol. 12, no. 11, pp. 4517-4529, Nov. 2019.
- [18] R. Wang, F. Ding, J. -W. Chen, B. Liu, J. Zhang and L. Jiao, “SAR image change detection method via a pyramid pooling convolutional neural network,” 2020 IEEE International Geoscience and Remote Sensing Symposium, pp. 312-315, Oct. 2020.