*\AtTextUpperLeft
Machine-learned 3D Building Vectorization from Satellite Imagery
Abstract
We propose a machine learning based approach for automatic 3D building reconstruction and vectorization. Taking a single-channel photogrammetric digital surface model (DSM) and a panchromatic (PAN) image as input, we first filter out non-building objects and refine the building shapes of the input DSM with a conditional generative adversarial network (cGAN). The refined DSM and the input PAN image are then used through a semantic segmentation network to detect edges and corners of building roofs. Later, a set of vectorization algorithms are proposed to build roof polygons. Finally, the height information from refined DSM is processed and added to the polygons to obtain a fully vectorized level of detail (LoD)-2 building model. We verify the effectiveness of our method on large-scale satellite images, where we obtain state-of-the-art performance.
1 Introduction
The availability of accurate 3D building models has become highly demanded in various applications like the modeling of global urbanization process, urban planning, disaster monitoring, \etc. As traditional methods performed by human operators for 3D building modeling are expensive, time-consuming and limited to a small area, modern automatic 3D building model reconstruction methods have drawn wide research interests.
Current automatic 3D building reconstruction methods can be generally categorized into data-driven, model-driven and hybrid approaches. While model-driven approaches extract the primitives of buildings and fit them to the most appropriate models [17], data-driven methods extract geometrical components of building roof planes from 3D point clouds or digital surface models (DSMs) with point- or image-based segmentation techniques, and these components are merged to 3D models with respect to some geometrical topology [27]. With model-driven methods being unable to solve complex situations and data-driven methods being commonly noisy, hybrid approaches, including this work, tend to integrate the two types of approaches, where a data-driven approach extracts the building components, and a model-driven approach utilizes prior knowledge of the geometrical building models to help reconstruct 3D buildings [35].
While light detection and ranging (LiDAR) point clouds and aerial images have been the most common sources to extract 3D building information in the past years [9, 10, 12], satellite images become more and more important as they are convenient to acquire, cover wide areas and update frequently. Apart from optical images, modern satellites can also provide DSMs using photogrammetric stereo matching techniques, from which we can extract both building objects and their height information. However, satellite DSMs show a reasonable amount of noise and outliers because of matching errors or the existence of non-building objects, thus refinement methods have been studied to improve their quality. With traditional methods using filter-based techniques like principle component analysis (PCA) [20], Kalman filter [30] and fast Fourier transform (FFT) [3] to remove outliers, recent researches have shown promising improvement by using deep learning based methods. Bittner et al. [5] proposed firstly a conditional generative adversarial network (cGAN) based approach to filter out non-building objects and refine building shapes of photogrammetric DSMs, which was further developed by a set of works [6, 7, 8] to step-by-step improve the generation quality. Stucker and Schindler [26] proposed an improvement for traditional stereo image matching by regressing a residual correction with a convolutional neural network.
The revolutionary appearance of machine learning and deep learning techniques has also brought significant contributions to the whole process of 3D building reconstruction tasks. Not only building footprints can be extracted and regularized with neural networks [28, 34, 36], but also the heights and roof elements can be detected and predicted [1, 2], leading to constructed 3D building models. Recent researches can be found in [21], where the authors combined building object detection, semantic segmentation and height prediction in a multi-task manner, and [29], where the authors proposed a deep learning based model-driven approach to perform parametric building reconstruction. While most of these researches focusing on level of detail (LoD)-1, LoD-2 building modeling is relatively new. One example is presented in [24], where a hybrid 3D building reconstruction method is applied to detect and decompose building boundaries, classify roof types, and fit predefined building models.
Challenges for LoD-2 building reconstruction contain the requirement for accurate building height prediction and roof element extraction, and the complexity to form vectorized 3D roofs. Most existing methods utilize or predict coarse height maps for detection tasks of neural networks and later perform optimization [2, 24]. Our work, by contrast, uses network refined DSMs to extract roof elements and proposes a corresponding vectorization pipeline to form 3D models.
In this paper, we propose a machine learning based approach to reconstruct LoD-2 building models from photogrammetric DSMs and panchromatics (PANs) image obtained from satellites. Our contributions can be described as following:
- •
-
•
We propose an edge and corner detection network sharing the architecture of the previous DSM refinement network.
-
•
We propose a novel vectorization pipeline to polygonize building roofs and reconstruct 3D building models.
2 Methodology
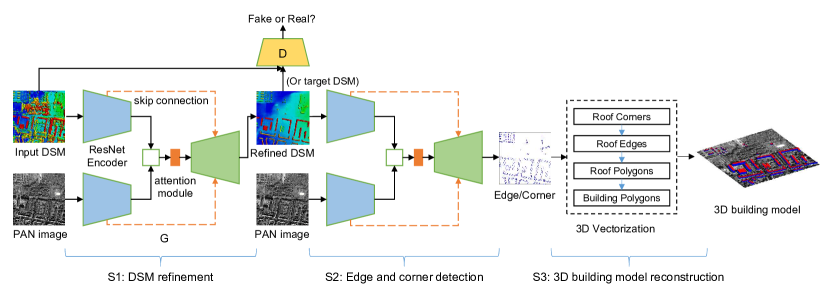
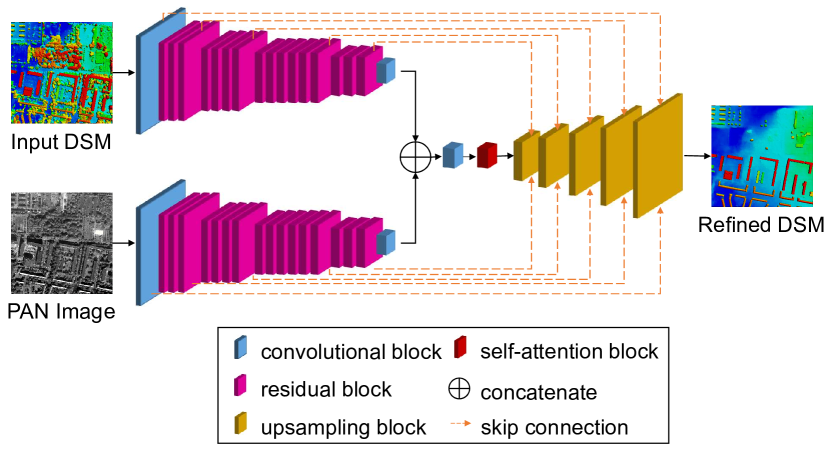
As is shown in Figure 2, our multi-stage 3D building vectorization approach starts with a cGAN architecture for photogrammetric DSM building shape refinement. The refined DSM, together with the input PAN image, is then used to detect building edges and corners with a semantic segmentation network that shares the structure of the cGAN generator. The detected edges and corners are later vectorized to building roof polygons. In the final stage, the refined DSM and 2D polygons are combined to reconstruct 3D building models.
2.1 DSM building shape refinement
The proposed deep neural network for DSM refinement is an extension of the network presented by Bittner et al. [7] based on an image-to-image translation cGAN introduced by Isola et al. [14]. The network jointly learns a generator and a discriminator to do the domain transfer, \iefrom a source domain, the photogrammetric DSM, to a target domain, the refined DSM. With the discriminator following the PatchGAN architecture proposed by Isola et al. [14], the generator has a UNet-like structure with both long skip connections from the encoders to the decoder and short skip connections in-between the residual blocks inside the encoders. To enhance the feature of building objects, we add a CBAM as presented by Woo et al. [32] before the decoder. The CBAM is a combination of 1D channel attention and 2D spatial attention, which are sequentially multiplied to the input feature maps. The overall generator architecture is shown in Figure 3.
Following the idea presented by Bittner et al. [7], we combine several types of losses in a multi-task manner for optimizing the proposed DSM refinement network:
| (1) |
where , and represent the weighting parameters of different loss terms.
GAN loss. We combine a conditional GAN [23] and a Least Squares GAN [22] for the DSM refinement network, thus a convolutional least squares GAN (cLSGAN) loss is utilized:
| (2) |
where represents real samples, and represents generated samples transferred from usually latent noise variables . Respectively, denotes the generative adversarial network (GAN)’s condition (the input DSM), represents discriminator output of real samples, and represents discriminator output of generated samples.
L1 loss. It is common to blend the objective functions for GANs with traditional regression losses like or distances to help the generator create images as close as possible to the given ground truth. Since loss encourages less blurring to the image boundaries, it is added to our generator losses:
| (3) |
Normal vector loss. To further refine the surface of building roof planes, a normal vector loss [13], which measures the angles between normal vectors of generated and target DSMs, is added to the generator losses:
| (4) |
where and represent normal vectors of the target and predicted DSM, and denotes the scalar product of the two vectors. This normal vector loss emphasizes the planarity and inclination of building roofs. The smaller the angle, the more planar the predicted surface and the more consistent to the target surface.
The combination of different losses forms a multi-task learning problem, thus an automatic weighting method proposed firstly by Kendal et al. [15] and investigated in remote sensing in [18, 19] is applied to automatically tune the loss weights considering the homoscedastic uncertainty of each separate task:
| (5) |
where is a learnable parameter, which represents the variance, \ieuncertainty of each task through the training process. In order to avoid over-controlled parameter values, a regularization term is added following each weighted loss. As a result, the final loss of the generator of this DSM refinement network can be formulated as:
| (6) |
while the discriminator loss remains the same as the cLSGAN loss:
| (7) |
2.2 Building edge and corner detection
Given the refined DSM and PAN image, a semantic segmentation network is used to detect building edges and corners. The network architecture is identical to the generator of the DSM refinement network (see Figure 3), except the change of the three-channel output layer. A simple multi-class cross-entropy loss is applied:
| (8) |
where is the predicted probability for a certain class , and is either 0 or 1 depending on the label of class for the corresponding target. The output probability remains for further processing.
2.3 3D building model reconstruction
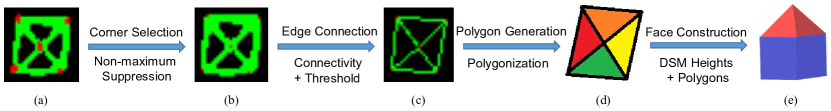
In the final stage, a novel 3D building vectorization method is proposed using the refined DSM and detected building edges and corners. Assuming building edges are straight lines, the core idea is to step-by-step build a graph data structure that stores points, lines, faces and their relationships for every single building. As being a hybrid method, the proposed approach is not limited to the complexity of different types of buildings, thus performing well especially for large area 3D building modeling. A general workflow is shown in Figure 4.
Corner point selection. For each corner pixel in the ground truth, multiple surrounding pixels may be detected as corners, thus a non-maximum suppression (NMS) algorithm is implemented to filter out best fitting corner points. As is shown in Figure 4 , for each detected corner pixel (the candidate), a surrounding window is used as the evaluating box. For each neighbor pixel in this window, if the pixel value (corner probability) is no bigger than the candidate, it is set to zero; otherwise if it exceeds the candidate, this pixel remains while the candidate is set to zero. This process is iterated over all corner candidates and those isolated best candidates are seen as final corner points.
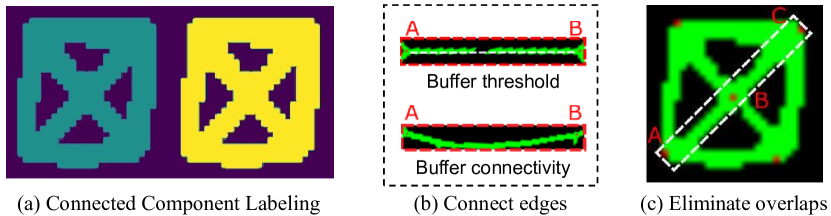
Roof edge vectorization. Before we start the vectorization process, a connected component labeling (CCL) [33] algorithm is applied to label connected pixels into building instances. Two pixels are connected when they are neighbors and have a non-zero value. Here the neighborhood is defined in a 2-connected sense, which means every pixel has eight neighbors in eight directions. As shown in Figure 5 , different sets of connected pixels would have different IDs and separate different buildings, which enables the next steps to be performed within the scope of every single building.
Then we connect the corners to form edges based on two conditions. The first condition is the average pixel value of a line buffer between a pair of corner points. If the average value is above a threshold, an edge line is determined between the corners. This condition would possibly fail when the edge is curved in reality, thus a second condition is applied in parallel. By utilizing the CCL algorithm again in a rectangle buffer between the pair of corners, an edge is determined if the labels of the two corners are identical. Two examples are shown in Figure 5 , where both an edge with a hole and a little curved edge can be successfully detected.
With the two conditions we can efficiently and thoroughly detect building edges, yet still one problem needs to be considered. As it is shown in Figure 5 , corner and , corner and form two edges, but corner and corner can also form an edge which is redundant since it covers and . To solve this issue, we again create a rectangle buffer for each potential two-corner pair and, if other corner points exist inside this buffer, this pair can not form an edge anymore.
Roof polygon generation. The vectorized edges are then polygonized to roof faces ( see Figure 4 ), which can be easily done by graph search algorithms. For each building, an undirected graph is firstly built from the obtained edges. A simple depth first search (DFS) is then applied to detect and mark a cycle (\iea roof polygon) in this graph by tracing a back edge to vertices that have been visited. This is run iteratively to extract all cycles with corresponding different marks. To avoid face overlapping, large cycles which cover small cycles are removed in the final step. In practice, the polygonization process can also be directly applied with a function from the open-source shapely package which is popular for manipulation and analysis of planar geometric objects [11].

3D building modeling. In the final stage, walls and the ground face are constructed utilizing roof polygons and the refined DSM to produce a full 3D building model. Firstly, a normalized digital surface model (nDSM) is generated from the refined DSM with the method proposed by Qin et al. [25]. Then the adjacent roof faces are merged into a union, \iea polygon whose edges are the building outlines. This gives us the footprints of the building, which also means the 2D shape of the ground face. In the next step, the height information from the nDSM is applied to corner points both inside roofs and on the building boundaries. To avoid apparent height difference between endpoints of an edge due to corner miss-matching (especially on outer boundaries where corner height is supposed to be much bigger than neighboring ground pixels), a small window is applied again to adjust height values. This is done by giving the corner point the maximum height value in this small window. Though slightly decreasing general accuracy, it can largely improve the robustness and smoothness of resulting 3D models.
The edges of the union polygon represent both the upper and lower boundaries of the building’s surrounding walls. With the height of upper corners already determined with the maximum height value in the window, the height of lower corners is determined by giving the minimum height value in the window, \iezero, hence forming the building walls in 3D. Meanwhile, the lower edges form also the ground face of the building, resulting in the final 3D building model. The modeling process is shown in Figure 6.
3 Experiments and results
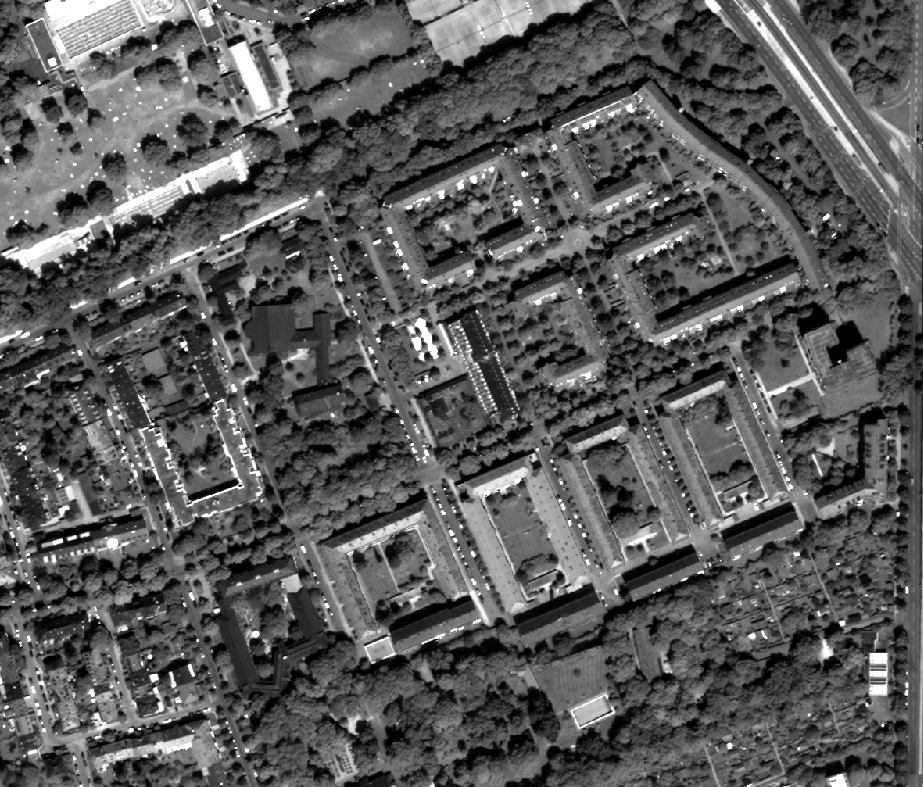
The proposed approach is evaluated on Worldview-1 data of Berlin, Germany. The input consists of a space-borne photogrammetric DSM and a panchromatic image with 0.5 spatial resolution covering a total area of 410 . The ground truth is generated from the public city geography markup language (CityGML) dataset following the same procedure as described in [4]. The CityGML data for Berlin is freely available at https://www.businesslocationcenter.de/en/economic-atlas/download-portal/. Open datasets for some other worldwide cities can be found at https://3d.bk.tudelft.nl/opendata/opencities/.
3.1 Implementation details
The DSM refinement network is based on the Coupled-UResNet cGAN architecture proposed by Bittner et al.[7], with an additional CBAM [32] applied before the decoder. The edge and corner detection network shares the architecture of the generator of the DSM refinement network, while the last layer is changed to three-channel output with a activation function.
The networks are trained on a single NVIDIA TITAN X (PASCAL) GPU with 12 GB memory. To fit the training data into the GPU memory, the satellite images are tiled into 21480 samples of size 256256 px. A minibatch of 4 is applied in both networks. The samples are augmented not only by horizontal and vertical flipping but also tiled from the original image with a random overlap every epoch to give the model a clue about building geometries which happened to be on the patch border in previous epochs. During the training of both networks, the ADAM optimizer is used with an initial learning rate of and momentum parameters . For the DSM refinement network, the generator is pre-trained for 100 epochs as a warm-up and later interpolated with the cGAN’s generator. This so-called network interpolation [31] can balance CNN’s over-smoothing and GAN’s over-sharpening. The initial learnable weighting parameters as described in Equation 5 are equally set to 1.
During the vectorization process, the window size for both corner point filtering and corner height valuing is set to pix, while the width for rectangle buffers (edge connecting and overlap elimination shown in Figure 5 ) is set to 7 pix.
3.2 Results and evaluation
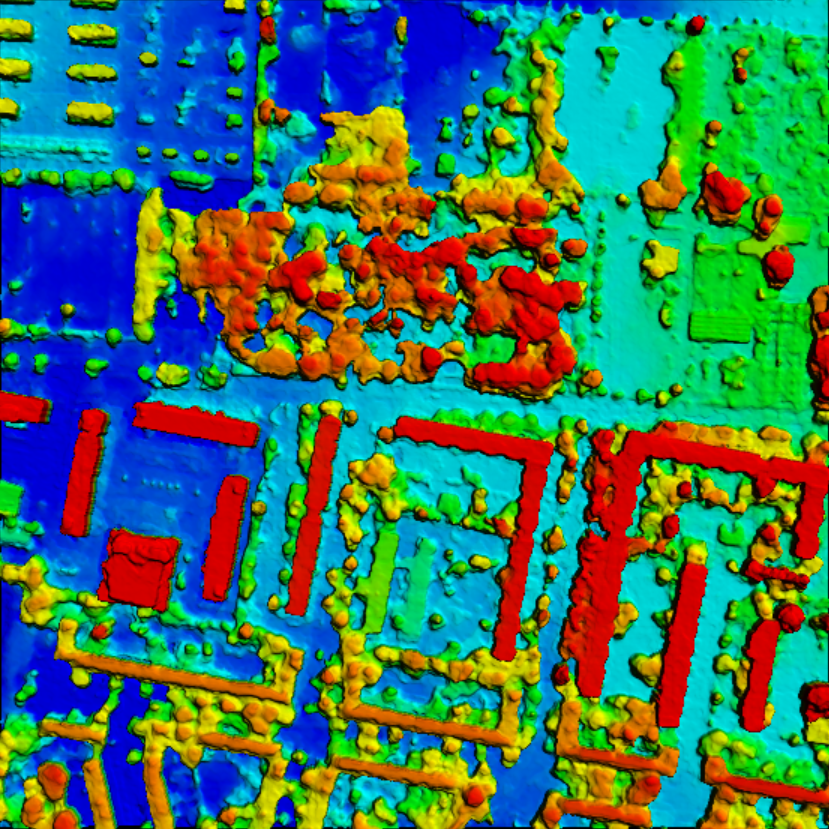
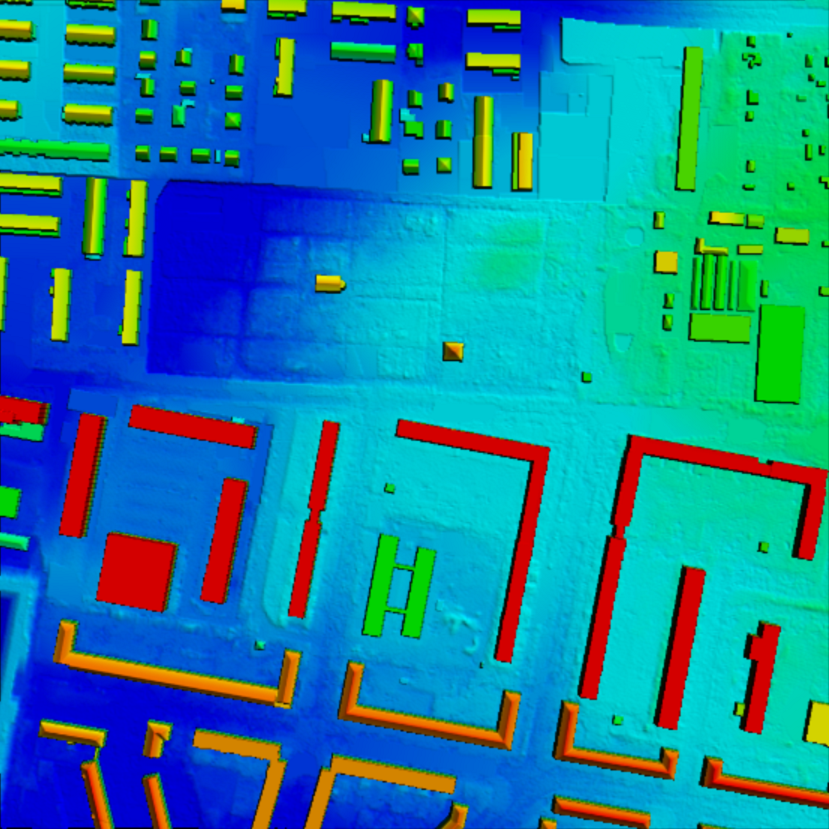
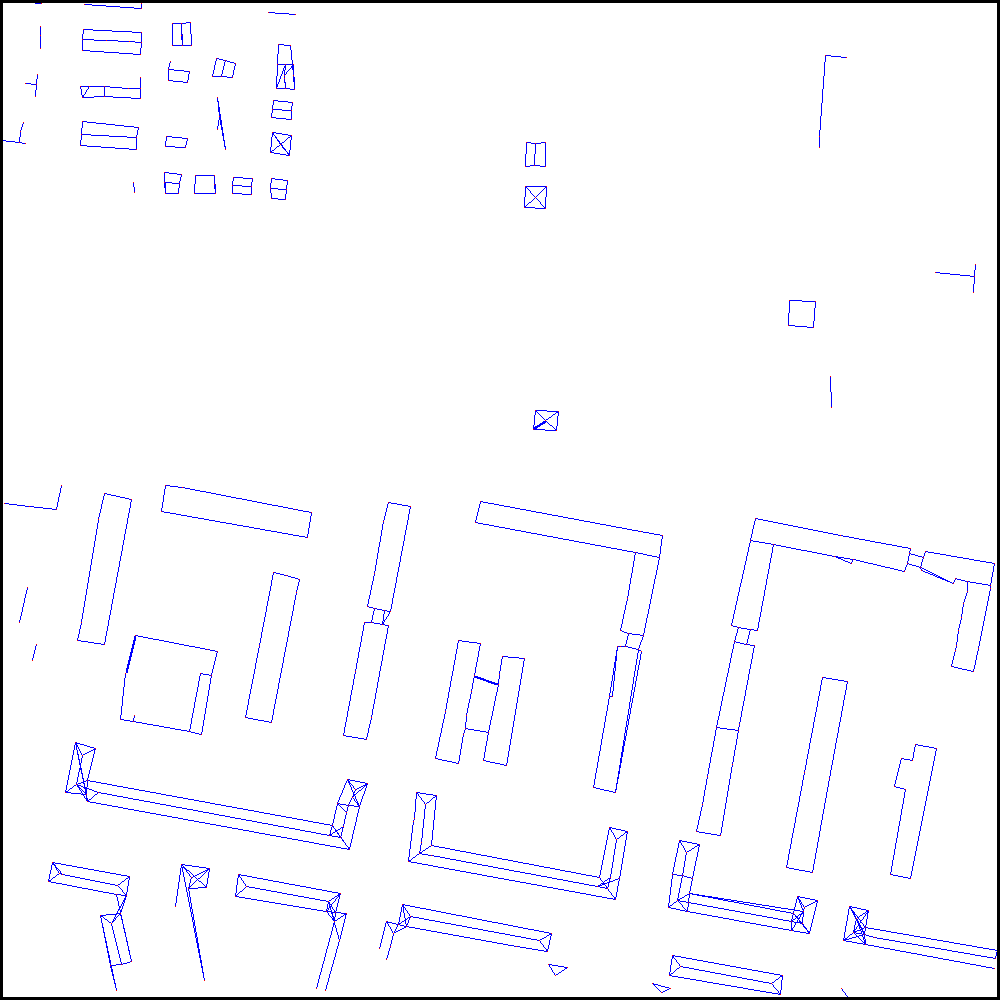
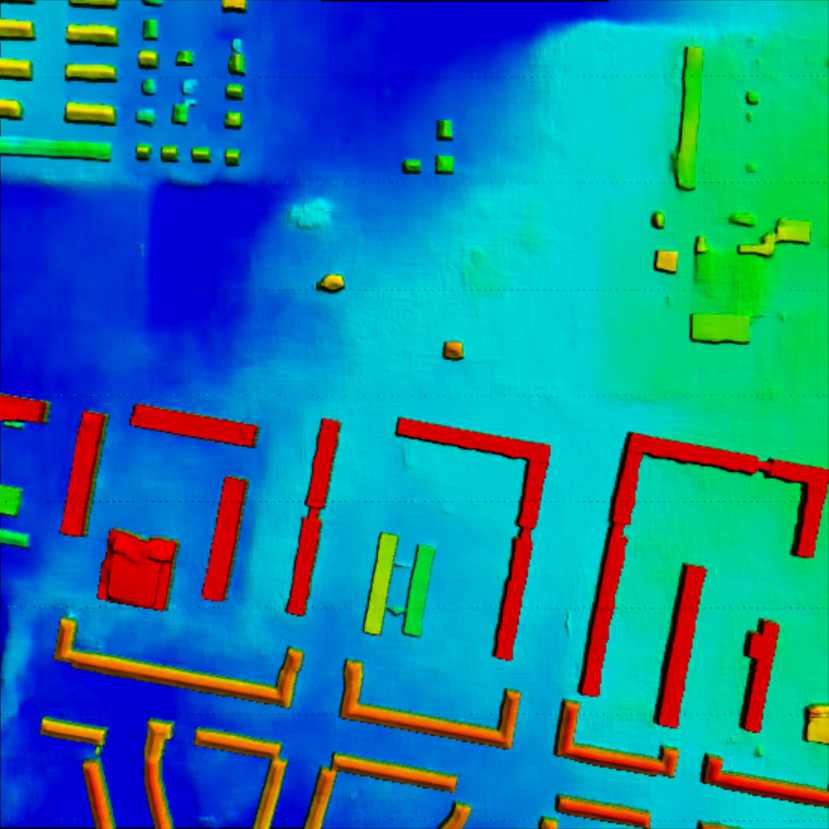
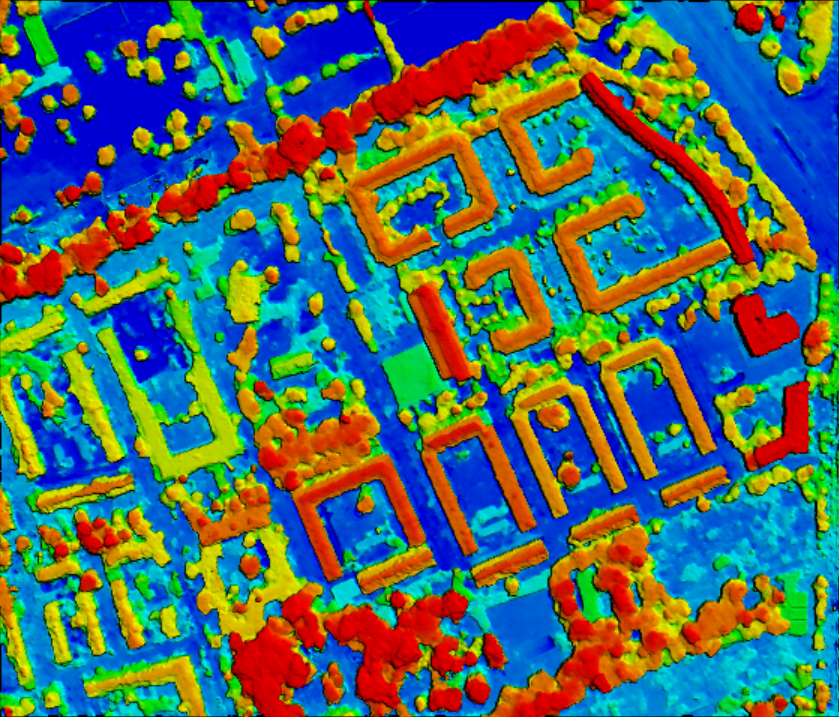
Figure 7 shows the DSM refinement result, from which it can be seen that the proposed network can both filter out and regularize building objects from the photogrammetric DSM. This in parallel shows the robustness and accuracy of our approach to detect correct buildings, as we can see from Figure 7 that the ground truth consists of several buildings that are not shown in satellite images due to the time difference. Mean absolute error (MAE), root mean squared error (RMSE) and normalised median absolute deviation (NMAD) are applied for quantitative evaluation of the DSM refinement result:
| (9) |
| (10) |
| (11) |
where denotes the predicted heights, denotes the target heights, denotes height error and denotes median height error. As is shown in Table 1, our network improves all three metrics evaluated over the testing area compared to Bittner et al. [7]. The RMSEs of all DSMs are relatively large compared to the ground truth, which can be explained by the time difference between the reference data and the given satellite DSM. There can be cases when in one data source the buildings exist and in the other not (due to new buildings construction or their destruction), and vice versa.
| MAE (m) | RMSE (m) | NMAD (m) | |
|---|---|---|---|
| Photogrammetric DSM | 3.91 | 7.14 | 1.40 |
| Bittner et al. [7] | 1.73 | 4.02 | 0.93 |
| Ours (with attention) | 1.42 | 3.65 | 0.60 |
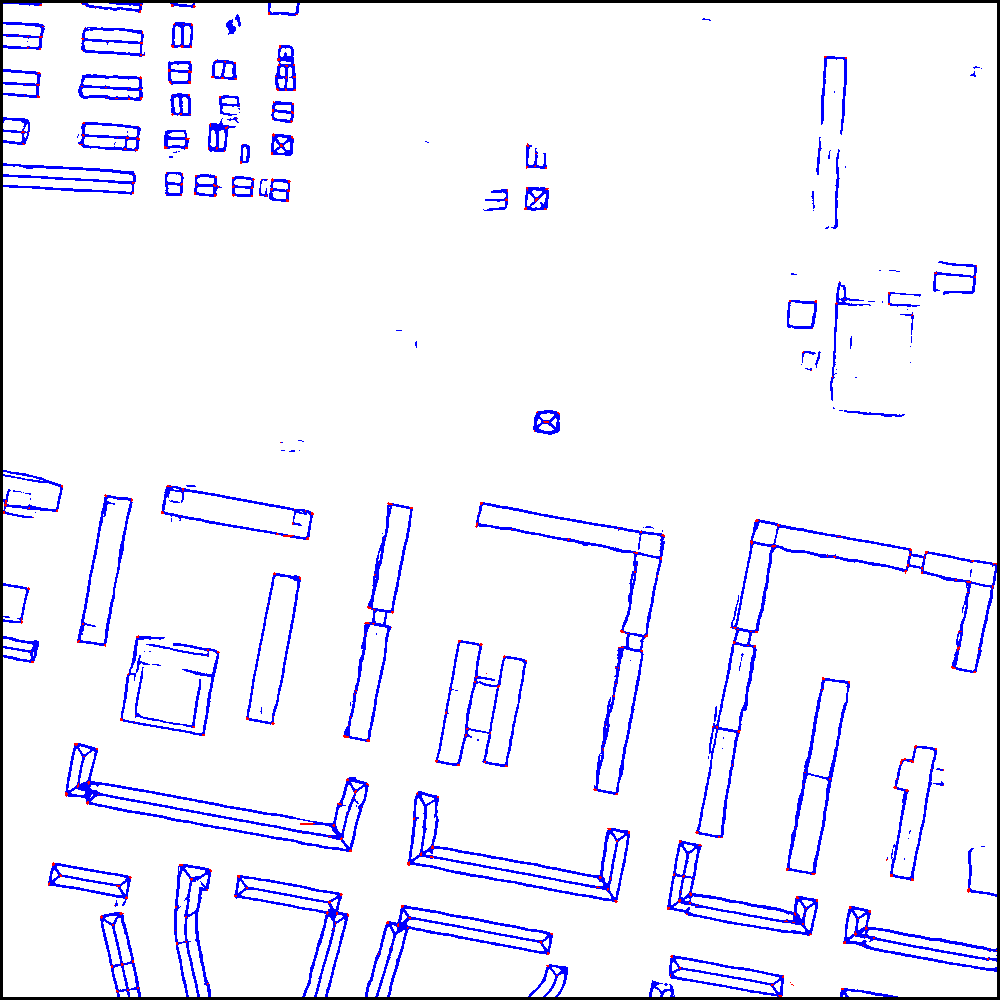
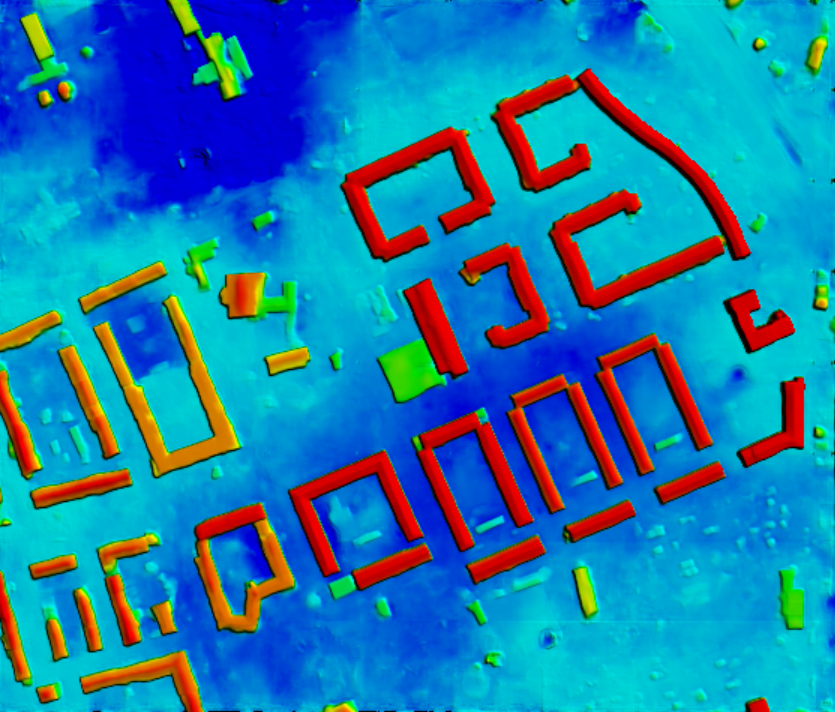
Figure 7 and present the edge and corner detection and vectorization results. By combining building height and shape information from the refined DSM and intensity information from the PAN image, the results show well-formed building skeletons with accurate corners and complete outlines. As a result of the requirements from the vectorization process, edges which have only one or none corner detected, or which are over-curved are unable to be determined. However, though missing some of the expected line segments, most of the building outer boundaries and inner edges are successfully constructed. Meanwhile, it might be helpful to mention that during the experiments we tried also combining the two steps (DSM refinement and edge and corner detection) together in a multi-task manner, but the results got worse, as the edge and corner detection network benefits more from an already refined DSM as input.
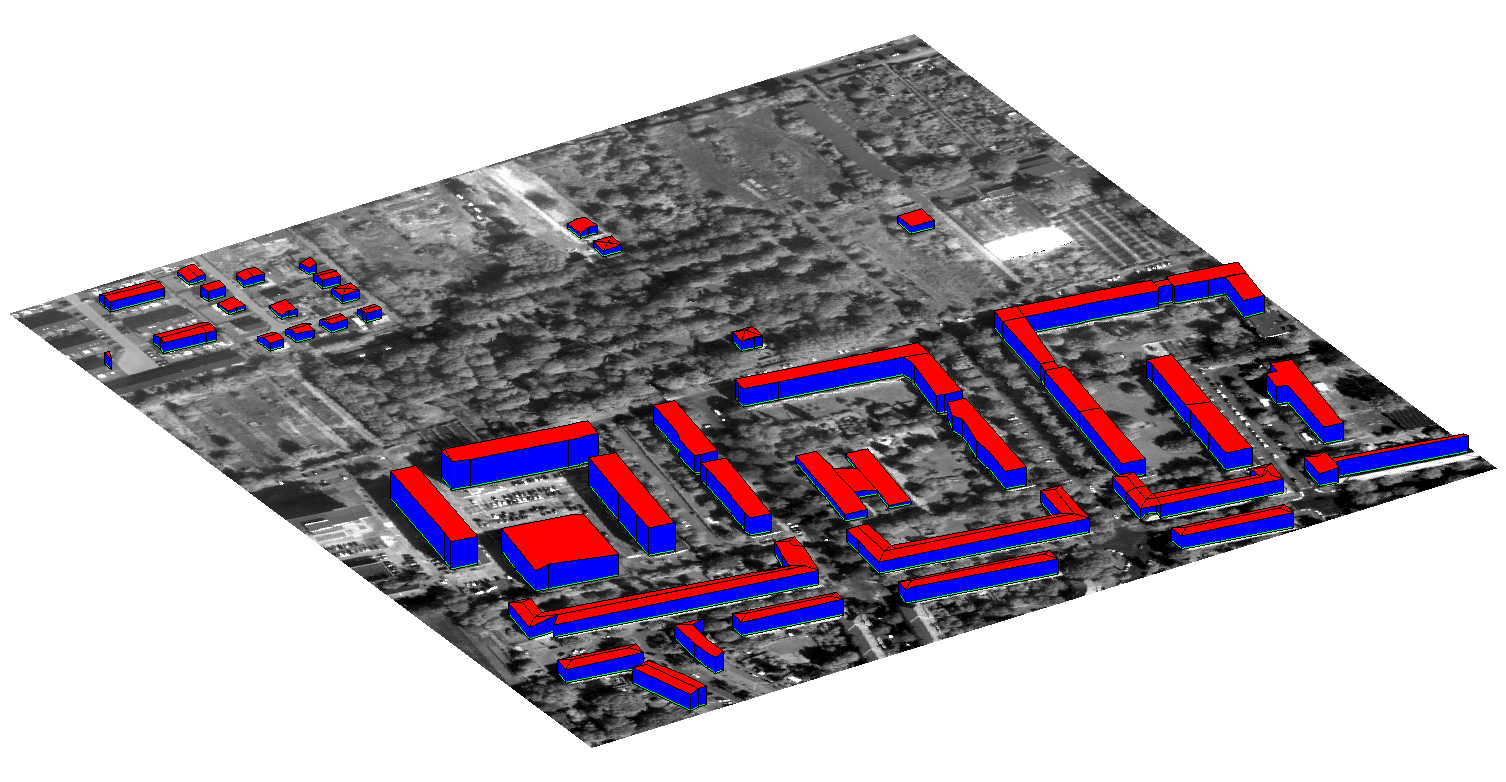
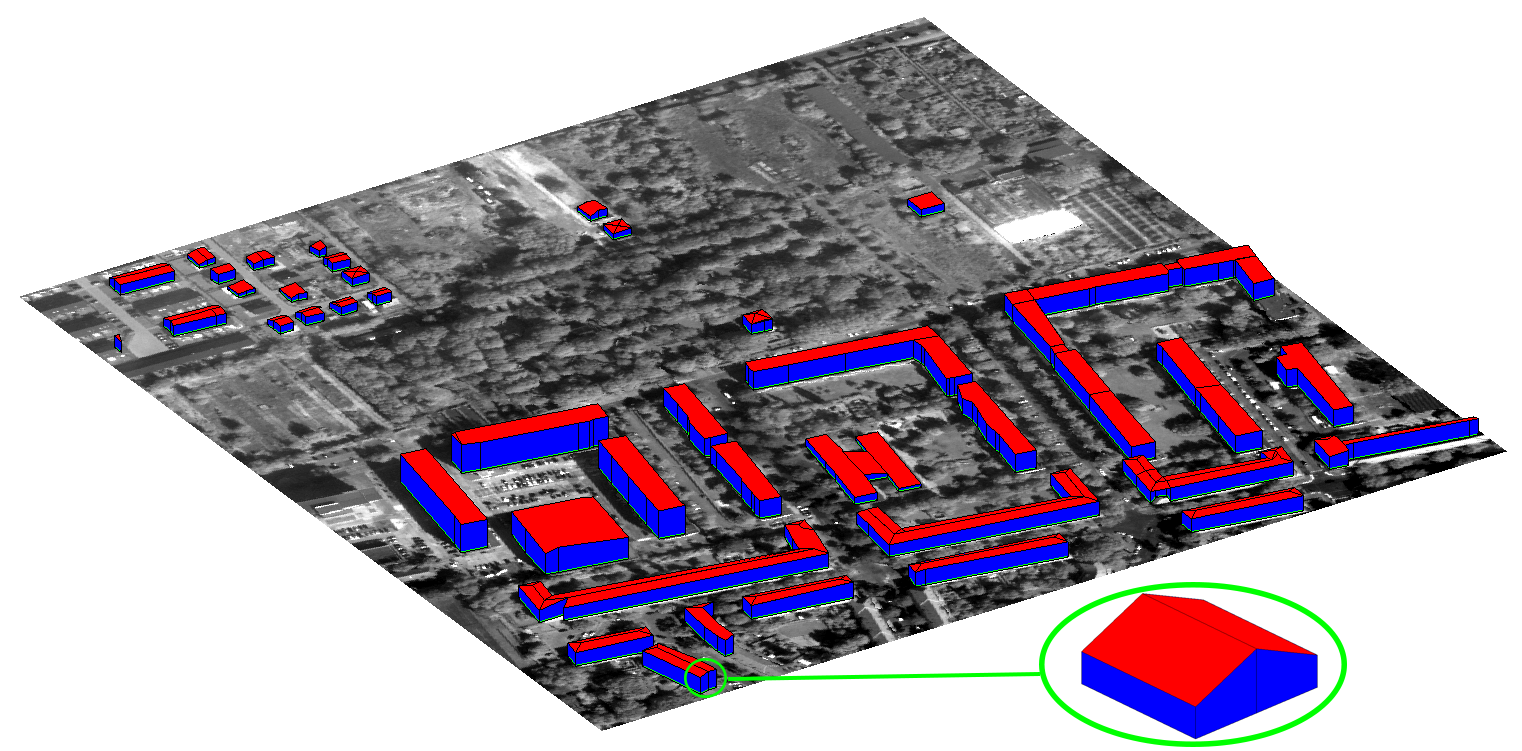
The final vectorized 3D building model is shown in Figure 8, where most of the buildings are well reconstructed in 3D space. Even though some buildings are not fully visible in PAN image and blurry in photogrammetric DSM, we can still reconstruct them to a good shape. It is also seen that some buildings are missing or incomplete, which is due to the missing of those vectorized edges and corners whose quality doesn’t meet the vectorization process.
For quantitative evaluation of the height of reconstructed buildings, the generated nDSM is compared to the ground truth. MAE, RMSE and NMAD are applied again to evaluate the quality of the generated nDSM. The evaluation result is shown in Table 2, from which we can see that both photogrammetric nDSM and our genereated nDSM have better metrics than DSMs (Table 1) after removing the height of ground surface. Meanwhile, our result presents large improvement compared to photogrammetric nDSMs.
| MAE (m) | RMSE (m) | NMAD (m) | |
|---|---|---|---|
| Photogrammetric nDSM | 3.21 | 6.04 | 0.85 |
| Ours | 0.80 | 2.28 | 0.47 |
| min (∘) | max (∘) | mean (∘) | (∘) | |
|---|---|---|---|---|
| Photogrammetric nDSM | 0.08 | 75.84 | 22.46 | 22.28 |
| Ours | 0.10 | 75.83 | 9.31 | 15.53 |
To evaluate the quality of the reconstructed 3D roofs, an orientation error is applied to examine the inclination of the constructed roof planes. As proposed by Koch et al. [16], the orientation error can be formulated as the angle difference between the normal vectors of 3D planes fitted to the predicted surface points and the given ground truth points:
| (12) |
where and denote the normal vector of a certain plane on target and predicted image respectively. represents the predicted depth image masked with a binary mask containing a certain number of roof planes. Table 3 shows the average orientation error of constructed 3D roof faces compared to corresponding ground truth, showing that the average plane angle is within 10∘, which is much better than using only the photogrammetric nDSM.
| Building No. | Ridge (m) | Eave (m) | ||||
| Reference | Partovi et al.[24] | Ours | Reference | Partovi et al.[24] | Ours | |
| 17 | 15 | 14.03 | 15.05 | 11 | 11.29 | 11.72 |
| 18 | 19 | 17.46 | 18.21 | 15 | 13.38 | 15.50 |
| 19 | 15 | 14.42 | 16.13 | 11 | 12.52 | 13.01 |
| 20 | 15 | 14.22 | - | 11 | 10.86 | - |
| 21 | 15.5 | 14.08 | 15.33 | 11.9 | 12.21 | 11.54 |
| 22 | 15.6 | 15.28 | 14.87 | 11.5 | 11.87 | 11.94 |
| 23 | 20.0 | 20.76 | 21.80 | 16.5 | 17.35 | 17.58 |
| 24 | 16.2 | 15.87 | 17.03 | 12.3 | 11.03 | 13.66 |
| 25 | 17.4 | 16.21 | 18.02 | 13.6 | 13.58 | 13.77 |
| 26 | 16.8 | 16.40 | 17.19 | 12.5 | 10.54 | 11.36 |
| 27 | 15 | 14.66 | 13.88 | 10.9 | 10.49 | 11.40 |
| 28 | 16.8 | 16.27 | 17.11 | 12.5 | 10.41 | 12.96 |
| 29 | 14.7 | 13.94 | 15.54 | 10.7 | 10.46 | 11.06 |
| 30 | 16.8 | 15.66 | 16.00 | 12.5 | 10.51 | 13.79 |
| - | 0.79 | 0.74 | - | 0.93 | 0.99 | |
| - | 0.41 | 0.44 | - | 0.77 | 0.74 | |
| RMSE | - | 0.89 | 0.74 | - | 1.20 | 1.54 |
| NMAD | - | 0.55 | 0.59 | - | 0.82 | 0.68 |
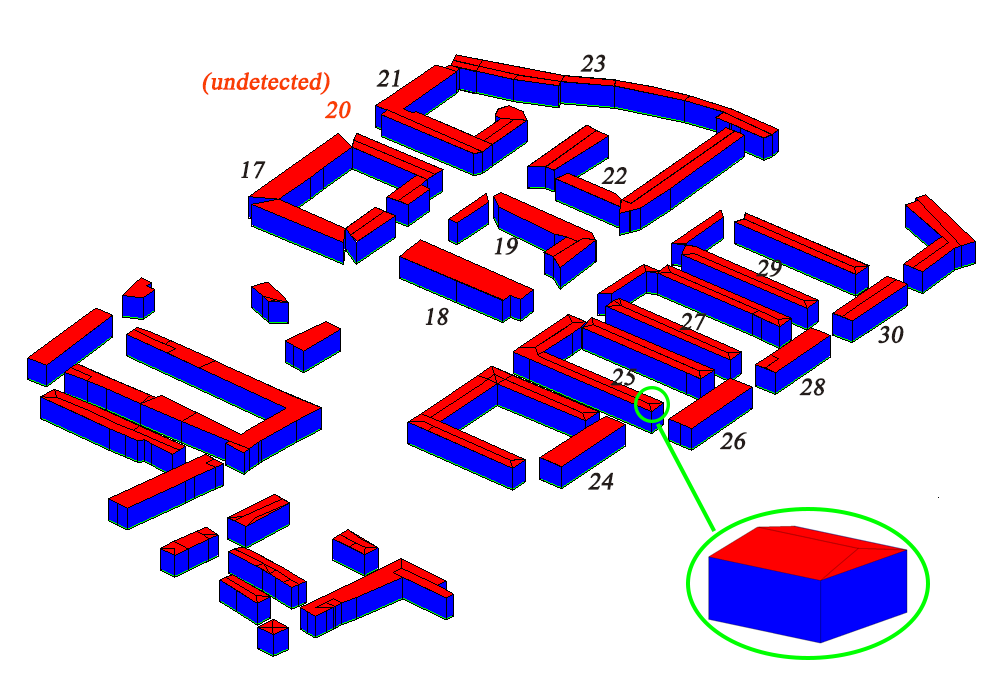
In addition, we compare our proposed 3D building vectorization method with the work presented by Partovi et al. [24], who developed a multi-stage hybrid method for 3D building reconstruction using PAN images, photogrammetric DSMs and multi-spectral images from satellite data. Figure 9 presents the reconstruction results of a sub-area of Munich using Worldview-2 satellite data. The ridge and eave heights of 14 reconstructed buildings in this area are compared with reference data from the Department of Urban Planning and Building (DUPB) of Munich. As is shown in Table 4, denotes the absolute height difference between the predicted model and reference, and and represent the mean and standard deviation of the height difference, respectively. The building numbers refer to Figure 9 . It can be seen that both methods lead to lower accuracy in eave heights than ridge heights because the surroundings of building boundaries are usually more complex than inner-roof ridges both in PAN image and photogrammetric DSM. Our method tends to get bigger values for eave heights, which can be explained by our valuing method for the height of building corners. In order to avoid the mismatching between DSM heights and corner positions, we give the eave corner the maximum height value in a surrounding window and the minimum height value for the corresponding ground corner. This would increase the relative height of the building eaves, yet we can see that this systematic error is within a small range. Apart from that, the overall accuracy shows promising superiority of our method, where we get comparative metric performance with a simpler approach. Meanwhile, as a price of simplicity, the biggest problem remaining to be solved is the lack of completeness of our constructed model. As can be seen from both Figure 8 and Figure 9, some building components are lost after vectorization, which quantitatively reduces the recall score from to (Berlin testing area) compared to the refined DSM before vectorization.
4 Conclusion
In this paper, we present a multi-stage large-scale 3D building vectorization approach. We extend the application of recent deep learning based techniques on photogrammetric digital surface model (DSM) refinement and bring it to the application of automatic 3D building model reconstruction. With the help of a self-attention module, we obtain promising results for both regression of building heights and semantic segmentation of edges and corners. Based on that, we propose a simple yet effective vectorization pipeline to reconstruct level of detail (LoD)-2 building models. We apply non-maximum suppression (NMS) to filter out best fitting corner points, define buffer connectivity and buffer thresholds to determine edges, and polygonize them to roof faces. By utilizing again the height information from the refined DSM, we finally reconstruct fully vectorized 3D building models. Though limitations exist in straight edge assumptions and the completeness of reconstructed building models, results prove the overall robustness and accuracy of our proposed method.
References
- [1] Fatemeh Alidoost, Hossein Arefi, and Michael Hahn. Y-shaped convolutional neural network for 3d roof elements extraction to reconstruct building models from a single aerial image. ISPRS Annals of Photogrammetry, Remote Sensing & Spatial Information Sciences, 5(2), 2020.
- [2] Fatemeh Alidoost, Hossein Arefi, and Federico Tombari. 2d image-to-3d model: knowledge-based 3d building reconstruction (3dbr) using single aerial images and convolutional neural networks (cnns). Remote Sensing, 11(19):2219, 2019.
- [3] Katherine Arrell, Steve Wise, Jo Wood, and Danny Donoghue. Spectral filtering as a method of visualising and removing striped artefacts in digital elevation data. Earth Surface Processes and Landforms: The Journal of the British Geomorphological Research Group, 33(6):943–961, 2008.
- [4] Ksenia Bittner, Pablo d’Angelo, Marco Körner, and Peter Reinartz. Dsm-to-lod2: Spaceborne stereo digital surface model refinement. Remote Sensing, 10(12):1926, 2018.
- [5] Ksenia Bittner and Marco Korner. Automatic large-scale 3d building shape refinement using conditional generative adversarial networks. In Proceedings of the IEEE Conference on Computer Vision and Pattern Recognition Workshops, pages 1887–1889, 2018.
- [6] Ksenia Bittner, Marco Körner, Friedrich Fraundorfer, and Peter Reinartz. Multi-task cgan for simultaneous spaceborne dsm refinement and roof-type classification. Remote Sensing, 11(11):1262, 2019.
- [7] Ksenia Bittner, Lukas Liebel, Marco Körner, and Peter Reinartz. Long-short skip connections in deep neural networks for dsm refinement. The International Archives of the Photogrammetry, Remote Sensing and Spatial Information Sciences, 43(B2):383–390, 2020.
- [8] Ksenia Bittner, Peter Reinartz, and Marco Korner. Late or earlier information fusion from depth and spectral data? large-scale digital surface model refinement by hybrid-cgan. In Proceedings of the IEEE/CVF Conference on Computer Vision and Pattern Recognition Workshops, pages 0–0, 2019.
- [9] Claus Brenner. Building reconstruction from images and laser scanning. International Journal of Applied Earth Observation and Geoinformation, 6(3-4):187–198, 2005.
- [10] Liang-Chien Chen, Tee-Ann Teo, J-Y Rau, Jin-King Liu, and Wei-Chen Hsu. Building reconstruction from lidar data and aerial imagery. In Proceedings. 2005 IEEE International Geoscience and Remote Sensing Symposium, 2005. IGARSS’05., volume 4, pages 2846–2849. IEEE, 2005.
- [11] Sean Gillies et al. Shapely: manipulation and analysis of geometric objects, 2007–.
- [12] Norbert Haala and Martin Kada. An update on automatic 3d building reconstruction. ISPRS Journal of Photogrammetry and Remote Sensing, 65(6):570–580, 2010.
- [13] Junjie Hu, Mete Ozay, Yan Zhang, and Takayuki Okatani. Revisiting single image depth estimation: Toward higher resolution maps with accurate object boundaries. In 2019 IEEE Winter Conference on Applications of Computer Vision (WACV), pages 1043–1051. IEEE, 2019.
- [14] Phillip Isola, Jun-Yan Zhu, Tinghui Zhou, and Alexei A Efros. Image-to-image translation with conditional adversarial networks. In Proceedings of the IEEE conference on computer vision and pattern recognition, pages 1125–1134, 2017.
- [15] Alex Kendall, Yarin Gal, and Roberto Cipolla. Multi-task learning using uncertainty to weigh losses for scene geometry and semantics. In Proceedings of the IEEE conference on computer vision and pattern recognition, pages 7482–7491, 2018.
- [16] Tobias Koch, Lukas Liebel, Friedrich Fraundorfer, and Marco Korner. Evaluation of cnn-based single-image depth estimation methods. In Proceedings of the European Conference on Computer Vision (ECCV) Workshops, pages 0–0, 2018.
- [17] Florent Lafarge, Xavier Descombes, Josiane Zerubia, and Marc Pierrot-Deseilligny. Structural approach for building reconstruction from a single dsm. IEEE Transactions on pattern analysis and machine intelligence, 32(1):135–147, 2008.
- [18] Lukas Liebel, Ksenia Bittner, and Marco Körner. A generalized multi-task learning approach to stereo dsm filtering in urban areas. ISPRS Journal of Photogrammetry and Remote Sensing, 166:213–227, 2020.
- [19] Lukas Liebel and Marco Körner. Auxiliary tasks in multi-task learning. arXiv preprint arXiv:1805.06334, 2018.
- [20] Carlos López. Improving the elevation accuracy of digital elevation models: a comparison of some error detection procedures. Transactions in GIS, 4(1):43–64, 2000.
- [21] Jisan Mahmud, True Price, Akash Bapat, and Jan-Michael Frahm. Boundary-aware 3d building reconstruction from a single overhead image. In Proceedings of the IEEE/CVF Conference on Computer Vision and Pattern Recognition, pages 441–451, 2020.
- [22] Xudong Mao, Qing Li, Haoran Xie, Raymond YK Lau, Zhen Wang, and Stephen Paul Smolley. Least squares generative adversarial networks. In Proceedings of the IEEE international conference on computer vision, pages 2794–2802, 2017.
- [23] Mehdi Mirza and Simon Osindero. Conditional generative adversarial nets. arXiv preprint arXiv:1411.1784, 2014.
- [24] Tahmineh Partovi, Friedrich Fraundorfer, Reza Bahmanyar, Hai Huang, and Peter Reinartz. Automatic 3-d building model reconstruction from very high resolution stereo satellite imagery. Remote Sensing, 11(14):1660, 2019.
- [25] Rongjun Qin, Jiaojiao Tian, and Peter Reinartz. Spatiotemporal inferences for use in building detection using series of very-high-resolution space-borne stereo images. International Journal of Remote Sensing, 37(15):3455–3476, 2016.
- [26] Corinne Stucker and Konrad Schindler. Resdepth: Learned residual stereo reconstruction. In Proceedings of the IEEE/CVF Conference on Computer Vision and Pattern Recognition Workshops, pages 184–185, 2020.
- [27] Fayez Tarsha-Kurdi, Tania Landes, Pierre Grussenmeyer, and Mathieu Koehl. Model-driven and data-driven approaches using lidar data: Analysis and comparison. In ISPRS workshop, photogrammetric image analysis (PIA07), pages 87–92, 2007.
- [28] Maria Vakalopoulou, Konstantinos Karantzalos, Nikos Komodakis, and Nikos Paragios. Building detection in very high resolution multispectral data with deep learning features. In 2015 IEEE International Geoscience and Remote Sensing Symposium (IGARSS), pages 1873–1876. IEEE, 2015.
- [29] Ke Wang and Jan-Michael Frahm. Single view parametric building reconstruction from satellite imagery. In 2017 International Conference on 3D Vision (3DV), pages 603–611. IEEE, 2017.
- [30] Ping Wang. Applying two dimensional kalman filtering for digital terrain modelling. Proceedings of International Archives of Photogrammetry, Remote Sensing, and Spatial Information Sciences, pages 649–656, 1998.
- [31] Xintao Wang, Ke Yu, Shixiang Wu, Jinjin Gu, Yihao Liu, Chao Dong, Yu Qiao, and Chen Change Loy. Esrgan: Enhanced super-resolution generative adversarial networks. In Proceedings of the European Conference on Computer Vision (ECCV) Workshops, pages 0–0, 2018.
- [32] Sanghyun Woo, Jongchan Park, Joon-Young Lee, and In So Kweon. Cbam: Convolutional block attention module. In Proceedings of the European conference on computer vision (ECCV), pages 3–19, 2018.
- [33] Kesheng Wu, Ekow Otoo, and Arie Shoshani. Optimizing connected component labeling algorithms. In Medical Imaging 2005: Image Processing, volume 5747, pages 1965–1976. International Society for Optics and Photonics, 2005.
- [34] Kang Zhao, Jungwon Kang, Jaewook Jung, and Gunho Sohn. Building extraction from satellite images using mask r-cnn with building boundary regularization. In Proceedings of the IEEE Conference on Computer Vision and Pattern Recognition Workshops, pages 247–251, 2018.
- [35] Yuanfan Zheng, Qihao Weng, and Yaoxing Zheng. A hybrid approach for three-dimensional building reconstruction in indianapolis from lidar data. Remote Sensing, 9(4):310, 2017.
- [36] Stefano Zorzi, Ksenia Bittner, and Friedrich Fraundorfer. Machine-learned regularization and polygonization of building segmentation masks. arXiv preprint arXiv:2007.12587, 2020.