Abstract
We study the properties of the faint X-ray activity of Galactic transient black hole candidate XTE J1908+094 during its 2019 outburst. Here, we report the results of detailed spectral and temporal analysis during this outburst using observations from Nuclear Spectroscopic Telescope Array (NuSTAR). We have not observed any quasi-periodic-oscillations (QPOs) in the power density spectrum (PDS). The spectral study suggests that the source remained in the softer (more precisely in soft-intermediate) spectral state during this short period of the X-ray activity. We notice a faint but broad Fe K emission line at around 6.5 keV. We also estimate the probable mass of the black hole to be with 90% confidence.
keywords:
X-Rays:binaries – stars individual: (XTE J1908+094) – stars:black holes – accretion, accretion disks – shock waves – radiation:dynamics1 \issuenum1 \articlenumber0 \datereceived \dateaccepted \datepublished \hreflinkhttps://doi.org/ \TitleProperties of Faint X-ray Activity of XTE J1908+094 in 2019 \AuthorDebjit Chatterjee 1,2*\orcidA, Arghajit Jana 3\orcidB, Kaushik Chatterjee 2\orcidC, Riya Bhowmick 2\orcidD, Sujoy Kumar Nath 2\orcidE, Sandip K. Chakrabarti 2\orcidF, A. Mangalam 1\orcidG and Dipak Debnath 2\orcidH \corresdebjit.chatterjee@iiap.res.in
1 Introduction
Black hole transients (BHTs) are fascinating objects to study. After a long period of quiescence, they show a sudden outburst. The sudden enhancement of viscosity at the piling radius could trigger the outburst (Chakrabarti, 1996; Chakrabarti et al., 2019; Mondal et al., 2017). The spectral and temporal properties of the source change during the outburst and evolves through the hard state (HS), hard intermediate state (HIMS), soft intermediate state (SIMS), and soft state (SS) (Remilard & McClintock, 2006; McClintock & Remilard, 2009; Debnath et al., 2013). Evolution of the state can be seen through hardness intensity diagram (HID) or "q" diagram (Belloni et al., 2005; Belloni, 2010) and accretion rate ratio intensity diagram (ARRID; Jana, Debnath & Chakrabarti, 2016; Chatterjee et al., 2020). A "failed" outburst is also a commonly known event where the source does not enter the softer spectral states (Tetarenko et al., 2016; García et al., 2019; Chatterjee et al., 2019). In case of "failed" outbursts, sources do not follow the standard state transition or "q" diagram. The spectral shape varies in different spectral states mainly due to the relative contribution of thermal component (Shakura & Sunyaev, 1973; Novikov & Thorne, 1973) and non-thermal component (Sunyaev & Titarchuk, 1980, 1985).
In Two-Component Advective Flow (TCAF) solution (Chakrabarti & Titarchuk, 1995; Chakrabarti, 1997), the accretion flow consists of two components: high viscous Keplerian flow with high angular momentum and low viscous sub-Keplerian flow with low angular momentum. The sub-Keplerian flow moves towards the black hole almost radially, and it almost stops at the centrifugal barrier and forms an axisymmetric shock (Chakrabarti, 1990). The matter gets puffed up beyond the shock and creates a hot electron cloud or Compton corona. This corona is called the CENtrifugal pressure supported BOundary Layer or CENBOL. This region intercepts the soft photons coming from the Keplerian disk and emits high-energy photons through inverse-Comptonization. In this way, TCAF can self-consistently explain the accretion dynamics around an accreting black hole. The oscillation of the same shock can explain the observed low-frequency quasi-periodic-oscillations (LFQPOs) (Molteni et al., 1996; Nandi et al., 2012). The CENBOL is also considered to be the base of jets and outflows (Chakrabarti, 1999). To get an estimation of the physical flow parameters directly from the spectral fit, TCAF model was implemented as an additive table model in XSPEC (Debnath, Chakrabarti & Mondal, 2014; Debnath, Mondal & Chakrabarti, 2015). From spectral fit with the model, we obtain two accretion rate parameters, namely, the Keplerian disk rate () in Eddington rate (), the sub-Keplerian halo rate () in Eddington rate (); two shock or Compton cloud parameters- shock location () in Schwarzschild radius (), compression ratio (), which is the ratio between post-shock and pre-shock matter densities (). One also gets the best-fitted value of the mass of the black hole ( in ) and a normalization parameter from each spectral fit. If the mass of the black hole is well known, it could be kept constant during the spectral fitting.
The Galactic black hole (GBH) candidate XTE J1908+094 was discovered on 2002 February 21 by the Proportional Counter Array (PCA) on-board Rossi X-ray Timing Explorer (RXTE) (Woods et al., 2002). The source spectrum was fitted with an absorbed power-law with photon index () of . The power density spectrum did not show any pulsations and exhibited a flat spectrum between 1 mHz and 0.1 Hz. A broad quasi-periodic-oscillation peak at 1 Hz was observed with a power-law break which continued to 4 Hz. A high energy cutoff at 100 keV was also observed using BeppoSAX (Feroci et al., 2002). The source was suggested to be a black hole (BH) candidate from its spectral and timing properties (Woods et al., 2002; Feroci et al., 2002; in’t Zand et al., 2002). High interstellar absorption (column density, ) was reported while fitting the spectrum with a multi-color blackbody, a Comptonization and a broad emission line (in’t Zand et al., 2002). The dimensionless spin parameter was also measured to be 0.75 from the broadening of Fe K line (Miller et al., 2009).
A radio counterpart was discovered at R.A.=, DEC.=+ by Very Large Array (VLA) (Rupen et al., 2002) which was also consistent with the Chandra observation (Jonker04, ). Two possible near-infrared (NIR) counterparts were detected (Chaty et al., 2002, 2006) - one of them is indicated as an intermediate/late-type (A-K) main-sequence companion, while the other is suggested to be a late-type (later than K) main-sequence secondary star (Chaty et al., 2006). After two similar outbursts in 2002 and early 2003, XTE J1908+094 went through another outburst on 2013 October 26 (Krimm et al., 2013; Miller-Jones et al., 2013; Rushton et al., 2013; Negoro et al., 2013; Coriat et al., 2013). The 2013 outburst was well studied in X-rays by Swift, NuSTAR (Tao et al., 2015; Zhang et al., 2015). Although a relativistic broadening of Fe-K line was observed, the spin of the BH could not be constrained due to data quality. A disk reflection contribution was also observed. The source was in the high/soft state during the NuSTAR observation. A flare was observed during the studied period. The flare was suggested to be related to the relativistic jet activity. Changes in the corona could be the reason for the flare. Multi-frequency radio and X-ray observation, and radio polarimetry with VLA and AMI-LA during the entire 2013 outburst was done (Curran et al., 2015). The source followed the standard hardness-intensity diagram during the outburst. The common behavior of radio jets was also observed that changes from compact to discrete as the state transits from hard to soft. From the VLBI monitoring of XTE J1908+094, a lateral expansion of resolved, asymmetric jet knots was noticed, which was ejected following the hard to soft state transition (Rushton et al., 2017). The knots are suggested to be the working surface where the ejected materials interacted with the surrounding dense interstellar medium. An external shock formed in this region causes the acceleration of particles which subsequently diffused outwards over time.
XTE J1908+094 recently showed a "faint" X-ray activity on 2019 April 1 (Rodriguez et al., 2019). The source spectrum was fitted with a power-law model with photon index, = 2.3. AMI-LA 15.5 GHz observation on 2019 April 5, detected the radio counterpart of XTE J1908+094 (Williams19, ). The obtained spectra on 2019 April 4 from the photon counting mode of Swift also yield a soft spectrum with high absorption (Miller et al., 2019). The source was suggested to be in the soft spectral state while using NICER data on 2019 April 6 and 9 (Ludlam et al., 2019).
In this paper. we have studied the timing and spectral properties of XTE J1908+094 during its X-ray activity on 2019 April 10 using NuSTAR observation of 40 ks. The paper is organized in the following way. In §2, we discuss the observations and the data analysis procedure. In §3, we present the temporal and spectral results of our analysis. In §4, we carry out the discussion based on our results.
2 Observation and data analysis
We processed the NuSTAR observation Id 90501317002111https://heasarc.gsfc.nasa.gov/cgi-bin/W3Browse/w3browse.pl (Date: 2019 April 10) using the nupipeline command of NuSTAR Data Analysis Software (NuSTARDAS) version 1.8.0 222https://heasarc.gsfc.nasa.gov/docs/nustar/analysis/ and with the Calibration database (CALDB) version 1.0.2333http://heasarc.gsfc.nasa.gov/FTP/caldb/data/nustar/fpm/. The spectra and light curves of the source were extracted from the FPMA detectors using a 60′′ circle centered at the position of XTE J1908+094. The background region was selected carefully since the source could have contamination from the nearby bright source GRS 1915+105. The background was chosen as a 60′′ radius circle as far away from the XTE J1908+094. The background count rate is less than 2% of the source count rate, indicating that the source is still dominant. We also divided the total 40 ks data in three segments of 16 ks, 10 ks, and 12 ks for detailed study. We used XSELECT command filter time for this. The spectra and light curves were then generated using nuproducts. The spectra were re-binned to have 20 counts/sec using grppha. The light curves were binned with 100 sec time resolution.
For spectral analysis, we used both phenomenological (combined diskbb, powerlaw models) and physical (TCAF based fits file as an additive table model) model in XSPEC version 12.10.1. The hydrogen column density () was fixed at 2.51022 cm-2 (in’t Zand et al., 2002). The multiplicative model, Tbabs was used as an absorption table model considering the vern scattering cross-sections (Verner et al., 1996) and wilm abundances (Wilms et al., 2000).
3 Results
We studied the 2019 X-ray activity of BHC XTE J1908+094 using NuSTAR observation. The source is close to a bright BHC GRS 1915+105. To verify the presence of any contamination due to GRS 1915+105, we studied the source and background count rate variation of XTE J1908+094 (Fig. 1). The background count rate was found to be less than 2% of the source count rate. So, we conclude that the X-ray activity of XTE J1908+094 during 2019 April to be "faint" and, yet, the variation observed was inherent rather than due to the nearby sources.
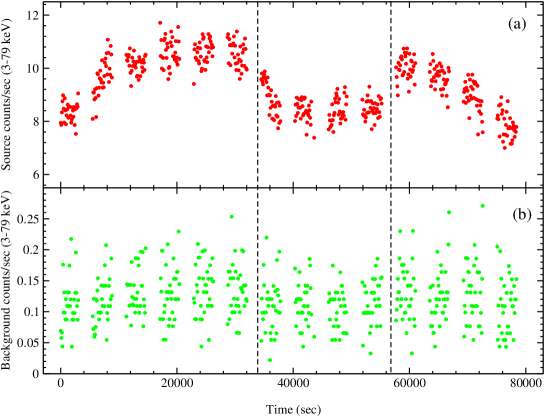
3.1 Variability study from the light curve
We generated the light curve of 100 sec time binning of the total 40 ks data to study the variability (Fig. 1a). The light curve shows a small variability during this period. We also generated light curves of 14 individual orbits of sec time binning. The power density spectra (PDS) do not show any quasi-periodic-oscillations (QPOs). This observation contrasted with the 2002 observations of the object where a broad QPO was observed, and the spectrum was harder (Göǧüş et al., 2004).
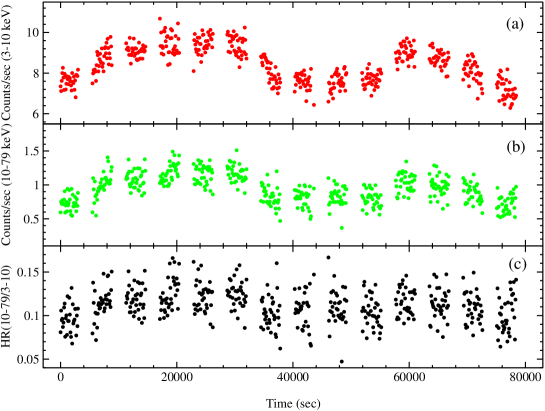
We generated light curves of the entire observation in the energy ranges of 3-10 keV and 10-79 keV. The variation of these light curves along with the hardness ratio (HR; between 10-79 keV and 3-10 keV) are shown in Fig 2. We noticed that the soft photon (3-10 keV) counts always dominate the hard photon (10-79 keV) counts. Both the soft and hard count rates showed coherent periodic variation during the observation. Thus the HR always remained at low values (0.05 to 0.15). The soft and the hard count rates and the value of the HR indicate that the source was in the softer spectral regime during our studied period.
3.2 Accretion properties from spectral analysis
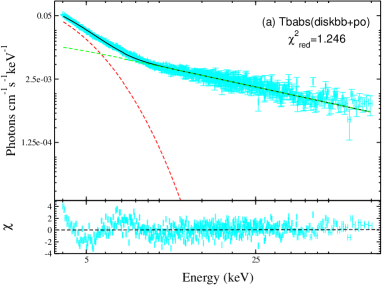
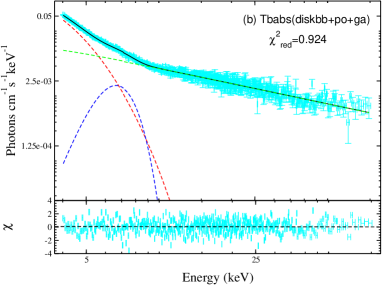
We studied the spectral properties with both phenomenological and physical models separately. We first fitted the spectrum of the full observation (40 ks) using combined diskbb and powerlaw models (Fig. 3a). The inner disk temperature () was obtained to be 0.779 keV. The high photon index () indicates a softer spectral state. The fitted spectrum retained a value of 744/597 1.246. We noticed a small residual at around 6.5 keV (see, Fig. 3a). To check the contribution of any Fe-K line in the spectrum, we fitted the spectrum with Tbabs(diskbb+powerlaw+Gaussian) model (Fig. 3b). The inner disk temperature () decreased very little (0.645 keV). The photon index also decreased to (). We obtained 6.48 keV as the line energy and 1 keV as the line width () from Gaussian model. The best fitted spectrum gave a value of 549/594 0.924. The fit improved with the inclusion of the Gaussian model for the Fe K emission line. We also fitted the spectrum with TCAF fits file along with Gaussian model (Fig. 3c). The disk rate was high () compared to the halo rate (). The shock location and compression value were obtained as and respectively. These accretion rates and shock parameters indicating a softer state also justify the results obtained from the combined diskbb+powerlaw+Gaussian model fitting. The best-fitted spectrum retained a value of 562/592 0.949. The best-fitted spectra using these three different combinations of models are shown in Fig. 3.
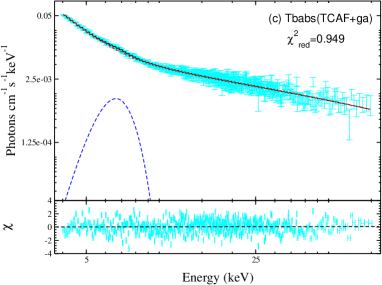
Spectral Analysis Results obtained from NuSTAR Observation Model1 Diskbb (keV) norm Powerlaw norm /dof 744/597 1.246 Model2 Diskbb (keV) norm Powerlaw norm Gaussian (keV) (keV) norm /dof 549/594 0.924 Model3 TCAF () () () () Gaussian (keV) (keV) norm /dof 562/592 0.949
Since a variation can be easily noticed in the light curve of the full observation (Fig. 1a), we divided the light curve into three segments of 16 ks, 10 ks and 12 ks and analyzed for detailed study. We fitted these three spectra using two combinations Tbabs(diskbb+powerlaw+Gaussian) and Tbabs(TCAF+Gaussian). The spectral parameters are listed in Table 3.2. Only TCAF plus Gaussian model fitted spectra are shown in Fig. 4.
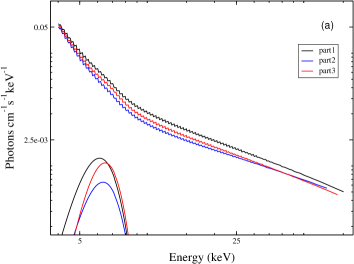
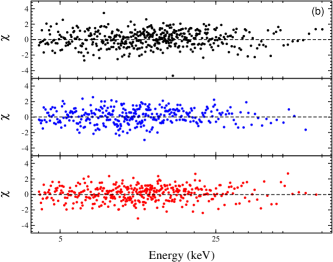
TCAF model fitted spectral parameters for three segments of the NuSTAR observation Obs. part1 part2 part3 MJD 58583.471 58583.709 58583.975 Diskbb (keV) norm Powerlaw norm Gaussian (keV) (keV) norm /dof 483/439 1.100 316/332 0.952 352/368 0.956 TCAF () () () () Gaussian (keV) (keV) norm /dof 483/437 1.105 321/330 0.973 350/366 0.956
3.3 Estimation of Inner disk radius and Prediction of Mass
We estimated the mass for XTE J1908-094 from the spectral analysis. From the obtained values of model 1 and model 2 in Table 3.2, we suggested model 2 is the best fitted phenomenological model. We considered the fitted disk-normalization () to estimate the mass of the BHC XTE J1908+094. We average out the values obtained from fittings of the three segments of the whole observation (Table 3.2). The inner radius () of the disk and the diskbb normalization () are related as,
| (1) |
is the distance of the system in and is in . is the inclination of the disk in degree. This estimated inner radius from the above equation is subjected to some errors (see, Shimura & Takahara (1995); Kubota et al. (1998)). The corrected inner radius ( ()) is,
| (2) |
and are the hardening factor (Shimura & Takahara, 1995) and inner boundary correction factor (Kubota et al., 1998) respectively. Since, the inclination angle of the system is not confirmed, we considered three guess values for the inclination as: , , and . The average value of was 516. We consider the and are 1.7 and 0.41 respectively (Shimura & Takahara (1995); Kubota et al. (1998)) and assume the distance of the system as 10 . We obtained the inner radius () for to be , , and , for the inclination angle , , and , respectively. The inner edge of the disk () is considered to be truncated at the inner most stable circular orbit (ISCO). For a Schwarzschild black hole it is , where , and are the Gravitational constant, mass of the black hole and speed of light at vacuum. We obtained the mass for this black hole from the obtained values to be 3.2, 3.7, and 7.2 respectively.
In TCAF, the mass of the BH is an important input parameter. If it is not well known from dynamical or other methods, one can get the best-fitted value of the from each spectral fit. Here, we obtained the mass of XTE J1908+094 as 6.5 from the combined TCAF, and Gaussian model fit when the entire duration of the observation was considered. (Table 3.2).
4 Conclusions
We studied the spectral and temporal properties of BHC XTE J1908+094 during its renewed X-ray activity using one NuSTAR observation in 2019, April 10. The X-ray activity was very faint and mostly dominated by soft photons. No quasi-periodic oscillations (QPOs) were observed in its power density spectra (PDS). The light curves generated in the soft (3-10 keV) and hard (10-79 keV) energy range showed coherent periodic variation. The low value of hardness ratio suggests that the source was in a softer spectral state during the observation.
We analyzed the spectrum using both phenomenological and physical models separately. The high power-law photon index () indicates that the source was either in soft intermediate or in soft state. The disk normalization was also relatively high compared to the power-law normalization. Due to the small residual around 6.5 keV, we refitted the spectrum, adding a Gaussian for the contribution of Fe K line emission. A broad Gaussian was obtained with line energy and line width () . The photon index () decreased to , suggesting that the source probably was in the soft intermediate state. The presence of broad width () Gaussian line also signifies the spectral state as soft intermediate. While fitting the three segments of the whole observation divided due to the periodic variability, we noticed that the second segment (see, Table 3.2) showed a little harder spectrum than the other two segments (part1 and part3).
We refitted the spectrum using TCAF plus Gaussian model. We noticed an unusually high disk rate () over the halo rate (). This high amount of hard photon contribution is also noticed in the variation of light curves (see, Fig. 2). The obtained shock location () and compression ratio () also refer to soft intermediate spectral state. The spectral parameters obtained from the whole observation’s partial fitting also suggest that during the mid-segment, when both soft and hard count decreased, the spectrum became harder but remained in the same spectral state. This faint X-ray activity of XTE J1908+094 in 2019 could be due to the sudden enhancement of viscosity and supply of matter from the pile-up radius. This type of behavior has been observed in the case of H1743-322 (Chakrabarti et al., 2019) and GX 339-4 (Bhowmick et al., 2020). As the supply of residual matter from the previous outburst (2012-2013) was exhausted, the very short-term X-ray activity was also faded.
We also estimated the possible value of the mass of the black hole () from the spectral analysis. During our studied period, the spectra are dominated by the soft photons coming from the disk. The inner radius can be constrained in the soft spectral state from the diskbb normalization (). Since the other two unknown variables (distance and inclination) are not confirmed for this source, we consider the distance to be 10 kpc and inclination as 30∘, 50∘ and 80∘. The corrected inner radius () was obtained as 29 km, 34 km, and 65 km. As the source is found in the soft-intermediate state, the inner radius must be located very close to the ISCO (Done et al., 2007). Considering a Schwarzschild black hole the ISCO is at or . We obtained the black hole mass to be 3.2, 3.7 and 7.2 for those three . This result would only be valid for a Schwarzschild black hole. For a Kerr black hole, the inner radius would be located at less than , affecting the prediction of mass from the disk normalization. We could suggest that the system is located at and is highly inclined (). From the TCAF model fitted spectral fit, we also obtained the mass of the black hole to be 6.5 .
5 Summary
We studied the faint outburst of XTE J1908+094 in 2019 using archival NuSTAR data. From the timing and spectral study, we conclude that:
i) No quasi-periodic oscillation (QPO) was found in the PDS.
ii) The source was in SIMS during our studied period.
iii) We also estimated the most probable mass of the black hole to be 6.5 .
The data used here are publicly available. This research has made use of the NuSTAR Data Analysis Software (NuSTARDAS) jointly developed by the ASI Science Data Center (ASDC, Italy) and the California Institute of Technology (USA).
Acknowledgements.
D.C. acknowledges the support of the PDR fellowship, IIA, Bengaluru, Karnataka, India.. A.J. acknowledges the support of the Post-Doctoral Fellowship from Physical Research Laboratory, Ahmedabad, India, funded by the Department of Space, Government of India. K.C. acknowledges support from DST/INSPIRE (IF170233) fellowship. R.B. acknowledges support from CSIR-UGC NET qualified UGC fellowship (June-2018, 527223). S.N., D.D. and S.K.C. acknowledge support ISRO sponsored RESPOND project (ISRO/RES/2/418/17-18) fund. D.D. and S.K.C. also acknowledge support from Govt. of West Bengal, India and DST/GITA sponsored India-Taiwan collaborative project (GITA/DST/TWN/P-76/2017) fund. \reftitleReferencesReferences
- Chakrabarti (1996) Chakrabarti, S.K. Grand Unification of Solutions of Accretion and Winds around Black Holes and Neutron Stars. ApJ 1996 464, 664-683
- Chakrabarti et al. (2019) Chakrabarti, S. K.; Debnath, D.; Nagarkoti, S. Delayed outburst of H 1743-322 in 2003 and relation with its other outbursts. Advances in Space Research 2019, 63, 3749-3759
- Mondal et al. (2017) Mondal, S.; Chakrabarti, S. K.; Nagarkoti, S.; Arévalo, P. Possible Range of Viscosity Parameters to Trigger Black Hole Candidates to Exhibit Different States of Outbursts. ApJ 2017, 850, 47-55
- Debnath et al. (2013) Debnath, D.; Chakrabarti, S. K.; & Nandi, A. Evolution of the temporal and the spectral properties in 2010 and 2011 outbursts of H 1743-322. AdSpR, 2013, 52, 2143-2155
- McClintock & Remilard (2009) McClintock, J. E.; Remillard, R. A. In Compact Stellar X-ray Sources (Cambridge University Press), 2009, 157–214
- Remilard & McClintock (2006) Remillard, R. A.; McClintock, J. E. X-Ray Properties of Black-Hole Binaries. ARAA 2006, 44, 49-92
- Belloni et al. (2005) Belloni, T.; Homan, J.; Casella, P.; van der Klis, M.; Nespoli, E.; Lewin, W. H. G.; Miller, J.; Mèndez, M. The evolution of the timing properties of the black-hole transientGX 339–4 during its 2002/2003 outburst. AA 2005, 440, 207-222
- Belloni (2010) Belloni, T. M. States and Transitions in Black Hole Binaries. In The Jet Paradigm: From Microquasars to Quasars; Belloni, T. M., Eds.; Vol. 794, (Berlin: Springer), 2010, pp 53-84
- Jana, Debnath & Chakrabarti (2016) Jana, A.; Debnath, D.; Chakrabarti, S. K.; et al. Accretion Flow Dynamics of MAXI J1836-194 During Its 2011 Outburst from TCAF Solution. ApJ 2016, 819, 107-117
- Chatterjee et al. (2020) Chatterjee, K.; Debnath, D.; Chatterjee, D.; Jana, A.; Chakrabarti, S. K. Inference on accretion flow properties of XTE J1752-223 during its 2009-10 outburst. MNRAS 2020 493, 2452–2462
- Chatterjee et al. (2019) Chatterjee, D.; Debnath, D.; Jana, A.; Chakrabarti, S. K. Properties of the black hole candidate XTE J1118+480 with the TCAF solution during its jet activity induced 2000 outburst. ApSS 2019, 364, 14
- García et al. (2019) García, J.A.; Tomsick, J.A.; Sridhar, N.; et al. The 2017 Failed Outburst of GX 339-4: Relativistic X-Ray Reflection near the Black Hole Revealed by NuSTAR and Swift Spectroscopy. ApJ 2019, 885, 48-59
- Tetarenko et al. (2016) Tetarenko, B.E.; Sivakoff, G.R.; Heinke, C.O.; Gladstone, J. C. WATCHDOG: A Comprehensive All-sky Database of Galactic Black Hole X-ray Binaries. ApJS 2016 222, 15-112
- Novikov & Thorne (1973) Novikov, I. D.; Thorne, K. S. Black Holes, (Eds.), C. DeWitt & B. DeWitt, (Gordon and Breach: New York) 1973,
- Shakura & Sunyaev (1973) Shakura, N. I.,; Sunyaev, R. A. Black holes in binary systems. Observational appearance. AA 1973, 24, 337-355
- Sunyaev & Titarchuk (1980) Sunyaev, R.A.; Titarchuk, L. G. Comptonization of X-rays in plasma clouds. Typical radiation spectra. AA 1980, 86, 121-138
- Sunyaev & Titarchuk (1985) Sunyaev, R.A.; Titarchuk, L. G. Comptonization of low-frequency radiation in accretion disks Angular distribution and polarization of hard radiation. AA 1985, 143, 374-388
- Chakrabarti & Titarchuk (1995) Chakrabarti, S. K.; Titarchuk, L.G. Spectral Properties of Accretion Disks around Galactic and Extragalactic Black Holes. ApJ 1995 455, 623-639
- Chakrabarti (1997) Chakrabarti, S.K. Spectral Properties of Accretion Disks around Black Holes. II. Sub-Keplerian Flows with and without Shocks. ApJ 1997 484, 313-322
- Chakrabarti (1990) Chakrabarti, S. K. Theory of Transonic Astrophysical Flows (Singapore: World Scientific) 1990
- Molteni et al. (1996) Molteni, D.; Sponholz, H.; Chakrabarti, S. K. Resonance Oscillation of Radiative Shock Waves in Accretion Disks around Compact Objects. ApJ 1996, 457, 805-812
- Nandi et al. (2012) Nandi, A.; Debnath, D.; Mandal, S.; Chakrabarti, S. K. Accretion flow dynamics during the evolution of timing and spectral properties of GX 339-4 during its 2010-11 outburst. AA 2012, 542, 56-66
- Chakrabarti (1999) Chakrabarti, S.K. Estimation and effects of the mass outflowfrom shock compressed flow around compact objects. AA 1999, 351, 185-191
- Debnath, Chakrabarti & Mondal (2014) Debnath, D.; Mondal, S.; Chakrabarti, S.K. Implementation of two-component advective flow solution in xspec. MNRAS, 2014, 440, L121-L125
- Debnath, Mondal & Chakrabarti (2015) Debnath, D.; Mondal, S.; Chakrabarti, S. K., Characterization of GX 339-4 outburst of 2010–11: analysis by XSPEC using two component advective flow model. MNRAS, 2015, 447, 1984-1995
- Woods et al. (2002) Woods, P. M., Kouveliotou, C., Finger, M. H.; Gogus, E.; Swank, J.; Markwardt, C.; Strohmayer, T. XTE J1908+094. IAUC 2002, 7856, 1
- Feroci et al. (2002) Feroci, M.; Reboa, L.; BEPPOSAX Team. XTE J1908+094. IAUC 2002, 7861, 2
- in’t Zand et al. (2002) in’t Zand, J.J.M.; Miller, J.M.; Oosterbroek, T.; Parmar, A.N. Broad-band X-ray measurements of the black hole candidateXTE J1908+094. AA 2002, 394, 553-560
- Miller et al. (2009) Miller, J.M.; Reynolds, C.S.; Fabian, A.C.; Miniutti, G.; Gallo, L.C. Stellar-mass black hole spin constraints from disk reflection and continuum modeling. ApJ 2009, 697, 900-912
- Rupen et al. (2002) Rupen, M.P.; Dhawan, V.; Mioduszewski, A.J. XTE J1908+094. IAUC 2002, 7874, 1
- (31) Jonker, P.G.; Gallo, E.; Dhawan, V.; Rupen, M.; Fender, R.P.; Dubus, G. Radio and X-ray observations during the outburst decay of the black holecandidate XTE J1908+094. MNRAS 2004, 351, 1359-1364
- Chaty et al. (2002) Chaty, S.; Mignani, R.P.; Israel, G.L. Discovery of the near-infrared counterpart of the X-ray transient XTE J1908+094. Mon. Not. R. Astron. Soc. 2002, 337, L23-L26
- Chaty et al. (2006) Chaty, S.; Mignani, R.P.; Israel, G.L. A closer look at the X-ray transient XTE J1908+094: identification of two new near-infrared candidate counterparts. Mon. Not. R. Astron. Soc. 2006, 365, 1387-1391
- Coriat et al. (2013) Coriat, M.; Tzioumis, T.; Corbel, S.; Fender, R. Optically thin synchrotron emission from XTE J1908+094 observed by the ATCA. ATel 2013, 5575, 1
- Krimm et al. (2013) Krimm, H.A.; Barthelmy, S.D.; Baumgartner, W.; Cummings, J.; Gehrels, N.; Lien, A.Y.; Markwardt, C.B.; Palmer, D.; Sakamoto, T.; Stamatikos, M.; Ukwatta, T. Swift/BAT detects a new outburst from the HXMB/BHC XTE J1908+094. ATel 2013, 5523, 1
- Miller-Jones et al. (2013) Miller-Jones, J. C.A.; Sivakoff, G.R.; Krimm, H.A. VLA detection of radio emission from the new outburst of XTE J1908+094. ATel 2013, 5530, 1
- Negoro et al. (2013) Negoro, H.; Suzuki, K.; Ueno, J.S.S.; Tomida, H.; Kimura, M.; Nakahira, S.; Ishikawa, M.; Nakagawa, Y. E.; Mihara, T.; Sugizaki, S.; Serino, M.; Morii, M.; Takagi, T.; Matsuoka, M.; Kawai, N.; Usui, R.; Ishikawa, K.; Yoshii, T.; Yoshida, A.; Sakamoto, T. Nakano, Y.; Tsunemi, H.; Sasaki, M.; Nakajima, M.; Sakakibara, H.; Fukushima, K.; Onodera, T.; Ueda, Y.; Shidatsu, M.; Kawamuro, T.; Hori, T.; Tsuboi, Y.; Higa, M.; Yamauchi, M.; Yoshidome, K.; Ogawa, Y.; Yamada, H.; Yamaoka, K. MAXI/GSC detection of a hard-to-soft state transition of XTE J1908+094. ATel 2013, 5549, 1
- Rushton et al. (2013) Rushton, A.P.; Fender, R.; Anderson, G.; Staley, T.; Rumsey, C.; Titterington, D. AMI detection of 2 cm radio emission from the XRB BHC J1908+094. ATel 2013, 5532, 1
- Tao et al. (2015) Tao L.; Tomsick, J.A.; Walton, D.J.; Fürst, F.; Kennea, J.; Miller, J.M.; Boggs, S.E.; Christensen, F.E.; Craig, W.W.; Gandhi, P.; Grefenstette, B.W.; Hailey, C.J.; Harrison, F.A.; Krimm, H.A.; Pottschmidt, K.; Stern, D.; Tendulkar, S.P.; Zhang, W.W. NuSTAR and Swift Observations of the Black Hole Candidate XTE J1908+094 during its 2013 Outburst. ApJ 2015, 811, 51-59
- Zhang et al. (2015) Zhang, L.; Chen, L.; Qu, J.-l.; Bu, Q.-c.; Zhang, W. The 2013-2014 Outburst of XTE J1908+094 Observed with Swift and NuSTAR: Spectral Evolution and Black Hole Spin Constraint. ApJ 2015, 813, 90-102
- Curran et al. (2015) Curran, P. A. et al. Radio polarimetry as a probe of unresolved jets: the 2013 outburstof XTE J1908+094. MNRAS 2015, 451, 3975-3985
- Rushton et al. (2017) Rushton, A. P., Miller-Jones, J. C. A.; Curran, P. A.; Sivakoff, G. R.; Rupen, M. P.; Paragi, Z.; Spencer, R. E.; Yang, J.; Altamirano, D.; Belloni, T.; Fender, R. P.; Krimm, H. A.; Maitra, D.; Migliari, S.; Russell, D. M.; Russell, T. D.; Soria, R.; Tudose, V. Resolved, expanding jets in the Galactic black hole candidate XTE J1908+094. MNRAS 2017, 468, 2788–2802
- Rodriguez et al. (2019) Rodriguez, J., Mereminskiy, I., Grebenev, S. A.; Cangemi, F.; Clavel, M.; Coleiro, A.; Egron, E.; Grinberg, Victoria; Pottschmidt, K.; Remillard, R.; Steiner, J.; Tomsick, J.; Wilms, J. INTEGRAL detects renewed activity from the microquasar XTE J1908+094. ATel 2019, 12628
- (44) Williams, D., Motta, S., Fender, R.; Titterington, D.; Green, D.; Perrott, Y. AMI-LA 15.5 GHz observation of the Black Hole candidate XTE J1908+094. ATel 2019, 12620
- Miller et al. (2019) Miller, J. M.; Reynolds, M.; Tetarenko, B., Ali, S.; Balakrishnan, M.; Chen, J.; Vozza, D. A Neil Gehrels Swift Observatory Snapshot of the Black Hole Candidate XTE J1908+094. ATel 2019, 12632, 1
- Ludlam et al. (2019) Ludlam, R. M.; Remillard, R.; Homan, J., Strohmayer, T. E.; Gendreau, K.; Arzoumanian, Z. NICER Observations of the new outburst from XTE J1908+094. ATel 2019, 12652, 1
- Verner et al. (1996) Verner, D.A.; Ferland, G.J.; Korista, K.T.; Yakovlev, D.G. Atomic Data for Astrophysics. II. New Analytic FITS for Photoionization Cross Sections of Atoms and Ions. ApJ 1996, 465, 487-498
- Wilms et al. (2000) Wilms, J.; Allen, A.; McCray, R. On the Absorption of X-Rays in the Interstellar Medium. ApJ 2000, 542, 914-924
- Göǧüş et al. (2004) Göǧüş, E.; Finger, M. H.; Kouveliotou, C.; et al. Long-term spectral and timing behavior of the black hole candidate XTE J1908+094. ApJ 2004, 609, 977-987
- Kubota et al. (1998) Kubota, A., Tanaka, Y., Makishima, K., Ueda, Yoshihiro; Dotani, Tadayasu; Inoue, Hajime; Yamaoka, Kazutaka. Evidence for a Black Hole in the X-Ray Transient GRS 1009-45. PASJ 1998, 50, 667-673
- Shimura & Takahara (1995) Shimura, T.; Takahara, F. On the Spectral Hardening Factor of the X-Ray Emission from Accretion Disks in Black Hole Candidates. ApJ 1995, 445, 780-788
- Bhowmick et al. (2020) Bhowmick, R.; Debnath, D.; Chatterjee, K.; et al. Relation Between Quiescence and Outbursting Properties of GX 339-4. ApJ 2021, 910, 138
- Done et al. (2007) Done, C.; Gierlinski, M.; Kubota, A. Modelling the behaviour of accretion flows in X-ray binaries: Everything you always wanted to know about accretion but were afraid to ask. AAR 2007, 15, 1-66