Sectors, Beams and Environmental Impact on the Performance of Commercial 5G mmWave Cells: an Empirical Study
Abstract
millimeter wave (mmWave) communication is one of the cornerstones of future generations of mobile networks. While the performance of mmWave links has been thoroughly investigated by simulations or testbeds, the behavior of this technology in real-world commercial setups has not yet been thoroughly documented. In this paper, we address this gap and present the results of an empirical study to determine the actual performance of a commercial 5G mmWave cell through on-field measurements. We evaluate the signal and beam coverage map of an operational network as well as the end-to-end communication performance of a 5G mmWave connection, considering various scenarios, including human body blockage effects, foliage-caused and rain-induced attenuation, and water surface effects. To the best of our knowledge, this paper is the first to report on a commercial deployment while not treating the radio as a black box. Measurement results are compared with 3GPP’s statistical channel models for mmWave to check the possible gaps between simulated and actual performance. This measurement analysis provides valuable information for researchers and 5G verticals to fully understand how a 5G mmWave commercial access network operates in real-world, under various operational conditions, with buildings, humans, trees, water surfaces, etc.
Index Terms:
5G, Commercial 5G networks, Coverage analysis, Millimeter-wave, mmWaveI Introduction
The abundant free spectrum available at millimeter wave (mmWave) frequencies, spanning from 30 GHz to 300 GHz, makes mmWave communication a key enabler for 5th Generation (5G) systems to support bandwidth-hungry applications like online High Definition video streaming, augmented and virtual reality, and road-side vehicular communications.
However, transmission over mmWave bands has its unique characteristics and adds new challenges, which are very different from those of sub-6 GHz communications. In the last decade, a massive body of research has been carried out to understand and model mmWaves’ propagation properties, mainly focusing on path-loss models, ray propagation mechanisms, material penetration, and atmospheric effects.
The first commercial 5G mmWave systems have already been deployed in the last two years, and some early measurements [1, 2, 3] investigated the performance of these systems under various urban scenarios, revealing a high variability in the systems’ performance, partially attributed to the high sensitivity to the propagation environment. These studies are important because the commercial instalment may require to implement some changes, adaptations, and parameters’ setting that were not be required nor tested in Proof of Concept (PoC) or pre-deployment phases and that may potentially affect the system behavior in certain situations. Evidence of such a risk was reported, for example, in [4] where the authors observed how an unexpected setting of some base station parameters had a dramatic impact of the energy consumption of narrowband-IoT nodes, significantly deviating from what predicted by models based on the protocol specifications. So, further research is required to fully understand the behavior of mmWaves in an operational setup. To this end, we have conducted a measurement campaign to analyze the impact of different environmental phenomena like rain, water surfaces, foliage, and human body blockage on the performance of an operational 5G mmWave cell. We have also studied the signal coverage in different propagation environments for different sectors and beams. The purpose of this study is hence to understand to what extent the expected performance of mmWaves is fulfilled in commercial settings, with all the complexity of an actual cellular system and of a real-world environment. In many cases, our results confirm the system behavior already observed in previous studies based on non-commercial PoC deployments or predicted by theoretical models and simulations. However, in a few cases, we observed some nonconforming results that may be proxy of some problems in the deployment of the commercial solution.
The analysis of the measurement results provides guidelines for planning future deployments and predicting the performance of 5G in different use cases, such as in case of fish farms/aquaculture [5], or when the User Equipments (UEs) are located inside forests or vegetated areas [6], or when the Line-of-Sight (LoS) signal is blocked by buildings, moving objects or humans, as in dense urban environments [7]. Therefore, our observations are especially helpful to industries interested in deploying 5G over mmWave frequencies, but are not familiar with its intricacies.
In summary, our main contributions are as follows:
-
•
We present the coverage analysis of a commercial 5G mmWave cell by measuring the Reference Signal Received Power (RSRP) in a complex real-world propagation environment (Sec. IV-A).
-
•
We then analyze the beam separation and gauge the difference with respect to the sector-level transmission (Sec. IV-B).
-
•
We study different environmental impacts from the body and foliage blockage to rain and over-water transmission on mmWave links on the commercial setup (Sec. IV-C).
-
•
We analyze the performance of Non-Line-of-Sight (nLoS) mmWave links in two different sectors, representing urban and suburban areas, observing that in an urban environment with multiple buildings and reflecting elements, the nLoS components of mmWave signals can compensate for the lack of LoS links, while this is not the case in the suburban environment (Sec. IV-C).
-
•
We analyze the effect of the above-mentioned scenarios on the performance of end-to-end transmissions (Sec. IV-C).
-
•
We compare the measurement results with 3rd Generation Partnership Project (3GPP)’s statistical channel models for the urban and rural environment both for omnidirectional RSRP and transceiver’s optimal antenna configuration, revealing the gap between the ideal simulated environment and the complex propagation environment (Sec. V).
-
•
Finally, we discuss how the above would affect real-world applications (Sec. VI).
The remainder of this paper is structured as follows: Sec. II reviews the existing literature around mmWave propagation and early 5G mmWave deployments. Sec. III describes the methodology used to conduct the measurement campaign. The observations and result analysis is provided in Sec. IV, and Sec. V compares the measurement results with some simple simulated scenarios. Finally, Sec. VI concludes this article summarizing key findings and take-home messages.
II Related work
| Ref. | Year | Scenario | Methodology | Contribution |
|---|---|---|---|---|
| [1] | 2020 | 5G urban | Measurement (commercial) | Performance of end-to-end transmission in different scenarios |
| [2] | 2021 | 5G urban | Measurement (commercial) | Performance, power consumption, and application QoS |
| [3] | 2020 | 5G urban | Measurement (commercial) | Factors affect 5G performance in UE-side |
| [8] | 2020 | LoS indoor corridor | Measurement (testbed) | Path loss model |
| [9] | 2018 | LoS indoor office | Measurement (testbed) | Path loss/ Large scale fading |
| [10] | 2019 | LoS/nLoS indoor lecture hall | Measurement (testbed) | mmWaves channel characteristics |
| [11] | 2017 | Urban | Simulation/Measurement | Channel modeling |
| [12] | 2017 | Urban/Indoor | Measurement (testbed) | Spatio-temporal features of channel |
| [13] | 2018 | Urban | Measurement (testbed) | Feasibility of mobility |
| [14] | 2020 | Foliage/Suburb | Measurement (testbed) | Propagation characterization |
| [15] | 2017 | Foliage/Suburb | Measurement (testbed) | Propagation characterization |
| [16] | 2017 | Foliage/Suburb | Measurement (testbed) | Foliage propagation model |
| [17] | 2019 | Body blockage | Measurement (testbed) | Human blockage model |
| [18] | 2019 | Body blockage | Simulation | Hand grip impact |
| [19] | 2019 | Rain | Measurement (testbed) | Rain attenuation |
| [20] | 2020 | Rain | Measurement (testbed) | Rain attenuation |
| [21, 22] | 2020 | End-to-end urban | Simulation | Performance of TCP in mmWave |
| [23, 24] | 2017 | End-to-end urban | Simulation | Performance of TCP in mmWave |
| [25] | 2019 | High speed/Urban/Indoor | Simulation | Performance of TCP in mmWave |
In the past few years, several studies have experimentally investigated the behavior of mmWave propagation in different scenarios and conditions: indoors [8, 9, 10]; urban environment [11, 12, 13]; suburban and vegetated area [14, 15, 16]; human body blockage [17, 18] and rain-induced fading [20, 19]. Further, [26, 22, 21, 23, 24, 25] study end-to-end transmissions over mmWaves. Tab. I presents a summary of the related work.
The studies mainly aim to characterize the propagation of mmWave signals in different environments and under various circumstances. For example, the measurement study in [11] considered the outdoor 32 GHz microcells to extract and develop a mmWave channel model. The empirical result is then compared and validated through simulation. Ko et al. [12] investigated the wideband directional channel characteristic of mmWaves in both indoor and urban environments to model the spatio-temporal features of the communication channel. In [13], the authors investigate, through a measurement study, the feasibility of mobility for a typical vehicular speed in the urban environment.
The propagation of mmWaves in suburban and vegetated environments, surrounded by lots of foliage, is highly different from the urban and indoor scenarios. This matter has already been considered in the literature, where a vast body of research studies the effects of foliage attenuation on mmWave propagation. A measurement study in [14] analyzes and extracts large-scale and small-scale propagation properties of 5G mmWaves in various vegetated environments with different types and density of vegetation. A real-time channel sounder is used in [15] to measure mmWave LoS and nLoS channel responses in a suburban area with lined trees. The authors then use the measurement results to generate a foliage propagation model based on the ITU-R terrestrial model.
The propagation of mmWaves can be highly affected by different phenomena like rain and human body blockage. 3GPP has recognized human body as one of the main obstacles affecting mmWave propagation and causing large radio channel variations. Human body blockage has been considered and modeled in the literature, based on Double Knife Edge Diffraction (DKED), wedge, and cylinder models. In [17], human body blockage is measured at 15 GHz, 28 GHz, and 60 GHz for 15 humans with different heights and weights. They model the body blockage as a Double-truncated Multiple Knife-edge (DTMKE) scheme and compare the calculated diffraction with existing models such as the absorbing double knife-edge model and the 3GPP human blockage model.
The attenuation caused by precipitation can not be neglected at mmWave bands, where rain droplets can absorb mmWave signals whose wavelengths (1 mm to 10 mm) is comparable to the size of a raindrop (a few millimeters). Rain attenuation in the 21.8 GHz and 73.5 GHz bands, based on a one-year measurement campaign in tropical regions, is presented in [20]. In [19], Huang et al. employ a custom-designed channel sounder for 25.84 GHz and 77.52 GHz frequencies to measure the rain-induced signal attenuation for short-range mmWave links.
From the user experience perspective, the efficiency of end-to-end transmission is critical when mmWave links are part of the network, as the unsteady physical channel makes it difficult to support higher-layer connections. In [22, 21], Poorzare et al., presented an analysis of reliable end-to-end communications in 5G networks by investigating the effects of mmWave on Transmission Control Protocol (TCP) performance and discussed the factors impacting the performance of 5G networks. They further evaluated the performance of TCP in urban environments under different conditions. Polese et al. evaluated the performance of TCP over mmWave links, relying on simulation [23, 24]. They studied the behavior of multipath-TCP on 28 GHz mmWave links with a secondary Long Term Evolution (LTE) or 73 GHz mmWave link. Zhang et al. [25], analyzed the performance of TCP in mmWave networks for high-speed UEs in dense urban environments, where the UEs are located at different geographical positions with LoS and nLoS links to the Base Station (BS) as well as indoor UEs. They studied the performance of edge and remote servers as well as different TCP variations.
Most of the previous works were conducted in test setups that were not equipped with commercial 5G mmWave BSs since commercial mmWave deployments did not arrive until late 2019. Notable exceptions are studies by Narayanan et al. [1, 2, 3]. The study [1] presents a first look at the performance of two mmWave and one mid-band commercial 5G deployments in US. Using end-to-end performance measurements, Narayanan et al. tracked the interplay between propagation in the urban environment, blockage, and precipitation on applications performance. They further expand their measurement campaign in [2] to include the power consumption and application Quality of Experience (QoE) of operational 5G networks by considering different deployment schemes, radio frequencies, protocol configurations, mobility patterns and upper-layer applications. They also investigate the possibility of predicting network throughput in commercial mmWave 5G networks [3]. That work identified the different factors that affect 5G performance and proposed a context-aware throughput prediction framework based on Machine Learning techniques.
Like the work of Narayanan et al., we present an evaluation of a commercial 5G cell deployment. However, to the best of our knowledge, this paper is the first to provide a fine-grained analysis of mmWave propagation of a commercially deployed BS. This offers concrete explanations for the main causes of performance degradation since we are not treating the radio as a black box. We have also investigated a range of scenarios that are known to impact mmWave propagation, including human body blockage, foliage, transmission over-water and rain. While some of these have been investigated before, this paper is the first to analyze all of them in a commercial 5G mmWave deployment with known parameters configuration. We also note that this paper is the first to look at the effect of transmission over-water. We further compare the measured RSRP against 3GPP’s statistical mmWave channel models for the urban and rural environments, considering both omnidirectional strongest RSRP (transceiver’s optimal antenna configuration), to study the simulation and actual performance (Sec. V).
III Measurements Methodology
This paper includes two measurement studies: the first study aims to analyze the coverage aspects of commercial 5G mmWave cells, while the second study targets the end-to-end communication performance of a 5G network when mmWave links are employed as part of the system.
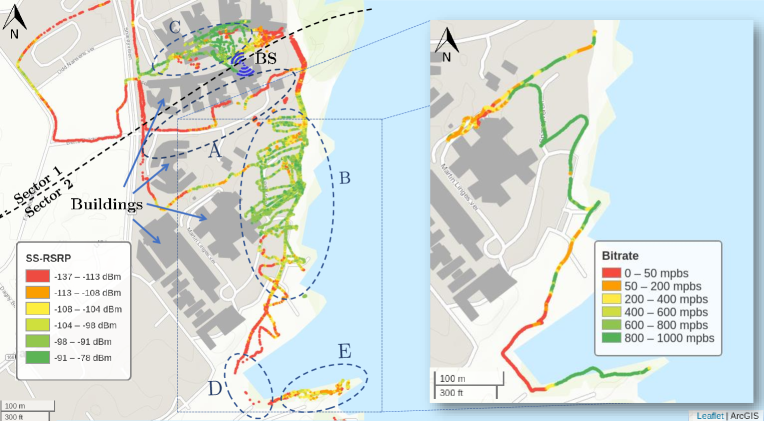
The 5G mmWave BS is located on the roof of a 15 meters high building in Telenor’s campus in Oslo, Norway. The BS is equipped with two Huawei HAAU5213 radio frequency units with 768 antenna arrays providing coverage to a northern and a southern sector as shown in Fig. 1. Its frequency range is 26.5 GHz to 29.5 GHz with a maximum transmit power equal to 32.5 dBm. It supports up to four carriers and can generate 16 different static beams, employing hybrid beamforming. The black dashed line in the Fig. 1 showcases the topological separation of the two sectors. The northern sector (sector 1) points towards an open square surrounded by glass and steel buildings. The southern sector (sector 2) is directed towards a peninsula with some buildings on the west and sea on the east. Each sector has four 200 MHz wide channels (800 MHz total), with center frequencies between 26.6 GHz and 27.2 GHz. We identify each channel by its respective Physical Cell Identity (PCI), where PCIs 101-104 belong to the northern sector and PCIs 301-304 to the southern. The operator can adjust the beams’ boresight both in the horizontal and vertical plane. We did not have any control of the beams and no prior knowledge about their directions. However, we were able to estimate the beams’ directions based on the measurements we collected to create the coverage map from LoS scenarios, if a single beam has the highest RSRP in all locations of a measured area is considered to have an orientation towards this area.
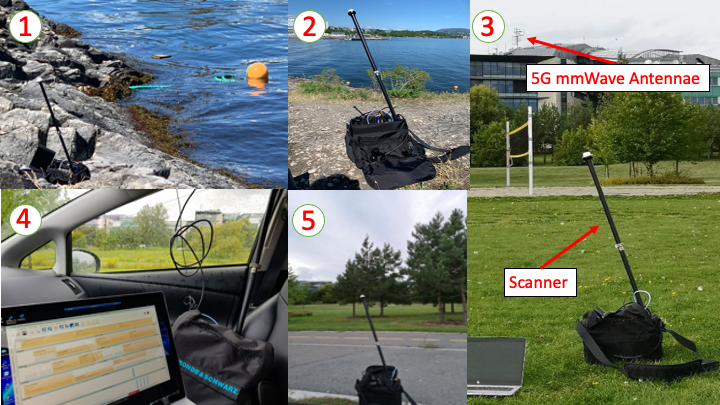
We collect channel quality information with a Rohde & Schwarz scanner[27] that can monitor all the relevant channels simultaneously using an omnidirectional antenna. Note that our measurements do not consider the antenna gain that is expected in a commercial receiver (e.g., as smartphone). On the other hand, the isotropic antenna makes the measurements almost independent of the receiver orientation. Since we are interested in how different factors affect propagation, the absence of the receiver gain does not influence our evaluation. The scanner was used to gather measurements across the site and under different conditions, collecting in total 535137 samples between April 2020 and September 2020. Each sample contains several channel quality indicators, such as RSRP, for all the detected PCIs and beams. We create a coverage map by walking around the site with the scanner, and perform stationary measurements at selected locations, each lasting typically at least 5 minutes, to capture the time variations of the signal strength. Fig. 2 shows the scanner and some of the measurement scenarios.
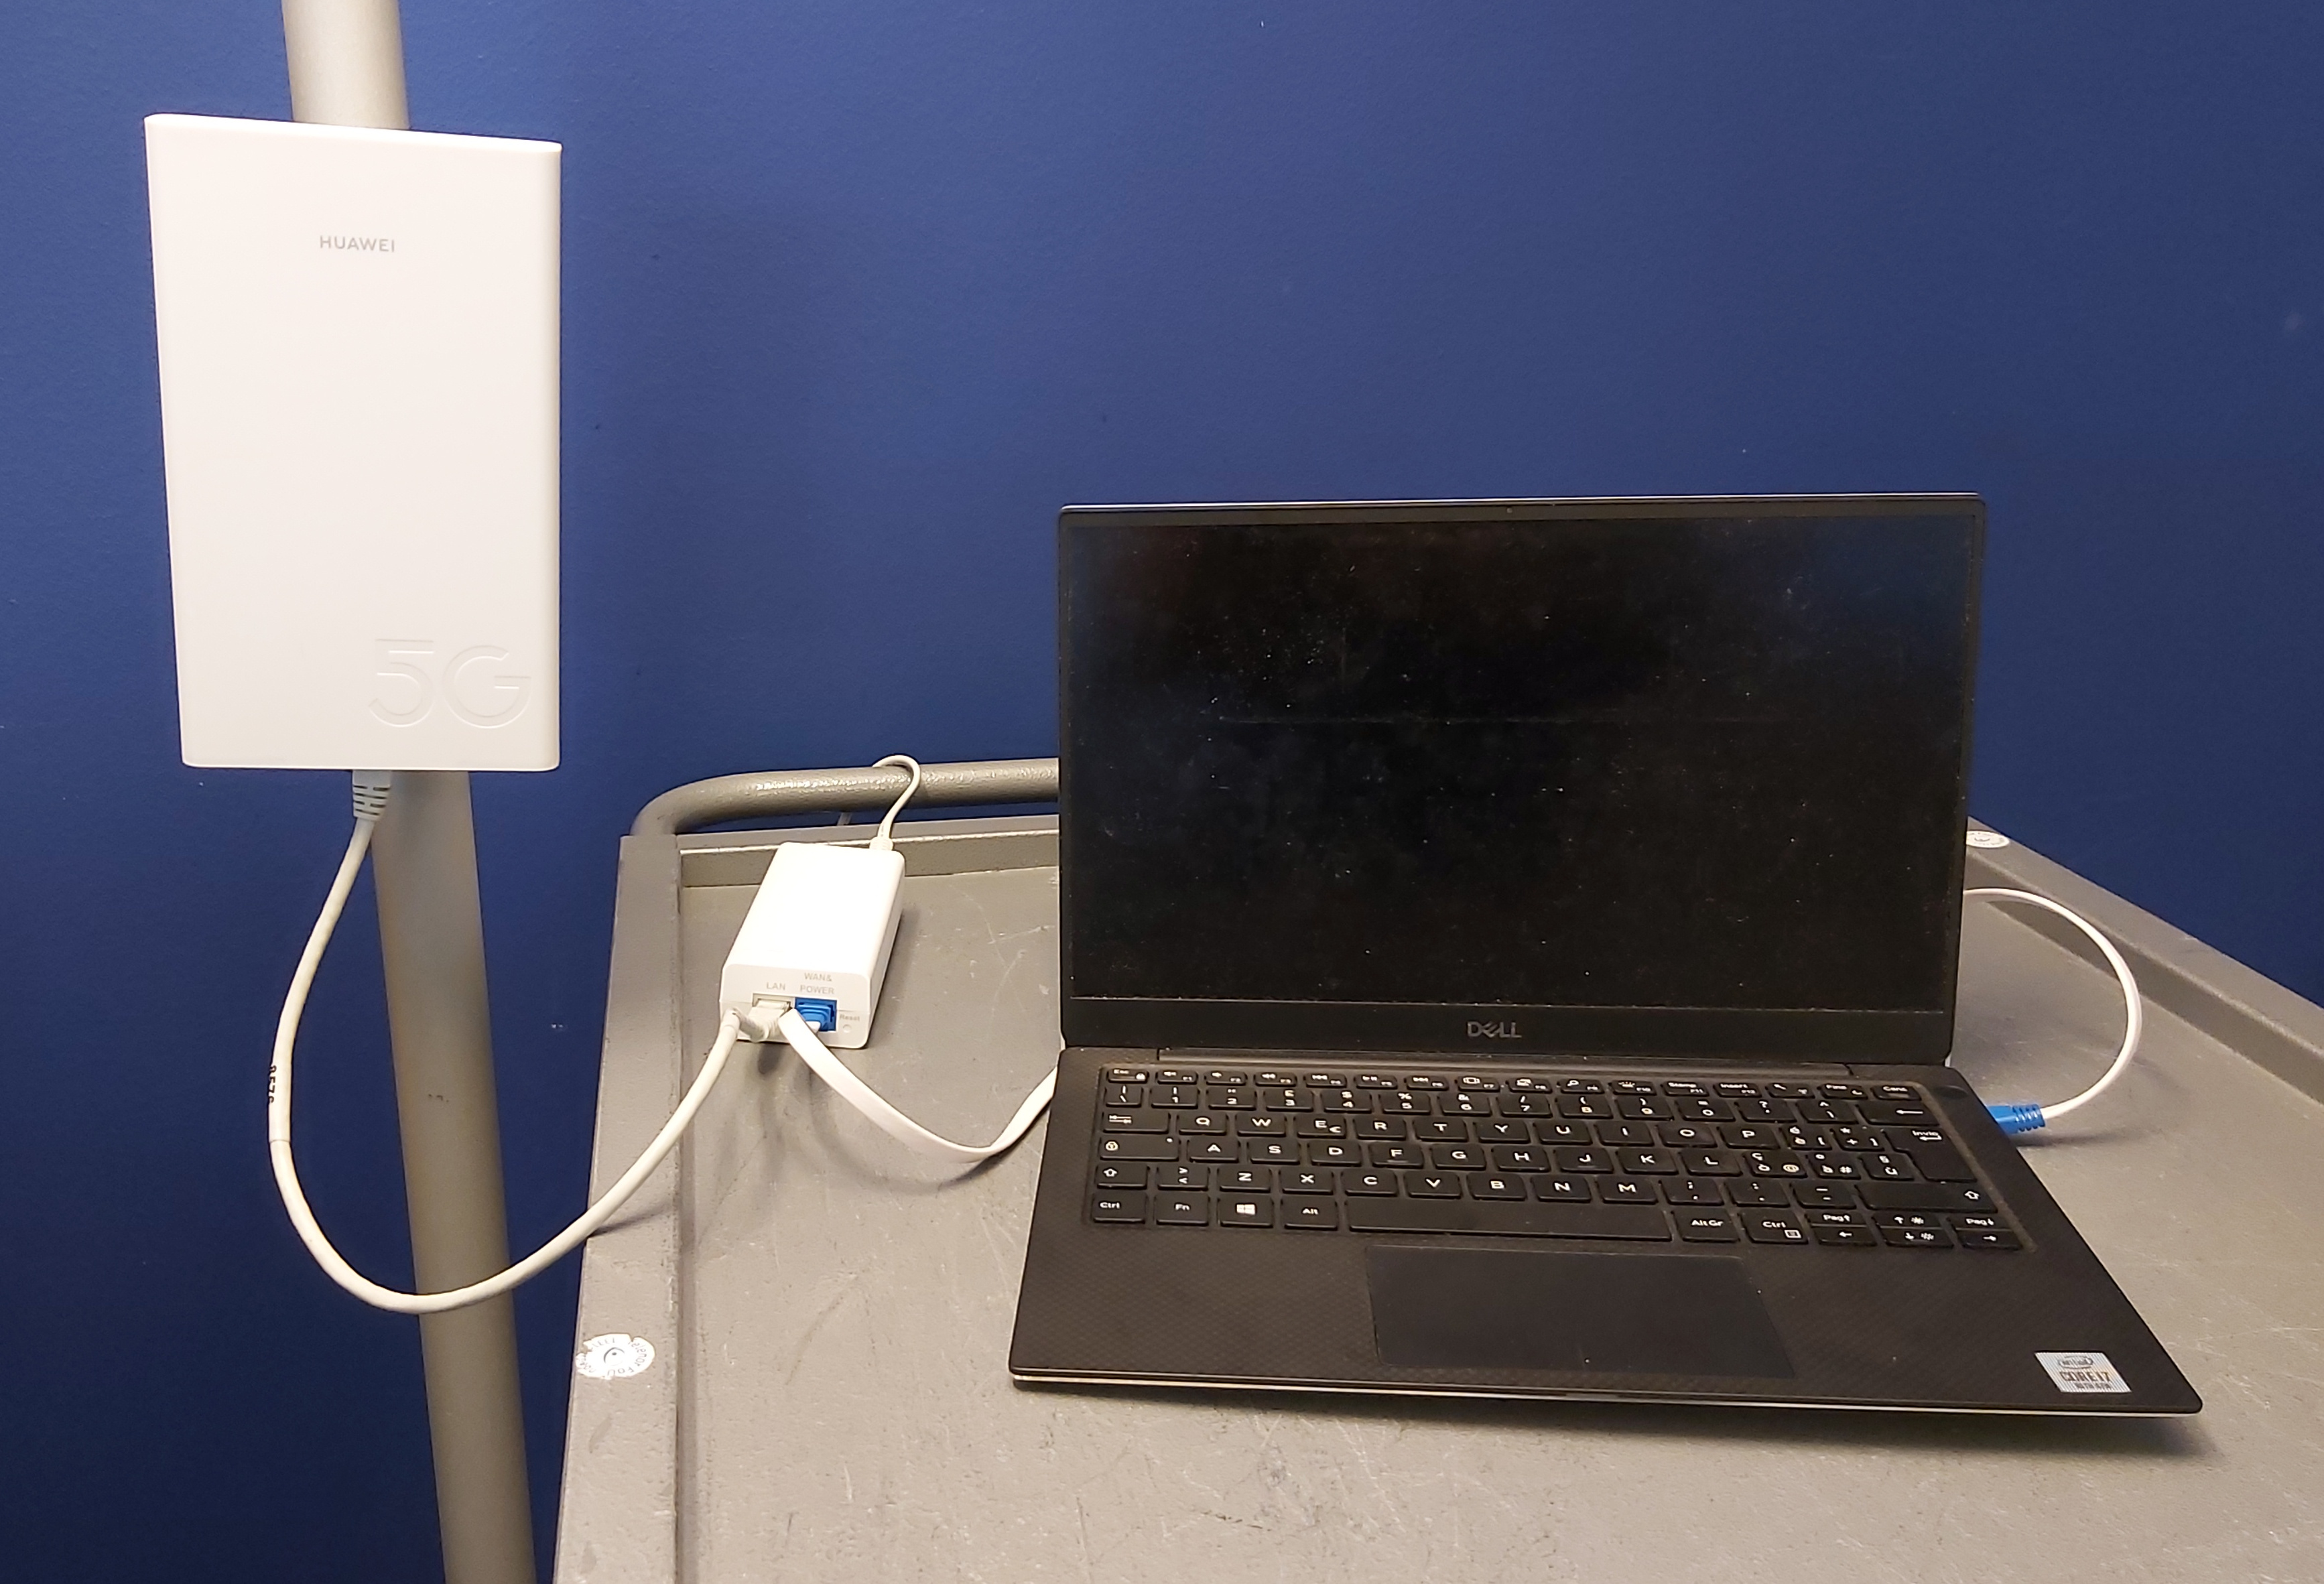
We also collected the measurements to analyze the performance of 5G mmWave end-to-end transmission. Because of BS maintenance, the northern sector was not operational, and the measurements for the bitrate and delay study were done only in the southern sector. Each experiment was repeated at exactly the same locations and with the same BS configuration used for the channel quality measurements. This experiment focused on the user experience, so we evaluated the end-to-end bitrate and Round Trip Time (RTT). The measurements were performed with a pre-production Huawei 5G CPE, supporting MIMO and operating in Non Standalone (NSA) mode, which can reach data rates of up to 1 Gbps. A Gigabit Ethernet cable connects the CPE to a laptop which acts as the client. Even though the BS can achieve approximately 3 Gbps in downlink, the Gigabit Ethernet limits the maximum transfer rate with the laptop to 1 Gbps. This does not pose an obstacle for our analysis, since we are more interested on the cases where the network performance drops well below this limit, as a consequence of obstacles or other environmental phenomena. Fig. 3 shows the devices and the measurement setup used for this study.
The traffic sources are servers located inside the operator’s network to avoid the effect of cross-traffic and congestion over the public Internet. The delay performance was assessed from the RTT measurements given by ping, with packets of 64 bytes (default setting) and of 1500 bytes (maximum size allowed by the Ethernet connection without requiring IP fragmentation). Note that, to be transmitted over the wireless link, the bigger ping packets have to be split into multiple Transport Blocks when the system experiences bad signal, which results in the use of robust (but not very spectrum efficient) modulation and coding schemes. The bitrate performance is evaluated through iPerf3111https://iperf.fr/, a cross-platform tool for network performance measurement. We use ten parallel TCP connections, lasting at least 10 seconds, to get an estimation of the bitrate achieved at each measurement location.
IV Measurement Results
IV-A Coverage analysis
We first focus our analysis on the measured Synchronization Signal Reference Signal Received Power (SS-RSRP), which is the average power of the Resource Elements (REs) that carry the Secondary Synchronization Signal (SSS) transmitted within a Synchronization Signal Block (SSB) [28]. The beams are time-multiplexed, thus there is no interference between the beams when the SS-RSRP is measured. For simplicity in the sequel we will refer to SS-RSRP as RSRP. Each SSB/beam is assigned a unique number, called SSB index. Note that the values of the SSB index were not contiguous. Thus, in the subsequent plots, the numbering of SSB indexes has gaps.
Fig. 1 presents the mmWave coverage map. At each location, we were able to detect all the PCIs of the relevant sector and most of the beams. Since a UE would be attached to the dominant beam, i.e., that with the highest RSRP among those detected by the UE, in Fig. 1 we report only this maximum RSRP values.
In mmWave bands, the RSRP is dominated by the signal’s LoS components: missing these components can lead to significant attenuation. This can be easily seen in area A of Fig. 1, where the LoS link is blocked by buildings and the RSRP drops below -113 dBm. Although the availability of LoS components of a mmWave signal is an important factor in determining coverage, other effects like signal diffraction, reflections from surrounded objects, and multipath propagation can compensate for their absence. These effects are likely responsible for the relatively large RSRP measured in Area C of sector 1, between the two buildings, where the LoS link is blocked by the roof edge of the building hosting the BS. In contrast, in absence of reflecting or diffracting elements, there are no nLoS components of mmWave signals. This is the case of area A, where the signal propagates in a vegetated area without many reflecting elements, and of area D, where we did not record any significant RSRP value at most of the locations.
As expected, we did not observe a significant difference between PCIs for the same beam. Moreover, in presence of LoS, we did not record a strong dependency between signal power and distance to the BS. The attenuation due to the increasing distance is indeed marginal compared to the rest of the factors that affect the RSRP, which fluctuates within a certain range as long as the receiver remains in the main lobe of the dominant beam. This behavior can be observed by considering a straight LoS line in Area B and sampling locations at a distance from the BS ranging from 200 m to 450 m. At such LoS locations, the median RSRP value of the dominant beam is always between -94 dBm and -100 dBm, regardless of the distance. We hypothesize that it is the vertical antenna gain pattern that is causing this behavior. At short distances we were located significantly below the boresight of the BS antenna, hence the antenna gain was low. As we moved further away we got closer to the boresight and the antenna gain increased. So the effects of larger pathloss and increasing antenna gain as the distance increased approximately cancelled each other. We discuss in more detail the relationship between RSRP and distance in Sec. V, where Fig. 11(b) vizualises our measurements and compares the maximum measured RSRP to state of the art models.
To construct the bitrate map, we launched 10 parallel continuous TCP connections and walked around the cell site with normal speed, while tracking the location by external GPS. Simultaneously, tcpdump captured the generated traffic. We were able to get an estimate of the observed bitrate at each location by correlating the timestamps of the packet capture and the GPS log. The packet capture is split into 100 ms bins and all the packets received during a bin are grouped together. The bandwidth values are estimated by dividing the total number of bytes of all the packets in a bin by 100 ms. Then, we assign this bandwidth value to the closest, by time, GPS entry. As shown in Fig. 1, the bitrate in different locations is highly correlated with the RSRP: the higher the RSRP, the higher the bitrate. As seen in the figure, in the LoS locations, the maximum possible bitrate is achieved. Even in area E, which is relatively far from the BS, the bitrate is high. Note that, the Gigabit Ethernet connecting the CPE to the Laptop is the bottleneck and limits the network speed to 1 Gbps. In a very bad channel state (area D), TCP still keeps the connection open but with a very low bitrate.
IV-B Beam separation
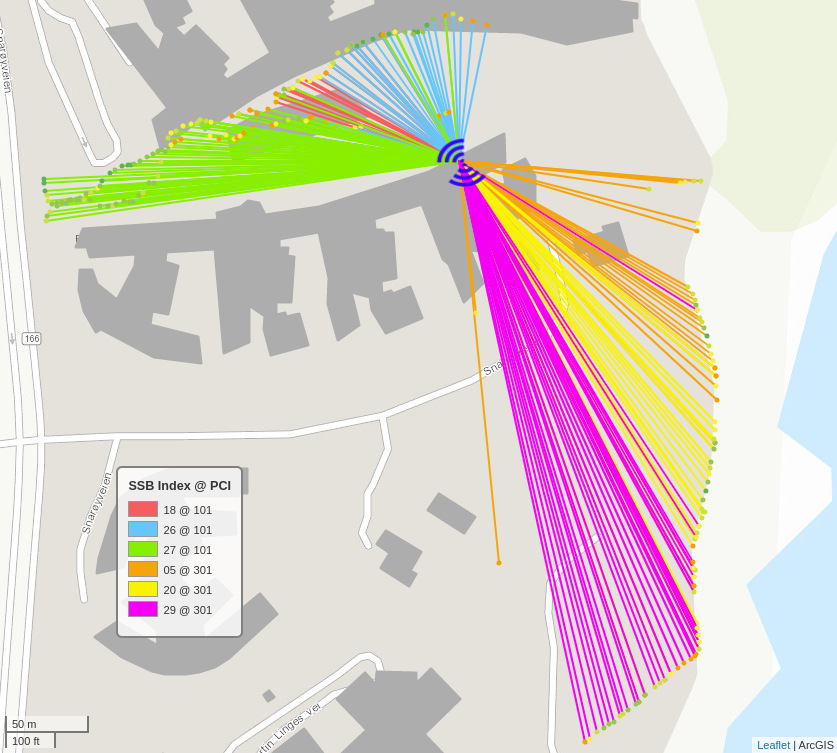
A sharper beam can improve spatial separation between users, hence increasing MU-MIMO performance, as well as reduce interference in multi-cell deployments. To showcase beam separation, we select a few locations, creating a perimeter at the ground level around the BS. Fig. 4 color codes the dominant beam at each location. The beam lines drawn on the map are hypothetical, connecting the BS and receiver location and the actual beams are not as narrow as we have shown in the figure: signals from different beams can be detected at a much wider angle (side lobes) and even at the backside of the transmitter (back lobes). According to [29], the RSRP should be above -110 dBm to be detectable by 5G NR UEs, thus we filter out values below this threshold. For each sector, we have also displayed only three out of 16 beams and have not considered the beams that overlap in the vertical plane. We observe a similar beam separation pattern across the vertical axis, by performing measurements on several floors at the building opposite of the BS at sector 1. The dominant beams at the ground level, third floor, fourth floor and roof are different.
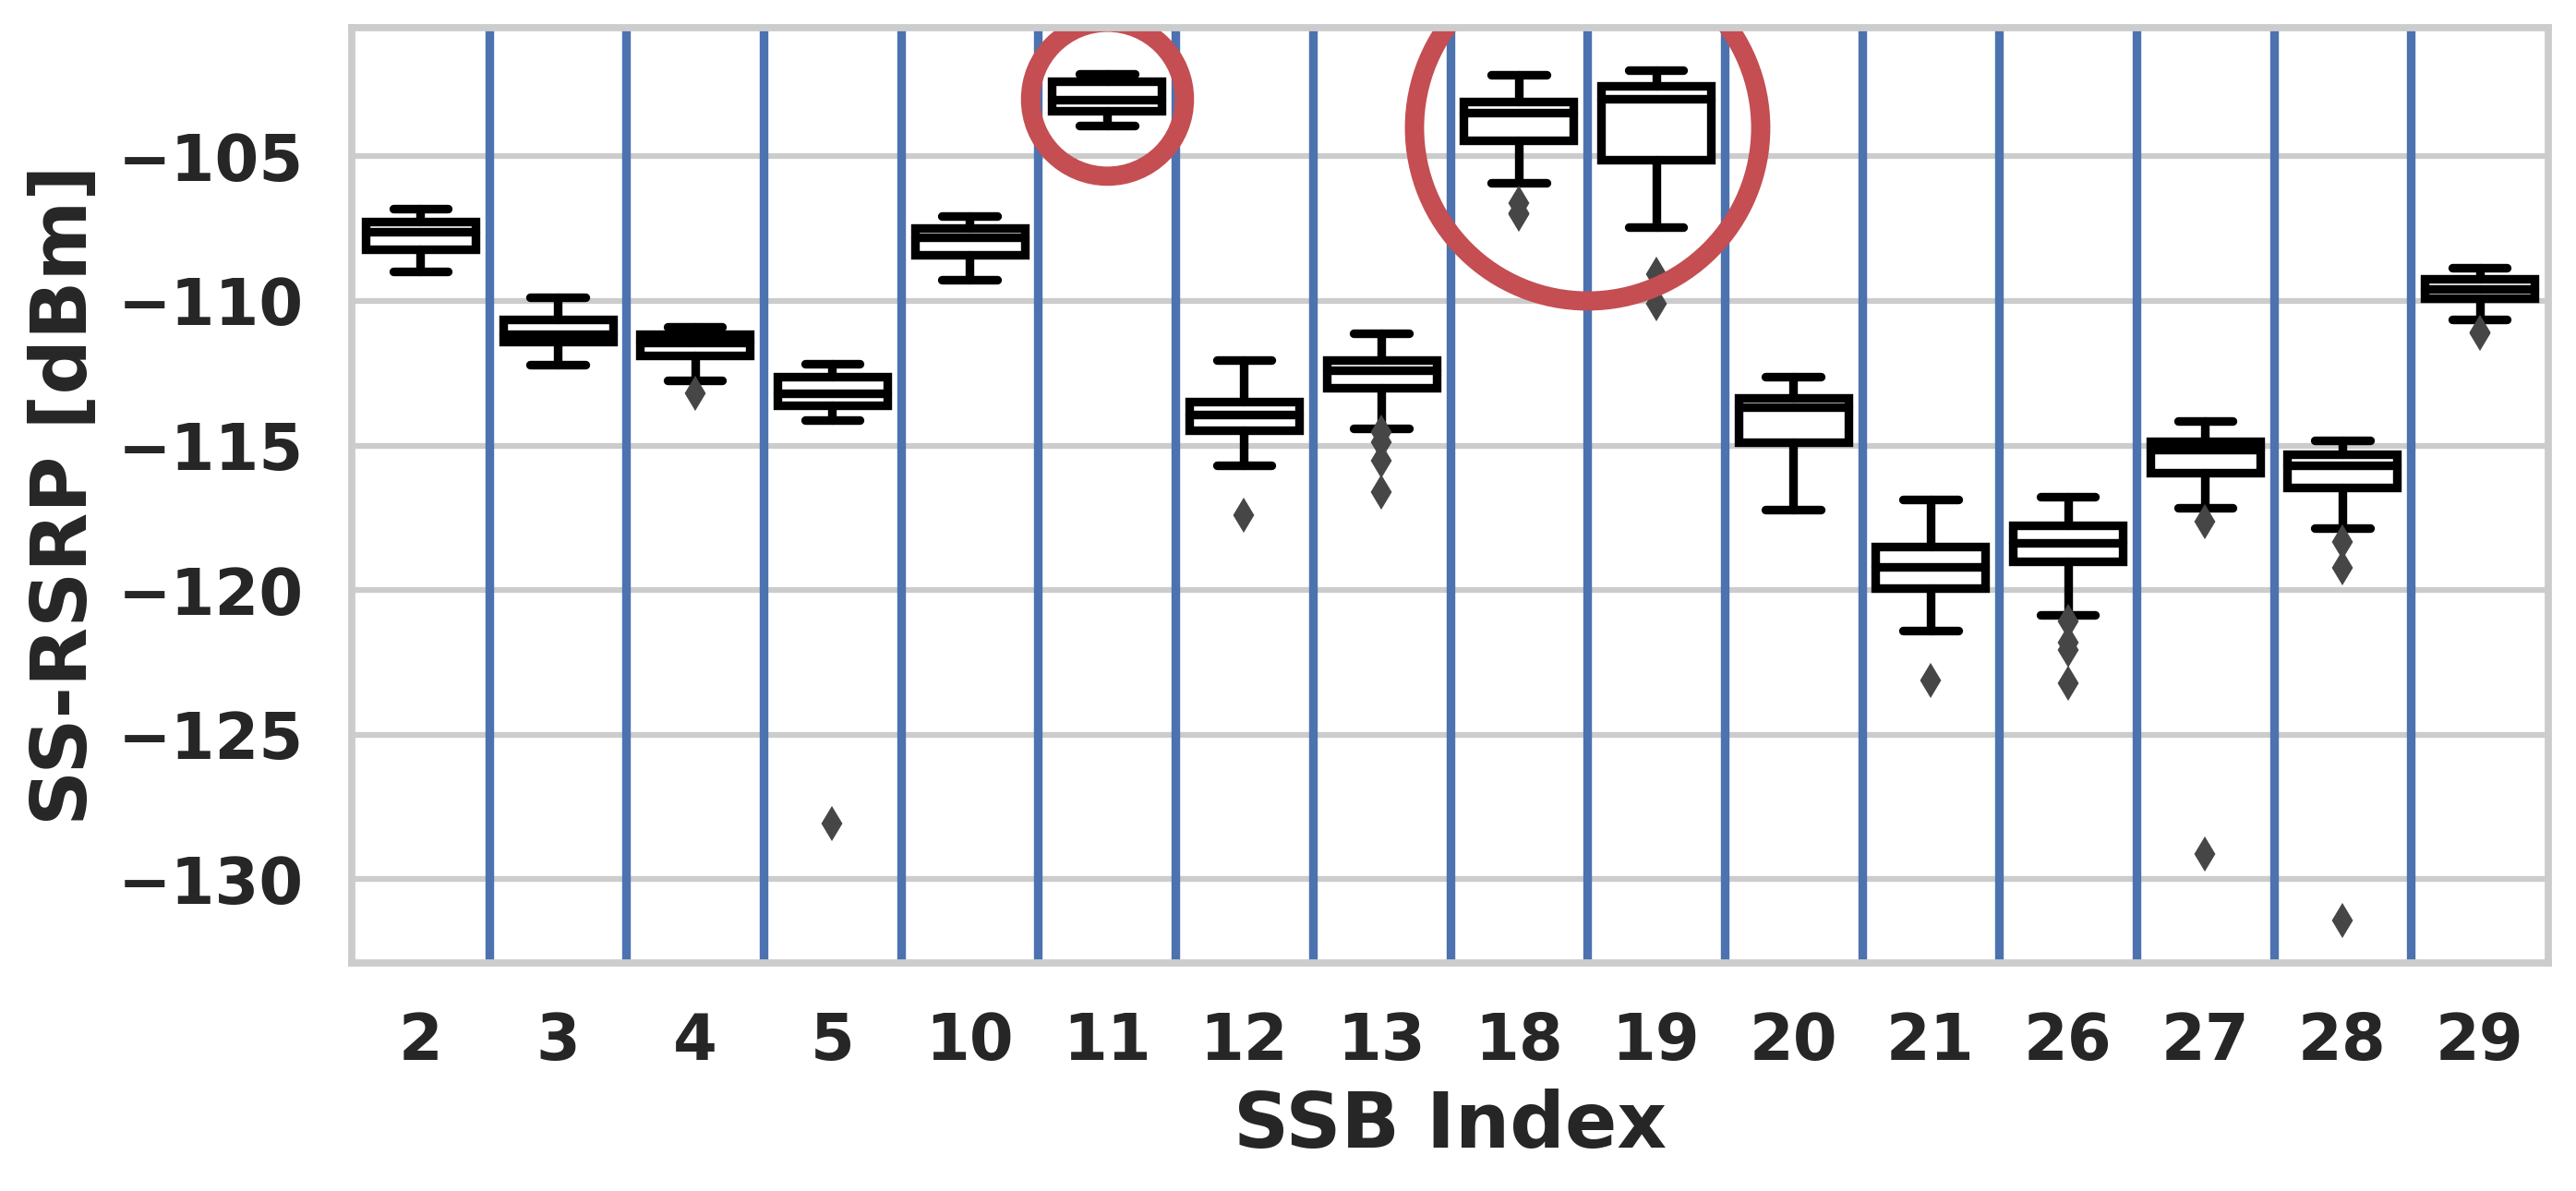
As commented in Sec. IV-A, within a certain range, the actual distance between transmitter and receiver is not of much relevance as long as the receiver is within the main lobe of the dominant beam. Therefore, it is possible to get good signal even at long distances. The furthest point from the BS we could detect RSRP higher than -110 dBm was 902 meters. We can assume a commercial UE would be able to achieve an even bigger range, because of the receiver antenna gain. At almost all the studied locations, a single beam had consistently and markedly higher RSRP than the rest for the whole measurement duration, so beam selection was trivial. However, it is possible to have multiple dominant beams in some locations, as shown in Fig. 5, where the RSRP values for different beams are presented at a single location for one PCI over a 5 minute period. We can observe that three beams, marked with red circles, have about the same median value. The number of simultaneous beams is limited by the number of Transmit/Receive (transceiver) units in the BS, so only one beam is transmitted in any given time/frequency slot for each PCI. This time multiplexing avoids inter-beam interference, but beam selection becomes more complicated. In such cases, it might be better to have a secondary criterion for beam selection, such as choosing the beam with the lowest standard deviation of RSRP. Even more sophisticated beam selection algorithms [30, 31] might be required in a more complicated and dynamic propagation environment. On the other hand, the slightly overlapped coverage regions of the SSB beams are good for robustness (body blockage, moving cars, etc), where there is a higher chance of having at least a good beam at any time. The other benefit of this slight overlap (or closely spaced beams) is to have a smooth user experience as a UE moves from one beam’s coverage region to another beam’s.
IV-C Environmental impact on mmWave propagation
In the following, we analyze the effect of different environmental factors such as human body blockage, communication over-water surfaces, foliage and rain-induced attenuation on mmWave propagation.
Human body blockage effects
| Position | Bitrate [Mbps] |
|---|---|
| Line of sight | 822 |
| No line of sight (2 sitting 2 meters away from the CPE) | 613 |
| No line of sight (2 standing right in front of the CPE) | 755 |
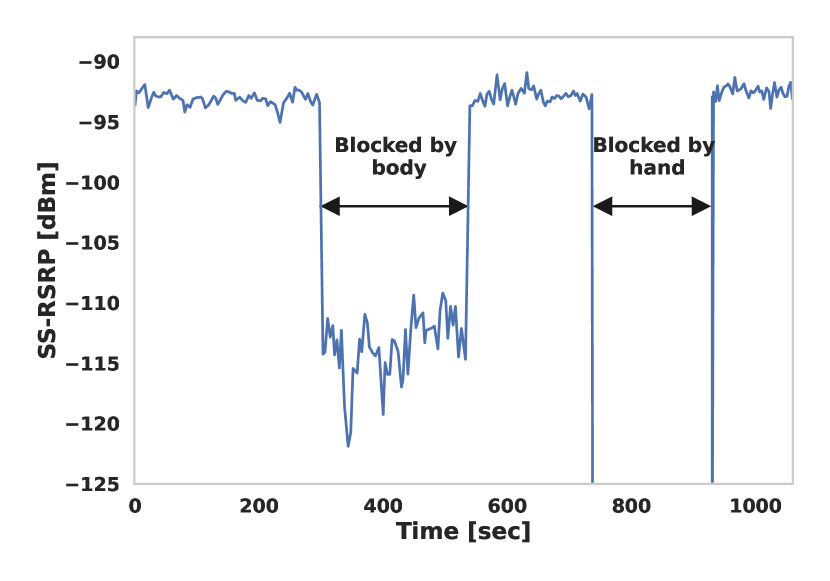
To analyze the impact of human body blockage, we placed the scanner at a LoS location 260 meters away from the BS. We then blocked the direct link from the BS in two different ways. First, by standing 10 cm away from the scanner, and later by folding the hand around the scanner’s antenna, which are typical behaviors of smartphone users. As shown in Fig. 6, we observed a 20-30 dB drop in RSRP in the first experiment, which is in line with the literature [18]. In the latter case, all the signal components were removed, and we were unable to detect any signal. In the first case, the received signal was likely due to the nLoS components reflected or scattered from the surrounding objects, or diffracted from the person were standing in front of the scanner. Folding the hands around the scanner’s antenna, instead, completely shielded the receiver from all the signal components, which explains the absence of significant RSRP measurements. The human body blockage effects on mmWave communications have already been investigated and modeled in various ways, and the interested readers can refer to [17, 32] for more information. Our experiments hence confirm this critical aspect also in commercial cell deployments.
The effect of body blockage on bitrate is presented in Tab. II. We measured the bitrate with 10-parallel TCP connections as above, while 1) two average-size people were sitting about 2 meters away from the CPE, completely covering the LoS link, and 2) two people standing right in front of the CPE. As seen in the table, the bitrate dropped from 822 Mbps to about 613 Mbps and 755 Mbps for the first and second scenarios, respectively. This shows that despite the partial occlusion of LoS, the performance at TCP layer seems to remain acceptable.
Foliage Attenuation
| Position |
|
|
|
||||||
|---|---|---|---|---|---|---|---|---|---|
| LoS baseline besides the trees | 891 | 14.6 | 15.7 | ||||||
| Besides a small tree | 831 | 13.4 | 16.6 | ||||||
| Behind a single branch | 785 | 14.8 | 17.5 | ||||||
| Behind big tree with sparse leaves | 451 | 14.8 | 19.6 | ||||||
| Behind big tree | 323 | 15 | 17.8 |
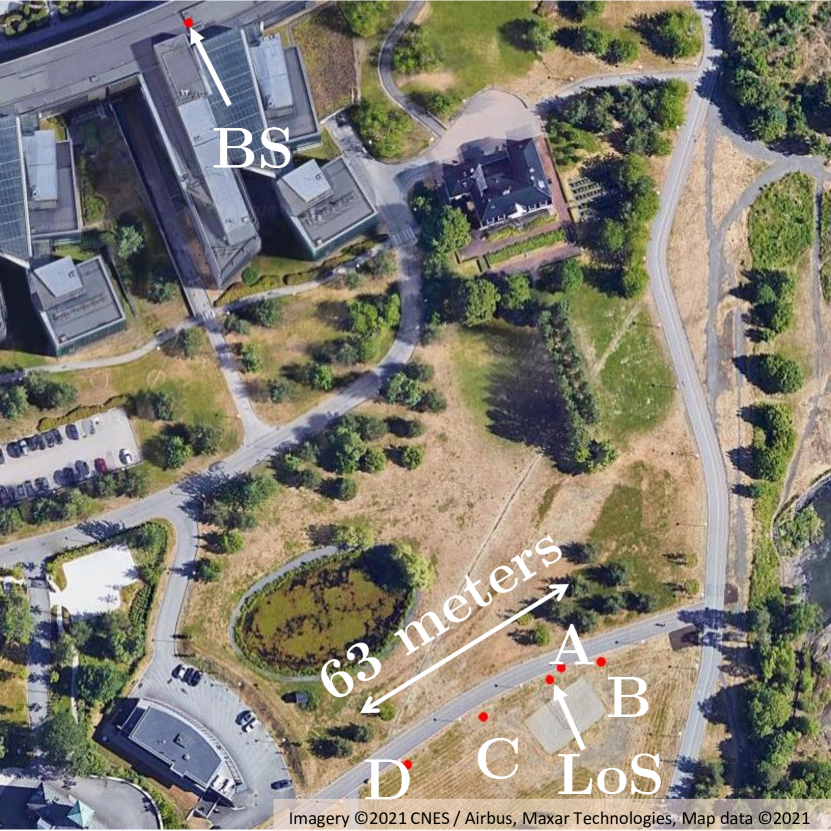
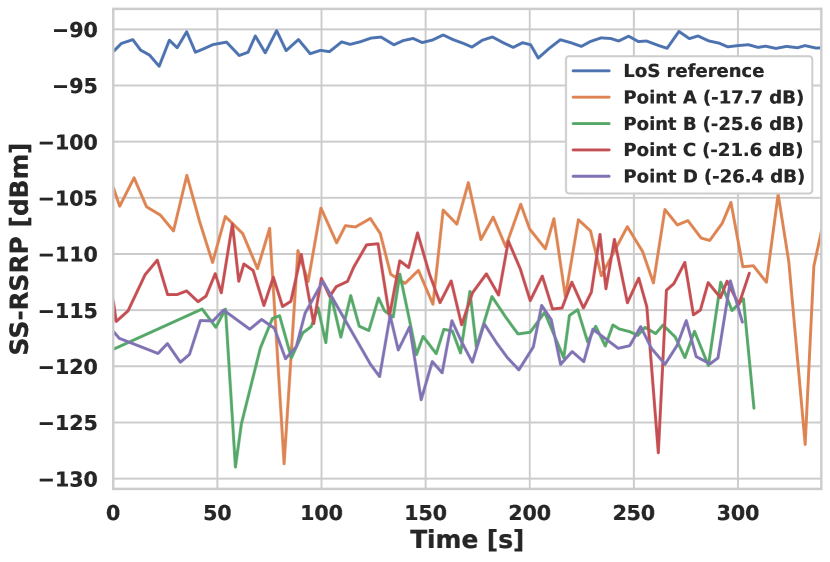
The propagation characteristics of mmWave frequencies in suburban and vegetated environments are very different from those in urban and indoor scenarios. Foliage attenuation could significantly affect communication over this frequency range and should be considered in network planning for such suburban areas [14]. We carried out a set of measurements to investigate the effect of blocking the path between transmitter and receiver by vegetation and trees. During the measurements, nearby weather stations reported wind intensity between 4.7 and 5.9 m/s, which is considered a “gentle breeze” according to the Beaufort scale. The leaves and the twigs on small trees were in constant motion.
Fig. 7 shows the RSRP at 4 different locations where the LoS path is blocked by different types of trees. The recorded RSRP exhibits significant attenuation at all four locations, typically 15 dB to 30 dB lower than our measurements at a nearby reference LoS location. The intensity of attenuation highly depends on the type and shape of the blocking trees, with bigger trees causing higher attenuation. As Fig. 7 illustrates, the smaller trees at location A attenuate the signal by 17.7 dB, while the bigger ones at location D decrease the received signal power by up to 26.4 dB. This result is comparable with similar studies, where the authors reported dB foliage attenuation in 26.5 GHz [33]. The high variations in RSRP are likely due to wind that constantly moved trees’ branches and leaves, which resulted in varying blockage and reflection patterns.
Tab. III summarizes the result for the foliage effect on bitrate and delay. The measurements take place under a gentle breeze (wind speed between 2.4 to 5.1 m/s). As was expected, the bitrate drop and delay are highly correlated with the result from the RSRP measurement. The bigger trees with more dense branches and leaves cause a more significant drop in RSRP, and these unreliable links result in decreasing the bitrate and increasing the RTT. Based on the type of foliage and tree, communication speed dropped from 891 Mpbs at the LoS baseline location to 426 Mbps when being behind small trees and further dropped to 323 Mbps when being behind big trees. Also, the delay is larger for big packets than for small packets, as they may break into multiple Transmission Blocks and be retransmitted multiple times under challenging signal conditions.
| Beam type | Distance (m) | PCI-301 | PCI-302 | PCI-303 | PCI-304 | TCP | ||||||||||||||||||
|---|---|---|---|---|---|---|---|---|---|---|---|---|---|---|---|---|---|---|---|---|---|---|---|---|
|
std |
|
std |
|
std |
|
std |
|
|
|
||||||||||||||
| Over water (close to the sea level) | 792 | -103.2 | 2.33 | -105.2 | 3.12 | -103.7 | 2.62 | -105.9 | 3.35 | 903 | 13.9 | 17.5 | ||||||||||||
| Over water (6m above sea level) | 813 | -111.4 | 4.61 | -110.6 | 4.70 | -107.7 | 3.16 | -105.8 | 3.25 | 885 | 15.5 | 16.6 | ||||||||||||
| Ground | 573 | -94.3 | 0.29 | -94.7 | 0.33 | -93.0 | 0.30 | -92.3 | 0.29 | |||||||||||||||
| Ground | 256 | -103.0 | 0.54 | -102.1 | 1.21 | -100.1 | 0.66 | -100.7 | 0.76 | |||||||||||||||
| Ground | 213 | -91.3 | 0.56 | -94.2 | 0.76 | -96.4 | 0.84 | -92.2 | 0.59 | |||||||||||||||
| Ground | 323 | -93.1 | 0.80 | -94.8 | 1.57 | -103.7 | 3.20 | -97.5 | 1.87 | |||||||||||||||
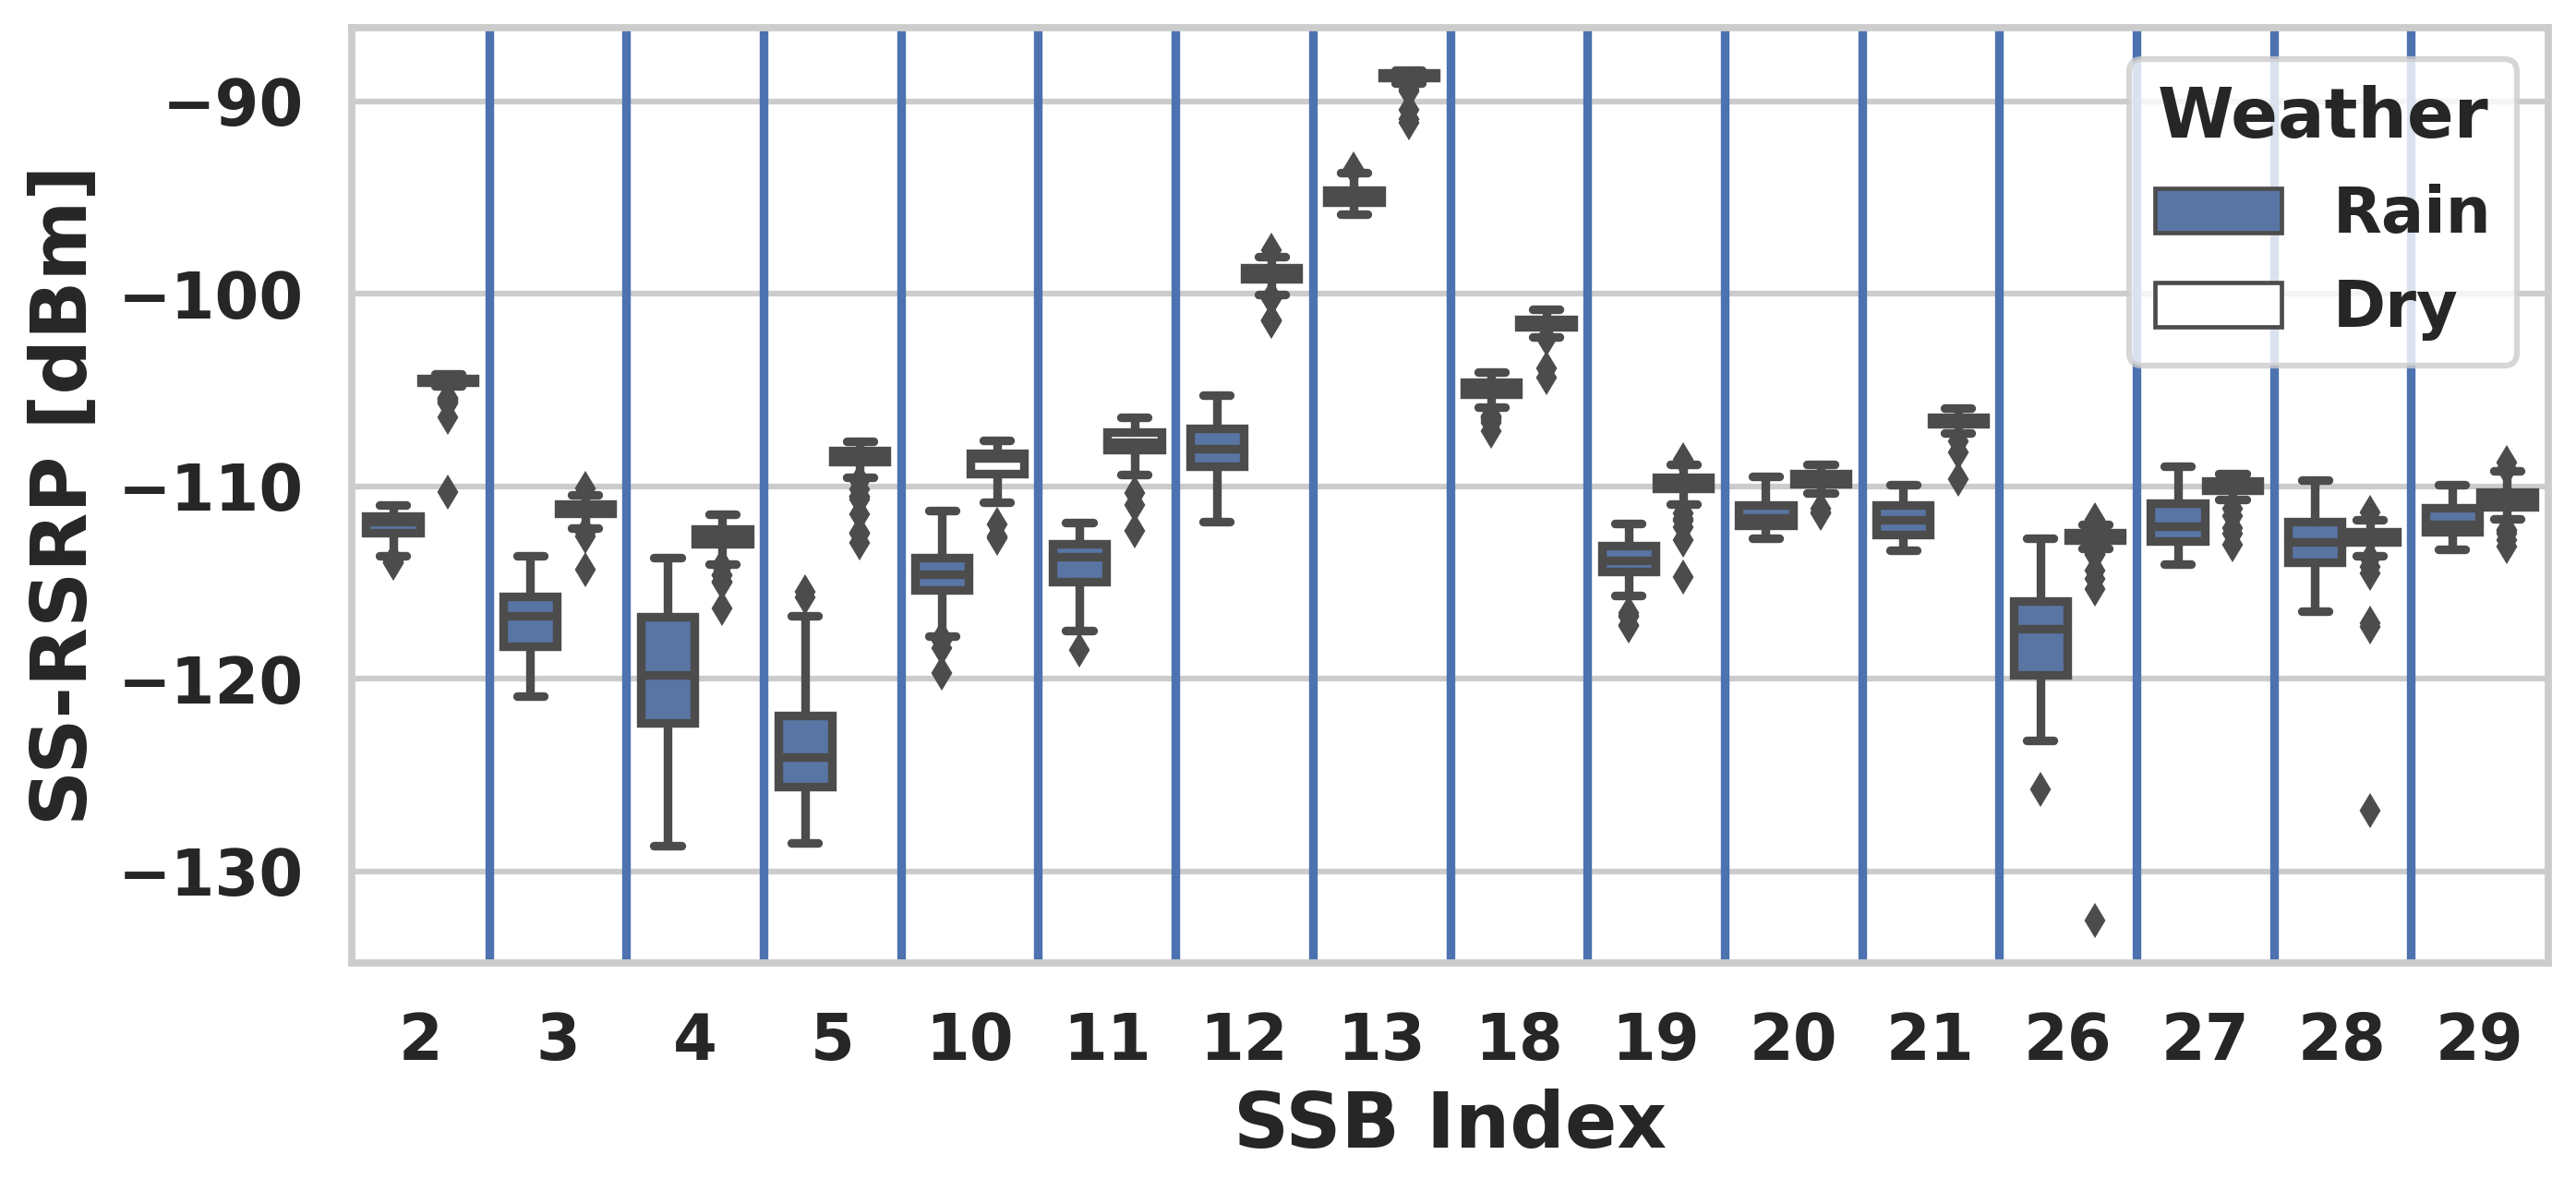
Rain-caused attenuation
We collected measurements on two different days, with dry and rainy weather, at the same location. During the rainy day, nearby weather stations reported precipitation between 0.1 and 0.2 mm per minute, which is a moderate to heavy rain intensity. Fig. 8 presents the RSRP values measured for different weather conditions for a single PCI, grouped per beam. Results for the other PCIs are similar. As it can be seen from the figure, rain causes a notable drop in the mean RSRP and increases its variability in particular for the weaker beams.
The increased variability for the weaker beams is probably caused by multi-path signal propagation where no single signal component is significantly stronger than all others. The most significant components will consist of signals reflected by e.g. buildings and vegetation, and usually also of the LoS signal. Strong beams point towards the scanner and the BS antenna gain for the LoS signal will be high. Therefore the LoS signal will be much stronger than the reflected signals, and the received signal power will have little variability. Weak beams, on the other hand, do not point directly towards the scanner and the BS antenna gain for the LoS signal is therefore low. In this case the strength of the reflected beams might be comparable to or larger than the strength of the LoS component. This results in multi-path fading that gives large variability in the received signal power.
Over-water communication
We also investigate how water surface scattering and reflection affect mmWave signals. This scenario could be relevant when mmWaves are used for providing high capacity communications on the shore. For example, fish farms plan to use mmWaves for high definition video communications between fish cages and on-land data centers where advanced signal processing and analytics are used to, e.g., control feeding and monitor fish health [5].
We performed the measurements at locations with good LoS of the BS antenna, on the far side of a small bay. From the BS, the mmWave signal first travels over the ground for about 630 meters and then over-water for 160 meters before reaching the scanner. The measurements were collected at two locations. First, we put the scanner at the shoreline about 50 cm from the water. Second, we placed the scanner approximately 6 meters above the water surface. We could not assess the water wave height directly, but during the measurements, nearby weather stations reported a wind intensity between 4.9 m/s and 5.6 m/s, which typically corresponds to wave heights of 0.6 m to 1.2 m. The measurement location is relatively sheltered, though, so we can assume that the wave height is closer to the lower limit of this range. For comparison, we also made corresponding measurements at LoS locations with different distances to the BS where the propagation was solely over-ground (due to terrain and building blockage, we were not able to do over-ground propagation measurements at exactly the same distances as for the over-water measures). Tab. IV summarizes our measurements. The RSRP standard deviation for over-water propagation is significantly larger than for over-ground propagation. The increased standard deviation for the over-water communications can be explained by a model where the received signal consists of a direct LoS component and one or more components (specularly or diffusely) scattered from the water surface. Since the water surface moves, the scattered components’ strength varies with time, thereby causing signal power variations at the receiver.
Another observation from Tab. IV is that the difference between the mean RSRP values for PCIs with different frequencies are much larger at 6 meters above the water than at the sea level. This can be explained by the same propagation model. When the scanner is located close to the water surface, the scattered components of the signal are coming from the water immediately in front of the scanner. In contrast, these components are originated much further out when the scanner is placed far above sea level, so the scattered components’ delay compared to the LoS is more variable. In frequency domain, this translates to flatter fading (i.e., attenuation is almost the same across neighboring frequencies) when the scanner is at sea level than when placed at a higher location. A consequence of the increased signal variation for over-water reception is that it will be necessary to use a higher link margin in the link budget calculations than when the communication is solely over-ground. The smaller signal variation for the scanner located at sea level suggests that mmWave antennas should be placed close to the water, e.g., on a fish cage.
Tab. IV also presents the bitrate and RSRP values for the over-water transmission. The bitrate and the delay at 6 meters above the water are significantly worse than at sea level. This observation was also expected, as the high-level performance is indeed correlated with the RSRP values.
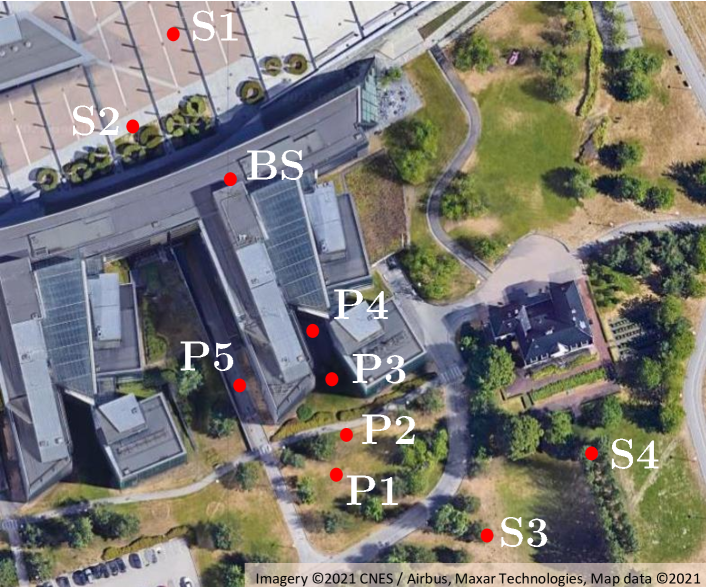
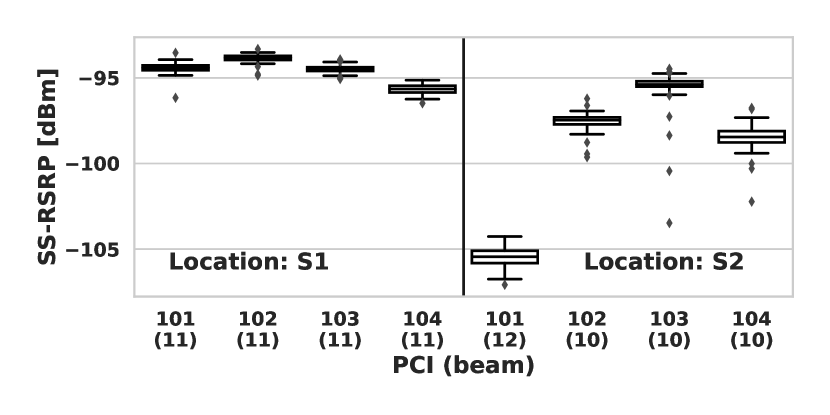
nLoS measurement scenarios
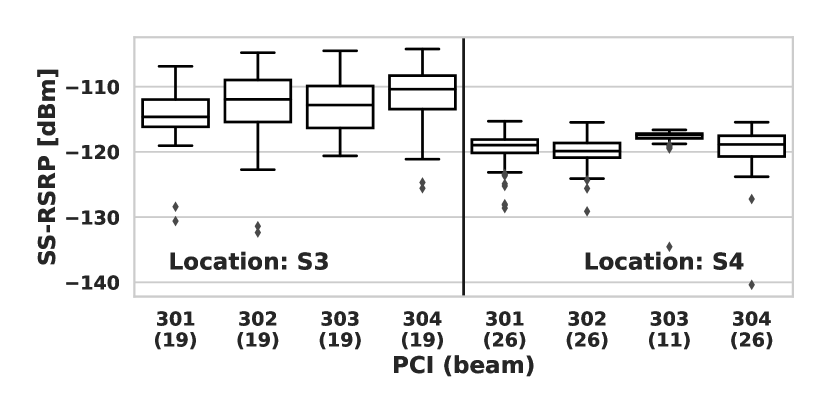
In mmWave communications, LoS links can be easily blocked by buildings, moving cars and other obstacles. In this case, the RSRP depends on the nLoS components, such as reflected, scattered and diffracted waves. To get an indication of the nLoS coverage we performed measurements at four locations where the LoS path to the BS antenna was blocked by the roof of the building with the BS (See Fig. 9). Locations S1 and S2 in Fig. 9 are surrounded by high buildings and a large number of rectangular columns placed in a regular pattern in the plaza between the buildings, representing an urban environment. Locations S3 and S4 are surrounded by trees and some distant buildings, representing a suburban and vegetated environment. Fig. 10 presents the RSRP distribution of the best beam (written in parenthesis) for every carrier (PCI) of the BS at these locations. Even though the orientation of the beams is the same for all the PCIs at the BS, we observe that at locations S2 and S4 the dominant beam is different for some of the PCIs. Further, at location S2, PCI 101 has degraded performance compared to the rest of the PCIs. Both observations are in contrast to what we measure at LoS locations. It can be due to the property of different scattering and diffracting materials at different frequencies (i.e., reflection coefficients and penetration losses), but we are unsure about the exact source of these behaviors.
At locations S1 and S2 the received signal is quite strong, indicating good nLoS coverage. This is thought to be due to the rich scattering environment, possible reception of diffracted (i.e., from the edge of the roof) signal components and the relatively short distances involved. At locations S3 and S4 the received signal level is very low and there is little or no nLoS coverage. This is thought to be due to a much poorer scattering environment. The buildings that might act as good reflectors for the signals are located far away from both the BS antenna and the scanner, hence the signal paths will be very long. The trees in the surrounding area further attenuate both the reflected and the diffracted signal components. These results show that in an urban environment, with multiple buildings and scattering elements, the nLoS components of the mmWave signals could compensate for the lack of a LoS link to the BS. In contrast, in vegetated areas, the LoS link is necessary to establish reliable communication.
Finally, we study the end-to-end communication performance over nLoS 5G mmWave links. To do so, we collect measurements in different locations, close to the buildings, where there is no LoS path to the BS. These locations are marked as P1-P5 in Fig. 9. Tab. V reports the bitrate and RTT values for the mentioned locations. It is evident that the bitrate sharply drops and the delay increases by moving toward the buildings. This is an expected observation as fewer diffracted elements reach the locations close to the building, which results in lower RSRP and therefore bitrate.
| Position | Bitrate [Mbps] | RTT [ms] normal size | RTT [ms] big size |
|---|---|---|---|
| P1 | 845 | 15.4 | 17.8 |
| P2 | 573 | 16.5 | 33.9 |
| P3 | 176 | 15.6 | 22.1 |
| P4 | 87 | 18.0 | 48.0 |
| P5 | 177 | 15.4 | 18.1 |
V Comparison with Simulations
This section compares our measurement results with simulations based on empirical models to check how accurately statistical models can predict the received signal at different locations. The complexity of the propagation environment, makes impossible the use of accurate channel models, i.e., ray-tracing based quasi-deterministic channel models [34, 35], to accurately obtain the nLoS components of the propagated signal is not possible. We hence used 3GPP’s statistical channel model for mmWave frequencies [36] to estimate the path loss for different scenarios. For Sector 1, we use the Urban Micro (UMi) and Urban Macro (UMa) channel models [37, 38], as the BS is pointed towards a square surrounded by large buildings and the topology is similar to a typical urban environment, while for Sector 2, we employ the Rural Macro (RMa) model [39], as it represents a suburban area with more trees and vegetation and fewer or no buildings. The omnidirectional path loss model used in our simulations is:
| (1) |
where, is the distance from transmitter, [m] is the wavelength, [m/s] is the speed of the light, [dB] indicates the shadow fading, whose standard deviation is , represents the path loss exponent and [m] is the free space reference distance. The values for and at different scenarios are presented in Tab. VI.
| Parameter | RMa | UMa | UMi | |||
|---|---|---|---|---|---|---|
| LoS | nLoS | LoS | nLoS | LoS | nLoS | |
| 2.3 | 3.1 | 2 | 2.9 | 2 | 3.2 | |
| 1.7 | 6.7 | 4.0 | 7.0 | 4.0 | 7.0 | |
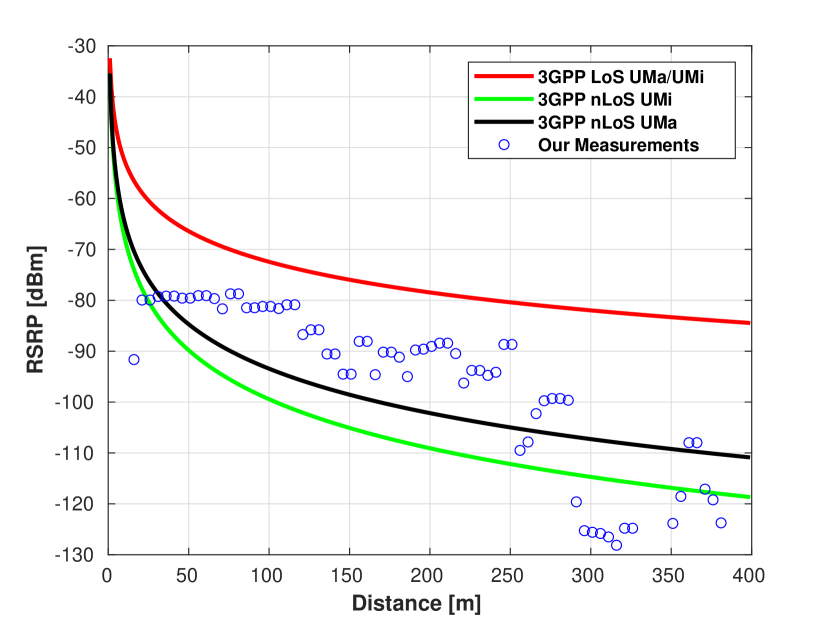
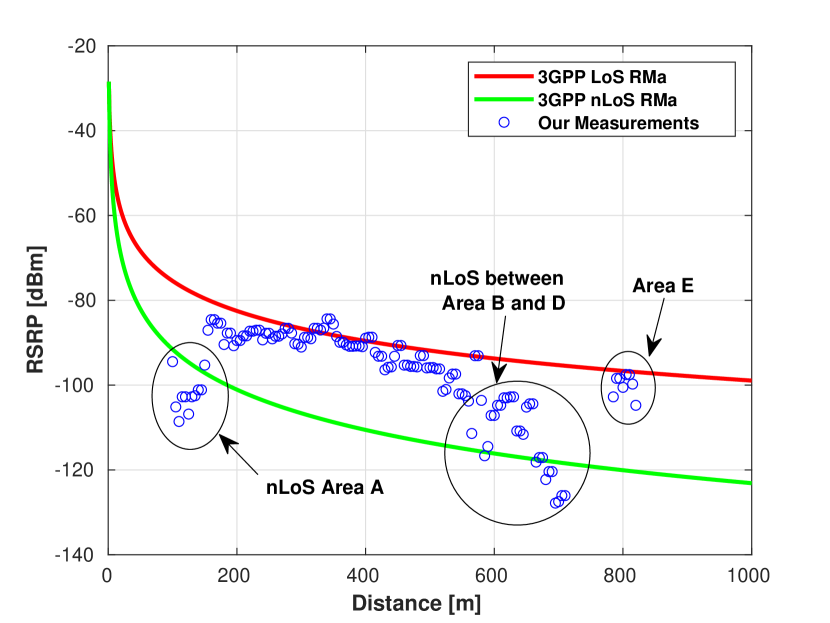
Fig. 11 shows the maximum measured RSRP of the dominant beam at different distances for Sector 1 and Sector 2 and compares it to the RSRP achieved using the omnidirectional path-loss model in (1), as is perceived from two omnidirectional isotropic transmit and receive antennas with 0 dBi gain.
The strongest measured RSRP in Sector 1 is -78 dBm, which is a bit higher than the strongest RSRP in the other sector (-84 dBm). As shown in Fig. 11(a), our measurements can barely fit with the 3GPP UMi and UMa models. The RSRP varies between -78 dBm and and -130 dBm which is always lower than the predicted values by the LoS models and only at larger distance is lower than the nLoS models. This figure clearly shows that statistical channel models are not always capable of predicting the RSRP accurately in every propagation environment. Fig. 11(b) shows that the LoS RMa can estimate the RSRP in locations with clear sight to BS. Even in Area E, where the signal propagates overwater, this model predicts the RSRP relatively well ( dBm error). On the other hand, nLoS RMa fails to accurately predict the RSRP for nLoS locations. The variation in measured power in nLoS is mainly due to changes in the type of the obstacles, scattering objects, and topography of the environment, rather than pure distance. Referring to Fig. 1 and Fig. 9, the type and shape of obstacles blocking LoS in area A and the area between B and D are very different and composed of buildings with various shape that highly affect the RSRP in these areas.
| Scenario | Distance [m] | Measurement | Simulation | |
|---|---|---|---|---|
| Omni | Strongest | |||
| RMa LoS | 160 | -84.5 | -80.8 | -31.5 |
| RMa LoS | 250 | -87.7 | -85.2 | -36.0 |
| RMa LoS | 350 | -85.6 | -88.8 | -39.6 |
| RMa LoS | 450 | -90.6 | -91.4 | -42.2 |
| RMa LoS | 570 | -93.0 | -94.0 | -44.8 |
| RMa LoS | 810 | -97.5 | -97.7 | -48.4 |
| RMa nLoS | 80 | -103.9 | -90.4 | -41.2 |
| RMa nLoS | 120 | -102.7 | -93.4 | -44.2 |
| RMa nLoS | 590 | -114.4 | -117.6 | -68.4 |
| RMa nLoS | 690 | -120.3 | -117.5 | -68.3 |
| UMa LoS | 60 | -79.0 | -64.5 | -17.2 |
| UMa LoS | 160 | -88.0 | -73.4 | -26.1 |
| UMa LoS | 250 | -88.6 | -77.0 | -29.6 |
| UMa LoS | 500 | -97.8 | -83.2 | -35.9 |
| UMa nLoS | 15 | -91.6 | -63.7 | -16.6 |
| UMa nLoS | 300 | -114.3 | -100.5 | -53.4 |
| UMa nLoS | 450 | -123.6 | -106.0 | -58.8 |
Tab. VII compares the RSRP recorded during the measurement campaign against the 3GPP channel models which are used to estimate the RSRP, both on case of omnidirectional and directional antenna gain patterns at transmitter and receiver. To obtain the values for the strongest RSRP, we use the NYUSIM simulator [40], which searches for the best pointing angle among all possible pointing angles employing the specified antenna details (i.e., azimuth and elevations of receiver and transmitter antennas) in both transmitter and receiver. The details of the procedure is out of the scope of the this paper and interested readers may refer to [40, 41] and the references therein for more details. For this simulation, we assumed that BS and UE are equipped with 16 and 4 uniform linear array antenna elements, respectively.
As seen in Tab. VII and Fig. 11, only in limited LoS scenarios, the omnidirectional path loss models perform well in predicting the mmWave channels. In complicated environments, especially in nLoS locations with many complex scattering objects, using more advanced ray-tracing-based models is difficult, if not impossible, so some extent of measurement is needed to estimate the RSRP accurately. It is also seen that in the best case, the received power at different locations is as good as the omnidirectional power. The gap between the measurement (and omnidirectional power) with the Strongest power is significant for all scenarios ( dBm). This vast gap reveals how much an adaptive dynamic beamformer can improve performance. This specifically makes more sense in some mmWave use-cases where the UEs are stationary, i.e., Fixed Wireless Access (FWA) or do not move fast. Some codebook-based beamforming techniques can be employed for these use-cases where the optimal transmitter/receivers antenna configuration can be learned and saved for future uses.
VI Conclusion
Based on our measurement campaign results, we can confirm that the range of mmWave cells is strongly affected by the presence of obstacles, such as buildings, trees, or human bodies, as already observed in the literature. As expected, the LoS beam is generally the most robust in all situations.
For what concerns the effect of foliage, we observed a degradation of the signal quality when the LoS is obstructed by trees, particularly when moved by (even light) wind. However, this generally affects all beams, so that the dominant beam remains the same. The measurements have also revealed that wide water surfaces, especially in presence of waves, can generate time-varying scattering phenomena that affect the stability of the received signal. This is pronounced if the receiver is higher than the water surface and thus collects more water-reflected waves. The propagation of mmWave on water surfaces is, hence, critical and would require further investigation to determine the limitations of links involving floating stations. Comparing the measured RSRP with the simulated omnidirectional (based on 3GPP’s path loss models) and strongest RSRP (optimal antenna configuration) shows the necessity of measurement in especially complex nLoS environment, in predicting cell coverage and recognizing coverage holes. It also reveals the considerable improvement that mmWaves can achieve by employing a perfect beamformer.
In conclusion, we can claim that our empirical analysis of a commercial 5G cellular system has confirmed the validity of previous studies carried out on prototypal or PoC deployments or via simulations. Clearly, general theoretical models cannot perfectly capture the complexity of real installments, and some significant deviations from model predictions and real-world measurements have been observed in certain cases. This will require the implementation of self-tuning capabilities on commercial installations to adapt the BS configuration to the specificities of the environments, though a first, rough performance estimate can be done using the theoretical models. The effects of body blockage, rain, and trees on the propagation of mmWave signals previously reported in the literature have been mostly observed also in our study. This confirms that the commercial version of the mmWave communication interface does not show any significant limitation with respect to pre-commercial versions, which was not guaranteed. On the other hand, it does not bring any improvement either. Finally, we noticed that beam selection in a real commercial setting is likely less critical than feared, since the strongest beam appears to remain rather stable in time and space, also in bad weather conditions, so that beam swiping techniques should be able to track the best beam direction rather easily.
The above observations should help interested stakeholders make more informed decisions when deploying 5G solutions utilizing the mmWave spectrum. Our next steps involve testing verticals’ use cases at the same cell site to check if their service requirements are met.
References
- [1] A. Narayanan, E. Ramadan, J. Carpenter, Q. Liu, Y. Liu, F. Qian, and Z.-L. Zhang, “A first look at commercial 5G performance on smartphones,” in Proceedings of The Web Conference 2020, 2020, pp. 894–905.
- [2] A. Narayanan, X. Zhang, R. Zhu, A. Hassan, S. Jin, X. Zhu, X. Zhang, D. Rybkin, Z. Yang, Z. M. Mao et al., “A variegated look at 5G in the wild: performance, power, and QoE implications,” in Proceedings of the 2021 ACM SIGCOMM 2021 Conference, 2021, pp. 610–625.
- [3] A. Narayanan, E. Ramadan, R. Mehta, X. Hu, Q. Liu, R. A. Fezeu, U. K. Dayalan, S. Verma, P. Ji, T. Li et al., “Lumos5G: Mapping and Predicting Commercial mmWave 5G Throughput,” in Proceedings of the ACM Internet Measurement Conference, 2020, pp. 176–193.
- [4] F. Michelinakis, A. S. Al-Selwi, M. Capuzzo, A. Zanella, K. Mahmood, and A. Elmokashfi, “Dissecting Energy Consumption of NB-IoT Devices Empirically,” IEEE Internet of Things Journal, vol. 8, no. 2, pp. 1224–1242, 2020.
- [5] 5G-HEART consortium, “D5.2: Initial Solution and Verification of Aquaculture Use Case Trials,” Tech. Rep., 2020.
- [6] “Vertical industry use cases and requirements in 5g-vinni.” [Online]. Available: http://www.6gsummit.com/wp-content/uploads/2019/04/Day2_Session9_Groensund_Telenor.pdf
- [7] A. Kaloxylos, A. Gavras, and R. De Peppe, “Empowering Vertical Industries through 5G Networks - Current Status and Future Trends,” Aug. 2020. [Online]. Available: https://doi.org/10.5281/zenodo.3698113
- [8] D. Pimienta-del Valle, L. Mendo, J. M. Riera, and P. Garcia-del Pino, “Indoor LOS Propagation Measurements and Modeling at 26, 32, and 39 GHz Millimeter-Wave Frequency Bands,” Electronics, vol. 9, no. 11, p. 1867, 2020.
- [9] M. Khalily, S. Taheri, S. Payami, M. Ghoraishi, and R. Tafazolli, “Indoor wideband directional millimeter wave channel measurements and analysis at 26 GHz, 32 GHz, and 39 GHz,” Transactions on Emerging Telecommunications Technologies, vol. 29, no. 10, p. e3311, 2018.
- [10] Z. Lin, X. Du, H.-H. Chen, B. Ai, Z. Chen, and D. Wu, “Millimeter-wave propagation modeling and measurements for 5G mobile networks,” IEEE Wireless Communications, vol. 26, no. 1, pp. 72–77, 2019.
- [11] X. Zhao, S. Li, Q. Wang, M. Wang, S. Sun, and W. Hong, “Channel measurements, modeling, simulation and validation at 32 GHz in outdoor microcells for 5G radio systems,” IEEE access, vol. 5, pp. 1062–1072, 2017.
- [12] J. Ko, Y.-J. Cho, S. Hur, T. Kim, J. Park, A. F. Molisch, K. Haneda, M. Peter, D.-J. Park, and D.-H. Cho, “Millimeter-wave channel measurements and analysis for statistical spatial channel model in in-building and urban environments at 28 GHz,” IEEE Transactions on Wireless Communications, vol. 16, no. 9, pp. 5853–5868, 2017.
- [13] S. Hur, H. Yu, J. Park, W. Roh, C. U. Bas, R. Wang, and A. F. Molisch, “Feasibility of mobility for millimeter-wave systems based on channel measurements,” IEEE Communications Magazine, vol. 56, no. 7, pp. 56–63, 2018.
- [14] P. Zhang, B. Yang, C. Yi, H. Wang, and X. You, “Measurement-Based 5G Millimeter-Wave Propagation Characterization in Vegetated Suburban Macrocell Environments,” IEEE Transactions on Antennas and Propagation, 2020.
- [15] C. U. Bas, R. Wang, S. Sangodoyin, S. Hur, K. Whang, J. Park, J. Zhang, and A. F. Molisch, “28 GHz microcell measurement campaign for residential environment,” in GLOBECOM 2017-2017 IEEE Global Communications Conference. IEEE, 2017, pp. 1–6.
- [16] J. Ko, Y.-S. Noh, Y.-C. Kim, S. Hur, S.-r. Yoon, D. Park, K. Whang, D.-J. Park, and D.-H. Cho, “28 GHz millimeter-wave measurements and models for signal attenuation in vegetated areas,” in 2017 11th European Conference on Antennas and Propagation (EUCAP). IEEE, 2017, pp. 1808–1812.
- [17] U. T. Virk and K. Haneda, “Modeling Human Blockage at 5G Millimeter-Wave Frequencies,” IEEE Transactions on Antennas and Propagation, vol. 68, no. 3, pp. 2256–2266, 2019.
- [18] A. Alammouri, J. Mo, B. L. Ng, J. C. Zhang, and J. G. Andrews, “Hand grip impact on 5G mmWave mobile devices,” IEEE Access, vol. 7, pp. 60 532–60 544, 2019.
- [19] J. Huang, Y. Cao, X. Raimundo, A. Cheema, and S. Salous, “Rain statistics investigation and rain attenuation modeling for millimeter wave short-range fixed links,” IEEE Access, vol. 7, pp. 156 110–156 120, 2019.
- [20] A. M. Al-Saman, M. Cheffena, M. Mohamed, M. H. Azmi, and Y. Ai, “Statistical Analysis of Rain at Millimeter Waves in Tropical Area,” IEEE Access, vol. 8, pp. 51 044–51 061, 2020.
- [21] R. Poorzare and A. Calveras, “Open trends on TCP performance over urban 5G mmwave networks,” in Proceedings of the 17th ACM Symposium on Performance Evaluation of Wireless Ad Hoc, Sensor, & Ubiquitous Networks, 2020, pp. 85–92.
- [22] R. Poorzare and A. C. Augé, “Challenges on the way of implementing TCP over 5G networks,” IEEE access, vol. 8, pp. 176 393–176 415, 2020.
- [23] M. Polese, R. Jana, and M. Zorzi, “TCP and MP-TCP in 5G mmWave networks,” IEEE Internet Computing, vol. 21, no. 5, pp. 12–19, 2017.
- [24] M. Polese, R. Jana, and M. Zorzi, “TCP in 5G mmWave networks: Link level retransmissions and MP-TCP,” in 2017 IEEE Conference on Computer Communications Workshops (INFOCOM WKSHPS). IEEE, 2017, pp. 343–348.
- [25] M. Zhang, M. Polese, M. Mezzavilla, J. Zhu, S. Rangan, S. Panwar, and M. Zorzi, “Will TCP work in mmWave 5G cellular networks?” IEEE Communications Magazine, vol. 57, no. 1, pp. 65–71, 2019.
- [26] Y. Ren, W. Yang, X. Zhou, H. Chen, and B. Liu, “A survey on TCP over mmWave,” Computer Communications, 2021.
- [27] Rohde & Schwarz, “Autonomous Mobile Network Scanner User Manual,” https://www.rohde-schwarz.com/cz/manual/r-s-tsma6-autonomous-mobile-network-scanner-user-manual-manuals-gb1_78701-572421.html, 2020, Accessed on: 2021-09-17.
- [28] NR; Physical layer measurements (Release 16), 3GPP, 3 2020, tS 38.215 V16.1.0.
- [29] 3GPP, “Technical Specification Group Radio Access Network; NR; User Equipment (UE) procedures in Idle mode and RRC Inactive state,” 3rd Generation Partnership Project (3GPP), Technical Specification (TS) 38.304, 12 2020, version 16.3.0. [Online]. Available: https://portal.3gpp.org/desktopmodules/Specifications/SpecificationDetails.aspx?specificationId=3192
- [30] A. Klautau, N. González-Prelcic, and R. W. Heath, “LIDAR data for deep learning-based mmWave beam-selection,” IEEE Wireless Communications Letters, vol. 8, no. 3, pp. 909–912, 2019.
- [31] J. Zhu, D. Li, H. Zhao, X. Wang, and R. Jiang, “Adaptive SVM-based Beam Allocation for MmWave Small Cell Networks,” in 2020 International Conference on Wireless Communications and Signal Processing (WCSP). IEEE, 2020, pp. 558–562.
- [32] 3GPP, “Study on channel model for frequencies from 0.5 to 100 GHz,” 3rd Generation Partnership Project (3GPP), Technical report (TR) 38.901, 01 2020, version 16.1.0. [Online]. Available: https://portal.3gpp.org/desktopmodules/Specifications/SpecificationDetails.aspx?specificationId=3173
- [33] H. M. Rahim, C. Y. Leow, T. Abd Rahman, A. Arsad, and M. A. Malek, “Foliage attenuation measurement at millimeter wave frequencies in tropical vegetation,” in 2017 IEEE 13th Malaysia International Conference on Communications (MICC). IEEE, 2017, pp. 241–246.
- [34] M. Lecci, M. Polese, C. Lai, J. Wang, C. Gentile, N. Golmie, and M. Zorzi, “Quasi-deterministic channel model for mmWaves: Mathematical formalization and validation,” in GLOBECOM 2020-2020 IEEE Global Communications Conference. IEEE, 2020, pp. 1–6.
- [35] N. Varshney, J. Wang, C. Lai, C. Gentile, R. Charbonnier, and Y. Corre, “Quasi-deterministic channel propagation model for an urban environment at 28 GHz,” IEEE Antennas and Wireless Propagation Letters, vol. 20, no. 7, pp. 1145–1149, 2021.
- [36] TSGR, “TR 138 900 - V14.2.0 - LTE; 5G; Study on channel model for frequency spectrum above 6 GHz (3GPP TR 38.900 version 14.2.0 Release 14),” 2017. [Online]. Available: https://portal.etsi.org/TB/ETSIDeliverableStatus.aspx
- [37] K. Haneda, J. Zhang, L. Tan, G. Liu, Y. Zheng, H. Asplund, J. Li, Y. Wang, D. Steer, C. Li et al., “5G 3GPP-like channel models for outdoor urban microcellular and macrocellular environments,” in 2016 IEEE 83rd vehicular technology conference (VTC spring). IEEE, 2016, pp. 1–7.
- [38] G. R. MacCartney, M. K. Samimi, and T. S. Rappaport, “Omnidirectional path loss models in New York City at 28 GHz and 73 GHz,” in 2014 IEEE 25th Annual International Symposium on Personal, Indoor, and Mobile Radio Communication (PIMRC). IEEE, 2014, pp. 227–231.
- [39] G. R. MacCartney and T. S. Rappaport, “Rural macrocell path loss models for millimeter wave wireless communications,” IEEE Journal on selected areas in communications, vol. 35, no. 7, pp. 1663–1677, 2017.
- [40] S. Sun, G. R. MacCartney, and T. S. Rappaport, “A novel millimeter-wave channel simulator and applications for 5G wireless communications,” in 2017 IEEE International Conference on Communications (ICC). IEEE, 2017, pp. 1–7.
- [41] S. Ju, O. Kanhere, Y. Xing, and T. S. Rappaport, “A millimeter-wave channel simulator NYUSIM with spatial consistency and human blockage,” in 2019 IEEE global communications conference (GLOBECOM). IEEE, 2019, pp. 1–6.