Certified Control: An Architecture for Verifiable Safety of Autonomous Vehicles
Abstract
Widespread adoption of autonomous cars will require greater confidence in their safety than is currently possible. Certified control is a new safety architecture whose goal is two-fold: to achieve a very high level of safety, and to provide a framework for justifiable confidence in that safety. The key idea is a runtime monitor that acts, along with sensor hardware and low-level control and actuators, as a small trusted base, ensuring the safety of the system as a whole.
Unfortunately, in current systems complex perception makes the verification even of a runtime monitor challenging. Unlike traditional runtime monitoring, therefore, a certified control monitor does not perform perception and analysis itself. Instead, the main controller assembles evidence that the proposed action is safe into a certificate that is then checked independently by the monitor. This exploits the classic gap between the costs of finding and checking. The controller is assigned the task of finding the certificate, and can thus use the most sophisticated algorithms available (including learning-enabled software); the monitor is assigned only the task of checking, and can thus run quickly and be smaller and formally verifiable.
This paper explains the key ideas of certified control and illustrates them with a certificate for LiDAR data and its formal verification. It shows how the architecture dramatically reduces the amount of code to be verified, providing an end-to-end safety analysis that would likely not be achievable in a traditional architecture.
1 Introduction
If autonomous cars are to become widespread, it will be necessary not only to ensure a high level of safety but also to justify our confidence that such a level has been achieved.
Formal verification seems essential, but cars typically make decisions using machine learning and complex algorithms, which are hard to verify. Rather than attempting to extend the range of verification techniques, this paper proposes certified control, a new architecture that allows existing techniques to be applied in this challenging setting.
The key idea is a variant on the traditional concept of the runtime monitor. Like a conventional monitor, the monitor checks actions proposed by the main controller before passing them on to the actuators; if an action is found to be unsafe, it is blocked or replaced by a safer action.
Unlike a conventional monitor, however, the monitor does not make this decision based on its own interpretation of the environment. Instead, it checks a certificate generated by the main controller that contains, in addition to the proposed action, explicit evidence that the action is safe. When the monitor approves the certificate, it has essentially ratified a runtime safety case.
The generation of the certificate is the responsibility of the main controller, and is a byproduct of its normal analysis. The form of the certificate, and the argument that a successful check ensures safety, are developed at design time.
Certified control exploits four powerful computer science ideas in a novel combination and context: (1) the gap between the complexities of finding vs. checking; (2) the idea of a small trusted base (here, the monitor and sensors and actuators) allowing a guarantee of safety without dependence on unreliable components outside the base (in particular the perception system); (3) the use of authentication (e.g., of sensor data) to guarantee safe transmission through an untrusted channel (namely the main perception/controller subsystems); and (4) the idea of end-to-end safety cases whose form is justified at design time, but which are applied on the fly.
The consequence of this design is that some essential safety guarantees that might have required a verification of the entire system can now be established with a verification of a much smaller part.
The contributions of this paper include: (1) A review of existing approaches to ensuring safety in critical systems; (2) A characterization of the demands on a runtime monitor in terms of three essential properties; (3) An argument that, for autonomous vehicles, the classic runtime monitor (or “safety controller” approach) is unlikely to satisfy all three properties, and is thus not ideal; (4) A new architecture, called certified control, that achieves the three properties; (5) An evaluation of the approach in an application to LiDAR-based obstacle detection, with empirical validation through a race car implementation and a formal verification; (6) An analysis of the potential and limitations of the approach.
The approach is also being applied to other forms of perception; the appendix describes certificates for lane-following that allow a similar reduction in complexity but have yet to be formally verified.
2 Background
The problem of safety for self-driving cars has two distinct aspects. First is the reality of numerous accidents, many fatal, either involving fully autonomous cars—such as the Uber that killed a pedestrian in Tempe, Arizona [44]—or cars with autonomous modes—such as the Tesla models, which have spawned a rash of social media postings in which owners have demonstrated the propensity of their own cars to repeat mistakes that had resulted in fatal accidents. The metric of “miles between disengagements,” made public for many companies by the California DMV [2], has revealed the troublingly small distance that autonomous cars are apparently able to travel without human intervention. Even if the disengagement metric is crude and includes disengagements that are not safety-related [12], the evidence suggests that the technology still has far to go.
Second, and distinct from the actual level of safety achieved, is the question of confidence. Our society’s willingness to adopt any new technology relies on our confidence that catastrophic failures are unlikely. But, even for the designs with the best records of safety to date, the number of miles traveled falls far short of the distance that would be required to provide statistical confidence of a failure rate that matches (or improves on) the failure rate of an unimpaired human driver. Even though Waymo, for example, claims to have covered 20 million miles—a truly impressive achievement—this still pales in comparison to the 275 million miles that would have to be driven for a 95% confidence that fully autonomous vehicles have a fatality rate lower than a human-driven car (one in 100 million miles) [23]. In fact, the problem is even worse, because the statistical evidence of few accidents given miles driven will be invalidated as soon as changes are made to the code.111Thank you to Ben Sherman for this astute and important observation.
2.1 An alternative to testing
Statistical testing is the gold standard for quality control for many products (such as pharmaceuticals) because it is independent of the process of design and development. This independence is also its greatest weakness, because it denies the designer the opportunity to use the structure of the artifact to bolster the safety claim, and at the same time fails to focus testing on the weakest points of the design, thus reducing the potency of testing for establishing near-zero likelihood of catastrophic outcomes.
One alternative to statistical testing is to construct a “safety case,” an argument for safety based on the structure of the design [45]. The quality of the argument and the extent to which experts are convinced then becomes the measure of confidence. This approach lacks the scientific basis of statistical testing, but is widely accepted in all areas of engineering, especially when the goal is to prevent catastrophe rather than a wider range of routine failures. For example, confidence that a new skyscraper will not fall down relies not on testing (since each design is unique, and non-destructive tests reveal little) but on analytical arguments for stability and resilience in the presence of anticipated forces. In the UK, the use of safety cases is mandated by a government standard [4] for critical systems such as nuclear power plants.
In software too, there is growing interest in safety cases (or, more generally, assurance or dependability cases) [22]. For a cyber-physical system, the safety case is an argument that a machine, in the context of its environment, meets certain critical requirements. This argument is a chain of many links, including: the specification of the software that controls the machine, the physical properties of the environment (including peripheral devices such as sensors and actuators that mediate between the machine and the environment), and assumptions about the behavior of human users and operators. Each link in the chain needs its own justification, and together they must imply the requirements. Ideally, the justification takes the form of a mathematical proof: in the case of software, for example, a verification proof that the code meets the specification. But some links will not be amenable to mathematical reasoning: properties of the environment, and of physical peripherals, for example, must be formulated and justified by expert inspection.
2.2 The Cost of Verification
For software-intensive systems, the software itself can become a problematic link in the chain. Complex systems require complex software, and that inevitably leads to subtle bugs. Because the state space of a software system is so large, statistical testing can only cover a tiny portion of the space, and thus cannot provide confidence in its correctness. So for high confidence, verification seems to be the only option.
Unfortunately, verification is prohibitively expensive. Even for software produced under a very rigorous process that does not involve verification, the cost tends to be orders of magnitude higher than for conventional software development. NASA’s flight software, for example, has cost over $1,000 per line of code, where conventional software might cost $10 to $50 per line [3]. Verifying a large codebase is a Herculean task. It may not be impossible, as demonstrated by the success of recent projects to verify an entire operating system kernel or file system stack. But it typically requires enormous manual effort. SEL4, a verified microkernel, for example, comprised about 10,000 lines of code, but required about 200,000 lines of hand-authored proof, whose production took about 25-30 person years of work [27].
For autonomous vehicles, the extensive use of machine learning makes it questionable whether verification is feasible at any cost (see Section 6 for some recent work on verifying neural networks).
2.3 Small trusted bases
One way to alleviate the cost of verification is to design the software system so that it has a small trusted base. The trusted base is the portion of the code on which the critical safety properties depend; any part of the system outside the trusted base can fail without compromising safety. This idea is exploited, for example, in secure transmission protocols that employ encryption (and is generalized in the “end-to-end principle” [41]). So long as the encryption and decryption algorithms that execute at the endpoints are correct, one can be sure that message contents are not corrupted or leaked; the network components that handle the actual transmission, in particular, need not be secure, because any component that lacks access to the appropriate cryptographic keys cannot expose the contents of messages or modify them without the alteration being detectable.
Of course, the claim that some subset of the components of a system form a trusted base—really that the other components fall outside the trusted base—must itself be justified in the safety case. It must be shown not only that the properties established by the trusted base are sufficient to ensure the desired end-to-end safety properties, but also that the trusted base is immune to external interference that might cause it to fail (a property often achieved by using separation mechanisms to isolate the trusted base).
2.4 Runtime monitors and safety controllers
One widely-used approach is to augment the system with a runtime monitor that checks (and enforces) a critical safety property. If isolated appropriately, and if the check is sufficient to ensure safety, the monitor serves as a trusted base.
For safety-critical systems, the runtime monitor might be an entire controller in its own right. This “safety controller” oversees the behavior of the main controller, and takes over when it fails. If the safety controller is simpler than the main controller, it serves as a small trusted base (along with whatever arbiter is used to ensure that it can veto the main controller’s outputs). This scheme is used in the Boeing 777, which runs a complex controller that can deliver highly optimized behavior over a wide range of conditions, but at the same time runs a secondary controller based on the control laws of the 747, ensuring that the aircraft flies within the envelope of the earlier (and simpler) design [46].
The Simplex architecture ([15, 32]) embodies this idea in a general form. Two control subsystems are run in parallel. The high assurance subsystem is meticulously developed with conservative technologies; the high performance subsystem may be more complex, and can use technologies that are hard to verify (such as neural nets). The designer identifies a safe region of states that are within the operating constraints of the system and which exclude unsafe outcomes (such as collisions). A smaller subset of these states, known as the recovery region is then defined as those states from which the high assurance subsystem can always recover control and remain within the safe region. The boundary of the recovery region is then used as the switching condition between the two subsystems.
2.5 The problem of perception in autonomous cars
The safety controller approach relies on the assumption that the controller itself is the most complex part of the system—that from the safety case point of view, the correctness of the controller is the weakest link in the argument chain. But in the context of autonomous cars, perception—the interpretation of sensor data—is more complicated and error-prone than control. In particular, determining the layout of the road and the presence of obstacles typically uses vision systems that employ large and unverified neural nets.
In standard safety controller architectures (such as Simplex [15, 32]), only the controller itself has a safety counterpart; even if sensors are replicated to exploit some hardware redundancy, the conversion of raw sensor data into controller inputs is performed externally to the safety controller, and thus belongs to the trusted base.
This means that the safety case must include a convincing argument that this conversion, performed by the perception subsystem, is performed correctly. This is a formidable task for at least two reasons. First, there is no clear specification against which to verify the implementation. Machine learning is used for perception precisely because no succinct, explicit articulation of the expected input/output relationship is readily available. Second, state of the art verification technology cannot handle the particular complications of deep neural networks—especially their scale and use of non-linear activation functions (such as ReLU [35]) which confound automated reasoning algorithms such as SMT and linear programming [39].
An alternative possibility is to not include perception functions in the trusted base. Instead, one could perhaps use a runtime monitor that incorporates both a safety controller and a simplified perception subsystem. Initially, this approach seemed attractive to us, but we came to the conclusion that it was not in fact viable. In the next section we explain why.
2.6 Desiderata for a runtime monitor: choose two
To see why a runtime monitor that employs simplified perception is not a solution to the safety problem for autonomous cars, we shall enumerate three critical properties that a monitor should obey, and argue that—in this context–they are mutually inconsistent for the conventional design.
The first property is that the monitor should be verifiable. That is, it should be small and simple enough to be amenable to formal verification (or to exhaustive testing). If not, the monitor brings no significant benefit in terms of confidence in the overall system safety (beyond the diversity of an additional implementation, which contributes less confidence than is often assumed [32]).
The second property is that the monitor should be tolerant. It should intervene only when necessary, namely when proceeding with the action proposed by the main controller would be a safety risk. Applying emergency braking on a highway when there is no obstacle, for example, is clearly unacceptable. Even handing over control to a human driver is problematic, due to vigilance decrement [21].
The third property is that the monitor should be sensitive. This means that it should ensure the safety of the vehicle within an envelope that covers a wide range of typical conditions. It is not sufficient, for example, for the monitor to merely reduce the severity of a collision when it might have been able to avert the collision entirely.
Unfortunately, it seems that these three properties cannot be achieved simultaneously in a classic monitor design. The problem, in short, is that the combination of tolerance and sensitivity requires a sophisticated perception system, leading to unverifiable complexity. It is easy to make a monitor that is sensitive but not tolerant simply by not allowing the vehicle to move; and conversely it is easy to make one that is tolerant but not sensitive by not preventing any collisions at all. Achieving both at once, however, seems inevitably to require a complex and potentially unverifiable perception component.
As a sneak preview of an example discussed in more detail later, consider a monitor that detects obstacles with LiDAR, filtering out nearby reflections of snow by using an algorithm to distinguish snow flakes from real obstacles. Using such an algorithm challenges verifiability; not using it likely either violates tolerance (if snowflakes are treated as obstacles) or sensitivity (if a cruder algorithm is used that filters out not only snowflakes but also genuine obstacles). For monitors that involve vision (as explained in the appendix), the problem is exacerbated yet further, since neural nets are generally required.
This does not mean that monitors that fail to satisfy these three properties are not useful—only that such monitors are not sufficient to ensure safety. Automatic emergency braking (AEB) systems are deployed in many cars now, and use radar to determine when a car in front is so close that braking is essential. But because AEB might brake too late to prevent a collision, it is not generally sensitive. Responsibility-Sensitive Safety systems [42], on the other hand, use the car’s full sensory perception systems to identify and locate other cars and pedestrians, and can therefore be both tolerant and sensitive, but due to the complexity of the perception are not likely to be verifiable.
3 Certified Control: A New Approach
Certified control (see Fig. 3 in Appendix 0.A) is a new architecture that centers on a different kind of monitor. As with a conventional safety architecture, a monitor vets proposed actions emanating from the main controller. But the certified control monitor does not check actions against its own perception of the environment.
Instead, it relies on the main perception and control subsystems to provide a certificate that embodies evidence that the situation is safe for the action at hand. The certificate is designed to be unforgeable, so that even a malicious agent could not convince the monitor that an unsafe situation is safe. The evidence comprises sensor readings that have been selected to support a safety case in favor of the proposed action; because these sensor readings are only selected by the main perception and control subsystems (and are signed by the sensor units that produced them), they cannot be faked.
A certificate contains the following elements: (1) the proposed action (for example, driving ahead at the current speed); (2) some signed sensor data (for example, a set of LiDAR points or a camera image); (3) optionally, some interpretive data. This data indicates what inference should be drawn from the sensor readings. For example, if the sensor data comprises LiDAR points intended as evidence that the nearest obstacle is at least some distance away, the interpretive data might be that distance; if the sensor data is an image of the road ahead, the interpretive data might be the purported lane lines.
The evidence and interpretive data are evaluated by the certificate checker using a predefined runtime safety case. As an example, consider a certificate that proposes the action to continue to drive ahead using LiDAR data. In this case, the LiDAR points argue that there is no obstacle along the path; each LiDAR reading provides direct physical evidence of an uninterrupted line from the LiDAR unit to the point of reflection. Together, a collection of such readings, covering the cross section of the path ahead with appropriate density, indicates absence of an obstacle larger than a certain size.
Compare this with a classic monitor that interprets the LiDAR unit’s output itself. The LiDAR point cloud is likely to include points that should be filtered out. In snow, for example, there will be reflections from snowflakes. Performing snow filtering would introduce complexity and likely render the monitor unverifiable. On the other hand, a simple monitor would not attempt to identify snow, and could set a low or a high bar on intervention—requiring, say, that 10% or 90% of points in the LiDAR point cloud show reflections within some critical distance. The low bar would result in a monitor that violates sensitivity, failing, for example, to prevent collision with a motorcycle whose cross section occludes less than the 10% of points. The high bar would result in a monitor that violates tolerance, since it would likely cause an intervention due to snow even when the road ahead is empty of traffic.
In contrast, the certified control monitor does not suffer from these problems, and can achieve verifiability, tolerance and sensitivity together. It should be noted that certified control does not remove the sensor and actuator units from the trusted base. What is removed is the main perception and controller subsystems, which crucially include complex algorithms that process and interpret sensor readings.
4 A Case Study
We conducted a case study to evaluate the certified control architecture, with three research questions in mind:
-
1.
RQ1: Is it possible even to build a system based on certified control in the context of an autonomous car that has plausible behavior, demonstrating a reasonable combination of tolerance and sensitivity?
-
2.
RQ2: What reduction in the trusted base is achievable by following this strategy?
-
3.
RQ3: Is the resulting runtime monitor that checks certificates potentially verifiable?
To answer these questions, we designed and implemented certificates for three separate monitors: (1) the example alluded to above, in which a certificate captures the result of LiDAR snow filtering; (2) a scheme for checking the result of a visual lane detection algorithm; (3) an augmented version of the lane detection example that combines both visual and LiDAR data to ensure that the purported lane lines lie on the ground plane. Only the first of these is discussed in detail in this paper; the other two are discussed at length in the appendix.
In each case, we ran tests using a 1/10th model racecar to explore the performance of the monitors. In the first case, we verified the code of the monitor and showed that it implies the desired safety property. We have not yet verified the implementations of the other two monitors, although we have measured the reduction in the size of the trusted base, which shows reassuring results.
5 A LiDAR Certificate for Snow Filtering
Our primary example is a certificate based on LiDAR evidence that allows the car to continue ahead, with the certificate providing evidence that there is no obstacle within the car’s stopping distance.
Our controller implements radius outlier removal (ROR) filtering [13] to identify LiDAR points that correspond to reflections off snowflakes. The controller preprocesses the LiDAR point cloud into a k-dimensional tree to query for nearest neighbor information. Points with few neighbors relative to the average neighborhoods are labeled as snow. The controller then constructs the certificate omitting those snow points.
The certificate includes all the parameters needed to establish the safety of continuing ahead in lane. (Determining where the lane actually lies is a separate problem; see Appendix 0.C for details of a certificate scheme for that.) These parameters, along with the precise specification of the certificate check, are defined in Appendix 0.B. Informally, the parameters include:
-
•
An array of arrays of LiDAR points, correspond to horizontal rows;
-
•
An array of row heights, corresponding roughly to the heights of the points in each row;
-
•
Boundaries of a rectangle representing the cross section of the lane, specified as leftmost and rightmost positions on the x-axis (which runs left to right), and top and bottom positions on the y-axis (which runs top to bottom);
-
•
The stopping distance at the current velocity222Our current implementation assumes the car is traveling at its maximum speed. We did this because our race car does not provide sufficiently accurate velocity measurements. Extending to arbitrary velocity is straightforward.;
-
•
Constants representing maximum allowed spacing between points in the same row horizontally, between rows vertically, and vertically between the points in a row and the rows’s purported height.
The monitor checks three key properties:
-
•
Distance: Every point is no closer than the minimum stopping distance.
-
•
Spread: The first and last points within each row are within the maximum allowed horizontal spacing of the leftmost and rightmost lane rectangle boundaries, and the row heights likewise span from the top to the bottom;
-
•
Density: Contiguous points333Since the LiDAR points represent reflections at different distances, they are first projected onto a perpendicular plane at the stopping distance. within a row are within the maximum allowed horizontal spacing; contiguous elements in the row height array are within the maximum vertical spacing; and the points within a row deviate from the row’s height by less than the maximum permitted amount.
The key elements of the safety argument are (a) the correctness of the monitor (namely that its code checks the certificate correctly); and (b) that the certificate properties imply the safety requirement. This latter argument is as follows: given the maximum spacing between points vertically (the sum of the maximum row spacing and height deviation of points within a row) and the maximum spacing of points horizontally, it follows that any obstacle taller and wider than those spacings cannot be closer than the stopping distance. This argument was formalized and checked using the SMT solver Z3, for LiDAR point arrows containing up to 100 points, and is detailed in Appendix 0.B.
5.1 Experimental Evaluation
The primary experimentation platform was a 1/10-scale remote-controlled car, outfitted with a Velodyne Puck VLP16 LiDAR scanner, a camera, and a CPU running Linux with ROS. Python2 implementations of a controller and interlock are loaded onto the car and executed in real time. We manipulated the car’s environment to reflect various road conditions using props, like confetti for snow. The complete source code for our experimental implementations is publicly available; a URL will be provided after blind review.
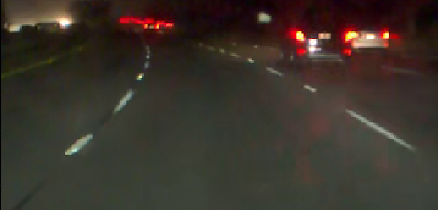
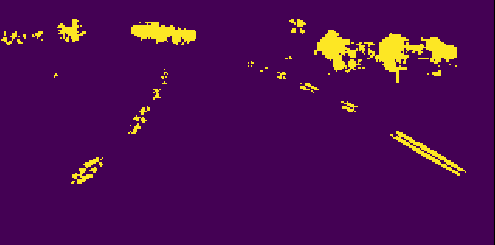
To address RQ1, we tested our monitor’s performance in simulated snowy conditions by dropping confetti-like paper in front of the robot car and confirming that the monitor accepts a certificate when there is sufficient space between the car and an obstacle ahead, despite the presence of simulated snow (Fig. 1).
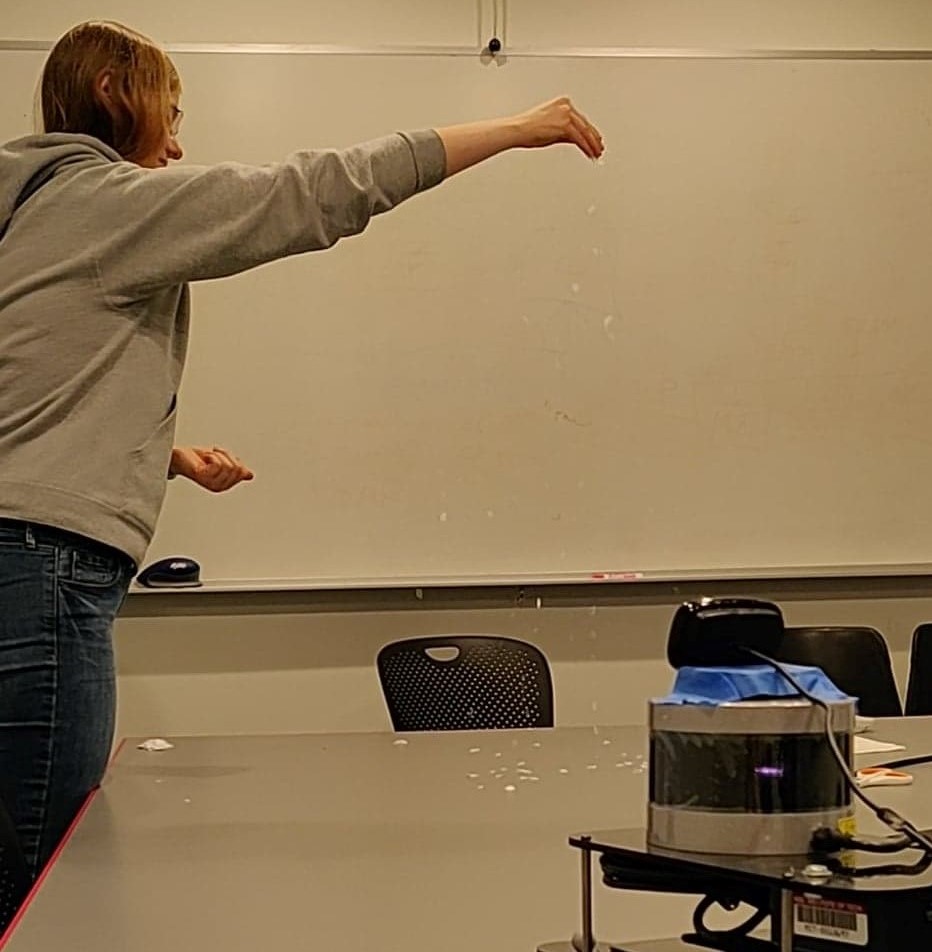
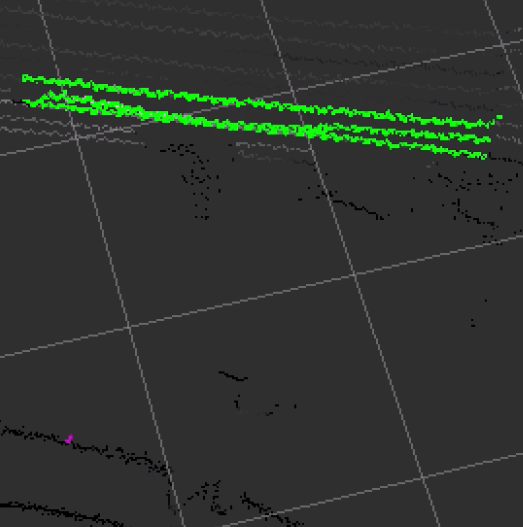
Indeed, when the controller’s filtering parameters are set appropriately444See Section 7.1, it properly identifies points as snow and passes a certificate excluding them to the monitor. Assuming snow is distributed fairly evenly across the lane ahead (and there is not a total “white out”) the remaining points are still sufficiently dense to establish absence of an obstacle in the lane ahead.
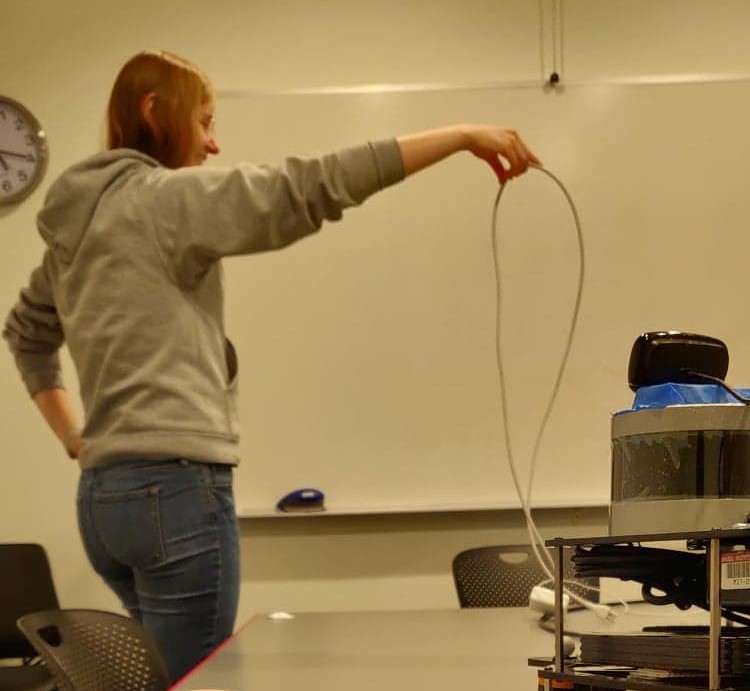
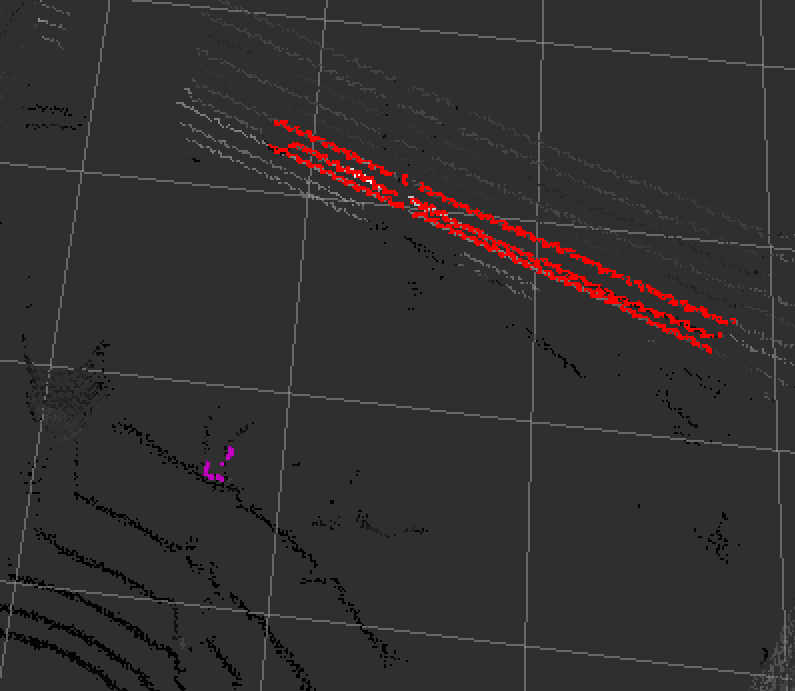
This establishes some sensitivity of the system. We also tested the converse case, to establish reasonable tolerance. To demonstrate that the monitor would detect obstacles even when the controller fails to do so, we modified the controller so that it would erroneously filter out some sparse but significant obstacles, such as fallen tree branches (simulated, for our robot car, with plastic cables). As expected, since the controller omits points on the obstacle from its certificate, the monitor’s horizontal density check fails, the certificate is rejected, and the unsafe action is prevented (Fig 1).
To answer RQ2, we measured the size of the various modules of the codebase, comparing in particular the size of the monitor itself (the crucial component of the trusted base) with the size of the controller functions that are used to generate the certificate (and which are not part of the trusted base).
Our results (Fig. 2) show that, even with a controller performing only basic snow filtering—with no machine learning algorithms—the controller implementation required almost 70 times as many lines of non-comment code as the monitor itself (Fig. 2).
| Component | Lines of Code |
|---|---|
| LiDAR Monitor Total | 32 |
| K-d tree library | 739 |
| Numpy library | 1325 |
| Certificate generation | 98 |
| LiDAR Controller Total | 2162 |
Finally, to address RQ3, we formally verified the monitor code, constructing a Hoare-style proof by hand (Appendix 0.B). Since the code follows the specification very closely, the only (minor) complication is the need for loop invariants.
Although the main complexity gap is due to the snow filtering, more subtle aspects of how the certificate is defined have an impact too. In our initial implementation777The racecar experiments were performed with this version of the code; the second version is functionally indistinguishable since it just moves the boundary between the controller and the monitor., the points in the certificate were not sorted, and the row heights array was not given. This meant that the monitor had to sort the points, and keep track of the maximum and minimum heights of points within each row. Neither involves much code complexity, but by tightening the specification of the certificate so that the monitor can refrain from these additional computations, its complexity was reduced even further and verification became nearly trivial.
Note that also, importantly, by removing sorting from the monitor, we remove from the trusted base Python’s built-in sorting function, which due to its generality and efficiency is non-trivial (and is not counted in the lines of code in the table, so the benefit of certified control is actually better than the table suggests).
5.2 Limitations
The primary limitation of the LiDAR certificate is that it provides information only about the shape and size of obstacles888LiDAR sensors also provide information about reflectivity; however this information is not leveraged in our system and is not thought to be critical to obstacle detection., yet objects with the same shape and size may present varying degrees of danger. A paper bag, for example, could occlude the same region of points in a LiDAR certificate as a falling rock. Our monitor cannot distinguish between certificates with these same-sized holes.
Another problem is that the certificate only establishes absence of obstacles that have both a minimum width and height. A valid certificate could be constructed in the presence of a tall but very skinny object, for example or an inclined one.
These limitations are not limitations of certified control itself, however. If the designer were to devise a scheme for detecting a wider range of obstacles, an argument for the scheme’s soundness would presumably be translatable into a certificate. If not, this would cast some doubt on the scheme itself because it would mean that its judgments cannot be straightforwardly justified by concrete evidence.
Another limitation arises from the non-uniformity of the LiDAR data itself. Our LiDAR unit performs its horizontal scans at fixed vertical positions. This means that it is not possible to reduce the vertical spacing to discriminate obstacles at a greater distance from the car. Consequently, thin horizontal obstacles are more problematic than thin vertical obstacles. Again, this is not a problem with certified control itself.
It is important to note that none of these limitations affect the credibility of the safety property. Rather, they weaken the safety property itself. Certified control still guarantees that the properties checked by the monitor hold; the limitations involve the implications of those properties for the safety requirement in the physical environment.
6 Related Work
The literature on safety assurance of vehicle dynamics splits roughly into two camps, both of which focus on assurance of the planning/control system, and assume perception is assured by some other mechanism.
One focuses on numerical analysis of reachable states. For example, reachable set computations can justify conflict resolution algorithms that safely allocate disjoint road areas to traffic participants [33]. The other focuses on deductive proofs of safety. The work of [31] models cars with double integrator dynamics, and uses the theorem prover KeYmaera to prove safety of a highway scenario, including lane changing, with arbitrarily many lanes and arbitrarily many vehicles. The work of [7, 8] demonstrates how these safety constraints can be used for verification and synthesis of control policies, including control policies with switching. In [30], the authors develop safety contracts that include intersections, and provide KeYmaera proofs to demonstrate safety.
Responsibility-Sensitive Safety (RSS) [42] is a framework that assigns responsibility for safety maneuvers, and ensures that if every traffic participant meets its responsibilities, no accident will occur. The monitoring of these conditions is conducted as the last phase of planning, and is not separated out as a trusted base. The RSS safety criteria have been explored more formally to boost confidence in their validity [28].
All of these works focus on control, and assume that the perception system is reliable. In contrast, certified control takes the perception subsystem out of the trusted base. Nevertheless, these approaches are synergistic with ours. In our design, the low-level controller is still within the trusted base and would benefit from verification. RSS provides more sophisticated runtime criteria than those we have considered that could be incorporated into certificates (e.g., for avoiding the risk of collisions with traffic crossing at an intersection).
Several approaches aim, like ours, to establish safety using some kind of monitor. The Simplex Architecture [32, 37], described above, uses two controllers: a verified safety controller and a performance controller. When safety-critical situations are detected, the system switches to the verified controller, but otherwise operates under the performance controller. [38] extends Simplex to neural network-based controllers. As we noted, this approach does not address flaws in perception. In contrast, reasonableness monitors [20, 19] defend against flawed perception by translating the output of a perception system into relational properties drawn from an ontology that can be checked against reasonableness constraints. This ensures that the perception system does not make nonsensical inferences, such as mailboxes crossing the street, but aims for a less complete safety case than certified control. Similarly, the work of [26] seeks to explain perception results by analyzing regions of an image that influence the perception result. These techniques may be useful to enable the perception system to present pixel regions to the safety monitor as evidence of a correct prediction.
Other techniques seek to use the safety specifications to automatically stress test the implementation [29, 40, 14]. A different approach checks runtime scenarios dynamically against previously executed test suites, generating warnings when the car strays beyond the envelope implicitly defined by those tests [34]. Certified control is similar in that the certificate criteria represent the operational envelope considered by the designers, and outside that envelope, it will likely not be possible to generate a valid certificate, leading to a safety intervention.
Assurance of perception systems needs to grapple with two key challenges. The first is the difficulty of determining appropriate specifications for perception systems, and the second is with developing scalable reasoning techniques to ensure that the implementation satisfies its specifications. Reasonableness monitors provide a partial answer to the first. The second is an active area of research: [25], [17], and [24], for example, develop efficient techniques to prove that a deep neural network satisfies a logical specification. While these technologies are promising, their applicability to industrial-scale applications has not yet been demonstrated. Perception is a particularly thorny problem, since it is not clear what properties of a perception system one would want to formally verify.
7 Conclusions
To conclude, we highlight some of the key benefits of the approach, explain why some concerns are not flaws, and discuss some limitations, fundamental and minor.
7.1 Benefits and Non-Concerns
The key benefit of certified control is that safety checks that can be performed in conventional architectures but which, until now, have not been regarded as verifiable, can potentially now be verified.
The essence of the scheme is not a change in functionality; indeed, the kinds of checks embodied by our monitors are not especially novel. What is important is the organization of the functionality, and the concomitant reduction of the trusted base.
Some readers may be concerned that our safety guarantees are not absolute. The LiDAR certificate, for example, relies on certain arbitrary thresholds that impact the size of obstacles that will be detected. We do not regard this as a flaw, because such tradeoffs are inevitable in setting safety bounds for a complex system. Indeed, the merit of certified control is that it can accommodate whatever thresholds the designer deems appropriate (which might eventually include probabilistic judgments).
One significant difference between a certified control monitor and a conventional monitor is that the former may trigger a safety intervention when the proposed action is in fact safe, because of a bug in the controller that causes it to fail to generate a good certificate. On the one hand, it seems reasonable to prevent the car from proceeding when its code has failed (and indeed, this is routine practice when runtime assertions fail in critical systems999The immediate cause of the Ariane-5 disaster was an operand error that caused the inertial guidance system to shutdown; whether or not the flight would have succeeded had this error been ignored is not certain.. On the other hand, we must admit that it becomes more problematic when safety interventions are themselves risky.
7.2 Essential Limitations
Certified control has some essential limitations, which we now analyze.
Justifiable design. Our most fundamental assumption is that the design of the main controller can be justified by a logical safety case. Prior to the recent advances in machine learning, this would have been uncontroversial: after all, it seems reasonable to insist that any designer should be able to explain why their system works. In contrast, end-to-end machine learning [11] connects sensors to actuators through a single network. While exciting, the dangers of this approach are clear, since behavior may be unpredictable in scenarios not covered by training data (or in the presence of adversarial attacks [36]).
Checking end-to-end safety. The checking of the certificate is intended to establish an end-to-end safety case; for example, a subset of LiDAR points is taken as evidence of absence of an obstacle allowing the car to continue ahead. This contrasts with a sanity check approach that relies on a more ad hoc collection of partial (and even internal) checks. The problem with our approach is that it is more burdensome to implement; its advantage is that it gives greater confidence, since it is possible for a failing controller to pass a collection of sanity checks. Of course, a wise designer would include sanity checks (for example as runtime assertions) in any case.
Dynamic checking. We assume that it is possible to check safety at runtime by executing a predicate on a certificate comprising sensor data and its interpretation. This may not be possible if the main controller uses algorithms whose correctness on an execution cannot be effectively checked, because the gap between finding and checking is small. For example, when an algorithm that decides whether two graphs are isomorphic returns “no” it seems that checking the answer would require enumerating all candidate mappings between the graphs. But even in such cases Blum has shown that probabilistic checks can provide arbitrarily high degrees of confidence [10].
7.3 Non-essential Limitations
Less essential aspects that suggest further work are:
Time independence. In the current design, each certificate is evaluated independently. In practice, the controller would present a certificate in every controller cycle, and the checking of the certificates would accumulate evidence across frames. This would allow lane lines still to be inferred even though they are periodically obscured by other vehicles.
Determinism. A related limitation is that certificates are currently interpreted deterministically. In practice, it would obviously be desirable to introduce a probabilistic component. For example, a LiDAR certificate might allow areas of insufficient density so long as they do not occur systematically in subsequent frames.
Single sensor. Currently, certificates contain readings from the sensors used by the main controller. An alternative scheme would allow the monitor to obtain sensor readings from an additional sensor of its own. This need not compromise the essential idea that the monitor does not include the interpretation algorithms. For example, a LiDAR-based certificate, instead of including actual signed LiDAR points, might include LiDAR coordinates that tell the monitor where to look to obtain the relevant points.
References
- [1] Tesla Autopilot Drives Straight Towards Concrete Barrier on Highway
- [2] Testing of Autonomous Vehicles. https://www.dmv.ca.gov/portal/dmv/detail/vr/autonomous/testing
- [3] They Write the Right Stuff. https://www.fastcompany.com/28121/they-write-right-stuff
- [4] Safety Management Requirements for Defence Systems: Part 2: Guidance on Establishing a Means of Complying with Part I”. Tech. rep., UK Ministry of Defense (2007)
- [5] Comma AI Driving Dataset. https://github.com/commaai/comma2k19 (Apr 2020)
- [6] Comma AI OpenPilot Software. https://github.com/commaai/openpilot (Apr 2020)
- [7] Arechiga, N., Loos, S.M., Platzer, A., Krogh, B.H.: Using theorem provers to guarantee closed-loop system properties. In: 2012 American Control Conference (ACC). pp. 3573–3580. IEEE, Montreal, QC (Jun 2012)
- [8] Arechiga, N., Krogh, B.H.: Using verified control envelopes for safe controller design. In: American Control Conference (2014)
- [9] Bhargavan, K., Fournet, C., Corin, R., Zălinescu, E.: Verified cryptographic implementations for tls. ACM Trans. Inf. Syst. Secur. 15(1) (Mar 2012). https://doi.org/10.1145/2133375.2133378, https://doi.org/10.1145/2133375.2133378
- [10] Blum, M., Kannan, S.: Designing Programs that Check Their Work. Journal of the ACM (1995)
- [11] Bojarski, M., Del Testa, D., Dworakowski, D., Firner, B., Flepp, B., Goyal, P., Jackel, L.D., Monfort, M., Muller, U., Zhang, J., Zhang, X., Zhao, J., Zieba, K.: End to End Learning for Self-Driving Cars. arXiv:1604.07316 [cs] (Apr 2016)
- [12] Cameron, O.: The Driverless Readiness Score. https://olivercameron.substack.com/p/the-driverless-readiness-score, library Catalog: olivercameron.substack.com
- [13] Charron, N., Phillips, S., Waslander, S.L.: De-noising of Lidar Point Clouds Corrupted by Snowfall. In: Computer and Robotic Vision (2018)
- [14] Corso, A., Du, P., Driggs-Campbell, K., Kochenderfer, M.J.: Adaptive Stress Testing with Reward Augmentation for Autonomous Vehicle Validation. In: IEEE Intelligent Transportation Systems Conference (2019)
- [15] Crenshaw, T.L., Gunter, E., Robinson, C.L., Sha, L., Kumar, P.R.: The simplex reference model: Limiting fault- propagation due to unreliable components in cyber-physical system architectures. In: IEEE International Real-Time Systems Symposium (2007)
- [16] De Moura, L., Bjørner, N.: Z3: An efficient smt solver. In: Proceedings of the Theory and Practice of Software, 14th International Conference on Tools and Algorithms for the Construction and Analysis of Systems. p. 337–340. TACAS’08/ETAPS’08, Springer-Verlag, Berlin, Heidelberg (2008)
- [17] Ehlers, R.: Formal Verification of Piece-Wise Linear Feed-Forward Neural Networks. arXiv:1705.01320 [cs] (Aug 2017)
- [18] Fischler, M.A., Bolles, R.C.: Random sample consensus: A paradigm for model fitting with applications to image analysis and automated cartography. Communications of the ACM (1981)
- [19] Gilpin, L.H.: Reasonableness Monitors. AAAI (2018)
- [20] Gilpin, L.H., Macbeth, J.C.: Monitoring Scene Understanders with Conceptual Primitive Decomposition and Commonsense Knowledge. Advances in Cognitive Systems p. 20 (2018)
- [21] Greenlee, E.T., DeLucia, P., Newton, D.C.: Driver Vigilance in Automated Vehicles: Hazard Detection Failures Are a Matter of Time. Human Factors (2018)
- [22] Jackson, D., Thomas, M., Millett, L.I. (eds.): Software for Dependable Systems: Sufficient Evidence? National Research Council (2007)
- [23] Kalra, N., Paddock, S.M.: Driving to Safety: How Many Miles of Driving Would It Take to Demonstrate Autonomous Vehicle Reliability? Tech. Rep. RAND RR-1478-RC, RAND Corporation (2016)
- [24] Katz, G., et. al.: The Marabou Framework for Verification and Analysis of Deep Neural Networks. In: Dillig, I., Tasiran, S. (eds.) Computer Aided Verification, vol. 11561, pp. 443–452. Springer International Publishing, Cham (2019), series Title: Lecture Notes in Computer Science
- [25] Katz, G., Barrett, C., Dill, D., Julian, K., Kochenderfer, M.: Reluplex: An Efficient SMT Solver for Verifying Deep Neural Networks. arXiv:1702.01135 [cs] (May 2017)
- [26] Kim, J., Canny, J.: Interpretable Learning for Self-Driving Cars by Visualizing Causal Attention. In: 2017 IEEE International Conference on Computer Vision (ICCV). pp. 2961–2969. IEEE, Venice (Oct 2017)
- [27] Klein, G., et. al.: seL4: Formal verification of an OS kernel. In: Proceedings of the ACM SIGOPS 22nd Symposium on Operating Systems Principles - SOSP ’09. p. 207. ACM Press, Big Sky, Montana, USA (2009)
- [28] Koopman, P., Osyk, B., Weast, J.: Autonomous Vehicles Meet the Physical World: RSS, Variability, Uncertainty, and Proving Safety. In: Romanovsky, A., Troubitsyna, E., Bitsch, F. (eds.) Computer Safety, Reliability, and Security, vol. 11698, pp. 245–253. Springer International Publishing, Cham (2019), series Title: Lecture Notes in Computer Science
- [29] Koren, M., Alsaif, S., Lee, R., Kochenderfer, M.J.: Adaptive stress testing for autonomous vehicles. In: IEEE Intelligent Vehicles Symposium (2018)
- [30] Loos, S.M., Platzer, A.: Safe intersections: At the crossing of hybrid systems and verification. In: 2011 14th International IEEE Conference on Intelligent Transportation Systems (ITSC). pp. 1181–1186. IEEE, Washington, DC, USA (Oct 2011)
- [31] Loos, S.M., Platzer, A., Nistor, L.: Adaptive Cruise Control: Hybrid, Distributed, and Now Formally Verified. In: Butler, M., Schulte, W. (eds.) FM 2011: Formal Methods, vol. 6664, pp. 42–56. Springer Berlin Heidelberg, Berlin, Heidelberg (2011), series Title: Lecture Notes in Computer Science
- [32] Lui Sha: Using simplicity to control complexity. IEEE Software 18(4), 20–28 (Jul 2001)
- [33] Manzinger, S., Althoff, M.: Tactical Decision Making for Cooperative Vehicles Using Reachable Sets. In: 2018 21st International Conference on Intelligent Transportation Systems (ITSC). pp. 444–451. IEEE, Maui, HI (Nov 2018)
- [34] Mauritz, M., Howar, F., Rausch, A.: Assuring the Safety of Advanced Driver Assistance Systems Through a Combination of Simulation and Runtime Monitoring. In: Margaria, T., Steffen, B. (eds.) Leveraging Applications of Formal Methods, Verification and Validation: Discussion, Dissemination, Applications, vol. 9953, pp. 672–687. Springer International Publishing, Cham (2016), series Title: Lecture Notes in Computer Science
- [35] Nair, V., Hinton, G.E.: Rectified Linear Units Improve Restricted Boltzmann Machines. In: International Conference on Machine Learning. p. 8 (2010)
- [36] Papernot, N., McDaniel, P., Goodfellow, I., Jha, S., Celik, Z.B., Swami, A.: Practical Black-Box Attacks against Machine Learning. Asia Conference on Computer Science and Security (Mar 2017)
- [37] Phan, D., et. al.: A Component-Based Simplex Architecture for High-Assurance Cyber-Physical Systems. 2017 17th International Conference on Application of Concurrency to System Design (ACSD) pp. 49–58 (Jun 2017)
- [38] Phan, D.T., Grosu, R., Jansen, N., Paoletti, N., Smolka, S.A., Stoller, S.D.: Neural Simplex Architecture. arXiv:1908.00528 [cs, eess] (Mar 2020)
- [39] Pulina, L., Tacchella, A.: Challenging SMT solvers to verify neural networks. AI Communications 25(2), 117–135 (2012)
- [40] Qin, X., Aréchiga, N., Best, A., Deshmukh, J.: Automatic Testing and Falsification with Dynamically Constrained Reinforcement Learning. arXiv:1910.13645 [cs, eess] (Feb 2020)
- [41] Saltzer, J.H., Reed, D.P., Clark, D.D.: End-to-end arguments in system design. ACM Transactions on Computer Systems (TOCS) 2(4), 277–288 (Nov 1984)
- [42] Shalev-Shwartz, S., Shammah, S., Shashua, A.: On a Formal Model of Safe and Scalable Self-driving Cars. arXiv:1708.06374 [cs, stat] (Oct 2018)
- [43] Stein, W.J., Neuman, T.R.: Mitigation strategies for design exceptions. Tech. rep., United States. Federal Highway Administration. Office of Safety (2007)
- [44] Wakabayashi, D.: Self-Driving Uber Car Kills Pedestrian in Arizona, Where Robots Roam. The New York Times (Mar 2018)
- [45] Weinstock, C.B., Goodenough, J.B., Hudak, J.J.: Dependability Cases. Tech. Rep. CMU/SEI-2004-TN-016, CMU Software Engineering Institute (2004)
- [46] Yeh, Y.C.: Dependability of the 777 Primary Flight Control System. In: Dependable Computing for Critical Applications (1998)
Appendix 0.A Architecture
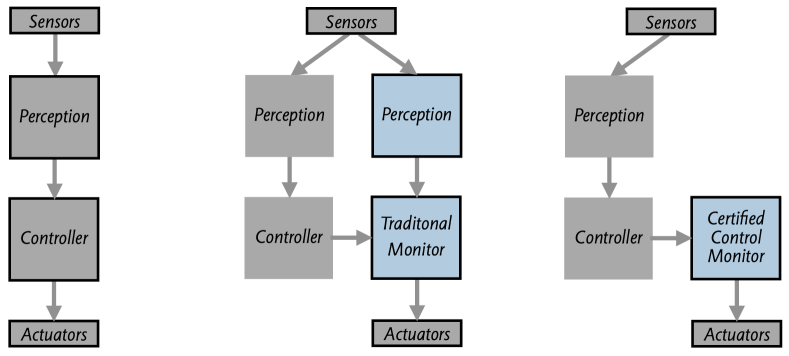
Figure 3 highlights the difference between a certified control monitor and a traditional monitor. On the left, it shows an architecture without a monitor, in which a perception module reads and interprets sensor data, and passes the results to a controller, which then decides on an appropriate action that is passed to the actuators. In the center is the architecture for a traditional monitor that performs its own perception. On the right is the architecture with a certified control monitor, which delegates to the controller the task of assembling perception results into compelling evidence in the certificate.
Appendix 0.B LiDAR Certificate Details
In this section, we give the details of the LiDAR certificate and its checking. Figure 4 shows the parameters comprising the certificate. Figure 5 gives the specification of the certificate: that is, the validity rules checked by the monitor.
A LiDAR point is a tuple (fb, rl, ud), with each coordinate in meters, with (0, 0, 0) centered on the LiDAR scanner (forward/backward, right/left, up/down: positive in direction of first of each). All distances in metres, measured from centerpoint min_forward_dist: minimum acceptable distance for all points lane_left, lane_right: left and right lane edges at distance min_forward_dist lane_up, lane_down: required spread of points vertically max_rl_diff: maximum horizontal spacing of points within each row max_ud_diff: maximum vertical spacing of rows max_row_dev: maximum vertical deviation of point in row from row height row_heights: array of vertical heights for rows rows: array of rows, each being an array of points
Result is conjunction of: Min forward distance conformance all i: 0..len(rows)-1 | all j: 0..len(rows[i])-1 | FDC(i,j) where FDC(i,j) = fb(rows[i][j]) >= min_forward_dist Row height conformance all i: 0..len(rows)-1 | all j: 0..len(rows[i])-1 | RHC(i,j) where RHC(i,j) = abs (ud(proj(rows[i][j])) - row_heights[i]) <= max_row_dev Row height separation all i: 0..len(rows)-2 | RHS(i) where RHS(i) = abs(row_heights[i] - row_heights[i+1]) <= max_ud_diff Horizontal density all i: 0..len(rows)-1 | all j: 0..len(rows[i])-2 | HD(i,j) where HD(i,j) = abs (rl(proj(rows[i][j])) - rl(proj(rows[i][j+1])) <= max_rl_diff Horizontal spread all i: 0..len(rows)-1 | HS(i) where HS(i) = rl(proj(rows[i][0])) <= lane_left and rl(proj(rows[i][len(rows[i])-1])) >= lane_right Vertical spread (assumes row heights ordered from top to bottom) LU where LU = row_heights[0] >= lane_up LD where LD = row_heights[len(row_heights)-1] <= lane_down where proj(p) = let k = min_forward_dist / fb(p) in (min_dist, rl(p) * k, ud(p) * k) in (min_forward_dist, rl(p) * k, ud(p) * k) and ud(p) = p[2], rl(p) = p[1] and fb(p) = p[0]
0.B.1 Code Meets Specification
Python code for the monitor itself follows, which includes Hoare-style annotations that comprise a proof of correctness. We used Python because it is the preferred language for both our simulator and race car environment. In a real installation of certified control, we would expect a more appropriate language to be used instead, for example, a safe subset of C (such as MISRA-C) or a real-time language designed for verification (such as a SPARK Ada). Using Python would impose additional proof obligations—for example, that the certificate parameters have the appropriate types—which we did not include here.
The assertions are sufficiently complete that a Hoare-style proof follows directly from them, requiring only trivial verification conditions (eg, that the assertion immediately prior to each loop implies its invariant). The assertions establish only partial correctness. Termination is proved with the decrementing function len(a)-i for each loop in which index i is used to iterate over array a.
Python code for the monitor that checks the certificate annotated with invariants 1 def interlock (min_forward_dist, lane_left, lane_right, lane_up, lane_down, 2 max_rl_diff, max_ud_diff, max_row_dev, row_heights, rows): 3 4 # define functions to extract up/down, right/left and forward/backward 5 # coordinates from points 6 def ud (p): 7 return p[2] 8 def rl (p): 9 return p[1] 10 def fb (p): 11 return p[0] 12 13 # return a point corresponding to projection onto plane at min_forward_dist 14 def proj(p): k = min_forward_dist / fb(p) 15 return (min_forward_dist, rl(p) * k, ud(p) * k) 16 17 result = True 18 19 # vertical spread 20 result = result && row_heights[0] >= lane_up 21 result = result && row_heights[len(row_heights)-1] <= lane_down 22 {result = LU and LD} 23 24 i = 0 25 {i = 0 and result = LU and LD} 26 while (i < len(rows)): 27 { 28 i <= len(rows) 29 result = LU and LD and 30 and all I: 0..i-1 | all J: 0..len(rows[I])-1 | FDC(I,J) and RHC(I,J) 31 and all I: 0..i-1 | all J: 0..len(rows[I])-2 | HD(I,J) 32 and all I: 0..i-1 | HS(I) 33 } 34 35 # horizontal spread 36 result = result && rl(proj (rows[i][0])) <= lane_left 37 result = result && rl(proj (rows[i][-1])) >= lane_right 38 39 { 40 result = LU and LD and 41 and all I: 0..i-1 | all J: 0..len(rows[I])-1 | FDC(I,J) and RHC(I,J) 42 and all I: 0..i-1 | all J: 0..len(rows[I])-2 | HD(I,J) 43 and all I: 0..i | HS(I) 44 } 45 46 j = 0 47 while (j < len(rows[i])): 48 { 49 j <= len(rows[i]) 50 result = LU and LD and 51 and all I: 0..i-1 | all J: 0..len(rows[I])-1 | FDC(I,J) and RHC(I,J) 52 all J: 0..j-1 | FDC(i,J) and RHC(i,J) 53 and all I: 0..i-1 | all J: 0..len(rows[I])-2 | HD(I,J) 54 and all I: 0..i | HS(I) 55 } 56 57 # min forward dist conformance 58 result = result && fb(rows[i][j]) >= min_forward_dist 59 60 # row height conformance 61 dev = abs( ud(proj(rows[i][j])) - row_heights[i] ) 62 result = result && dev <= max_row_dev 63 64 j++ 65 66 { 67 result = LU and LD and 68 and all I: 0..i | all J: 0..len(rows[I])-1 | FDC(I,J) and RHC(I,J) 69 and all I: 0..i-1 | all J: 0..len(rows[I])-2 | HD(I,J) 70 and all I: 0..i | HS(I) 71 } 72 73 j = 0 74 while (j < len(rows[i])-1)): 75 { 76 j <= len(rows[i])-1 77 result = LU and LD and 78 and all I: 0..i | all J: 0..len(rows[I])-1 | FDC(I,J) and RHC(I,J) 79 and all I: 0..i-1 | all J: 0..len(rows[I])-2 | HD(I,J) 80 and all J: 0..j-1 | HD(i,j) 81 and all I: 0..i | HS(I) 82 } 83 # horizontal density 84 rl_diff = abs( rl(proj(rows[i][j])) - rl(proj(rows[i][j+1]))) 85 result = result && rl_diff <= max_rl_diff 86 j++ 87 i++ 88 { 89 result = LU and LD and 90 and all i: 0..len(rows)-1 | all j: 0..len(rows[i])-1 | FDC(i,j) and RHC(I,J) 91 and all i: 0..len(rows)-1 | all j: 0..len(rows[i])-2 | HD(i,j) 92 and all i: 0..len(rows)-1 | HS(i) 93 } 94 95 i = 0 96 {i = 0} 97 while (i < len(rows)-1): 98 { 99 result = LU and LD and 100 and all i: 0..len(rows)-1 | all j: 0..len(rows[i])-1 | FDC(i,j) and RHC(I,J) 101 and all i: 0..len(rows)-1 | all j: 0..len(rows[i])-2 | HD(i,j) 102 and all i: 0..len(rows)-1 | HS(i) 103 and all I: 0..i-1 | RHS(I) 104 } 105 # row height separation 106 ud_diff = abs(row_heights[i] - row_heights[i+1]) 107 result = result && ud_diff <= max_ud_diff 108 i++ 109 110 { 111 result = LU and LD and 112 and all i: 0..len(rows)-1 | all j: 0..len(rows[i])-1 | FDC(i,j) and RHC(I,J) 113 and all i: 0..len(rows)-1 | all j: 0..len(rows[i])-2 | HD(i,j) 114 and all i: 0..len(rows)-1 | HS(i) 115 and all i: 0..len(rows)-2 | RHS(i) 116 } 117 return result
0.B.2 Specification Implies Requirement
The safety case must include a proof that the certificate specification establishes the desired safety requirement in the real world, which we outline below.
Requirement. There is no obstacle closer than min_forward_dist with a horizontal dimension larger than max_rl_diff and a vertical dimension larger than max_ud_diff + max_row_dev in the rectangle defined by lane_left, lane_right, lane_up and lane_down
Proof that Specification implies Requirement. If there were an obstacle violating the requirement closer than min_forward_dist, it would overlap one of the existing points by the line segment lemma (below), and then the forward/backward component of that LiDAR point would be incorrect.
Line segment lemma. Consider a one dimensional line, and a collection of points on it . Suppose for some and we have
-
1.
-
2.
-
3.
Then every line segment of between and includes at least one :
Proof. If a line segment starting at and ending at has , then . If it begins between left and (left ), then by (1), so . If the line segment ends between and right (), then by (2) and . If it begins between points and () then it must end at a point after by (3), and .
Using the Z3 theorem prover [16], we checked the lemma mechanically, bounding the analysis up to a fixed number of points. In the following code, the function generate_VC(n) generates the verification condition for the case where the number of points is . At the bottom of the code, it uses Z3 to check if there is a counterexample violating generate_VC(n) for all . Here, we use maxN = 100. But it works for other constants as well.
Python code for proving the line segment lemma using Z3 theorem prover 1 from z3 import * # Need run ‘pip install z3-solver‘. Tested with z3-solver 4.8.8.0 2 3 def generate_VC(n): 4 delta = Real(’delta’) 5 left = Real(’left’) 6 right = Real(’right’) 7 assumptions = [] 8 assumptions.append(delta > 0) 9 assumptions.append(left < right) 10 11 x = Reals(’ ’.join([’x’ + str(i) for i in range(n)])) 12 13 # Assumption 1 14 assumptions += [-delta <= x[0] - left, x[0] - left <= delta] 15 16 # Assumption 2 17 assumptions += [-delta <= x[n - 1] - right, x[n - 1] - right <= delta] 18 19 # Assumption 3 20 assumptions += [-delta <= x[i] - x[i+1] for i in range(n - 1)] 21 assumptions += [x[i] - x[i+1] <= delta for i in range(n - 1)] 22 assumptions = And(assumptions) 23 24 x_L = Real(’x_L’) 25 x_R = Real(’x_R’) 26 antecedent = And(x_R - x_L > delta, x_R < right, x_L > left) 27 # Instead of using ‘Exists‘, we enumerate each case for i explicitly. 28 consequent = Or([And(x_L <= x[i], x[i] <= x_R) for i in range(n)]) 29 30 # We check if there is a model satisfying the *negation* of the lemma. 31 return Not(Implies(And(assumptions, antecedent), consequent)) 32 33 # Check all cases for n in [3, maxN). 34 maxN = 100 35 for n in range(3, maxN): 36 # It prints out "no solution" indicating the absence of counterexamples. 37 solve(generate_VC(n))
Since Python does not provide type checking, a malicious controller could conceivably create a passable certificate with incorrectly typed data, as long as that data still supports all of the checking operations performed by the monitor. We expect a production system to be implemented in a language with type checking. Further, LiDAR data authentication, described next, prevents this problem.
0.B.3 LiDAR Authentication
Our experimental implementation does not currently include the authentication of LiDAR points required to ensure that the controller does not corrupt or fake them. Since the authentication checks are point-wise, we do not anticipate this being problematic (since it seems to be well within the scope of cryptographic verification [9]).
We did conduct some timing experiments to ensure that the authentication overhead would not be excessive. Table 1 shows timings for a variety of schemes that we tested. As expected, full-blown public-key encryption using RSA or DSS is not viable, although a scheme based on Edwards curves (Ed25519) might be. In practice, a simple hashing scheme with a shared secret is probably the best approach. It allows 100 LiDAR points to be signed and verified in just over a millisecond. Its only disadvantage is that it would require a setup protocol in which the LiDAR sensor unit and the certified control monitor exchange the shared secret.
| Scheme | Sign 100 | Sign and verify |
|---|---|---|
| points (ms) | 100 points (ms) | |
| Hashing with secret | 0.6 | 1.4 |
| Hashed RSA | 501.8 | 506.1 |
| Ed25519 | 5.6 | 18.1 |
| DSS | 296.9 | 805.5 |
Appendix 0.C A certificate for visual lane detection
A key part of virtually all autonomous vehicle perception systems is the camera sensor, since most critical road features such as lane lines, traffic signs, and traffic signals can only be identified through visual means. It follows that the software that identifies these features in the vehicle’s camera feed is enormously complex and difficult to verify by any means other than exhaustive testing due to the nature of neural nets. Given how difficult it is to test such an important part of the vehicle, it is no surprise that failures in vision perception often lead to fatal crashes. Thus, being able to provide a safety guarantee for vision perception systems, even for just one feature the system claims to detect, would be an important step towards improving overall safety.
To explore the application of certified control in the domain of vision, we focused on the verification of lane line detection—that is, we designed a certificate that confirms that the perception system correctly identifies the location of lane lines at runtime.
The certificate contains the following elements:
-
•
the image frame from which the lane lines were deduced;
-
•
the position of the left and right lane boundaries as second-degree polynomials in the bird’s-eye/top-down view ( and , respectively), both lines giving the distance from the left side of the top-down view as a function of distance from the front of the car;
-
•
the bird’s-eye transformation matrix used to transform the lane lines;
-
•
a series of color filtering thresholds used to process the image and highlight the presence of the lane lines.
The monitor verifies the certificate in two checks. The first check is geometric. In this test, the proposed lane lines are evaluated as a pair; if they conform to specific geometric bounds (such as parallelism) then the lane lines pass this test. The second check is a computer vision check. Computer vision techniques are used to determine whether the proposed lane lines correspond to lane line markings in the image. If they do, the lane lines pass. The proposed lane lines must pass both checks in order for the certificate to be accepted.
0.C.1 Geometric Test
The geometric test ensures that the purported lane lines are parallel and spaced according to local regulations; in the US, for example, the width of a freeway lane is 12 feet [43]. To conduct the parallelism test, the monitor checks that the distance between points on and the intersection of its normal with remains relatively constant. To ensure correct spacing, this distance is required to be on average within a certain delta of the expected distance between lane lines.
The problem of checking the lane width and comparing lane boundaries for parallelism is greatly simplified by working with a bird’s-eye perspective of the lane boundaries. The transformation and fitting of the lane-lines is done by the main controller, so the checks performed by the monitor remain simple.
0.C.2 Conformance Test
Proposed lane lines might happen to pass the geometric test (or be maliciously tailored to pass it) but not actually correspond to lane lines on the road itself. It is therefore essential to also check that the lane lines conform to a signed image of the road. To do this, the monitor applies simple and well-tested computer vision algorithms to determine if there are corresponding lane markings in the image. The match between the proposed lane lines and the image is checked as follows (and illustrated in Fig. 6) 101010 Our original monitor implementation used a fixed bird’s-eye transformation matrix to convert the camera image to a top-down view (instead of converting the lane lines from the top-down to camera view). This allowed us to create an additional filter to specifically test for dotted lane lines. However, this implementation was less robust to curvy roads and varying camera angles. In addition, openpilot already computes a calibration matrix for converting lane lines from top-down view to camera view. We took advantage of this by integrating that matrix into the certificate, giving the monitor more flexibility while remaining simple. :
-
1.
The monitor computes the logical OR of the image filtered with an edge detection algorithm on lightness value (such as the Sobel operator) and the image filtered by lightness above a certain threshold. These thresholds are computed by the controller and passed to the monitor as part of the certificate.
-
2.
Using the bird’s-eye transformation matrix passed from the controller, the monitor transforms the lane lines and from the bird’s-eye view to the image’s view.
-
3.
For the transformed left lane curve (and correspondingly for the right), the monitor creates a filter based on the curve, slightly blurred to allow for some margin of error in the proposed lane lines. The bottom of the filter is weighted more heavily because deviations in the region closest to the car are more important. At points not on the curve, the filter is padded with negative values so that only thin lines that match the filter’s shape will produce a high correlation output.
-
4.
The monitor computes the cross-correlation between the filter and the left side of the processed image (and correspondingly for the right), and finds the point of highest correlation in the image (namely such that ). It checks that the point of highest correlation lies on the transformed lane line , and that the maximum correlation is above a predefined threshold.
0.C.3 Experiments
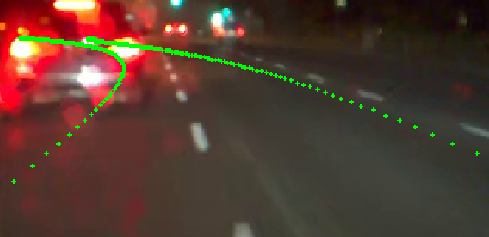
The vision certificate checking scheme was implemented and evaluated against two different lane-detection software systems. The first was openpilot [6], in which we used real replay data from a car driven using the openpilot system. We used the Comma2k19 dataset [5], which included driving segments with non-highway driving and adverse lighting conditions (such as a rainy night).
In several instances, our monitor caught lane detection failures (Fig. 7). In all failure cases, however, openpilot was able to successfully correct its lane detection within a few seconds. For some of these cases, it was not obvious from inspection of the image taken from the camera’s perspective that the proposed lane lines were not geometrically correct. However, viewing from the bird’s-eye perspective, it was easier to see that they could not correspond to plausible lane lines.
The certificate used for openpilot required about 45KB of storage, dominated by the image. On average, checking of the certificate took about 0.18 seconds on a Dell XPS 9570 Intel Core i7-8750H CPU with 16GB RAM. This would not be adequate performance in a production system, but it is within an order of magnitude of what would be required. With proper optimization of the checking algorithm, and some additional compression of the image, performance seems unlikely to be a problem.
The second experiment was conducted with the physical racecar. We implemented a naive lane-detection scheme, and used colored tape on the floor to simulate lane lines. By placing additional tape segments in inappropriate positions, we were able to get the lane detector to report bad lane lines; in all cases, the monitor correctly rejected them.
0.C.4 Component Isolation and Authentication of Image Data
To demonstrate security in a certified control lane following system, we augmented the visual lane detection system with authentication and timestamping of sensor data, and with component isolation. We adopted a threat model in which a malicious controller could:
-
•
propose incorrect lane lines
-
•
send a modified image or timestamp to the monitor
-
•
pass stale images to the monitor
-
•
not send anything at all to the monitor
For each case, we implemented a simple malicious controller that attempts to execute the associated attack.
The system consisted of four components: the sensor, controller, monitor, and actuators. At startup, the sensor generates a private key and establishes a one-time connection with the monitor to pass its public key to the monitor. The sensor then chooses an image from a random set of dashcam images (simulating a real sensor’s readings of the environment), adds a timestamp to the image, and signs it with the private key. It sends the signed image to the controller, which processes it to determine the location of the lane lines. The controller assembles its certificate (as described above) and sends that to the monitor. The monitor uses the public key from the sensor to authenticate the image. It checks that the timestamp is newer than any other image it has previously received and that it was generated within the last 0.8 seconds. It then does the computer vision checks (as previously described) to determine whether the proposed lane lines are correct. If all checks pass, the monitor sends a ”continue” action to the actuator; otherwise, it sends a ”stop” action. In addition, if the monitor does not receive a certificate for 0.8 seconds, it automatically sends a ”stop” action to the actuator.
This scheme allowed the monitor to detect attacks from each of the implemented four malicious controllers. However, to guard against more sophisticated attacks that attempt to directly manipulate the sensor, monitor, or actuators, we also added a layer of isolation between the components.
We utilized Docker and its OS-level virtualization to isolate each of the four components into their own Linux containers. Other stronger forms of isolation were considered, such as the use of virtual machines or hardware separation, but Docker offered the most in terms of performance and portability. To isolate communication channels between containers, we created separate bridge networks for each possible component connection. Each container was given a different IP address for each network it was a part of, e.g. the sensor had a different IP for its communication with the monitor from its communication with the controller. Both the sensor and monitor shared the same clocks as the host machine for more precise timing coordination.
0.C.5 Conclusions
The experiments with openpilot show that lane lines detected by neural nets can be inaccurate and that these inaccuracies can be identified using classical computer vision techniques. Though these experiments were not exhaustive, they show that this technique can work on real data (from openpilot) and when physically deployed to a model self-driving car platform. In most cases the monitor was able to correctly identify bad lane lines and verify good lane lines, which gives reason to believe that a balance of tolerance and sensitivity is possible (RQ1). Even though the racecar used only a naive lane-finding algorithm with no machine learning, the algorithms still used three times as many lines of code as the monitor’s three vision checks combined (Fig. 8) (RQ2). Production controllers are of course much more complex—openpilot’s deep learning container for lane-finding on Github has around 26 convolutional and 7 fully connected layers. This reduction in the size of the trusted base, coupled with the fact that the monitor uses only classical computer vision techniques (most of which are matrix convolutions), means that formal verification of the monitor, while still a tricky task, is closer within reach than verification of a machine-learning-based lane detector (RQ3).
| Component | Lines of Code |
|---|---|
| Vision Monitors library calls | 90 |
| Vision Monitors self-written code | 235 |
| Vision Monitors Total | 325 |
| Controller library calls | 460 |
| Controller self-written driver code | 612 |
| Vision Controller Total | 1072 |
0.C.6 Limitations
This certificate is inherently less trustworthy than the LiDAR certificate. This seems unavoidable, since unlike the physical obstacles detected by the LiDAR scheme, following lane lines is a social convention, with the lane lines acting as signs whose interpretation is not a matter of straightforward physical properties.
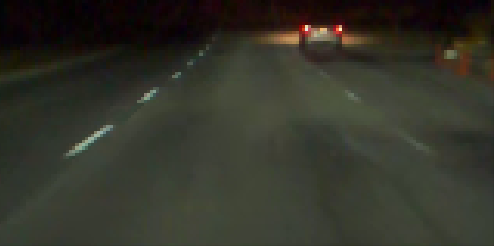
There are two failure cases that we encountered during testing. The first involves obstructed lane lines. Our design assumes that the lane boundaries are always at least partially visible. Since the dataset includes segments with non-highway driving, there were cases in which multiple cars were lined up at a stoplight and obscuring the lane lines. On the highway, the lane lines could be similarly obstructed during traffic or when a car in front is changing lanes. The second failure case involves poorly painted lane lines. In one case, a lane line was so faded it caused the correlation output of the conformance test to not reach the desired threshold and therefore fail the check (Fig. 9). This situation could be mitigated if color filter thresholds were dynamically computed and passed by the controller to the monitor. However, since we could not find such thresholds in the openpilot replay data, we passed constant values to the monitor. This failure case also reflects the fact that compelling evidence of the presence of a lane will require well-drawn lane lines; a successful deployment of autonomous cars might simply require higher standards of road markings. It is essential to realize that certified control does not create or even exacerbate this problem but merely exposes it. If the designer of an autonomous vehicle were willing to rely on inferring lanes from poorly drawn lines, the certificate requirements could be reduced accordingly, so that the level of confidence granted by the certificate reflect the less risk-averse choice of the designer.

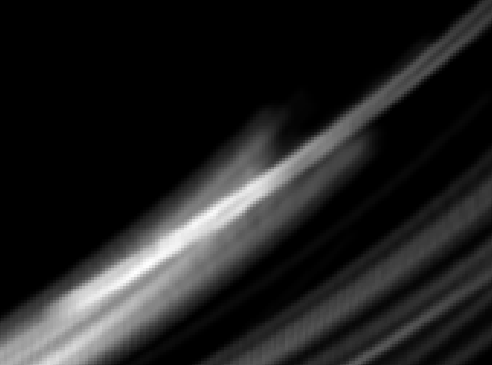
A third failure case is of particular importance because it has been observed in erroneous behavior that has caused some cars (notably those produced by Tesla which rely heavily on vision, since they have no LiDAR units) to swerve towards concrete barriers. In this case, the problem is that bright lines, that seem to be lane lines, appear in the camera’s image [1]. These lines are actually bands of direct or reflected sunlight. In most cases, we believe that our tests would catch such anomalies; we took one particular image from an online video (Fig. 10) illustrating this problem and confirmed that the inferred lane lines would indeed fail the geometric test and be correctly rejected.
It is possible that these spurious lane lines would have passed the geometry and conformance tests. Apparently a more basic property is being violated: the detected lane line is on the barrier and not on the ground. This motivates a new type of certificate, which we now turn to.
Appendix 0.D A Certificate Combining Vision and LiDAR
Image data lacks the inherent physical properties of LiDAR data: a single pixel, unlike a single LiDAR point, says nothing about the car’s environment, absent other context. As a result, one can only perform limited checks on the lane lines using vision alone. Indeed in the Tesla example, the yellow ray of sun looked, in the image, like a plausible lane line. However, the line was not spatially on the ground plane.
This motivated a certificate that integrates LiDAR and vision data for verifying lane line detection. In addition to providing the lane line polynomials and the camera image (as above), the certificate also provides a set of LiDAR points that lie on the purported lane lines. The monitor checks that these LiDAR points indeed correspond to the lane lines and that they reside on the ground plane. The controller, as usual, is given the more complex task, in this case selecting the LiDAR points.
0.D.1 Experiment
In the controller, we take points from the image’s lane lines and transform them into the LiDAR space, yielding the corresponding LiDAR readings. Doing so, given knowledge of the camera and LiDAR specifications and their mounting locations on the vehicle, is a matter of basic trigonometric transformations.
We additionally task the controller with identifying a ground plane. Our controller implementation runs a random sample consensus (RANSAC) algorithm [18], augmented with some constraints on necessary ground plane features (e.g. slope, height relative to the car), to determine the plane.
Given the LiDAR lane line points and the ground plane, the monitor checks that the lane points do lie sufficiently close to the ground plane. To simulate the Tesla barrier malfunction, we lined up two rows of tape to look like lane lines. The tape for the left line was placed on the ground while the tape for the right lane was elevated on a platform; from the camera’s perspective, the pair of lane lines looked geometrically plausible (Fig. 11). When we ran our combined vision-LiDAR implementation on this scenario, the monitor correctly rejected the certificate because the points from the right lane line were not on the ground plane. This check would also detect false lane lines which lie above or below the ground plane for any other reason.
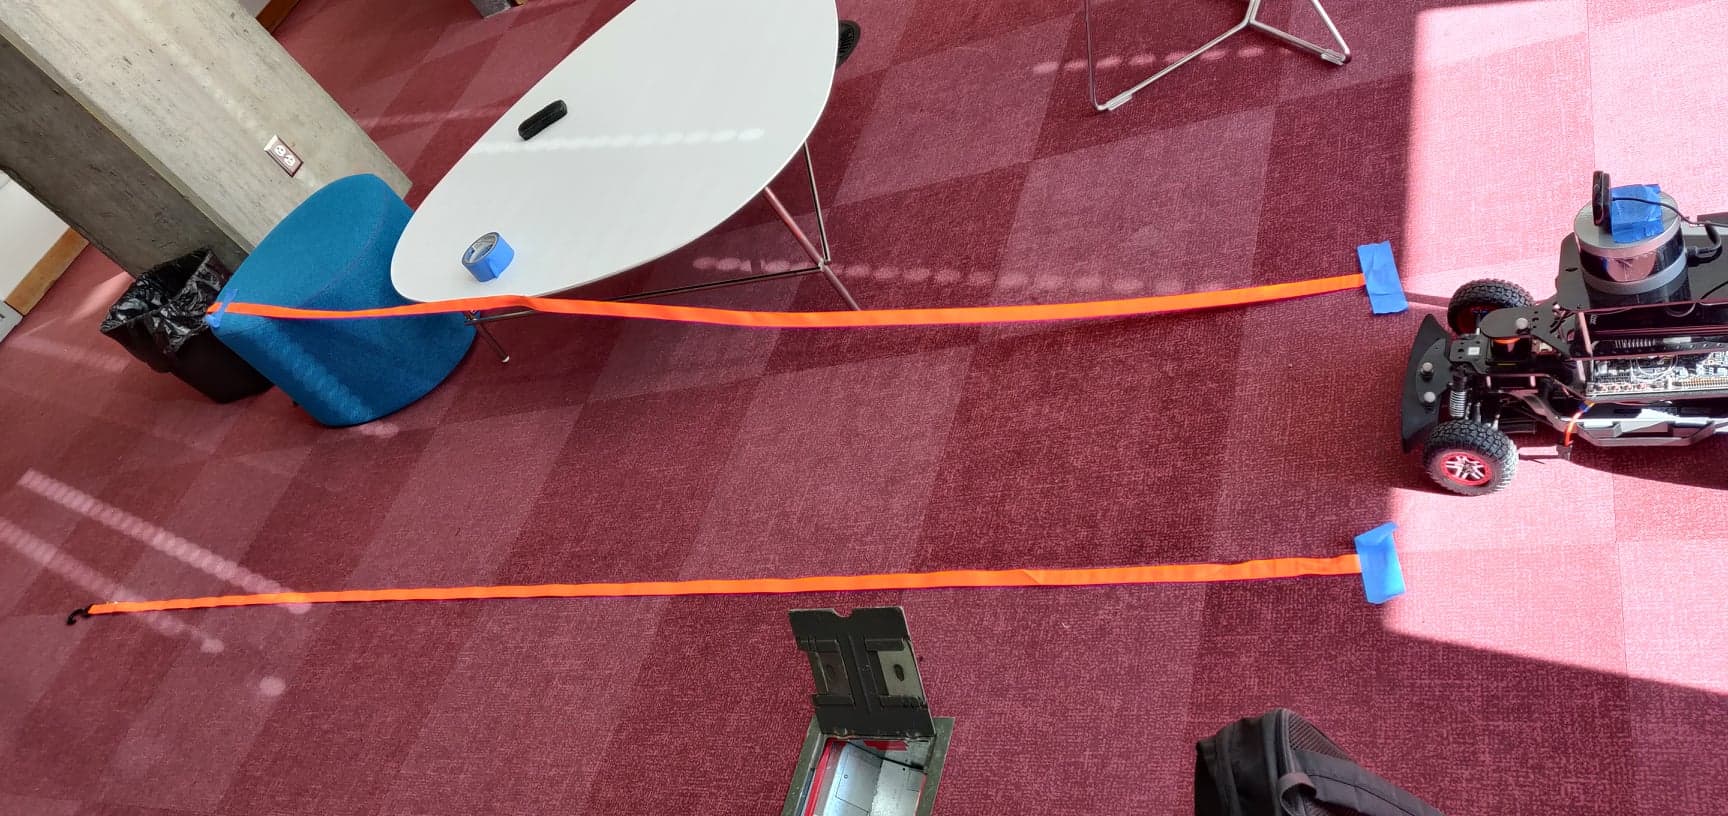
0.D.2 Evaluation
The integration of vision with LiDAR presents a few unique challenges. First, the ground plane detector we implemented is not robust to steeply sloped roads or to very uneven road surfaces. Second, since the controller does not include in its certificate any proof of validity of the ground plane it detected, the ground plane algorithm must be regarded as within the trusted base. The obvious remedy—namely including the ground plane detection in the monitor—is not straightforward for two reasons: the algorithm is too complex to be easily verifiable, and the monitor only has access to the points in the certificate, not the entire LiDAR point cloud. Nevertheless, we hope to solve this problem with our usual approach: by tasking the controller with producing a certificate which proves to the monitor the validity of its suggested ground plane, e.g. by inclusion of certain low-lying points.
0.D.3 Conclusion
Our experiments showed that it is possible for a monitor combining LiDAR and vision data to check the detected lane lines in a reliable manner, and to catch cases that would have passed a purely visual test (RQ1). Compared to the complexity of a neural net employed by lane-detection software like openpilot, being able to verify the lane lines using our monitor offers a huge reduction in the complexity of the trusted base (RQ2) which goes hand-in-hand with simplifying the task of formal verification (RQ3 ).