Vol.0 (20xx) No.0, 000–000
22institutetext: Mizusawa VLBI Observatory, National Astronomical Observatory of Japan, 2-12 Hoshigaoka, Mizusawa, Oshu, Iwate 023-0861, Japan
33institutetext: Kogakuin University of Technology and Engineering, Academic Support Center, 2665-1 Nakano, Hachioji, Tokyo 192-0015, Japan
44institutetext: Korea Astronomy and Space Science Institute, Yuseong-gu, Daejeon 34055, Korea
55institutetext: Department of Astronomy, Yonsei University, 50 Yonsei-ro, Seodaemun-gu, Seoul 03722, Korea
66institutetext: Department of Astronomy and Space Science, University of Science and Technology, 217 Gajeong-ro, Daejeon, Korea
77institutetext: Institute of Astronomy and Astrophysics, Academia Sinica, 645 N Aohoku Pl, Hilo, HI 96720, USA
88institutetext: Graduate School of Sciences and Technology for Innovation, Yamaguchi University, Yoshida 1677-1, Yamaguchi, Yamaguchi 753-8512, Japan
99institutetext: Shanghai Astronomical Observatory, Chinese Academy of Sciences, 80 Nandan Road, Xuhui District, Shanghai 200030, China
1010institutetext: Xinjiang Astronomical Observatory, Chinese Academy of Sciences, Urumqi 830011, China
1111institutetext: Key Laboratory of Radio Astronomy, Chinese Academy of Sciences, Nanjing 210008, China
1212institutetext: Institute of Astronomy, The University of Tokyo, 2-21-1 Osawa, Mitaka, Tokyo 181-0015, Japan
1313institutetext: Instituto de Astrofísica de Andalucía-CSIC, Glorieta de la Astronomía s/n, Granada E-18008, Spain
1414institutetext: Department of Physics, Faculty of Science, University of Malaya, Kuala Lumpur 50603, Malaysia
1515institutetext: Center for Astronomy, Ibaraki University, 2-1-1 Bunkyo, Mito, Ibaraki 310-8512, Japan
1616institutetext: Space Light Laboratory, 77, Yangjaedae-ro 86 road, Gangdong-gu, Seoul, Korea
1717institutetext: Massachusetts Institute of Technology Haystack Observatory, 99 Millstone Road, Westford, MA 01886, USA
1818institutetext: National Radio Astronomy Observatory, 520 Edgemont Rd, Charlottesville, VA 22903, USA
1919institutetext: Toyo University, 5-28-20 Hakusan, Bunkyo-ku, Tokyo 112-8606, Japan
2020institutetext: Department of Physics and Astronomy, Seoul National University, Gwanak-gu, Seoul 08826, Korea
2121institutetext: Max Planck Institute for Radio Astronomy, Auf dem hügel 69, Bonn 53121, Germany
\vs\noReceived 2021 March 29; accepted 2021 April 11
East Asian VLBI Network Observations of Active Galactic Nuclei Jets: Imaging with KaVA+Tianma+Nanshan
Abstract
The East Asian very-long-baseline interferometry (VLBI) Network (EAVN) is a rapidly evolving international VLBI array that is currently promoted under joint efforts among China, Japan, and Korea. EAVN aims at forming a joint VLBI Network by combining a large number of radio telescopes distributed over East Asian regions. After the combination of the Korean VLBI Network (KVN) and the VLBI Exploration of Radio Astrometry (VERA) into KaVA, further expansion with the joint array in East Asia is actively promoted. Here we report the first imaging results (at 22 and 43 GHz) of bright radio sources obtained with KaVA connected to Tianma 65-m and Nanshan 26-m Radio Telescopes in China. To test the EAVN imaging performance for different sources, we observed four active galactic nuclei (AGN) having different brightness and morphology. As a result, we confirmed that Tianma 65-m Radio Telescope (TMRT) significantly enhances the overall array sensitivity, a factor of 4 improvement in baseline sensitivity and 2 in image dynamic range compared to the case of KaVA only. The addition of Nanshan 26-m Radio Telescope (NSRT) further doubled the east-west angular resolution. With the resulting high-dynamic-range, high-resolution images with EAVN (KaVA+TMRT+NSRT), various fine-scale structures in our targets, such as the counter-jet in M 87, a kink-like morphology of the 3C 273 jet and the weak emission in other sources, are successfully detected. This demonstrates the powerful capability of EAVN to study AGN jets and to achieve other science goals in general. Ongoing expansion of EAVN will further enhance the angular resolution, detection sensitivity and frequency coverage of the network.
keywords:
galaxies: active — galaxies: jets — instrumentation: interferometers — radio continuum: galaxies1 Introduction
Very Long Baseline Interferometry (VLBI) is a powerful astronomical technique to observe radio sources at a high angular resolution. The recent successful detection of the black-hole shadow in M 87 with the Event Horizon Telescope (EHT) is an excellent example of such a technique at millimeter wavelengths (EHTC et al. 2019a). VLBI also plays a unique role in resolving the formation scales of relativistic jets powered by active galactic nuclei (AGN) (e.g., Hada et al. 2020). Moreover, high-resolution VLBI can also precisely determine the spatial distributions, kinematics and parallaxes of astrophysical masers, which provides insights into the structures of star forming regions and our Galaxy (e.g., Reid & Honma 2014; Hirota et al. 2020). To further promote such VLBI sciences, it is essential to enhance the angular resolution, the sensitivity and the imaging performance of the network. This requires the establishment of a large VLBI array across multiple countries.
In recent years, international collaboration of VLBI facilities in East Asia is rapidly growing. In particular, the Korean VLBI Network (KVN; e.g., Lee et al. 2014) in Korea and the VLBI Exploration of Radio Astrometry (VERA; e.g., Kobayashi et al. 2003) in Japan were successfully combined into a single network at 22 and 43 GHz as the KVN and VERA Array (KaVA), and now the joint array has been in regular operation since 2014 (e.g., Sawada-Satoh 2013). KaVA significantly improved the imaging performance for bright AGN jets compared to the ones obtained with the individual arrays thanks to the increased numbers of stations and baselines (e.g., Niinuma et al. 2014). Since then a growing number of publications based on KaVA have been produced for a variety of science targets (e.g., Matsumoto et al. 2014; Dodson et al. 2014; Oh et al. 2015; Kim et al. 2015; Yun et al. 2016; An et al. 2016; Hada 2017; Zhang et al. 2017; Burns et al. 2018; Zhao et al. 2019; Lee et al. 2019; Imai et al. 2019; Baek et al. 2019; Park et al. 2019; Hada et al. 2020).
Nevertheless, the number of baselines, angular resolution and resulting fringe/image sensitivity of KaVA are still limited. To further expand the international VLBI array in East Asia, the addition of stations from the Chinese VLBI Network (CVN; (e.g., Ye et al. 1991) is certainly important. CVN is operated under the auspices of the Chinese Academy of Sciences (CAS), and currently, it consists of 4 primary stations: Tianma 65-m Radio Telescope in Shanghai (hereafter, TMRT), Nanshan 26-m Radio Telescope in Urumqi (hereafter, NSRT), Miyun 50-m radio telescope in Beijing and Kunming 40-m Telescope in Yunnan. The large collecting area and wide geographically distributed stations over the mainland in China are very complementary to VLBI facilities in Korea and Japan. Therefore, combining KaVA and CVN (as well as other radio telescopes in these countries such as the Japanese VLBI Network (JVN; e.g., Doi et al. 2006; Yonekura et al. 2016), Sejong station in Korea (e.g., Kondo et al. 2008) and Five-hundred-meter Aperture Spherical radio Telescope in China (FAST; e.g., Nan 2006) can greatly enhance the angular resolution and overall sensitivity of the network.
| Location | Name | Network | Da | Lat.b | Lon.c | Alt.d | (%) | HPBWf | ||
| (m) | (degree) | (degree) | (m) | 22 GHz | 43 GHz | 22 GHz | 43 GHz | |||
| Tianma | TMRT | CVN | 65 | 31 | 121 | 49 | 50 | 45 | 44 | 22 |
| Nanshan | NSRT | CVN | 26 | 43 | 87 | 2029 | 60 | - | 115 | - |
| Mizusawa | MIZ | VERA | 20 | 39 | 141 | 116 | 47 | 51 | 141 | 71 |
| Iriki | IRK | VERA | 20 | 32 | 130 | 574 | 47 | 44 | 149 | 78 |
| Ogasawara | OGA | VERA | 20 | 272 | 142 | 273 | 50 | 45 | 143 | 78 |
| Ishigakijima | ISG | VERA | 20 | 242 | 124 | 65 | 49 | 48 | 144 | 79 |
| Tamna | KTN | KVN | 21 | 332 | 126 | 452 | 60 | 63 | 126 | 63 |
| Ulsan | KUS | KVN | 21 | 36 | 129 | 170 | 63 | 61 | 124 | 63 |
| Yonsei | KYS | KVN | 21 | 38 | 127 | 139 | 55 | 63 | 127 | 63 |
The concept of the East Asian VLBI Network (EAVN) was first discussed in 2003 (e.g., Shen et al. 2004) and the consortium to facilitate EAVN was established in 2004 (e.g., Inoue 2005). Since then, significant joint efforts have been made among China, Japan and Korea to promote EAVN activities, and some early EAVN experiments were already made in 2010 (e.g., Fujisawa et al. 2014; Sugiyama et al. 2016; Wajima et al. 2016). However, in these early days, the observations were temporarily coordinated with ad-hoc arrays and also KaVA was still under commissioning. Observations with EAVN became more organized and intensive from 2016, when KaVA was already in stable operation, TMRT started its early science operation and NSRT was back in operation after its refurbishment (see section 2). To accelerate the commissioning of KaVA+TMRT+NSRT which serves as a core array of EAVN, we performed a large EAVN observing campaign between March and May 2017. The EAVN campaign was performed by making use of the slots allocated to the KaVA AGN Large Program that intensively monitored the nearby supermassive black holes M 87 and Sgr A⋆ at 22 and 43 GHz (Kino et al. 2015). TMRT and NSRT regularly participated in these KaVA sessions (and occasionally, some more stations joined such as Hitachi, Takahagi, Kashima, Nobeyama, Sejong, Medicina and Noto), resulting in the largest EAVN experiments that have ever made. Therefore, these datasets are very useful to evaluate the array performance of EAVN as well as to study the physics close to the supermassive black holes (SMBHs).
| Arraya | Stations | (km) | (mas) | (Jy/beam) | |||||
|---|---|---|---|---|---|---|---|---|---|
| min | max | 22 GHz | 43 GHz | 22 GHz | 43 GHz | ||||
| A1 | KaVA | 7 | 21 | 305 | 2270 | 1.24 | 0.63 | 155 | 268 |
| A2 | KaVA+TMRT | 8 | 28 | 305 | 2270 | 1.24 | 0.63 | 95 | 165 |
| A3 | KaVA+TMRT+NSRT | 9 | 36 | 305 | 5078 | 0.55 | – | 75 | – |
In this paper, we report the initial results of EAVN imaging observations for several AGN based on a subset of the EAVN-2017 campaign data. While here we focus on the performance evaluation of the KaVA+TMRT+NSRT array, more dedicated scientific results/analysis on individual sources using the whole campaign dataset will be reported in separate papers. In section 2, we overview the VLBI network used in this paper, with a special emphasis on TMRT and NSRT. The basic information about the observed sources is presented in section 3. Section 4 includes the detailed information of the observations and data reduction processes. The results and discussion are described in section 5. EAVN data status after 2017 is briefly summarized in section 6. In the last section, we summarize the paper and the future plan of EAVN. Throughout this paper, we assume a flat CDM universe with the cosmological parameters from Planck Collaboration et al. (2016), = 67.8 km s-1 Mpc-1, = 0.31, and = 0.69.
| Obs. Code | Frequency (GHz) | Date | UT Time | Stations |
|---|---|---|---|---|
| a17077a (Session-K) | 22 | 2017 March 18 | 12:45–19:45 | KaVA (no KYS), TMRT, NSRT |
| a17086a (Session-Q) | 43 | 2017 March 27 | 13:10–18:10 | KaVA, TMRT |
2 EAVN array
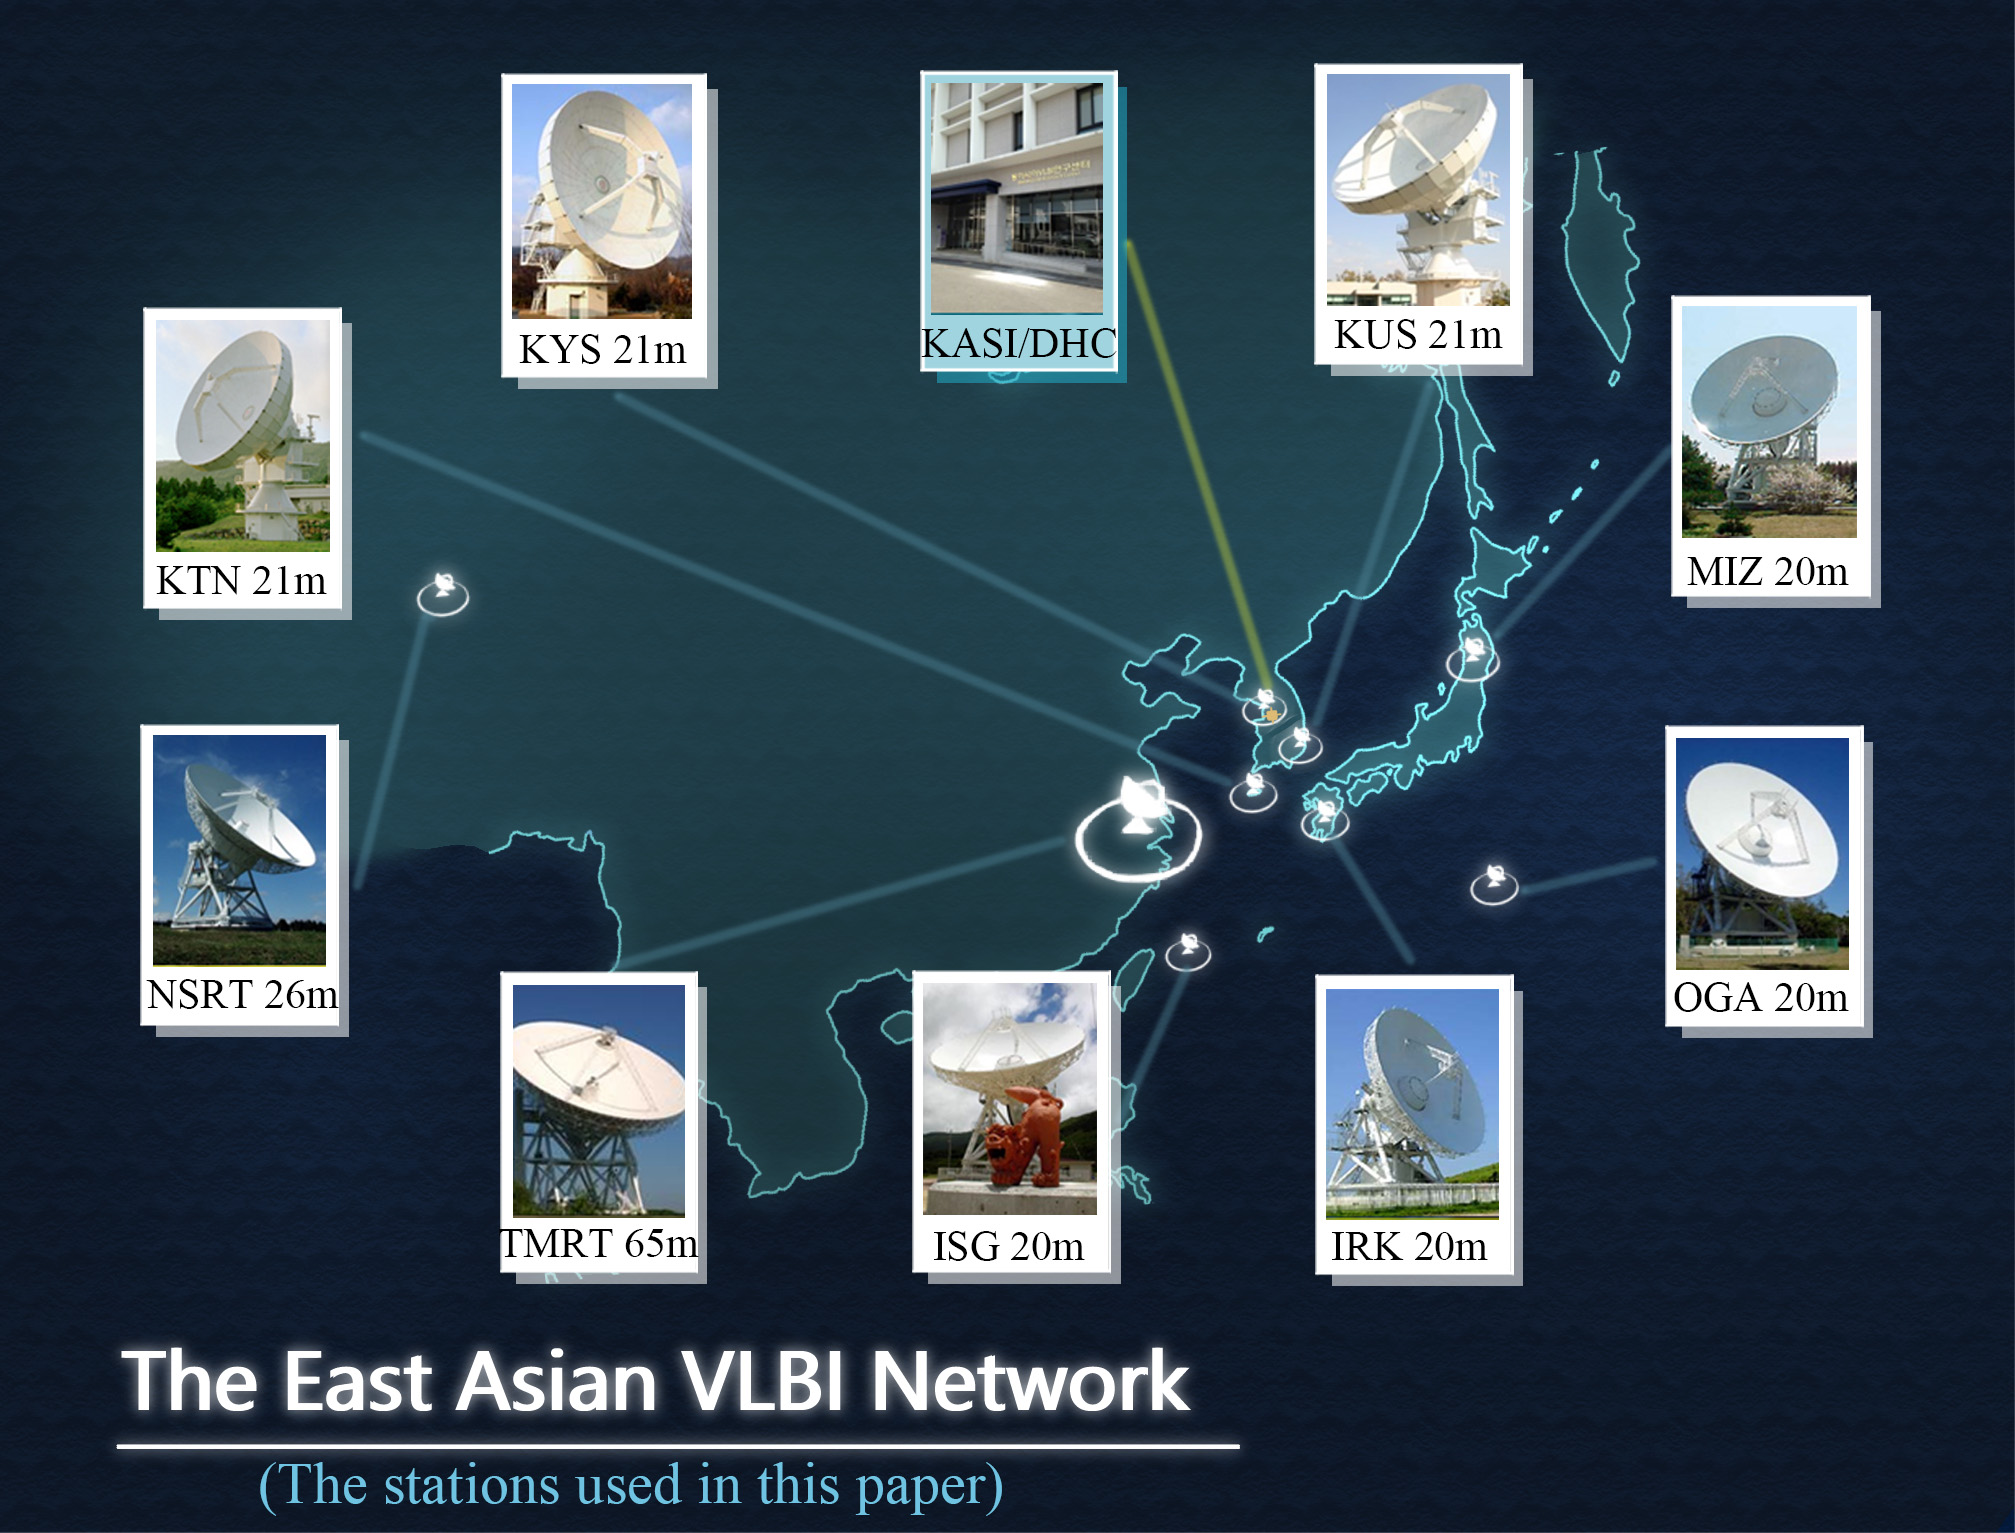
The EAVN array is continuously expanding and the number of participating stations are increasing year by year. In the EAVN-2017 campaign, while a total of 15 stations joined from East Asia and Europe, the 9 stations of KaVA, TMRT and NSRT participated in the campaign on a regular basis. Figure 1 shows the geographical distribution of these sites and relative diameter. Table 1 adopted from the EAVN status report 111https://radio.kasi.re.kr/eavn/files/StatusReportEAVN2020A20191031.pdf summarizes the basic information of the 9 stations which form a core array of EAVN. Below we describe some more details about TMRT and NSRT. For details of KaVA stations, see Niinuma et al. (2014) and Hada (2017).

2.1 Tianma 65-m Radio Telescope (TMRT)
The Tianma 65-m Radio Telescope (TMRT) is operated by the Shanghai Astronomical Observatory (SHAO) as a joint project between the Chinese Academy of Sciences (CAS) and the city of Shanghai. The project was approved at the end of October 2008. After laying the foundation in December 2009, the construction of the telescope started in March 2010 and completed with the first-light detection in October, 2012. The location of the telescope is in Sheshan, Songjiang District of Shanghai (Jiang et al. 2018).
Cooperated with another 25-m-diameter radio telescope in Sheshan, the first interferometric fringes of TMRT were detected with a 6.1-km baseline in November 2012. After that, the TMRT starts commissioning and makes great contributions to a broad range of radio astronomy researches such as blazars, microquasars, molecular spectral lines, pulsars, X-ray binaries and geodynamics based on both single-dish and VLBI modes (e.g. Li et al. 2016; Yang et al. 2019; Hou & Gao 2020). As a representative radio telescope in China, TMRT joins EAVN from the beginning of this project since 2013. TMRT also regularly joins European VLBI Network (EVN) since 2014 in particular at low frequencies (e.g. 5 GHz).
At present, TMRT is the largest fully steerable telescope in East Asia. It has a wide range of observing wavelengths covering 1–50 GHz with 8 bands, namely L (1.25–1.75 GHz), S (2.2–2.4 GHz), C (4–8 GHz), X (8.2–9.0 GHz), Ku (12–18 GHz), K (18.0–26.5 GHz), Ka (30–34 GHz) and Q (35–50 GHz) bands (Yan et al. 2015). The S/X- and X/Ka-band receivers are the dual-frequency co-axis feed. The common observing frequencies of TMRT with KaVA are 22 GHz and 43 GHz (and partially also 6.7 GHz). The maximum aperture efficiency of TMRT assembled to be reached at 53∘ elevation is around 50% at 22 GHz and 45% at 43 GHz with the active surface control system (see table 1). The active surface controller is set ‘ON’ by default. The nominal root mean square (rms) of surface accuracy is 0.6 mm without active surface and 0.3 mm with active surface at the elevation around 53∘. The sub-reflector surface accuracy is 0.1 mm rms. The typical pointing accuracy is 3 arcseconds when the wind speed is 4 m s-1 and 30 arcseconds if the wind speed reaches 20 m s-1. The slew rate is 0.5 ∘ s-1 and 0.3 ∘ s-1 at azimuth and elevation directions respectively. Dual-pixel receivers are installed in TMRT at both 22 and 43 GHz which enables simultaneous observations of multiple lines (Zhong et al. 2018). These two beams have a fixed separation angle of 140 arcseconds at 22 GHz and 100 arcseconds at 43 GHz. One of the beams is placed at the antenna focus for VLBI observations. The Half Power Beam Width (HPBW) is the measured beam sizes listed in table 1.
2.2 Nanshan 26-m Radio Telescope (NSRT)
The Nanshan 26-m Radio Telescope in Urumqi (NSRT) operated by Xinjiang Astronomical Observatory is another key station in CVN constructed in 1993. The telescope is located at the northern foot of Tianshan with high elevation above 2029 m and over 75 km away from Urumqi city which is surrounded by the superior observing environment with dry climate and low-level radio frequency interference. Originally the telescope was designed with a diameter of 25 m, but a refurbishment of the telescope was made from early 2014 and completed in late 2015 (Xu et al. 2018). This resulted in an enlargement of the main reflector to 26 m and improvement of the antenna surface accuracy. After this reconstruction was finished, NSRT participated in EAVN commissioning. NSRT also joins EVN since early 1994 and International VLBI Service for Geodesy and Astrometry (IVS) after 1996. Over the past 20 years, NSRT has made rich contributions to pulsar timing and physics, molecular line survey and star formation, AGN jets and flux monitoring based on both single-dish and VLBI modes (e.g. Wang et al. 2005; Yuan et al. 2010; Wu et al. 2018; Cui et al. 2010; Liu et al. 2012).
NSRT features a Cassegrain-type design with a 26-m diameter main reflector and a 3-m sub-reflector on Az-El mount. Receivers at six frequency bands, L, S/X, C, K (22–24.2 GHz), and Q (30–50 GHz), are equipped, while the new cryogenic 43 GHz receiver has been installed in 2018 and is under evaluation. The surface accuracy is 0.4 mm (rms) for main-reflector and 0.1 mm (rms) for sub-reflector. The slewing rates of the main reflector are s-1 in azimuth and s-1 in elevation. The pointing precision is 10 arcseconds (rms). The aperture efficiency of NSRT is at 22 GHz (see table 1).
Thanks to its unique location at the northwest of China, the east-west baseline coverage of EAVN is significantly enhanced with the participation of NSRT (from 2270 km to 5078 km). This offers a fringe spacing (namely angular resolution , is the observing wavelength and is the maximum baseline length) down to 0.55 milliarcseconds (mas) at 22 GHz (and 0.26 mas at 43 GHz), which is 2.3 times smaller than KaVA only (see table 2).
3 Source selection
To evaluate the imaging performance of the KaVA+TMRT+NSRT array, we selected four well-known AGN sources, i.e., 1219+044, 3C 273, M 84 and M 87. These sources were selected for the following reasons: 1) the core flux densities are high enough to detect fringes, although M 84 is a possible exception; 2) the mas-scale radio morphology covers diverse structures from point-like to complicated; and 3) the sky positions are close with each other, which offers similar observing/calibration conditions (e.g., atmosphere, gain curves) among these sources.
1219+044 (PKS J1222+0413) is a bright compact blazar located at a redshift of = 0.966 (1 mas = 8.15 pc, Pâris et al. 2017). The source has recently been identified as a candidate of -ray emitting narrow-line Seyfert I galaxy (Kynoch et al. 2019). Previous VLBA images at 15 GHz show an extremely compact core-dominated structure (unresolved up to 442 8840 km) with a tiny amount of jet emission toward the south (Lister et al. 2019). Therefore 1219+044 may serve as a useful reference source to check the amplitude accuracy of each antenna.
3C 273 ( = 0.158, 1 mas = 2.82 pc, Strauss et al. 1992) is one of the most famous quasars (Schmidt 1963) with a powerful relativistic jet. Due to strong relativistic boosting, on mas scales the source shows a one-sided jet towards the south-west direction at a position angle PA = (Perley & Meisenheimer 2017). The viewing angle of the jet is estimated to be 3.8∘–7.2∘ (Meyer et al. 2016). The mas-scale jet structure is rather complicated (knotty and helically twisted) with frequent ejections of new components from the core (Jorstad et al. 2017).
M 84 ( = 0.00339, 1 mas = 0.07 pc, Meyer et al. 2018) is a nearby low-luminosity elliptical galaxy in the Virgo cluster. At radio, the source exhibits Fanaroff-Riley type I jet morphology on kpc scales. The quasi-symmetric morphology of the jet and counter-jet indicates a jet viewing angle to be close to edge-on (74)∘ (Meyer et al. 2018). On mas scales, past VLBI images show relatively compact morphology with a slight extension towards the north (Giovannini et al. 2001; Ly et al. 2004). The radio core flux density is typically 100 mJy or less. Therefore, M 84 provides a useful reference to check EAVN imaging performance for low luminosity objects.
M 87 ( = 0.00436, 1 mas = 0.09 pc, Smith et al. 2000) is the giant radio galaxy at the center of the Virgo cluster with a prominent jet. The galaxy hosts a SMBH of 6.5 (EHTC et al. 2019b). On mas scales the source exhibits a highly collimated jet at PA 290∘ (Hada et al. 2016; Walker et al. 2018). In contrast to 3C 273, the VLBI morphology of the M 87 jet is relatively smooth without prominent knotty features. Since M 87 is a primary target of the KaVA/EAVN Large Program (Kino et al. 2015), a large fraction of the observing time was spent on this source in our observations.
4 Observations and Data Reduction
4.1 Observations
Here we selected two representative epochs from the EAVN 2017 campaign as summarized in table 3. These observations were conducted on March 18th (observing code: a17077a; hereafter, Session-K) and March 27th (observing code: a17086a; hereafter, Session-Q) at 22 and 43 GHz, respectively. Yonsei (KYS) did not join Session-K due to an issue at the site. TMRT participated in both epochs along with KaVA, while NSRT was only available at 22 GHz. The overall weather condition was good at each site. For TMRT, antenna pointing calibration was made at the beginning of each session. We observed M 87 as a primary target of the EAVN campaign while the other sources (3C 273, 1219+044, M 84) were observed with less on-source time. In detail, Session-K lasted for 7 hours where scans of 3C 273 (6 min) – 1219+044 (4 min) – M 87 (47 min) – M 84 (4 min) were repeated for 6 cycles. Session-Q were performed for 5 hours where scans of 3C 273 (6 min) – 1219+044 (2 min) – M 87 (54 min) – M 84 (2 min) – were repeated for 4 cycles. RT Vir (H2O/SiO masers) was inserted with four scans (4 min / each scan) for a system/frequency check of both experiments. However, the SiO masers of the source at Q-band were too weak to be detected during our observations (due to their variable nature (Brand et al. 2020). The recording rate was 1 Gbps (2-bit sampling) where a total bandwidth of 256 MHz was divided into eight 32-MHz intermediate frequency (IF) bands. Only left-hand circular polarization was received. All the data were correlated at the Daejeon hardware correlator installed in Korea Astronomy and Space Science Institute (KASI).
In figure 2(a) we display the uv-coverage of M 87 for Session-K. The baselines of KAVA+TMRT and KAVA+NSRT are shown with blue and red colors, respectively. The addition of TMRT to KaVA improves the uv-coverage within 180 M, while NSRT significantly extends the southeast-northwest baseline coverage by a factor of 2. Figure 2(b) and (c) show the corresponding beam patterns with a naturally-weighted scheme for KaVA and KaVA+TMRT for Session-Q. Similarly, figure 2(d)-(f) show the beam patterns for Session-K. In table 4-column(MSLL), we list some representative levels of maximum side lobes obtained from the beam patterns for each source, which are a good proxy to foresee the improvement of imaging performance. One can clearly see that the side lobe levels are significantly reduced by adding TMRT(+NSRT).
4.2 Data reduction processes
The EAVN data were calibrated in the standard manner of VLBI data reduction procedures and under the guideline of EAVN data reduction. We used the National Radio Astronomy Observatory (NRAO) Astronomical Image Processing System (AIPS; Greisen 2003) software package for the initial calibration of visibility amplitude, bandpass and phase. As a large dish, the visibility amplitude of TMRT shows some offsets compared with that of KaVA. The system temperature information of NSRT was absent due to the malfunction of the data acquisition system. Subsequent imaging/CLEAN and self-calibration which were properly performed with the DIFMAP software (Shepherd et al. 1994) can successfully recover the amplitude information from TMRT and NSRT. More details are described in the EAVN memo 222https://radio.kasi.re.kr/eavn/datareduction.php.
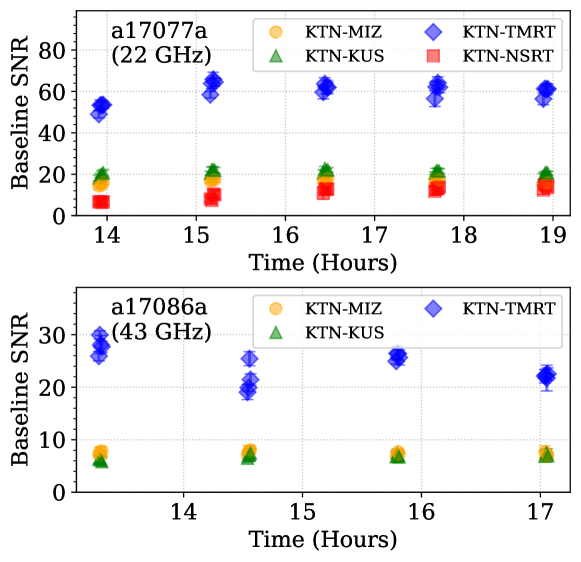
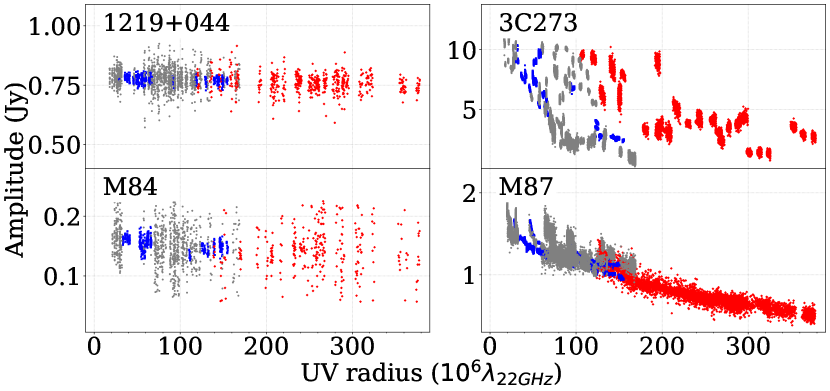
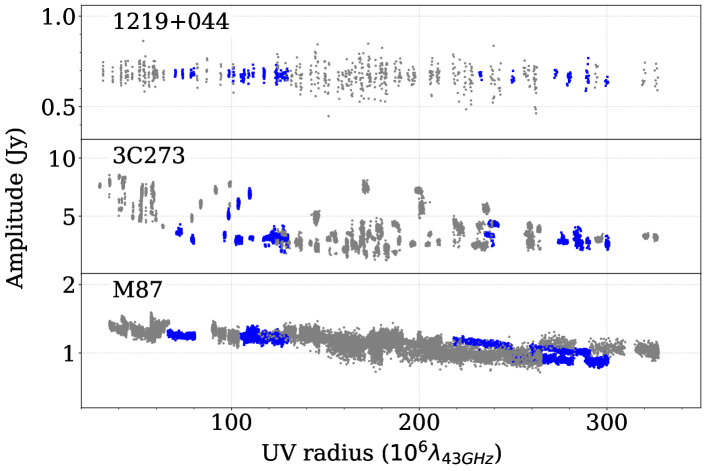
In the phase calibration process, solution intervals of 1 min and 30 s (with threshold 5) were used for Session-K and Session-Q, respectively, which are typical coherence time at each frequency. For comparison, in figure 3 we show baseline obtained by FRING (on 3 baselines) for the point source 1219+044, for which the correlated flux densities are similar over the whole baselines. The measured SNR of KTN-TMRT at 22 GHz were 4.4/3.4 times higher than those of KTN-MIZ/KTN-KUS, which are consistent with our expectation under slightly rainy weather conditions at TMRT. At 43 GHz, on the other hand, the measured SNR on KTN-TMRT was 4.2 times higher than KTN-MIZ. At 22 GHz, the SNR of KTN-NSRT is comparable with that of intra-KaVA baselines. This is broadly consistent with our expectation given the typical sensitivity of NSRT. For M 84, the fringes at 43 GHz were not detected even with TMRT. This would be reasonable given the low core flux (100 mJy), relatively shorter integration time than Session-K. In figure 4 and 5, we show the fully visibility amplitude of 1219+044, 3C 273, M 84 and M 87 at 22/43 GHz as a function of uv-distance.

| Epoch | Source | ta | Arrayc | Beam size | (mJy/beam) | DRf | MSLLg | |||||
| (min) | (mJy) | (masmas, deg) | Theo. | Core | Off-core | (mJy/beam) | Core | Off-core | ||||
| a17077a | 1219+044 | 24 | 607 | A1 | 1.38, 1.06, 10 | 0.76 | 0.63 | 0.65 | 598 | 944 | 917 | 0.43 |
| (22 GHz) | A2 | 1.66, 0.96, 8 | 0.42 | 0.34 | 0.37 | 598 | 1759 | 1608 | 0.05 | |||
| A3 | 1.51, 0.53, 14 | 0.37 | 0.34 | 0.38 | 594 | 1732 | 1561 | 0.03 | ||||
| 3C 273 | 36 | 13067 | A1 | 1.45, 1.03, 20 | 0.97 | 4.53 | 4.29 | 5730 | 1264 | 1335 | 0.41 | |
| A2 | 1.61, 0.91, 11 | 0.67 | 3.11 | 2.98 | 5540 | 1783 | 1861 | 0.03 | ||||
| A3 | 1.43, 0.58, 10 | 0.63 | 3.37 | 2.77 | 5090 | 1511 | 1840 | 0.01 | ||||
| M 84 | 24 | 172 | A1 | 1.29, 0.98, 1 | 1.13 | 0.93 | 1.02 | 148 | 159 | 145 | 0.39 | |
| A2 | 1.55, 0.90, 7 | 0.59 | 0.46 | 0.48 | 149 | 325 | 307 | 0.03 | ||||
| A3 | 1.37, 0.63, 12 | 0.57 | 0.45 | 0.46 | 146 | 326 | 316 | 0.03 | ||||
| M 87 | 282 | 2009 | A1 | 1.34, 1.08, 21 | 0.26 | 0.67 | 0.48 | 1326 | 1980 | 2754 | 0.36 | |
| A2 | 1.56, 0.96, 12 | 0.16 | 0.40 | 0.29 | 1313 | 3284 | 4544 | 0.03 | ||||
| A3 | 1.35, 0.58, 12 | 0.15 | 0.35 | 0.25 | 1154 | 3321 | 4586 | 0.01 | ||||
| a17086a | 1219+044 | 8 | 692 | A1 | 0.73, 0.56, 22 | 1.84 | 1.57 | 1.50 | 672 | 428 | 448 | 0.27 |
| (43 GHz) | A2 | 0.82, 0.52, 17 | 1.35 | 1.01 | 0.95 | 672 | 662 | 707 | -0.03 | |||
| 3C 273 | 24 | 8617 | A1 | 0.78, 0.52, 31 | 1.65 | 9.04 | 8.11 | 3840 | 425 | 474 | 0.38 | |
| A2 | 0.81, 0.50, 25 | 1.56 | 6.73 | 6.46 | 3840 | 571 | 634 | 0.13 | ||||
| M 87 | 216 | 1577 | A1 | 0.68, 0.57, 23 | 0.37 | 0.74 | 0.46 | 1180 | 1596 | 2565 | 0.28 | |
| A2 | 0.74, 0.51, 17 | 0.31 | 0.51 | 0.31 | 1180 | 2314 | 3764 | 0.01 | ||||
5 Results and discussion
5.1 Structure images
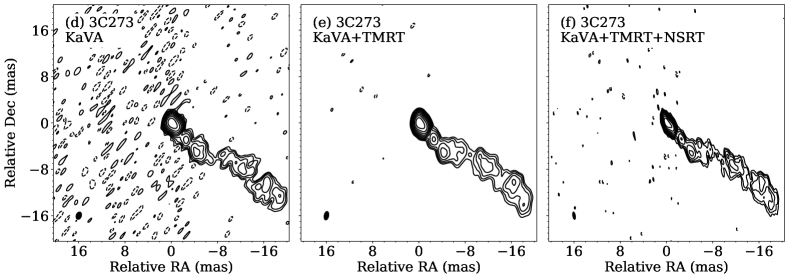
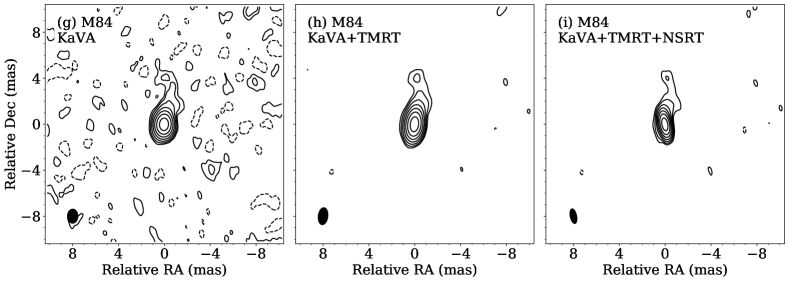
In figure 6 and 7, we show the structure images of each source obtained from the Session-K and Session-Q, respectively. For each source, images obtained from KaVA, KaVA+TMRT, and KaVA+TMRT+NSRT are shown separately (with identical contour levels). Overall, the images indicate a significant improvement of image quality when TMRT and NSRT were added to KaVA, and the side lobes seen in KaVA images were greatly reduced for all the sources at both frequencies. The detailed image parameters and resulting image dynamic ranges (/, where is the peak flux density and is image rms noise level.) are summarized in table 4. Here we calculated DR for two distinct regions. One is the core region which indicates the area within 5-mas distance to the core where the deconvolution errors usually dominate. The other one is the off-core region which represents the place over 40-mas distance to the core where the thermal noises dominate. The corresponding off-core is also visualized in figure 8. For all cases with different arrays and frequencies, the highest were obtained for M 87. This is simply because the total integration time of M 87 was the longest and the corresponding uv-coverage was much better than for the other sources.
For a proper comparison of relative improvement of image among different arrays, a good measure would be the ratio of rather than the absolute for each image. In table 5 we list the ratios of which are calculated as follows:
| (1) |
| (2) |
where A1, A2, and A3 indicate the array with KaVA, KaVA+TMRT and KaVA+TMRT+NSRT, respectively. Overall, is increased significantly when TMRT is added to KaVA, with actual improvement factors varying from 34% to 112%. The highest relative improvement was achieved in M 84, which is the weakest source in our sample. Then the point-like source 1219+044 comes second followed by M 87. The improvement was the lowest in 3C 273. The east-west angular resolution of the images including NSRT is twice better than KaVA+TMRT images. However, the does not become worse when the resolution becomes better.
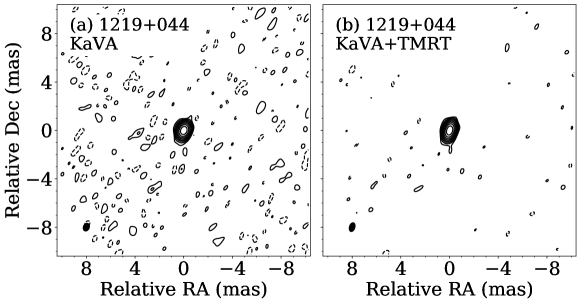
5.2 Point-like source 1219+044
The EAVN images of 1219+044 shown in figure 6(a)-(c) and 7(a)-(b) are characterized by a quasi-unresolved structure at both frequencies, which is consistent with the flat visibility amplitude distributions in the uv domain (figure 4 and 5). For all images from different arrays, we confirmed that the resulting image rms levels were close to thermal limits, as expected for such a simple source structure.
The improvement of image for this source is remarkable: by adding TMRT(+NSRT) to KaVA, a factor of 1.7–1.9 and 1.5–1.6 enhancement was seen at 22 GHz and 43 GHz, respectively. Thanks to the significant improvement of image quality, the KaVA+TMRT(+NSRT) image(s) at 22 GHz allows us to detect a hint of weak extended emission towards the south, which is consistent with the jet emission seen in the literature VLBI images (Lister et al. 2019).
| Epoch | Source | Core region | Off-core region | ||
|---|---|---|---|---|---|
| a17077a | 1219+044 | 1.86 | 1.83 | 1.75 | 1.70 |
| (22 GHz) | 3C 273 | 1.41 | 1.20 | 1.39 | 1.38 |
| M 84 | 2.05 | 2.05 | 2.12 | 2.18 | |
| M 87 | 1.66 | 1.68 | 1.65 | 1.66 | |
| a17086a | 1219+044 | 1.55 | – | 1.58 | – |
| (43 GHz) | 3C 273 | 1.34 | – | 1.34 | – |
| M 87 | 1.45 | – | 1.47 | – | |
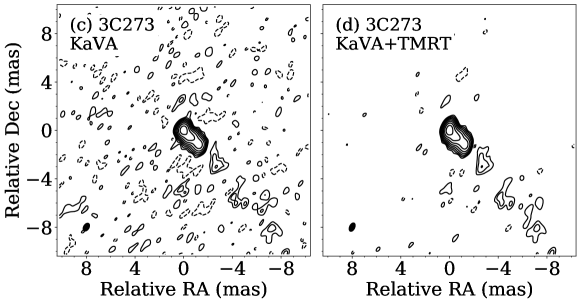
5.3 Kink of 3C 273 jet
As shown in figures 6(d)-(f) and 7(c)-(d), the addition of TMRT to KaVA increased the image dynamic range of 3C 273 by 40% at both frequencies. Since the source structure of 3C 273 is complex with a bright core, the resulting image rms noise levels were 3 times larger than the thermal noise limit, indicating that EAVN imaging of 3C 273 is highly dynamic range limited.
Another challenge of 3C 273 imaging is that, due to the complicated source structure, the calibrated visibility data could leave larger systematic errors than the case for a simple structure source. Hence, the image improvement of the KaVA+TMRT+NSRT at 22 GHz was relatively modest. Nevertheless, a factor of 2 enhancement of the east-west resolution allowed us to resolve the fine-scale structure of the core and jet of 3C 273.
The jet in quasar 3C 273 holds a well-known appealing structure which appears to be bent at mas scales (Readhead et al. 1979)while is highly collimated at arcsecond scales (Bahcall et al. 1995). Previous high-resolution VLBI images at 22 GHz consistently indicate a characteristic persistent “kink” morphology at 7–10 mas from the core, where the bright edge of the jet flips from one side to the other (Zensus et al. 1988; Bruni et al. 2017; Akiyama et al. 2018; Lister et al. 2019; Zensus et al. 2020). Thanks to the image improvement by a factor of 1.4, the addition of TMRT (and NSRT) to KaVA is better tracing the bending structure of 3C 273 in 7–10 mas regions (see figures 6(d)-(f)).
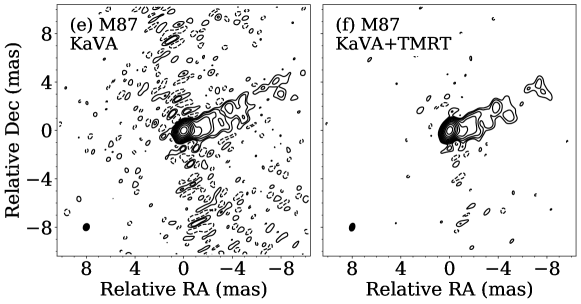
5.4 Weak jet of M 84
The addition of TMRT/NSRT to KaVA allowed us to robustly detect weak signals of this source at 22 GHz. The EAVN images clearly (10) detected a weak jet structure towards the north thanks to the factor of 2 improvement of image compared to KaVA. In the KaVA+TMRT+NSRT image, there is a possible hint of slight extension also towards the south, which could be associated with the counter-jet as seen in the literature VLBI images (Giovannini et al. 2001; Ly et al. 2004). A deeper imaging observation with a longer integration time may confirm this structure in future.
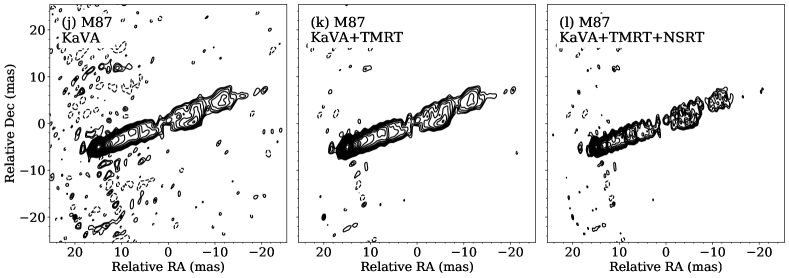
5.5 Counter jet feature of M 87
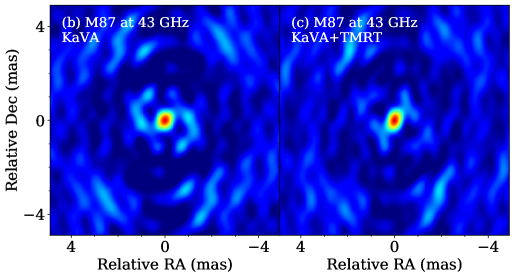
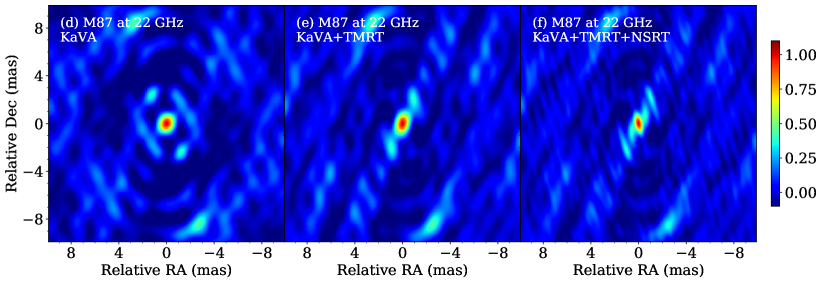
For M 87, the resulting dynamic range of EAVN images reached 4500 at 22 GHz (figure 6(l)) and 3700 at 43 GHz (figure 7(f)), thanks to the longest on-source time among the 4 sources. As a result, the extended jet emission was clearly detected up to 30 mas (figure 9) at 22 GHz, which is important to investigate the collimation profile over long distances. The improvement of EAVN images with respect to KaVA is more significant at 22 GHz (70%) than at 43 GHz (50%). This should be mainly due to the overall higher array sensitivity as well as the longer on-source time at 22 GHz.
The significant enhancement of sensitivity and east-west angular resolution by adding TMRT+NSRT enabled us to robustly detect/resolve the “counter-jet” at 22 GHz, which is extending up to 2 mas at the eastern side of the core (see figure 6-l). The detection of this feature was cross-checked by different data analysis to make sure that its appearance is not an artifact. The counter-jet of M 87 was firstly suggested in Ly et al. (2004) and later confirmed in a number of VLBA images at various frequencies (Ly et al. 2007; Kovalev et al. 2007; Hada et al. 2016; Kim et al. 2018; Walker et al. 2018). Imaging of the counter-jet near the core is vital to better understand the properties of jet-launching regions (Hada et al. 2016; Kim et al. 2018; Walker et al. 2018). In particular, accurate measurements of the jet-to-counter-jet brightness ratio (BR) allows us to constrain some key parameters such as the viewing angle and launching velocity, based on the standard theory of Doppler-boosting/deboosting of relativistically moving plasma.
At 43 GHz, thanks to the higher angular resolution transverse to the jet axis, the KaVA+TMRT image clearly resolved the limb-brightening structure that is well known in this jet. Interestingly, the southern limb of the jet appears to be brighter than the northern limb, which might be connected to the asymmetric brightness distribution the black-hole shadow seen in the EHT image (EHTC et al. 2019a).
6 EAVN data status after 2017
While here we presented the EAVN data obtained from the commissioning observations in 2017, the EAVN array has been continuously evolving since then. From 2018, EAVN officially started open-use observations with KaVA+TMRT+NSRT being a core array, and now EAVN is in its regular operation 333https://radio.kasi.re.kr/eavn/abouteavn.php. Our results of array performance evaluation presented here (based on 2017 data) should serve as a useful guidance/reference for the calibration of any EAVN data obtained after 2017. In fact, we analyzed some of more recent KaVA+TMRT+NSRT data obtained by an open-sky program, and we confirmed good consistency of the array performance as reported here. Various scientific results based on EAVN data are currently being produced (e.g., gamma-ray bursts, An et al. 2020). The detailed results of M 87 and SgrA obtained from recent EAVN observations will be reported in Cui et al. 2021 (in preparation) and Cho et al. 2021 (in preparation).
Concurrently, to further expand the baseline length and imaging capability, a joint effort of VLBI operation between EAVN and and radio telescopes in Italy is actively ongoing. This forms the East-Asia-To-Italy-Nearly-Global (EATING) VLBI array, which for the first time realizes a global VLBI array operating on a regular basis (Hada 2019). The EATING VLBI array is very powerful to intensively monitor the kinematics of the innermost regions of AGN jets. Moreover, joint observations with other European (e.g., Yebes), Russian and Australian are also under commissioning. All of these efforts on global scales are actively ongoing and more scientific outcomes with these efforts will be yielded in the coming years.
7 Summary
In this paper, we reported the first imaging results of bright AGN jets with KaVA+TMRT(+NSRT) that serves as a core array of EAVN. Compared with only KaVA, we confirmed that the image dynamic range for a point source (1219+044) can be improved by and at 22 and 43 GHz, respectively. For the source with extended jets M 87, KaVA+TMRT+NSRT successfully recovered their rich structures at image over 4500, thanks to the significant enhancement of sensitivity by TMRT and E-W angular resolution by NSRT. This demonstrates the excellent capability of EAVN for study of jet formation and collimation of powerful relativistic jets. We also imaged a relatively weak (100 mJy) source with short integration time.
In the next few years and beyond, we will see several new stations in East Asia and Southeast Asia, such as extended-KVN (eKVN; e.g., Jung et al. 2015), QiTai Telescope (QTT; e.g., Xu & Wang 2016) and Thai National Radio Telescope (TNRT; e.g., Jaroenjittichai et al. 2017), which are all capable of 22/43 GHz. In the meantime, plans of EAVN experiments at low frequencies (1–10 GHz) together with the FAST 500-m telescope (e.g., Nan 2006) are being actively considered. Ultimately, the growing EAVN can be connected to other cm-VLBI networks such as EVN, LBA and VLBA. This will facilitate the realization of a truly global VLBI array at centimeter wavelengths.
Acknowledgements.
We thank the anonymous referee for her/his careful review and suggestions that improved the manuscript. We acknowledge all staff members and students at TMRT, NSRT, KVN and VERA who supported the operation of the array and the correlation of the data. TMRT is operated by Shanghai Astronomical Observatory. NSRT is operated by Xinjiang Astronomical Observatory. KVN is a facility operated at by the Korea Astronomy and Space Science Institute. VERA is a facility operated at National Astronomical Observatory of Japan in collaboration with associated universities in Japan. This work is supported by The Graduate University for Advanced Studies (SOKENDAI). Y.C. is supported by the Japanese Government (MEXT) Scholarship. This work is supported by JSPS KAKENHI Grant Numbers JP18K03656 (M.K.), JP18H03721 (K.N., K.H. and M.K.), JP19H01943 (K.H., F.T. and Y.H.) and JP18KK0090 (K.H. and F.T.). K.H. is supported by the Mitsubishi Foundation (grant number 201911019). J.P. is supported by an EACOA Fellowship awarded by the East Asia Core Observatories Association, which consists of the Academia Sinica Institute of Astronomy and Astrophysics, the National Astronomical Observatory of Japan, the Center for Astronomical Mega-Science, the Chinese Academy of Sciences, and the Korea Astronomy and Space Science Institute. J.P. and I.C. acknowledge the financial support from the National Research Foundation (NRF) of Korea via Global Ph.D. Fellowship Grant 2014H1A2A1018695 and 2015H1A2A1033752, respectively. S.T. acknowledges support from the NRF via Grant 2019R1F1A1059721. This work is supported by the Major Program of the National Natural Science Foundation of China (NSFC, Grant No. 11590780, 11590784), the Knowledge Innovation Program of the Chinese Academy of Sciences (Grant No. KJCX1-YW-18), the Scientific Program of Shanghai Municipality (08DZ1160100), and Key Laboratory for Radio Astronomy, CAS. W.J. acknowledges support from NSFC under Grant No. 11803071. L.C. is supported by the National Key R&D Program of China under Grant No. 2018YFA0404602, the CAS ’Light of West China’ Program under Grant No. 2018-XBQNXZ-B-021, the NSFC under Grant No. U2031212 and 61931002 and the Youth Innovation Promotion Association of the CAS under Grant No. 2017084. J.C.A acknowledges support from Fundamental Research Grant Scheme (FRGS) FRGS/1/2019/STG02/UM/02/6. R.-S. Lu is supported by the Max Planck Partner Group of the MPG and the CAS and acknowledges the support by the Key Program of the National Natural Science Foundation of China (NSFC grant No. 11933007) and the Research Program of Fundamental and Frontier Sciences, CAS (grant No. ZDBS-LY-SLH011).References
- Akiyama et al. (2018) Akiyama, K., Asada, K., Fish, V., et al. 2018, Galaxies, 6, 15
- An et al. (2016) An, T., Cui, Y.-Z., Paragi, Z., et al. 2016, PASJ, 68, 77
- An et al. (2020) An, T., Salafia, O. S., Zhang, Y., et al. 2020, Science Bulletin, 65, 267
- Baek et al. (2019) Baek, J., Chung, A., Schawinski, K., et al. 2019, MNRAS, 488, 4317
- Bahcall et al. (1995) Bahcall, J. N., Kirhakos, S., Schneider, D. P., et al. 1995, ApJ, 452, L91
- Brand et al. (2020) Brand, J., Engels, D., & Winnberg, A. 2020, A&A, 644, A45
- Bruni et al. (2017) Bruni, G., Gómez, J. L., Casadio, C., et al. 2017, A&A, 604, A111
- Burns et al. (2018) Burns, R. A., Bayandina, O., Orosz, G., et al. 2018, in 14th European VLBI Network Symposium & Users Meeting (EVN 2018), 75
- Cui et al. (2010) Cui, L., Liu, X., Liu, J., Song, H. G., & Ding, Z. 2010, A&A, 518, A23
- Dodson et al. (2014) Dodson, R., Kim, C., Sohn, B., et al. 2014, PASJ, 66, 105
- Doi et al. (2006) Doi, A., Fujisawa, K., Harada, K., et al. 2006, in Proceedings of the 8th European VLBI Network Symposium, ed. W. Baan, R. Bachiller, R. Booth, P. Charlot, P. Diamond, M. Garrett, X. Hong, J. Jonas, A. Kus, F. Mantovani, A. Marecki, H. Olofsson, W. Schlueter, M. Tornikoski, N. Wang, & A. Zensus, 71
- EHTC et al. (2019a) EHTC, et al. 2019a, ApJ, 875, L1, (Paper I)
- EHTC et al. (2019b) EHTC, et al. 2019b, ApJ, 875, L6, (Paper VI)
- Fujisawa et al. (2014) Fujisawa, K., Aoki, N., Nagadomi, Y., et al. 2014, PASJ, 66, 109
- Giovannini et al. (2001) Giovannini, G., Cotton, W. D., Feretti, L., Lara, L., & Venturi, T. 2001, ApJ, 552, 508
- Greisen (2003) Greisen, E. W. 2003, AIPS, the VLA, and the VLBA, Vol. 285, Information Handling in Astronomy - Historical Vistas, Vol. 285, 109
- Hada (2017) Hada, K. 2017, Galaxies, 5, 2
- Hada (2019) Hada, K. 2019, Galaxies, 8, 1
- Hada et al. (2020) Hada, K., Niinuma, K., Sitarek, J., Spingola, C., & Hirano, A. 2020, ApJ, 901, 2
- Hada et al. (2016) Hada, K., Kino, M., Doi, A., et al. 2016, ApJ, 817, 131
- Hirota et al. (2020) Hirota, T., Plambeck, R. L., Wright, M. C. H., et al. 2020, ApJ, 896, 157
- Hou & Gao (2020) Hou, L. G., & Gao, X. Y. 2020, MNRAS, 495, 4326
- Imai et al. (2019) Imai, H., Nakagawa, A., & Takaba, H. 2019, PASJ, 71, 120
- Inoue (2005) Inoue, M. 2005, Journal of Korean Astronomical Society, 38, 77
- Jaroenjittichai et al. (2017) Jaroenjittichai, P., Punyawarin, S., Singwong, D., et al. 2017, in Journal of Physics Conference Series, Vol. 901, Journal of Physics Conference Series, 012062
- Jiang et al. (2018) Jiang, W., Shen, Z., Shu, F., Chen, Z., & Jiang, T. 2018, arXiv e-prints, arXiv:1804.04788
- Jorstad et al. (2017) Jorstad, S. G., Marscher, A. P., Morozova, D. A., et al. 2017, ApJ, 846, 98
- Jung et al. (2015) Jung, T., Dodson, R., Han, S.-T., et al. 2015, Journal of Korean Astronomical Society, 48, 277
- Kim et al. (2015) Kim, J.-Y., Trippe, S., Sohn, B. W., et al. 2015, Publication of Korean Astronomical Society, 30, 453
- Kim et al. (2018) Kim, K.-T., Hirota, T., Sugiyama, K., et al. 2018, in Astrophysical Masers: Unlocking the Mysteries of the Universe, ed. A. Tarchi, M. J. Reid, & P. Castangia, Vol. 336, 259
- Kino et al. (2015) Kino, M., Niinuma, K., Zhao, G.-Y., & Sohn, B. W. 2015, Publication of Korean Astronomical Society, 30, 633
- Kobayashi et al. (2003) Kobayashi, H., Sasao, T., Kawaguchi, N., et al. 2003, in Astronomical Society of the Pacific Conference Series, Vol. 306, New technologies in VLBI, ed. Y. C. Minh, 367
- Kondo et al. (2008) Kondo, T., Kim, T., Sasao, T., et al. 2008, in AGU Fall Meeting Abstracts, Vol. 2008, G33A
- Kovalev et al. (2007) Kovalev, Y. Y., Lister, M. L., Homan, D. C., & Kellermann, K. I. 2007, ApJ, 668, L27
- Kynoch et al. (2019) Kynoch, D., Landt, H., Ward, M. J., et al. 2019, MNRAS, 487, 181
- Lee et al. (2014) Lee, S.-S., Petrov, L., Byun, D.-Y., et al. 2014, AJ, 147, 77
- Lee et al. (2019) Lee, T., Trippe, S., Kino, M., et al. 2019, MNRAS, 486, 2412
- Li et al. (2016) Li, J., Shen, Z.-Q., Wang, J., et al. 2016, ApJ, 824, 136
- Lister et al. (2019) Lister, M. L., Homan, D. C., Hovatta, T., et al. 2019, ApJ, 874, 43
- Liu et al. (2012) Liu, X., Song, H. G., Marchili, N., et al. 2012, A&A, 543, A78
- Ly et al. (2007) Ly, C., Walker, R. C., & Junor, W. 2007, ApJ, 660, 200
- Ly et al. (2004) Ly, C., Walker, R. C., & Wrobel, J. M. 2004, AJ, 127, 119
- Matsumoto et al. (2014) Matsumoto, N., Hirota, T., Sugiyama, K., et al. 2014, ApJ, 789, L1
- Meyer et al. (2018) Meyer, E. T., Petropoulou, M., Georganopoulos, M., et al. 2018, ApJ, 860, 9
- Meyer et al. (2016) Meyer, E. T., Sparks, W. B., Georganopoulos, M., et al. 2016, ApJ, 818, 195
- Nan (2006) Nan, R. 2006, Science in China: Physics, Mechanics and Astronomy, 49, 129
- Niinuma et al. (2014) Niinuma, K., Lee, S.-S., Kino, M., et al. 2014, PASJ, 66, 103
- Oh et al. (2015) Oh, J., Trippe, S., Kang, S., et al. 2015, Journal of Korean Astronomical Society, 48, 299
- Pâris et al. (2017) Pâris, I., Petitjean, P., Ross, N. P., et al. 2017, A&A, 597, A79
- Park et al. (2019) Park, J., Hada, K., Kino, M., et al. 2019, ApJ, 887, 147
- Perley & Meisenheimer (2017) Perley, R. A., & Meisenheimer, K. 2017, A&A, 601, A35
- Planck Collaboration et al. (2016) Planck Collaboration, Ade, P. A. R., Aghanim, N., et al. 2016, A&A, 594, A13
- Readhead et al. (1979) Readhead, A. C. S., Pearson, T. J., Cohen, M. H., Ewing, M. S., & Moffet, A. T. 1979, ApJ, 231, 299
- Reid & Honma (2014) Reid, M. J., & Honma, M. 2014, ARA&A, 52, 339
- Sawada-Satoh (2013) Sawada-Satoh, S. 2013, arXiv e-prints, arXiv:1310.2705
- Schmidt (1963) Schmidt, M. 1963, Nature, 197, 1040
- Shen et al. (2004) Shen, Z., Yang, J., Hirabayashi, H., et al. 2004, in 2004 Asia-Pacific Radio Science Conference, 2004. Proceedings., 401
- Shepherd et al. (1994) Shepherd, M. C., Pearson, T. J., & Taylor, G. B. 1994, in Bulletin of the American Astronomical Society, Vol. 26, 987
- Smith et al. (2000) Smith, R. J., Lucey, J. R., Hudson, M. J., Schlegel, D. J., & Davies, R. L. 2000, MNRAS, 313, 469
- Strauss et al. (1992) Strauss, M. A., Huchra, J. P., Davis, M., et al. 1992, ApJS, 83, 29
- Sugiyama et al. (2016) Sugiyama, K., Fujisawa, K., Hachisuka, K., et al. 2016, PASJ, 68, 72
- Wajima et al. (2016) Wajima, K., Hagiwara, Y., An, T., et al. 2016, in Astronomical Society of the Pacific Conference Series, Vol. 502, Frontiers in Radio Astronomy and FAST Early Sciences Symposium 2015, ed. L. Qain & D. Li, 81
- Walker et al. (2018) Walker, R. C., Hardee, P. E., Davies, F. B., Ly, C., & Junor, W. 2018, ApJ, 855, 128
- Wang et al. (2005) Wang, N., Manchester, R. N., Johnston, S., et al. 2005, MNRAS, 358, 270
- Wu et al. (2018) Wu, G., Qiu, K., Esimbek, J., et al. 2018, A&A, 616, A111
- Xu et al. (2018) Xu, Q., Li, L., & Wang, N. 2018, in Society of Photo-Optical Instrumentation Engineers (SPIE) Conference Series, Vol. 10700, Ground-based and Airborne Telescopes VII, ed. H. K. Marshall & J. Spyromilio, 107002W
- Xu & Wang (2016) Xu, Q., & Wang, N. 2016, in Society of Photo-Optical Instrumentation Engineers (SPIE) Conference Series, Vol. 9906, Ground-based and Airborne Telescopes VI, ed. H. J. Hall, R. Gilmozzi, & H. K. Marshall, 99065L
- Yan et al. (2015) Yan, Z., Shen, Z.-Q., Wu, X.-J., et al. 2015, ApJ, 814, 5
- Yang et al. (2019) Yang, K., Chen, X., Shen, Z.-Q., et al. 2019, ApJS, 241, 18
- Ye et al. (1991) Ye, S., Wan, T., & Qian, Z. 1991, in Astronomical Society of the Pacific Conference Series, Vol. 19, IAU Colloq. 131: Radio Interferometry. Theory, Techniques, and Applications, ed. T. J. Cornwell & R. A. Perley, 386
- Yonekura et al. (2016) Yonekura, Y., Saito, Y., Sugiyama, K., et al. 2016, PASJ, 68, 74
- Yuan et al. (2010) Yuan, J. P., Wang, N., Manchester, R. N., & Liu, Z. Y. 2010, MNRAS, 404, 289
- Yun et al. (2016) Yun, Y., Cho, S.-H., Imai, H., et al. 2016, ApJ, 822, 3
- Zensus et al. (1988) Zensus, J. A., Bååth, L. B., Cohen, M. H., & Nicolson, G. D. 1988, Nature, 334, 410
- Zensus et al. (2020) Zensus, J. A., Vega-García, L., Ros, E., et al. 2020, Advances in Space Research, 65, 725
- Zhang et al. (2017) Zhang, Y., An, T., Frey, S., et al. 2017, MNRAS, 468, 69
- Zhao et al. (2019) Zhao, G.-Y., Jung, T., Sohn, B. W., et al. 2019, Journal of Korean Astronomical Society, 52, 23
- Zhong et al. (2018) Zhong, W.-Y., Dong, J., Gou, W., et al. 2018, Research in Astronomy and Astrophysics, 18, 044