An Analysis of the Gel Point of Polymer Model Networks by Computer Simulations
Abstract
The gel point of end-linked model networks is determined from computer simulation data. It is shown that the difference between the true gel point conversion, , and the ideal mean field prediction for the gel point, , is a function of the average number of cross-links per pervaded volume of a network strand, , and thus, contains an explicit dependence on junction functionality . On the contrary, the amount of intra-molecular reactions at the gel point is independent of in a first approximation and exhibits a different power law dependence on the overlap number of elastic strands as compared to the gel point delay . Therefore, cannot be predicted from intra-molecular reactions and vice versa in contrast to a long standing proposal in literature. Instead, the main contribution to for arises from the extra bonds (XB) needed to bridge the gaps between giant molecules separated in space and scales roughly . Further corrections to scaling are due to non-ideal reaction kinetics, composition fluctuations, and incompletely screened excluded volume, which are discussed briefly.
Introduction
Polymer networks and gels are materials that have reached a wide range of applications ranging from car tyres to drug delivery, removal of pollutants, artificial muscles, or stretchable electronics 1, 2, 3, 4. One point of major interest for theory, processing and application is the exact location of the gel point 5, 6, since there, the reacting liquid turns into a solid. The properties next to the gel point are well understood for critical percolation and mean field models as a function of the distance to the gel point. The prediction of the percolation threshold or the gel point itself remains a challenging problem for theorists 7, 8, 9, 10. Typically, the classical Flory-Stockmayer (FS) theory 11, 12 or an equivalent mean field model 13, 14 is taken for a first estimate based upon an ideal system whereby both intra-molecular reactions prior to gelation and the positions of the reacting molecules in space are neglected. Previous generalizations of the FS theory 15, 16, 17, 6, 18, 19, 20, 21, 22 focus essentially on corrections due to intra-molecular reactions (“loops”), since the self-contacts of random walks or branched polymers in semi-dilute solutions are well understood. The impact of the spatial arrangement of the reacting molecules on the position of the gel point was essentially ignored in literature due to the lack of an analytical approach that allows for a quantitative treatment of this point.
One remarkable result of these models (mean field + loop correction) is that the latest variant of it 22 seems to work even for overlap numbers around one and below, which is in the core of the critical percolation regime or even requires diffusion of the molecules to allow for network formation. On the contrary, there is a number of simulation works 23, 24, 25, 26, 27, 28 (see section “Numerical studies in literature” of the Appendix for a more detailed discussion) that indicate that the loop correction might not be sufficient to explain the delay of the gel point for overlap numbers clearly above one. These works, however, could be criticized, since network formation was modeled either without diffusion of the reactive species 23, 24, 25, 26, or analyzed only indirectly 27, or some inconsistency among the data is apparent 28. Nevertheless, the simulation studies 23, 24, 25, 26, 27, 28 are in line with the scaling model of percolation, where the hyperscaling relation connects the fractal dimension of the branched molecules to space dimension 8: extra reactions are necessary to bridge the gaps between the separated giant molecules just below the gel point. This is not accounted for in the mean field models. It should be observable as a gap between the conversion at the true gel point and a mean field estimate for the gel point were corrections due to intra-molecular reactions were considered.
Using the jargon of percolation, the gelation of -functional stars (GS) - or equivalently, the end-linking of -mers through functional junctions - is a non-nearest neighbor percolation problem of almost randomly distributed sites with limited “valence” (the junction functionality ). Originally, any kind of non-nearest neighbor percolation problems was termed “long-range percolation” 29, 30, 31, 32, 33, 34. This nomenclature has partially changed in recent years, since a distinction among qualitatively different “long-range” models could be made. The general finding is that an exponential cut-off or a hard range limit for the bonds maintains a window of critical percolation next to the critical point. However, the range of conversion where critical percolation can be observed might be rather narrow, if a large number or neighbors can be reached 35. Therefore, it was speculated that the narrow range of conversions with critical properties may not be accessible experimentally 31. This motivated to estimate the gel point delay by mean field arguments, also, since it was shown that the size distribution of the smallest loops near the gel point follows mean field statistics 36, 22.
Nevertheless, GS falls within this class of “short-range” problems, since the end-to-end distribution of the bonds (the polymer strands) is characterized by an exponential decay. Power law decays for the bond length distribution can lead to a short range behavior, to a small-world behavior for a certain window of power laws depending on space dimension, or to a true long-range behavior, which is mean-field like on all scales 37, 38. A limited valence of the nodes has no effect 39, 40 on the critical behavior once , but affects certainly the location of the critical point. Thus, the general applicability of percolation to model GS in the vicinity of the gel point is out of question and has been corroborated by more recent works on percolation within a range 41, 42, 43 (some newer works call this type of problems “medium-range percolation” 43 or “equivalent neighbor percolation” 41).
Nevertheless, there are several points that are different in GS as compared to the percolation problems that were studied previously:
-
1.
Reactions between molecules occur based upon a diffusion reaction mechanism. The applicability of critical percolation approximation requires that diffusion effects are not important.
-
2.
The position of network junctions couples to the local polymer density once these become connected to chains. Composition fluctuations arise for cross-linking at the present of a solvent or if different chemical species are linked together to form a network (e.g. chains and junctions). These composition/interaction effects can introduce a second characteristic length scale that may affect the scaling in the vicinity of the gel point.
-
3.
The number of accessible junctions depends not only on range (here given by degree of polymerization, chain stiffness, and solvent quality) but also on the junction functionality, polymer volume fraction, and the stoichiometric ratio of reactive groups on junctions vs. reactive groups on chains.
Indeed, kinetic gelation is one example where the diffusion reaction mechanism dominates the behavior and causes a different universality class as compared to critical percolation 44. Similarly, diffusion limited cluster aggregation is a different universality class 45 and would become relevant once the overlap number of stars drops below one. For sufficiently large overlap numbers it is expected that diffusion becomes unimportant in the close vicinity of the gel point, since the behavior of the system is dominated there by the largest molecules, which diffuse extremely slow because of the high viscosity next to the gel point. What is not accounted for in this discussion is that the local dynamics and accessibility of the nodes depends on the number of attached chains. Thus, bonds are no more inserted randomly into the system, instead, nodes with a smaller number of existing connections exhibit a higher rate of bond formation. We analyze this point in the appendix and correct the mean field estimate for the critical point accordingly.
The second point above is suppressed to a significant extent by analyzing network formation in good solvents or melts. Also, the homo-polymerization of stars instead of a co-polymerization of junctions and chains or stars of two different types is preferable here. In the best possible case (homo-polymerization of stars), the length scale at which the local concentration of the nodes couple to a constant polymer density is comparable to the size of the network strands and thus, irrelevant for the behavior in the vicinity of the gel point. Nevertheless, it is certainly of interest to analyze the impact of statistical fluctuations in composition in case of end-linking reactions, since end-linking reactions are the literature standard for gelation studies of model networks. This point is also of relevance for high conversions, since composition fluctuations freeze in during the cross-linking reaction 46.
The third point is explained best when comparing the average number of possible neighbors to which a node can connect in typical percolation studies with GS. In bond percolation were bonds are introduced within a range , the number of neighbors is typically a constant number of roughly , where is the number density of nodes. On the other hand, the corresponding overlap number of junctions for the simplest case of GS homo-polymerization of monodisperse stars with Kuhn segments per arm is given by
| (1) |
Here, is the average extension of the network strands that depends on the number of Kuhn segments, , the root mean square size of a Kuhn segment, , and the solvent quality. is the polymer volume fraction and a rough estimate for the occupied volume of a Kuhn segment. Thus, is an explicit function of the valence in case of polymer gelation in contrast to typical long range percolation studies, where the number of bonds can be up to .
The above points and the question whether the gel point can be estimated by a consideration of intramolecular reactions is addressed with our publication. We simulate explicitly the dynamics, conformations, and reactions of the molecules that form the network in space to remove the limitations of previous simulation studies. We determine intra-molecular reactions and the position of the gel point. On this basis, we demonstrate that the delay of the gel point is not controlled by intra-molecular reactions. We show that the dominating contribution is due to extra bonds (XB) that are necessary to bridge the gaps between the giant molecules. We discuss corrections that arise due to a different mobility of the reacting species, due to composition fluctuations, and due to incompletely screened excluded volume. Furthermore, we provide examples how the delay of the gel point could be analyzed with more detail in the experiment.
Computer Simulations
For our study, we use the Bond Fluctuation Model (BFM) 47, 48, which is a well known lattice based Monte-Carlo method that has been used frequently to simulate polymer model systems 49, 50, 51, solutions 52, 53, membranes 54, melts 55, 56, or networks 57, 58. In this simulation method, chains are represented by a connected set of small cubes that resemble the monomers of the chain. Monomers are connected into chains (and later: to network junctions) through a discrete set of 108 different bond vectors. Monodisperse melts made of chains with a degree of polymerization were equilibrated by random jumps of the monomers under the constraint that all bonds remain within the allowed set of bond vectors. All simulations were run on a lattice of lattice sites with periodic boundaries. A stoichiometric amount of network junctions are also modeled by small cubes and are added at random positions to the melt of chains such that approximately monomers occupy a volume fraction of of the lattice sites, see Table 1 for the simulation parameters. This volume fraction is standard for the simulation of dense systems like melts or networks using the BFM 59, 60.
After equilibration of the reaction mixture, end-linking reactions were turned on while chain monomers and junctions perform a stochastic motion inside the reaction bath. Whenever a free chain end was in one of the nearest neighbor positions to a junction that was not yet completely reacted, a bond was introduced between both. The chain end is then bound to the junction and the number of possible further reactions of the junction is reduced by one. 100 statistically independent samples (by initial positions of cross-links and chain conformations) with the same simulation parameters were created and subsequently linked into networks in order to improve statistics. Note that our simulations explicitly model a diffusion collision mechanism in space to simulate reactions. This is different to the random insertion of bonds either between spatially correlated neighbors as in percolation studies or only correlated within a single molecule as in recent mean field work 22.
Mean field estimates of the gel point
The ideal reference for the gel point of our end-linked model networks is 14
| (2) |
and the delay of the gel point conversion with respect to is quantified below as . The power of in the above equation results from the two bonds at both chain ends that are necessary to link the -functional junctions.
intra-molecular reactions in the reaction bath are determined by counting the number of connected components, , the total number of bonds, , between initial molecules with a total number of . Then, the cycle rank (total number of independent circuits in the graph)
| (3) |
provides the total number of intra-molecular reactions in the reaction bath61. It has been argued by several authors 11, 15, 16, 17, 6, 18, 19, 20, 21, 22 that the formation of finite loops (intra-molecular reactions) controls the displacement of the gel point with respect to , since each intra-molecular reaction diminishes the number of branching reactions by one. Thus, we estimate the shift of the gel point due to intra-molecular reactions, , with respect to the total number of possible reactions, , through
| (4) |
Then,
| (5) |
provides a self-consistent mean field estimate for the gel point, , that is corrected by intra-molecular reactions.
Below, we will see that such a self-consistent approach underestimates cyclization at the true gel point. Therefore, the data in Table 1 were collected at the true gel point as determined by the onset of a non-vanishing modulus. The data for a self-consistent determination of are included in Figure 4 for completeness and available with high accuracy through the fit of the corresponding data.
| 3 | 8 | 80653 | ||||||||
| 3 | 16 | 41942 | ||||||||
| 3 | 32 | 21398 | ||||||||
| 3 | 64 | 10810 | ||||||||
| 4 | 8 | 61680 | ||||||||
| 4 | 16 | 31774 | ||||||||
| 4 | 32 | 16130 | ||||||||
| 4 | 64 | 8128 | ||||||||
| 6 | 8 | 41942 | ||||||||
| 6 | 16 | 21398 | ||||||||
| 6 | 32 | 10810 | ||||||||
| 6 | 64 | 5433 |
Each intra-molecular reaction creates a cyclic structure inside the network (“loop”). We have analyzed loop size distributions in section “intra-molecular reactions” of the Appendix. Our results show that the size distribution of loops is in a good approximation next to the true gel point, where is the number of precursor chains that establish the loop. In consequence, we expect that the total amount of loops at the gel point is independent of up to minor corrections for smallest , since a dependence refers to a mean field gel point where there is in average exactly one path to the infinite gel in the limit of large (see also equations (20) to (24) of Ref. 36 or equation (A2-44) of Ref. 62). A mean field scaling for the short range statistics is expected for overlap numbers and has been found previously in non-nearest neighbor bond percolation 32, 63.
A rough estimate of the generation at which a cross-over to critical percolation is expected can be made through the Ginzburg criterion. Let us introduce the relative extent of reaction,
| (6) |
as a measure of conversion with respect to the conversion at the true gel point, . According to experimental data 64 for (same as in Figure 8), the value of at the cross-over to critical percolation, is , which provides for the data of Figure 8. We expect mean field scaling up to this average number of strands . The amount of loops in generations contributes only a minute portion to the total number of loops in the range of 1-2% depending on whether mean field or critical scaling is assumed for the loop size distribution. Thus, the total amount of intra-molecular reactions is rather accurately estimated by adopting a mean field model for the loop size distribution in the vicinity of the gel point. We further note that our simulation results for represent formally an upper bound for macroscopic systems, since a minute part of cyclic structures is closed through the periodic boundary conditions (finite size effect). These artificial giant loops involve of order segments and thus, loops with chains, which yields a contribution to below the statistical error. Therefore, finite size corrections can be ignored for .
In a more general form, the width of the percolation regime for long range percolation can be estimated 35 as a function of the number of possible reaction partners
| (7) |
The width of the critical zone refers to a relative extent of reaction in the range of (after dropping coefficients of order unity and using equation (1))
| (8) |
This leads to the well known result of for melts with and , but indicates also that .
A second possible deviation from mean field results from a different mobility and accessibility of junctions (and eventually chain ends) as a function of the number of existing connections to other molecules. In similar manner, concentration fluctuations of junctions and chain ends may affect the distribution of connections of the molecules. In consequence, this connectivity distribution is no more a binomial one, which we indeed observe in our simulations, see section “Unequal reactivity” of the Appendix. This difference to the ideal case can be considered within a mean field approach by mapping the system to a co-polymerization of junctions and chains with functionality distributions that equal the distribution of the number of connections at a given conversion as described in more detail in the Appendix. Let denote the weight average number of connections among the junctions and the weight average number of connections of chains. Then, the gel point reflecting the non-ideal distribution of connections is 13 the conversion where for the stoichiometric systems of our study. This condition is determined numerically from the simulation data and given in Table 1. The corresponding mean field estimate for the gel point that reflects both non-ideal reactivity and intra-molecular reactions is given in good approximation by , see Table 1.
For all networks of our study, the impact of lower accessibility and mobility of junctions causes a smaller next to the gel point as compared to the binomial reference case. On the contrary, seems to be dominated by concentration fluctuations as the portion of chains with two connections increases quicker than . In total, most of these two competing corrections compensates each other and causes only a small shift of the estimated gel point towards lower conversions, . Thus, is an upper bound for a mean field estimate with corrections due to intra-molecular reactions. This observation holds for all samples of our study and indicates that composition fluctuations are more relevant than mobility or accessiblity of the reactive groups, at least for the low of our study. Furthermore, we have to point out that our simulations were performed in the diffusion controlled regime where the impact of mobility is expected to be largest. Experiments are typically reaction controlled. Thus, a quantitatively larger shift of towards lower conversion can be expected, in particular, since our simulations refer also to the limiting case of a perfect mixture. Based upon this observation, we recommend that experimental tests of theory should be conducted with a homo-polymerization of -functional stars as model systems, since this architecture diminishes the impact of a different mobility as only chain ends react. Also, concentration fluctuations of reactive groups are suppressed to a length scale comparable to the size of the stars, if reactions are conducted in a sufficiently good solvent or in melt.
Gel point estimate based upon phantom modulus
The gel point can be determined from the onset of a non-vanishing equilibrium modulus of the networks. In the vicinity of the gel point, the phantom contribution to modulus dominates the elasticity 65. We analyze the phantom modulus as suggested in Ref. 66 by considering that each chain is an ideal elastic spring of stiffness . This direct determination is preferable as compared to counting the cycle rank, since the elastic contribution of a network cycle depends on its size and embedding into the network structure 67, 68, 69, 70: network strands in small loops (by number of strands) contribute in average less to modulus than strands in large loops. The classical limit is reached for loops made of an infinite number of strands (infinite tree approximation). The origin for this difference is that the extension of a strand of segments within a cyclic polymer of segments is in average smaller than in its linear counterpart. Since modulus is the free energy change with respect to elongation, it is the time average size of the strands that determines the contribution to modulus (and not only network connectivity as assumed when considering the cycle rank) 68, 70. Qualitatively, this behavior is somewhat similar to the behavior of de-swollen gels 71 where the reduced chain extension in the dry state causes a significant reduction of modulus as compared to gels that were prepared in the dry state.
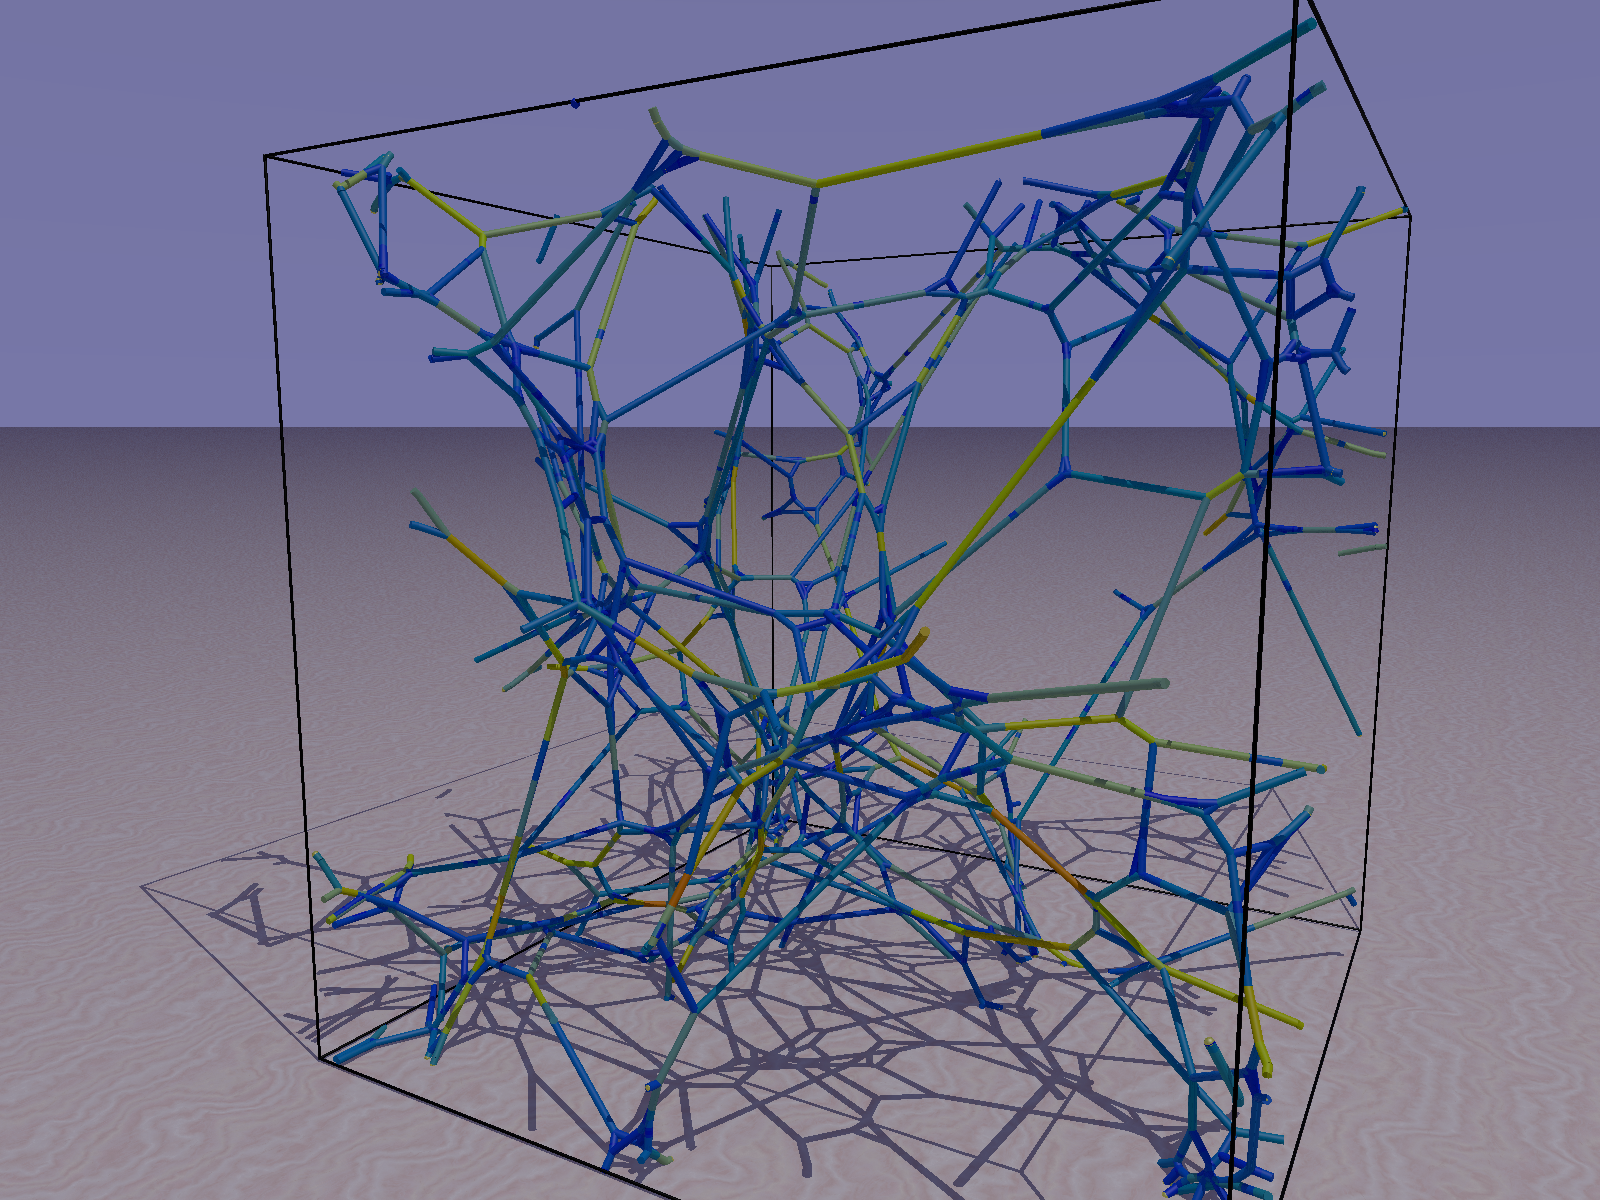
For a network of ideal springs, the ground state is determined numerically by considering a simultaneous force balance at all junctions. Below, the gel point, the ground state refers to a collapse of the structure into a single point. Above the gel point, the periodic boundaries of the sample prevent this collapse and a non-zero size of the springs is obtained. An example for the force balance condition to determine modulus is shown in Figure 1 for a network with parameters and at . Finally, the resulting elastic energy density within the samples is averaged over the 100 copies of equivalent networks to determine the average phantom modulus of the samples.
In the scaling model of gelation, it is expected that phantom modulus grows in the vicinity of the gel point as a power law
| (9) |
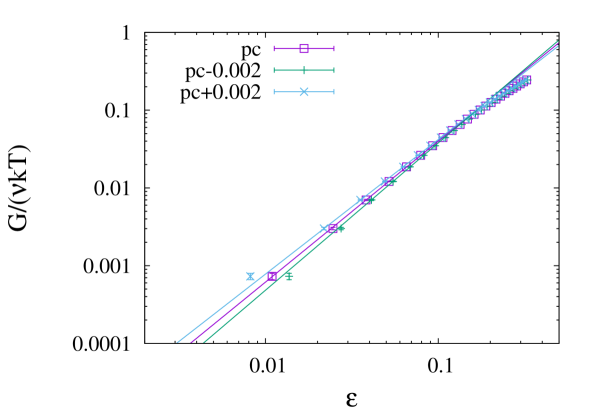
In order to detect the gel point, we vary in steps of and fit all data with a modulus in the range to a power law . Here, is the maximum modulus at maximum conversion. The boundaries for the fit serve to reduce noise effects at the lower bound and to exclude the cross-over to mean field at large . The gel point is identified as the conversion with the lowest deviation to a power law dependence in the above range with focus on smallest values and denoted below as . Typically, a clear power law dependence over one and a half decades is found for the smallest values for a narrow range of conversions with a width of approximately around the “gel point”. Figure 2 shows a typical example for the detection of this plus two examples with a slightly deviating estimate for the gel point. The exponent is taken as an adjustable parameter and fit to the data. The results of these fits for and are summarized in Table 1.
For mean field, is expected 72 in agreement with scaling predictions for 6 dimensions. For critical percolation, one expects for according to 73, 74, 75 that there is approximately . Estimates for the exponent that describes the divergence of the correlation length were originally 76 about , while more recent renormalization group estimates or simulation data provide slightly lower values of or respectively 77. The exponent describes the divergence of the resistance of the links when approaching the gel point. It was previously assumed 74, 78 that is close to one for , which has been confirmed by more recent renormalization group estimates that yield 77 and by numerical data 79 with . Literature values of experimental or simulation data for are largely scattered in the range of 78, 76 . Our results for range from 1.69 to 1.95 with an average of , which is in rather good agreement with critical percolation, in particular with renormalization group estimates for all contributing exponents, which yield .
The positions of the gel points are all well above the estimates based upon intra-molecular reactions, , and do not agree with these within the error of the analysis. Note also that gel points like are underestimated systematically in finite samples as shown, for instance, in Figure 1 of 78. Therefore, our results for are lower bounds for the gel points of macroscopic samples. Since finite size effects can cause only a systematic enlargement of (extra loops through periodic bounds, see the preceding section), also the observed gaps between and are lower bounds for the equivalent data of macroscopic samples.
Gel point estimated based upon weight average molecular weight
As a second estimate for the gel point, we analyze the weight average degree of polymerization of the soluble molecules, . Theoretically, a dependence of
| (10) |
is expected, with best estimates for the exponent of (3rd order expansion 80), (from series expansion of the cluster size distribution 81), or (Monte-Carlo data by R. M. Ziff and G. Stell 81, 82, 77). Experimental data fits to exponents in the range of 76 . For mean field, the corresponding exponent is .
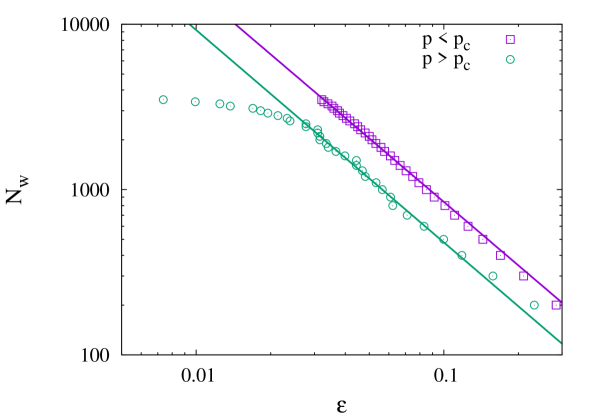
The gel point estimate and exponent is determined from data as suggested in Refs. 83, 84, 44: we plot simultaneously the reduced (excluding the largest cluster 44, 23, 85, 86, 58, 22) above and the total below as a function of and shift such that the steepest decay111For our simulations, there is a cross-over to mean field at large (because of large overlap number of junctions) and a cross-over of the branch to saturation due to finite size at , which is the reason why only the steepest decay can become linear on a log-log plot. of both branches shows the same slope. The resulting estimate for is denoted by for a better distinction from other estimates and summarized in Table 1. The exponent including the error estimate from the fit is given also in Table 1. had to be adjusted with four digits accuracy to achieve parallel upper and lower branches of , however, there is typically less than one order of magnitude in where the data appears to be linear on a log-log plot, see Figure 3 for the “worst case” example where deviates most from the prediction of critical percolation. In comparison, the modulus data is linear on a log-log plot for typically one and a half decades. Therefore, we expect that should be more accurate than for our data in contrast to typical percolation studies, where is considered as the best estimate 83. Accordingly, we expect also a somewhat larger error for of as compared to in contrast to the four digits accuracy to parallelize the steepest decays of both branches of .
The average difference between both gel point estimates is and thus, below the cumulated error of both estimates, which confirms the consistency of our analysis. Note that this difference is about one order of magnitude smaller than the observed smallest gap between and our estimates or . Therefore, the observation of this gap is significant and we present below an analysis of the scaling of the gel point based upon that we consider as our best estimate. Nevertheless, an additional test using is included in Figure 6 and 7, which confirms in each case the observed scaling of within error bars.
For our finite simulations, a between mean field and critical percolation is found, with the tendency that smaller samples and samples with a higher overlap number are closer to the mean field prediction. This is a typical observation for finite samples within medium-range bond percolation problem 42, since the number of independent volumes in one direction scales as , where is the lattice size and the range of the bonds. For , one reaches the mean field limit as bonds can be introduced between any pair of nodes, while for , one arrives at the classical bond percolation limit. Our simulation data spans only a rather small range of and the error for is rather large such that a detailed analysis of the cross-over scaling is not much meaningful.
The ratio of the coefficients of the two power law fits below and above the gel point, , is also provided in Table 1. For this ratio, a value of is expected for percolation in three dimensions while kinetic gelation provides with the possibility that in the limit of mean field (diverging overlap number) 44. A similar tendency is found for the ratio that tends towards unity when approaches one while it is largest for the samples with largest . However, a more detailed analysis of as for the cross-over scaling of the exponents is not possible within the limited data of the present study and subject of ongoing research.
Scaling of the gel point shift
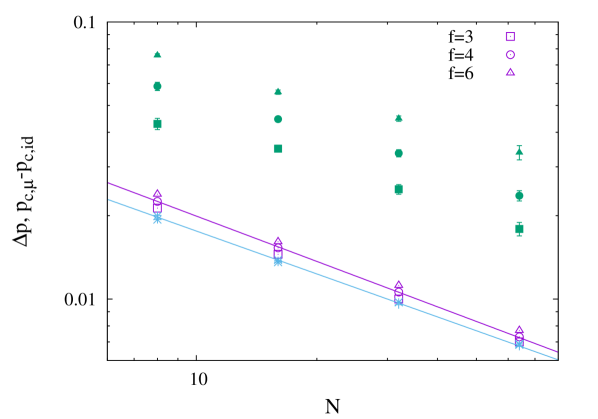
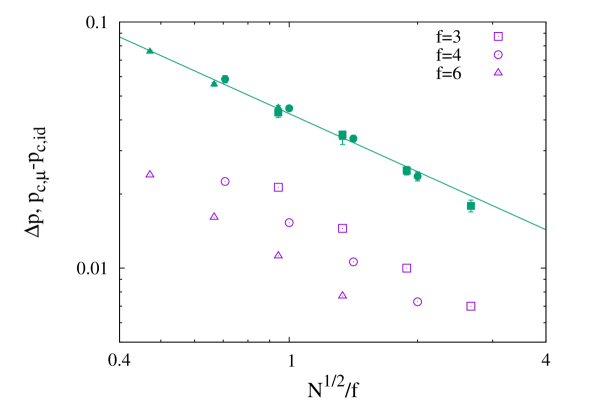
The first goal of the present paper is to demonstrate that the true gel point does not overlap with estimates based upon intra-molecular reactions. Therefore, we take as our best estimate for the true gel point and compare with the upper bound for a mean field estimate with a correction for cyclization, in Figure 4. The data are plotted as a function of in order to check whether the shift of the gel point scales with the overlap number of elastic strands in melt as proposed in mean field models. This is observed indeed for the data but not for the true gel point shift . According to the above discussion and section “intra-molecular reactions” of the Appendix, it is expected that the amount of intra-molecular reactions is independent of in a very good approximation, which is demonstrated by the excellent collapse of the data for the self-consistent determination of in Figure 4. This is in line with older models for the gel point shift, for instance Refs. 16, 17, 20 but disagrees with more subsequent work, for instance Refs. 87, 22.
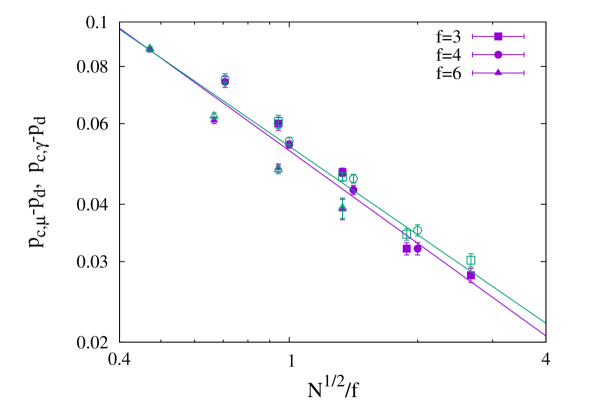
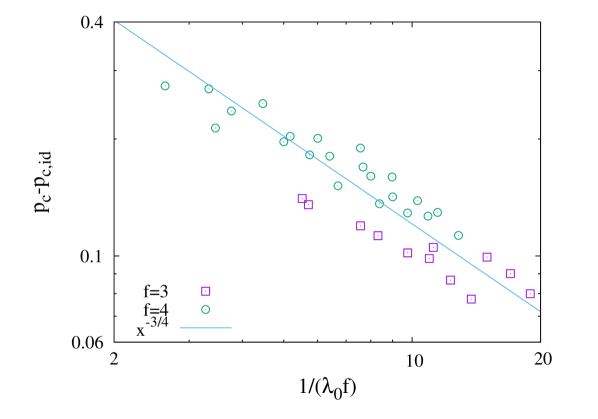
The second interesting observation of Figure 4 is that is neither in quantitative nor in qualitative agreement with and is indeed an explicit function of (similar results are found for ). In a recent paper on a two-dimensional long range percolation problem, it was shown that the shift of the gel point with respect to mean field (for small deviations from mean field) is a power law function of the number of accessible neighbors 42. We expect a similar behavior in three dimensions based upon the overlap number of sites (cross-links) . Indeed, a collapse of the data are obtained for a scaling variable for our cross-linked melts, see Figure 5.
An overlap of the data as a function of the overlap number of chains has been emphasized previously 22 and was proposed in other models on the gel point shift 16, 17, 18, 88 due to the expected dependence of on as discussed above. However in Ref. 22, only data with were analyzed. Therefore we compare in section “Experimental gel point data” of the Appendix the gel point data of several studies for networks made of similar chemistry but different . Unfortunately, the available experimental data are not fully conclusive, since not all data show exactly the same trend. Nevertheless, the common result is that any set of data exhibits clear power law dependence for the observed delay of the gel point. The data for the PDMS systems in 88 is in excellent agreement with the proposed dependence on , while there is only fair agreement in this respect for the PU systems as discussed in the Appendix. Cail and Stepto 88 point out that the mean field prediction for the amount of loops underestimates the real shift of the gel point by a factor of four to seven (a factor of two to five for our simulation data). Therefore, neither for these experimental data nor for our simulations, there is a quantitative match of the gel point shift with the amount of intra-molecular reactions at the gel point.
In general, there is for networks prepared in semi-dilute solutions with theta solvents and in good solvents using standard scaling relations for in both cases 8. Here, we used for the “dry” volume of the polymers and for the volume of the solution at preparation conditions. Note that the scaling is only asymptotically correct, since corrections to polymer size due to an incompletely screened excluded volume 89 are neglected above. Furthermore, we have to restrict our discussion to the case of in order to avoid a significant impact of diffusion as discussed in the introduction. A fit of the data shows that the shift of the gel point scales as with a power . Note that data at the same but different refers to samples containing a different number of junctions, since all samples were simulated in a box of size lattice units. Since these data superimpose for our scaling variable, we do not expect a dramatic effect of finite size corrections for our gel point estimates.
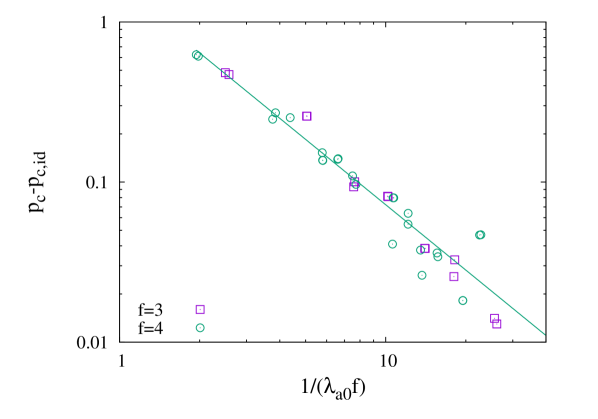
The above analysis is equivalent to raw experimental data where no corrections to scaling have been considered. Figure 6 contains a more accurate analysis that corrects for unequal reactivity and composition fluctuations by relating the true gel point to instead of . On experimental side, a similar analysis could be conducted using network disassembly spectrometry (NDS) 90 next to the critical point. As a result, we obtain a slightly smaller close to . Recall that for our samples, since the corrections are dominated by composition fluctuations. Therefore, a larger from experimental data on end-linking of model networks as compared to an apparent can be taken as a possible indication of imperfect mixing. Indeed, this discussion is supported by experimental studies, see section “Experimental gel point data” of the Appendix for more details. In brief, the exponents that one obtains from the data of Refs. 91, 92, 88, 93, 94 as a function of the chain overlap number ranges from up to . In several cases where large exponents are fit to the experimental data, the authors of the original works mention systematic deviations from other studies and suspect unequal reactivity or mixing problems to be the reason for these changes.
So far, we have only considered the total delay of the gel point. Clearly, if one introduces a new bond into the system, this bond either connects two nodes of the same cluster or two nodes of different clusters. Thus, the contributions of intra-molecular reactions and XB to the gel point delay are disjoint and we can single out the XB contribution by analyzing . In this respect, we have to mention that intra-molecular reactions are by far more important for GS as compared to percolation when comparing data for systems with the same number of neighbors. The reason for this difference is that loops with can be formed in GS, which are typically forbidden in bond percolation models. Since the size distribution of loops decays quickly as , this yields almost one order of magnitude more intra-molecular reactions for GS as compared to percolation problems with a similar number of accessible neighbors. Thus, if XB is the main source for a shift of the critical point away from the mean field gel point in percolation problems, one must not neccessarily expect the same for polymer gelation.
Above, we have not accounted for long range bond correlations that lead to an apparent swelling of chain size 95, 60, 89. This can be corrected by including more accurate estimates for the size of the chain end-to-end vector in equation (1), see for instance, equation (7) of Ref. 89 with the corresponding corrections for our simulation model. In effect, the consideration of non-ideal chain conformations stretches and shifts the data along the -axis, which causes a smaller exponent . A qualitatively similar correction is obtained when subtracting , since decays quicker than , see Figure 4. If both corrections are applied, the exponent is reduced from to . Further reduction of the exponent results from plotting the data as a function of the number of accessible neighbors, , in order to introduce the same abscissa as in percolation studies ( is the equivalent of the coordination number of the lattice). These modifications lead in total to (based upon modulus data), see Figure 7. Note that similar corrections can be included when analyzing experimental data, since the size of the molecules can be measured and is also accessible through NDS 90.
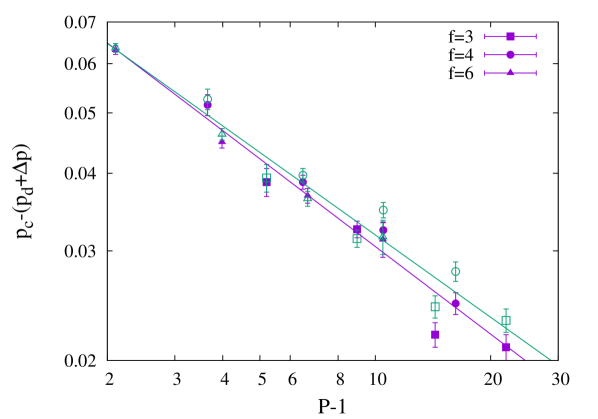
Figure 7 still does not indicate a large systematic shift of the data for samples with a different number of nodes (data at same but for different ). This supports our proposal that finite size corrections will not lead to a dramatic modification of . A more detailed finite size analysis with an exact determination of the exponent requires samples of a range of different sizes. For this purpose, we currently develop a specialized simulation approach for our particular bond percolation problem as part of ongoing work. Quantitatively, we expect a weak increase of , since finite size effects lead to an underestimation of , whereby this underestimation is larger for samples with a smaller ratio (i. e. larger and larger ). Thus, should be considered as a lower bound for the true exponent of macroscopic samples.
Below, we devlop a rough idea where one could expect the exponent from theoretical side by comparison with recent work on “long range” percolation, Ref. 42. In this work, is the number of accessible neighbors in the percolation problem, where is the range up to which bonds can be formed and is the space dimension. Our quantity of interest, , is approximately in Ref. 42 and we follow the discussion around Figure 13 in Ref. 42. Note that conversion (and thus, ) is normalized in Ref. 42 to the maximum possible number of bonds per node, which is . In contrast to this, the maximum number of bonds is in GS and depends neither on nor . The second, more subtle difference between GS and long range percolation is that the bonds (the polymer molecules) fill space for GS, while the nodes fill space for the percolation problem. Thus, there is and both, the range and the overlap number scale with in GS. Thus, for GS while in percolation problems.
In order to derive an estimate for , let us assume that for sufficiently large , the differences between a finite fixed and a node valence that grows are not largely relevant at , since next to the mean field critical point. Furthermore, rescales density for GS by a constant factor and thus, the number of neighbors that corresponds to is the key variable for scaling. Then, let us parametrize the neighborhood of the MF fixed point (the limit of ) with a temperature variable and a range parameter such that these variables rescale as and under a scale factor . The exponents and are the effective mean field renormalization exponents next to the mean field fixed point 42. for renormalizes the “temperature scale” (this exponent is equivalent to where is the exponent that describes the divergence of the correlation length in percolation problems) 42 and (for ) 96 renormalizes an inverse interaction range. Note that we have kept the notation of Ref. 42 for a better comparison with revious work and readers should not get confused by an index (temperature plays no role for percolation). In fact, the discussion in Ref. 42 makes use of general results for the -state Potts model that were obtained within the Ising class where temperature is the key variable, but apply also for the percolation problem , see Ref. 42 for more details. For classical long range percolation problems, there is in the mean field limit with . Therefore,
| (11) |
in 3 dimensions. By analogy, we approximate (ingoring small finite loop contributions). We further identify . Given that this analogy and identification are correct, we obtain
| (12) |
with as the exponent for the XB contribution (finite correction beyond finite loops) to the delay of the gel point in macroscopic samples.
Our lower bound estimate agrees well with this rough estimate even though and are far from the asymptotic limit. Also, the difference between both estimates is sufficiently small to agree with the proposal of a weak impact of finite size on that we made above. However, there is still the possibility that finite corrections compensate significant finite size corrections, which we cannot disentangle based upon our limited set of data. Additional simulations on the percolation problem that is equivalent to GS will help to clarify the above proposal of and are part of ongoing work.
One interesting aspect of our discussion is that the width of the Ginzburg zone grows quicker towards smaller as compared to the gel point delay, . Such a qualitative trend allows to accommodate the requirement of extra bonds due to both XB and loop formation within the Ginzburg zone for a significant range of (several orders of magnitude in ), since the coefficient for is of order unity 97, while the coefficient of XB is . Therefore, we expect that may apply for virtually all experimental data. Loop formation may dominate over XB corrections only in the limit of , see Figure 7, where the percolation model breaks down anyways. Conversely, we infer that the width of the Ginzburg zone provides a natural upper bound for , thus, . Since the gel point must be located within the Ginzburg zone, a cross-over of to this upper bound may be enforced at very large . Altogether, our estimate for , the simulation results at the available limited , and the known scaling of the Ginzburg zone are not in conflict for the parameter range of interest, .
Summary
We have demonstrated that the position of the gel point cannot be estimated by considering intra-molecular reactions as the only correction to mean field, even though cyclization is well approximated by mean field. Instead, the largest contribution to the gel point delay is due to the extra bonds (XB) required to build the connections between the non-overlapping giant molecules. Our data and discussion indicate that this XB contribution decays roughly as in contrast to the contribution of finite loops, which decays approximately as for large junction overlap number . Beyond these two main contributions, there are corrections due to composition fluctuations and unequal reactivity, non-ideal chain size, and due to the transition from junction overlap number to number of neighbors . Finite size corrections are likely to contribute only little to scaling, since we observe no large shift of the different data at same but different . Some of the corrections (unequal reactivity and composition fluctuations) could be avoided by analyzing the homo-polymerization of -arm star molecules as model systems. Other corrections like non-ideal chain conformations and contribution of small cycles are accessible through additional measurements, which allows to repeat our analysis with experimental data.
Acknowledgement
We thank the ZIH Dresden for a generous grant of computation time and the DFG for funding Project LA2735/5-1. We further thank Y. Deng for stimulating discussions on medium range percolation.
Appendix
Intra-molecular reactions
Loops (cyclic structures in the reaction bath) are analyzed using a spanning tree approach 61 to assure that no loop is counted twice and that their total number equals the cycle rank . It has been shown by computer simulations 36 that the frequency of finite loops made of precursor polymers scales at the gel point approximately as predicted by mean field 62, 20
| (13) |
Note that within the mean field approximation, the expected average number of junctions in generation apart from a given junction is exactly unity at the gel point independent of junction functionality . Thus, also the total amount of loops next to the gel point is independent of in a good approximation, see Figure 4. Note that integration over the ideal reaction rate, equation (20) of Ref. 36, up to the gel point, turns the dependence for the return probability of a random walk in dimensions to for the (mean field) loop size distribution at the gel point. In case of excessive loop formation, the above power law may not be reached for the smallest , see also equation (A2-44) of Ref. 62.
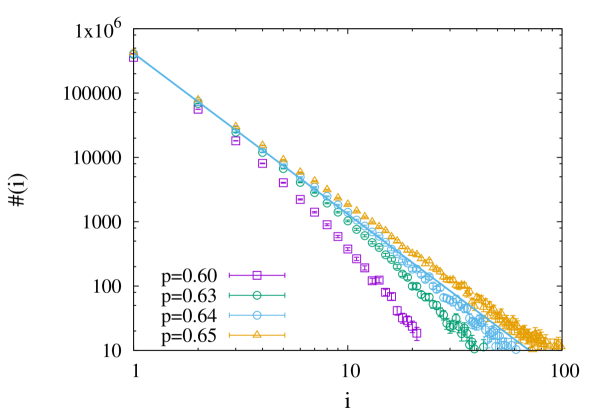
Loop formation is not excessive for our simulations and the proposed power law is reached in a good approximation between a conversion of and , see Figure 8. But according to Table 1, the data at of Figure 8 refers to the gel point as estimated from intra-molecular reactions, . In contrast to this, the loop size distribution at is typical for , where a cut-off for the size distribution near a finite reflects the average number of strands between pairs of reactive groups of the characteristic molecule, see section “Mean field estimates of the gel point”. At the gel point, the degree of polymerization of the characteristic molecule diverges and thus, the position of the cut-off shifts towards infinity. In fact, a cross-over to a second weaker power law at large is expected near which is essentially lost in the noise of the data at .
Unequal reactivity
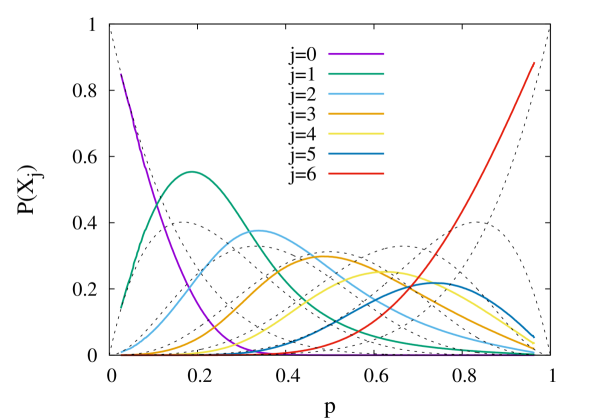
Let us consider systems with a stoichiometric ratio of the reactive groups on chain ends and on junctions. In the mean field model, the reactivity of all reactive groups is identical. The probability that an -functional junction has bonds to chain ends is then described by the binomial distribution
| (14) |
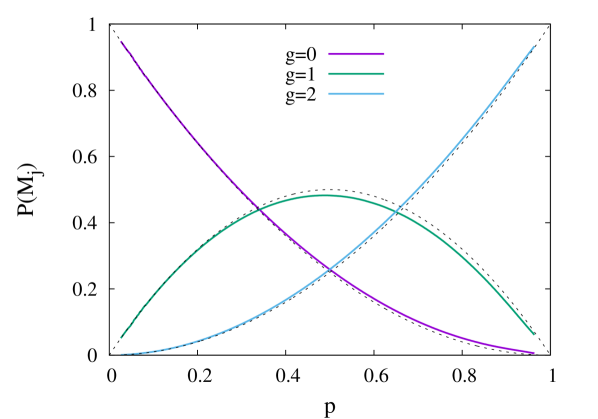
In similar manner, one can compute the connectivity distribution of chains by considering them as two functional units, .
A fully equivalent treatment to this statistical discussion is to consider reaction rates for the rate equations
| (15) |
for and
| (16) |
for and
| (17) |
for (and a similar scheme for chains that are two-functional). Here, is the concentration of junctions with bonds, is the concentration of the reaction partners (the chain ends). By selecting reaction rates one takes into account that there are non-reacted groups per molecule with same reactivity. For stoichiometric systems, one arrives after some algebra (and considering ) at equation 14.
In case of end-linked model networks, the network junctions are less accessible to reactions and less mobile with increasing number of chains attached. Thus, we expect that the reaction rates are no more . Instead, there will be comparatively smaller reaction rates the larger the . Such a behavior leads qualitatively to a quicker decay of and a delay of the increase of as compared to the statistical case, when plotting the corresponding as a function of . Intermediate states will exhibit a narrower peak as a function of .
Copolymerizations are inevitably subject to composition fluctuations of the two species. Composition fluctuations will increase where is convex and will decrease within concave domains as composition fluctuations can be modeled by a spontaneous split of the system into two domains of somewhat larger and smaller conversions (similar to the discussion of the phase behavior of polymer solutions in text books where concentration fluctuations are considered). On a qualitative basis, we expect for dominating corrections due to composition fluctuations that and will be enlarged as compared to the statistical prediction, since these are convex for all , which is the opposite trend as expected from accessibility and mobility.
Both effects discussed above are visible in the connectivity distributions of junctions and chains, see Figure 9 and Figure 10. Junctions are initially single monomers, which react clearly quicker than junctions attached to chain ends. Here, the impact of a different mobility dominates. On the other hand, and appear to be dominated by the impact of composition fluctuations. Altogether, there are siginificant deviations from the ideal case, equation (14). These must be taken into account for an exact mean field estimate of the critical point.
Non-ideal systems are readily mapped onto the corresponding ideal systems by considering appropriate distributions of junction and chain functionality. The experimental data for and at a given conversion are considered to be equivalent to a model system at full conversion with a functionality distribution of junctions and chains that is identical to and . Then, equation (24) to equation (33) of Ref. 13 can be used to compute numerically the “effective” functionalities and of junctions and chains, respectively. The gel point of the equivalent system is given by the condition
| (18) |
since after the mapping of the data and for the stoichiometric systems of our study. The results for the resulting estimate of the gel point, , based upon this analysis can be found in Table 1.
Experimental gel point data
A large number of authors published experimental data on the gel point conversion in the past decades starting with the seminal paper by Flory on gelation 11. Refs. 91, 98, 99, 92, 88, 100, 101, 102, 93, 94 are just some examples from literature. Among these works, we have chosen Refs. 91, 92, 88, 93, 94 as basis for comparison, since the data is presented as (or readily converted into) a function of the so called “ring forming parameter”
| (19) |
that we introduce here only in its simplest possible form for a homo-polymerization of -functional stars. In this case, is the initial concentration of reactive groups and is the concentration of a single reactive group of the star in the vicinity of a selected reactive group of the same star. Thus, is essentially the overlap number of reactive groups within the pervaded volume of the shortest strand that can form a loop. Thus, for reactions in bulk, there is , which allows for a simple qualitative comparison of simulation data and experiment.
In Figure 11, we compare the data of the different PU systems of Ref. 88. The full cloud of data points seems to support an exponent in the range of for the scaling variable while the individual data sets are more in line with a weaker decay as a function of . Furthermore, the dependence on is slightly weaker as for our simulation data. On the other hand, the data of the PDMS systems 1-4, fully overlaps as a function of , see Figure 12, but the exponent for the decay is here , which is clearly stronger than for the PU systems or our simulation data. The authors of Ref. 88 were aware of these quantitative and qualitative differences and suspected mixing problems or side reactions to be responsible for the differences between the experimental data sets. Such problems were in particular pronounced for PDMS systems 5 and 6, which were not included in the plot for this very reason.
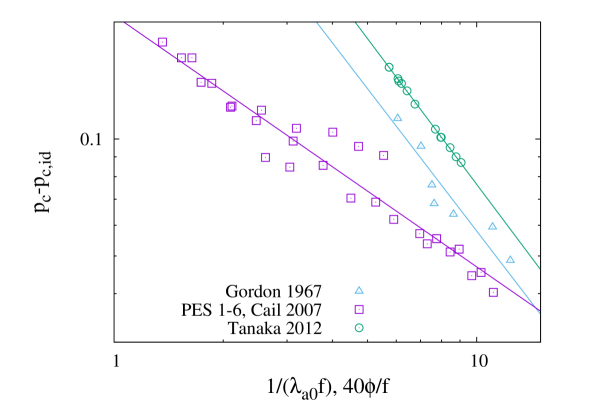
Cail and Stepto 88, Tanaka et al. 93, or Gordon and Scantlebury 91 report more gel point data on different series of samples, see Figure 13. The observed exponents for the decay are , , and respectively, which differ significantly similar to the PDMS and PU systems discussed above. It is worthwhile to mention that unequal reactivity seems to be important for the systems reported by Tanaka et al. 93 where the larger exponent was recognized, which parallels in part the discussion of the PDMS systems in Ref. 88. Also, Gordon and Scantlebury 91 argue that a substitution effect must occur to explain their set of data.
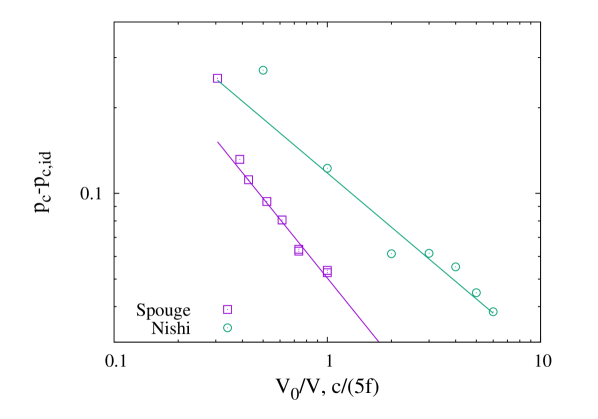
Spouge 92 discusses experimental data on the reaction of adipic acid with pentaerythritol taken from the thesis of Wile 107. When plotting this data as a function of , an exponent of is found when excluding the data at the largest degree of dilution (close to critical dilution), see Figure 14. Recently, Nishi et al. 94 report gel point conversions of a copolymerization of 4-functional stars in the inset of their Figure 3, which we have plotted also in Figure 14. This particular type of reaction suppresses loops made of an odd number of elastic strands 46, and thus, there are no pending loops present in these networks. Nevertheless, there is still a significant delay of the gel point with respect to the ideal gel point at . The data of Nishi fits to a power of when excluding the data point at the lowest concentration (close to critical dilution) from the fit. An effect of unequal reactivity can be ignored for the end-linking of stars where all ends of the arms have the same chemistry and react only once. These exponents are in the range of our simulation data with when using to correct for unequal reactivity and not far from the PU and the PES systems of Ref. 88 with observed exponents for these systems of and respectively. Altogether, the PU and the PES systems of Ref. 88, the data by Nishi et al 94, and the data of Spouge 92 seem to be less affected by unequal reactivity and show similar trends as our simulation data.
Numerical Studies in Literature
The available studies can be split into two major categories depending on whether a) a mean field model is in the core of the analysis and the coordinates of all molecules are disregarded or b) the positions of the molecules in space are taken into account. Our list of examples from literature below is certainly not exhaustive and focuses on polymer specific work. Nevertheless, it should allow for a first idea about the state of the art.
Gordon and Scantlebury 91 use a vector of probability generating functions where loop formation is built in through a set of differential equations in the coefficients of the vector. The numerical solutions of their model are used to interpret their experimental data. This work was criticized later 19, since it does not allow to fit gel point and molecular weight data with the same adjustable parameters.
The kinetic simulation method developed by Somvarsky and Dusek 108 is mean field enriched with Monte-Carlo with an explicit description of cyclization. This allows to obtain higher order molecular weights like . The data of an early publication were quite noisy 109 while a later work 110 contains gel point data that were obtained under a bit artificial model for intra-molecular reactions and steric hindrance. These results are insightful on a qualitative basis, however, a quantitative analysis remains difficult as there is no obvious choice for all exponents.
Only smallest loops were considered in Ref. 111. Rankin et al. 112 compute numerically the gel point shift from a mean field approach where only three membered rings are allowed. In both cases, the comparability with real systems that exhibit a broad distribution of loop sizes is limited.
Pereda et al. 113 use rate equations and a large set of different structures to model the effect of cyclization and unequal reaction rates on gelation. The numerical results show that the combination of both effects may either reinforce or partially compensate each other (depending on the choice of the parameters) even though both alone lead to a delay of the gel point.
The most recent work of the mean field class by Wang et al. 22 claims a quantitative prediction of gel points based upon Monte-Carlo simulation where loop formation is introduced randomly into the growing branched molecules by considering relative contact probabilities inside reactive groups along the molecular structure with a homogeneous (mean field) background of contacts with other molecules. It was found that the frequency of loops decays roughly as a power law in the vicinity of the gel point, where is the number of linear strands per loop. The observed power changes from 2.44 to 2.73 with increasing amount of pending loops and thus, seems to be non-universal, however, such a qualitative change is expected for small in case of excessive loop formation as mentioned in the section “intra-molecular reactions” above. The delay of the gel point was shown to be a function of the overlap number of elastic strands 22 and a theoretical result was obtained where is given as an explicit function of junction functionality . However, the dependence on was not tested since the model was compared only with experimental data for .
Polymer specific simulations on gelation that consider the coordinates of the molecules in space were pioneered by Leung and Eichinger 114. The paper by Shy and Eichinger 84 uses this approach to estimate the position of the gel points. However, the data is not consistent as some gel points for large molecular weight lie below the Flory-Stockmayer prediction despite of a significant amount of intra-molecular reactions and the simulations do not enforce unequal reactivity. Also, the intra-molecular reactions show some unexpected trends (do not extrapolate towards zero for zero conversion; there is more cyclization for as compared to at low molecular weight but less at high molecular weight).
In a subsequent work by Lee and Eichinger 23, these apparant problems were resolved, however, the definition of conversion seems to be based upon the number of connections between two polyoxypropylene tetrols through one hexamethyleen diisocyanate as obvious from equation (8), the results for , or the last two columns of table 3 in their paper (in effect is used as “conversion” where is the true conversion of reactive groups). With this conjecture, all of the presented data becomes self-consistent, agrees to the presented experimental data of Stepto’s group, and shows similar qualitative trends as the data of our work. It is discussed in Ref. 23 (independent of this conjecture) that the intra-molecular reactions are not sufficient to account for the shift of the gel point. Both, the shift of the gel point and the fraction of intra-molecular reactions are in accord with a power law decay as a function of the overlap of the molecules, see Figure 15. The corresponding exponents are and respectively, which are both smaller than and , which were the corresponding exponents of our data, if plotted with the same axes and the same level of corrections as Figure 15.
Simulation data using the model of Ref. 114 was compared with experimental data of the Stepto group in Ref. 25. This comparison yields reasonable predictions of gel points from simulation data, while mean field approaches underestimate systematically the gel point shift of experimental data.
Gupta et al. 24 introduce a long range percolation model but discuss it as a model for diffusion controlled reactions. The authors observe that cylization accounts only for a part of the delay of the gel point. A subsequent work by Hendrickson et al. 26 uses an improved version of the original algorithm. Figure 6 of Ref. 26 shows that the shift in the conversion is significant and dominated by intra-molecular reactions for short range interactions, while for reactions with a longer range (larger overlap number), the spatial arrangement of the molecules becomes the dominant cause for the shift of the gel point. This latter contribution grows sublinear with the overlap number, which agrees qualitatively with our results. However, one has to be cautious regarding their results since the criterion used to determine the gel point does not reflect the true gel point of these systems. Another caveat regards the point that decouples from node density in their simulations, while it does not for real reactions in bulk, which leads to some counterintuitive results for the dependence on .
Yang et al. 28 study network formation using Molecular Dynamics simulations. Apparently, not all of the presented data seem to be consistent and thus, need to be considered with care. Nevertheless, the measured gel points for at and are delayed by about 5-6 percent of conversion with respect to the mean field prediction of . However, the amount of intra-molecular reactions of these samples is only about 3% and thus, not sufficient to explain quantitatively the observed shift of the gel point.
Lang et al. 36 perform Monte-Carlo simulations of network formation and analyzed the loop size distribution. Here, exponents and were obtained in the vicinity of the presumed gel point for two series of data at different degree of dilution respectively. These exponents are in the same range as the data of Wang et al. 22 and more in line with mean field models as with percolation. In a later publication 27 by the same authors, it was recognized that intra-molecular reactions alone do not explain the shift between data and mean field theory in the vicinity of the gel point, see Figure 12 and 13 of Ref. 27 and the corresponding discussion.
References
- Samaddar et al. 2019 Samaddar, P.; Kumar, S.; Kim, K.-H. Polymer hydrogels and their applications toward sorptive removal of potential aqueous pollutants. Polymer Reviews 2019, 39, 418–464
- Farhood et al. 2019 Farhood, B.; Geraily, G.; Abtahi, S. M. M. A systematic review of clinical applications of polymer gel dosimeters in radiotherapy. Applied Radiation and Isotopes 2019, 143, 47–59
- You et al. 2019 You, I.; Kong, M.; Jeong, U. Block copolymer elastomers for stretchable electronics. Acc. Chem. Res. 2019, 52, 63–72
- Qiu et al. 2019 Qiu, Y.; Zhang, E.; Plamthottam, R.; Pei, Q. Dielectric elastomer artificial muscle: Materials innovations and device explorations. Acc. Chem. Res. 2019, 52, 316–325
- Flory 1953 Flory, P. J. Principles of polymer chemistry; Cornell University Press, 1953
- Korolev et al. 1982 Korolev, S. V.; Kuchanov, S. I.; Slin’ko, M. G. Calculation of gel points taking account of cyclization reactions. Polymer Science U.S.S.R. 1982, 24, 2489–2499
- van der Marck 1997 van der Marck, S. C. Percolation thresholds and universal formulas. Phys. Rev. E 1997, 55, 1514–1517
- Rubinstein and Colby 2003 Rubinstein, M.; Colby, R. H. Polymer Physics; Oxford University Press, 2003
- Mertens and Moore 2018 Mertens, S.; Moore, C. Series expansion of the percolation threshold on hypercubic lattices. J. Phys. A 2018, 51, 475001
- Torquato and Jiao 2013 Torquato, S.; Jiao, Y. Effect of dimensionality on the percolation thresholds of various d-dimensional lattices. Phys. Rev. E 2013, 87, 032149
- Flory 1941 Flory, P. J. Molecular size distribution in three dimensional polymers. I. Gelation. J. Am. Chem. Soc. 1941, 63, 3083–3090
- Stockmayer 1943 Stockmayer, W. H. Theory of Molecular Size Distribution and Gel Formation in Branched-Chain Polymers. J. Chem. Phys. 1943, 11, 45–55
- Macosko and Miller 1976 Macosko, C. W.; Miller, D. R. A new derivation of average molecular weights of nonlinear polymers. Macromolecules 1976, 9, 199–206
- Miller and Macosko 1976 Miller, . R.; Macosko, C. W. A new derivation of post gel properties of network polymers. Macromolecules 1976, 9, 206–211
- Harris 1955 Harris, F. E. Ring formation and molecular weight distributions in branched-chain polymers. I. J. Chem. Phys. 1955, 23, 1518–1525
- Kilb 1958 Kilb, R. W. Dilute gelling systems. I. The effect of ring formation on gelation. J. Chem. Phys. 1958, 62, 969–971
- Ahmad and Stepto 1980 Ahmad, Z.; Stepto, R. F. T. Approximate theories of gelation. Colloid and Polymer Science 1980, 258, 663–674
- Suematsu 1998 Suematsu, K. Theory of gel point in real polymer solutions. Eur. Phys. J. B 1998, 6, 93–100
- Sarmoria and Miller 2001 Sarmoria, C.; Miller, D. R. Spanning-tree models for homopolymerizations with intramolecular reactions. Comp. Theo. Pol. Sci. 2001, 11, 113–127
- Suematsu 2002 Suematsu, K. Recent progress in gel theory: Ring, excluded volume, and dimension. Adv. Pol. Sci. 2002, 156, 137–214
- Tanaka et al. 2012 Tanaka, Y.; Stanford, J. L.; Stepto, R. F. T. Interpretation of gel points of an epoxy-amine system including ring formation and unequal reactivity: reaction scheme and gel-point prediction. Macromolecules 2012, 45, 7186–7196
- Wang et al. 2017 Wang, R.; Lin, T.-S.; Johnson, J. A.; Olsen, B. D. Kinetic Monte Carlo Simulation for the quantification of the gel point of polymer networks. ACS Macro Letters 2017, 4, 1414–1419
- Lee and Eichinger 1990 Lee, K.-J.; Eichinger, B. E. Computer simulation of the structure and elasticity of polyurethane networks: 1. Polyoxypropylene tetrols and hexamethylene diisocyanate. Polymer 1990, 31, 406–414
- Gupta et al. 1991 Gupta, A. M.; Hendrickson, R. C.; Macosko, C. W. Monte Carlo description of homopolymerization: Diffusional effects. J. Chem. Phys. 1991, 95, 2097–2108
- Dutton et al. 1994 Dutton, S.; Rolfes, H.; Stepto, R. F. T. Comparison of Ahmad-Rolfes-Stepto theory, rate theory and Monte-Carlo modelling of gel point and network modulus. Polymer 1994, 35, 4521–4526
- Hendrickson et al. 1995 Hendrickson, R. C.; Gupta, A. M.; Macosko, C. W. Monte Carlo simulation of cyclization during stepwise polymerization. Comput. Pol. Sci. 1995, 5, 135–142
- Lang et al. 2007 Lang, M.; Kreitmeier, S.; Göritz, D. Trapped entanglements in polymer networks. Rubber Chemistry and Technology 2007, 80, 873–894
- Yang et al. 2007 Yang, W.; Wei, D.; Jin, X.; Liao, Q. Molecular dynamics simulation of the formation of polymer networks. Macromol. Theory Simul. 2007, 16, 548–556
- Hoshen et al. 1978 Hoshen, J.; Kopelman, R.; Monberg, E. M. Percolation and cluster distribution. II. Layers, variable-range interactions, and exciton cluster model. J. Stat. Phys. 1978, 19, 219–242
- Stephen and Aharony 1981 Stephen, M. J.; Aharony, A. Percolation with long-range interactions. J. Phys. C 1981, 14, 1665–1670
- Ord and Whittington 1982 Ord, G.; Whittington, S. G. Percolation on a randomly expanded lattice: A model of polymer gels. J. Phys. A 1982, 15, L29–L31
- Ray and Klein 1988 Ray, T. S.; Klein, W. Crossover and the breakdown of hyperscaling in long-range bond percolation. J. Stat. Phys. 1988, 53, 773–794
- Meester and Steif 1996 Meester, R.; Steif, J. E. On the continuity of the critical value for long range percolation in the exponential case. Commun. Math. Phys. 1996, 180, 483–504
- Frei and Perkins 2016 Frei, S.; Perkins, E. A lower bound for in range-R bond percolation in two and three dimensions. Electron. J. Probab. 2016, 21, 1–22
- Aharony and Stauffer 1982 Aharony, A.; Stauffer, D. On the width of the critical region in dilute magnets with long range percolation. Z. Phys. B. - Condensed Matter 1982, 47, 175–177
- Lang et al. 2005 Lang, M.; Göritz, D.; Kreitmeier, S. Intramolecular reactions in randomly end-linked polymer networks and linear (co)polymerizations. Macromolecules 2005, 38, 2515–2523
- Sen et al. 2002 Sen, P.; Banerjee, K.; Biswas, T. Phase transitions in a network with a range-dependent connection probability. Phys. Rev. E 2002, 66, 037102
- Luijten and Blöte 2002 Luijten, E.; Blöte, H. W. J. Boundary between long-range and short-range critical behavior in systems with algebraic interactions. Phys. Rev. Lett. 2002, 89, 025703
- Gaunt et al. 1979 Gaunt, D. S.; Guttmann, A. J.; Whittington, S. G. Percolation with restricted valence. J. Phys. A 1979, 12, 75–79
- Kertész et al. 1982 Kertész, J.; Chakrabarti, B. K.; Duarte, J. A. M. S. Threshold and scaling in percolation with restricted valence. J. Phys. A 1982, 15, L13–L18
- Qian et al. 2016 Qian, X.; Deng, Y.; Liu, Y.; Guo, W.; Blöte, H. W. J. Equivalent-neighbor Potts models in two dimensions. Phys. Rev. E 2016, 94, 052103
- Ouyang et al. 2018 Ouyang, Y.; Deng, y.; Blöte, W. J. Equivalent-neighbor percolation models in two dimensions: Crossover between mean-field and short-range behavior. Phys. Rev. E 2018, 98, 062101
- Deng et al. 2019 Deng, Y.; Ouyoang, Y.; Blöte, H. W. J. Medium-range percolation in two dimensions. J. Physics Conf. Series 2019, 1163, 012001
- Herrmann 1986 Herrmann, H. J. Geometrical cluster growth models and kinetic gelation. Phys. Rep. 1986, 136, 153–227
- Meakin 1983 Meakin, P. Formation of fractal clusters and networks by irreversible diffusion-limited aggregation. Phys. Rev. Lett. 1983, 51, 1119–1122
- Lang 2019 Lang, M. Cyclic structures in polymer model networks. Macromol. Symp. 2019, 385, 1800168
- Carmesin and Kremer 1988 Carmesin, I.; Kremer, K. The bond fluctuation method: a new effective algorithm for the dynamics of polymers in all spatial dimensions. Macromolecules 1988, 21, 2819–2823
- Deutsch and Binder 1991 Deutsch, H. P.; Binder, K. Interdiffusion and self-diffusion in polymer mixtures: A Monte Carlo study. J. Chem. Phys. 1991, 94, 2294–2304
- Rabbel et al. 2017 Rabbel, H.; Breier, P.; Sommer, J.-U. Swelling behavior of single-chain polymer nanoparticles: Theory and simulation. Macromolecules 2017, 50, 7410–7418
- Lang et al. 2018 Lang, M.; Schuster, C.; Dockhorn, R.; Wengenmayr, M.; Sommer, J.-U. Testing the physics of knots with a Feringa nanoengine. Phys. Rev. E 2018, 98, 052501
- Müller et al. 2019 Müller, T.; Lang, M.; Sommer, J.-U. Tendomers - force sensitive bis-rotaxanes with jump-like deformation behavior. Soft Matter 2019, 15, 3671–3679
- Lang et al. 2012 Lang, M.; Fischer, J.; Sommer, J.-U. Effect of topology on the conformations of ring polymers. Macromolecules 2012, 45, 7642–7648
- Klos and Sommer 2016 Klos, J.; Sommer, J.-U. Dendrimer solutions: A Monte Carlo study. Soft Matter 2016, 12, 9007–9013
- Werner and Sommer 2014 Werner, M.; Sommer, J.-U. Translocation and induced permeability of random amphiphilic copolymers interacting with lipid bilayer membranes. Biomacromolecules 2014, 16, 125–135
- Kreer et al. 2001 Kreer, T.; Baschnagel, J.; Müller, M.; Binder, K. Monte Carlo simulation of long chain polymer melts: Crossover from Rouse to reptation dynamics. Macromolecules 2001, 34, 1105–1117
- Meyer et al. 2010 Meyer, H.; Wittmer, J. P.; Kreer, T.; Johner, A.; Baschnagel, J. Static properties of polymer melts in two dimensions. J. Chem. Phys. 2010, 132, 184904
- Lang 2013 Lang, M. Monomer fluctuations and the distribution of residual bond orientations in polymer networks. Macromolecules 2013, 46, 9782–9797
- Lang et al. 2016 Lang, M.; John, A.; Sommer, J.-U. Model simulations on network formation and swelling as obtained from cross-linking co-polymerization reactions. Polymer 2016, 82, 138–155
- Paul et al. 1991 Paul, W.; Binder, K.; Heermann, D. W.; Kremer, K. Crossover scaling in semidilute polymer solutions: a Monte Carlo test. Journal de Physique II 1991, 1, 37–60
- Wittmer et al. 2007 Wittmer, J. P.; Beckrich, P.; Meyer, H.; Cavallo, A.; Johner, A.; Baschnagel, J. Intramolecular long-range correlations in polymer melts: The segmental size distribution and its moments. Physical Review E - Statistical, Nonlinear, and Soft Matter Physics 2007, 76, 1–18
- Lang et al. 2001 Lang, M.; Michalke, W.; Kreitmeier, S. Optimized decomposition of simulated polymer networks into meshes. Macromol. Theory Simul. 2001, 10, 204–208
- Dušek et al. 1978 Dušek, K.; Gordon, M.; Ross-Murphy, S. B. Graphlike state of matter. 10. Cyclization and concentration of elastically active network chains in polymer networks. Macromolecules 1978, 11, 236–245
- Hoffmann et al. 2011 Hoffmann, M.; Lang, M.; Sommer, J.-U. Gelation threshold of cross-linked polymer brushes. Phys. Rev. E 2011, 83, 021803
- Colby et al. 1992 Colby, R. H.; Rubinstein, M.; Gillmor, J. R.; Mourey, T. H. Scaling properties of branched polyesters. 2. Static scaling above the gel point. Macromolecules 1992, 25, 7180–7187
- Rubinstein and Colby 1994 Rubinstein, M.; Colby, R. H. Elastic modulus and equilibrium swelling of near-critical gels. Macromolecules 1994, 27, 3184–3190
- Gusev 2019 Gusev, A. A. Numerical estimates of the topological effects in the elasticity of Gaussian polymer networks and their exact theoretical description. Macromolecules 2019, 52, 3244–3251
- Zhong et al. 2016 Zhong, M.; Wang, R.; Kawamoto, K.; Olsen, B. D.; Johnson, J. A. Quantifying the impact of molecular defects on polymer network elasticity. Science 2016, 353, 1264–1268
- Lang 2018 Lang, M. On the elasticity of phantom model networks with cyclic defects. ACS Macro Letters 2018, 7, 536–539
- Panyukov 2019 Panyukov, S. P. Loops in polymer networks. Macromolecules 2019, 52, 4145–4153
- Lang 2019 Lang, M. On the elasticity of polymer model networks containing finite loops. Macromolecules 2019, 52, 6266–6273
- Obukhov et al. 1994 Obukhov, S. P.; Rubinstein, M.; Colby, R. H. Network modulus and superelasticity. Macromolecules 1994, 27, 3191–3198
- Gordon 1971 Gordon, M. Network theory of rubber elasticity. Proc. Int. Rubber Conference, Moscow ("Khimiya") 1971,
- Skal and Shklovskii 1975 Skal, A. S.; Shklovskii, B. I. Topology of an infinite cluster in the theory of percolation and its relationship to the theory of hopping conduction. Sov. Phys. Semiconduct. 1975, 8, 1029–1032
- De Gennes 1976 De Gennes, P. G. On a relation between percolation theory and the elasticity of gels. Journal de Physique Lett. 1976, 37, L1–L2
- Sahimi 1998 Sahimi, M. Non-linear and non-local transport processes in heterogeneous media: from long-range correlated percolation to fracture and materials breakdown. Physics Reports 1998, 306, 213–395
- Isichenko 2014 Isichenko, M. B. Percolation, statistical topography, and transport in random media. J. Chem. Phys. 2014, 141, 104902
- Stenull et al. 1999 Stenull, O.; Hansen, G. K.; Oerding, K. Critical exponents for diluted resistor networks. Phys. Rev. E 1999, 59, 4919–4930
- Sahimi et al. 1983 Sahimi, M.; Hughes, B. D.; Scriven, L. E.; Davis, H. T. Critical exponent of percolation conductivity by finite-size scaling. J. Phys. C 1983, 16, L521–L527
- Gingold and Lobb 1990 Gingold, D. B.; Lobb, C. J. Percolative conduction in three dimensions. Phys. Rev. B 1990, 42, 8220–8224
- de Alcantara Bonfim et al. 1981 de Alcantara Bonfim, O. F.; Kirkham, J. E.; McKane, A.-J. Critical exponents for the percolation problem and the Yang-Lee edge singularity. J. Phys. A. 1981, 14, 2391–2413
- Adler et al. 1990 Adler, J.; Meir, Y.; Aharony, A.; Harris, A. B. Series study of percolation moments in general dimension. Phys. Rev. B. 1990, 41, 9183–9206
- Strenski et al. 1991 Strenski, P. N.; Bradley, R. M.; Debierre, J.-M. Scaling behavior of percolation surfaces in three dimensions. Phys. Rev. Lett. 1991, 66, 1330–1333
- Stauffer et al. 1982 Stauffer, D.; Coniglio, A.; Adam, M. Gelation and Critical Phenomena. Advances in Polymer Science 1982, 44, 103–158
- Shy et al. 1985 Shy, L. Y.; Leung, Y. K.; Eichinger, B. E. Critical exponents for off-lattice gelation of polymer chains. Macromolecules 1985, 18, 983–986
- Cheng and Chiu 1994 Cheng, K.-C.; Chiu, W.-Y. Monte Carlo simulation of polymer network formation with complex chemical reaction mechanism: kinetic approach on Curing of Epoxides with Amines. Macromolecules 1994, 27, 3406–3414
- Cail et al. 2001 Cail, J. I.; Stepto, R. F. T.; Taylor, D. J. R. Formation, structure and properties of polymer networks: Gel-point prediction in endlinking polymerisations. Macromol. Symp. 2001, 171, 19–36
- Rolfes and Stepto 1993 Rolfes, H.; Stepto, R. F. T. A development of Ahmad-Stepto gelation theory. Makromol. Chem. - Macromol. Symp. 1993, 76, 1–12
- Cail and Stepto 2007 Cail, J. I.; Stepto, R. F. T. The gel point and network formation - theory and experiment. Polymer Bull. 2007, 58, 15–25
- Lang et al. 2015 Lang, M.; Rubinstein, M.; Sommer, J.-U. Conformations of a long polymer in a melt of shorter chains: Generalizations of the Flory theorem. ACS Macro Letters 2015, 4, 177–181
- Zhou et al. 2012 Zhou, H.; Woo, J.; Cok, A. M.; Wang, M.; Olsen, B. D.; Johnson, J. A. Counting primary loops in polymer gels. PNAS 2012, 109, 19119–19124
- Gordon and Scantlebury 1967 Gordon, M.; Scantlebury, G. R. Statistical kinetics of polyesterification of adipic acid with pentaerythritol or trimethylol ethane. J. Chem. Soc. B 1967, 1–13
- Spouge 1986 Spouge, J. L. Equilibrium ring formation in polymer solutions. J. Stat. Phys. 1986, 43, 143–196
- Tanaka et al. 2012 Tanaka, Y.; Stanford, J. L.; Stepto, R. F. T. Interpretation of gel points of an epoxy-amine system including ring formation and unequal reactivity: Measurements of gel points and analyses of ring structures. Macromolecules 2012, 45, 7197–7205
- Nishi et al. 2017 Nishi, K.; Fujii, K.; Chung, U.-I.; Shibayama, M.; Sakai, T. Experimental observation of two features unexpected from the classical theories of rubber elasticity. Phys. Rev. Lett. 2017, 119, 267801
- Semenov 1996 Semenov, A. N. Theory of long-range interactions in polymer systems. J. Phys. II France 1996, 6, 1759–1780
- 96 Deng, Y. Private communication.
- de Gennes 1979 de Gennes, P.-G. De Gennes - Scaling concepts in polymer physics; Cornell University Press: Ithaca and London, 1979
- Stanford and Stepto 1977 Stanford, J. L.; Stepto, R. F. T. A Study of intramolecular reaction and gelation during non-linear polyurethane formation. Brit. Polym. J 1977, 9, 124–132
- Matějka and Dušek 1980 Matějka, L.; Dušek, K. Formation of polyurethane networks studied by the gel point method. Polymer Bull. 1980, 3, 489–495
- Ďuračková et al. 2007 Ďuračková, A.; Valentová, H.; Dušková-Smrčková, M.; Dušek, K. Effect of diluent on the gel point and mechanical properties of polyurethane networks. Polymer Bull. 2007, 58, 201–211
- Zhao et al. 2006 Zhao, D.; Liao, G.; Gao, G.; Liu, F. Influences of intramolecular cyclization on structure and cross-linking reaction processes of PVA hydrogels. Macromolecules 2006, 39, 1160–1164
- Dušková-Smrčková et al. 2010 Dušková-Smrčková, M.; Valentová, H.; Ďuračková, A.; Dušek, K. Effect of dilution on structure and properties of polyurethane networks. Pregel and postgel cyclization and phase separation. Macromolecules 2010, 43, 6450–6462
- Stepto 1979 Stepto, R. F. T. Theoretical and experimental studies of network formation and properties. Polymer 1979, 20, 1324–1326
- Stepto 1988 Stepto, R. F. T. Formation and properties of polymer networks. Acta Polymerica 1988, 39, 61–66
- Stepto et al. 2000 Stepto, R. F. T.; Cail, J. I.; Taylor, D. J. R. Predicting the formation, structure and elastomeric properties of end-linked polymer networks. Macromol. Symp. 2000, 159, 163–178
- Stepto et al. 2000 Stepto, R. F. T.; Taylor, D. J. R.; Partchuk, T.; Gottlieb, M. Poly(dimethylsiloxane) gelation studies. ACS Symposium Series 2000, 729, 194–203
- Wile 1945 Wile, L. L. Ph.D. thesis, 1945
- Šomvársky and Dušek 1994 Šomvársky, J.; Dušek, K. Kinetic Monte-Carlo simulation of network formation. I. Simulation method. Polymer Buletin 1994, 33, 369–376
- Šomvársky and Dušek 1994 Šomvársky, J.; Dušek, K. Kinetic Monte-Carlo simulation of network formation. II. Effects of system size. Polymer Bull. 1994, 33, 377–384
- Šomvársky et al. 1998 Šomvársky, J.; Dušek, K.; Smrčková, M. Kinetic modelling of network formation: Size-dependent static effects. Comp. Theo. Polym. Sci. 1998, 8, 201–208
- Sarmoria et al. 1986 Sarmoria, C.; Valles, E.; Miller, D. R. Ring-chain competition kinetic models for linear and nonlinear step-reaction copolymerizations. Macromol. Chem. Macromol. Symp. 1986, 2, 69–87
- Rankin et al. 2000 Rankin, S. E.; Kasehagen, L. J.; McCormick, A. V.; Macosko, C. W. Dynamic Monte Carlo simulation of gelation with extensive cyclization. Macromolecules 2000, 33, 7639–7648
- Pereda et al. 2001 Pereda, S.; Brandolin, A.; M., V. E.; Sarmoria, C. Copolymerization between and with ring formation and different intrinsic reactivity in one of the Monomers. Macromolecules 2001, 34, 4390–4400
- Leung and Eichinger 1984 Leung, Y. K.; Eichinger, B. E. Computer simulation of end-linked elastomers. I. Trifunctional networks cured in the bulk. J. Chem. Phys. 1984, 80, 3877–3884
![[Uncaptioned image]](/html/2104.05257/assets/TOC.png)
Table of Contents Graphics: The force balance condition for the determination of the phantom modulus of a network with junction functionality and chain degree of polymerization is shown at three different conversions , , and not far beyond the gel point.