Fabrication of Ultra-High Q Silica Microdisk Using Chemo-Mechanical Polishing
Abstract
Here we demonstrate that adding a chemo-mechanical polishing (CMP) procedure to conventional photolithography, a silica microdisk with ultra-high quality factors () can be fabricated. By comparing with the intrinsic optical quality factor (Q) measured at 970 nm, we observe that due to the significantly reduced surface roughness, at 1550 nm wavelength the water molecule absorption at the cavity surface supersedes Rayleigh scattering as the dominant factor for Q degradation.
The study of whispering gallery mode (WGM) micro resonators has dominated many fields of science over past decades. Microcavities have become one of the most attractive optical components to study in a broad range of scientific disciplines, including but not limited to, nanoparticle detection, biosensing, quantum information, comb generation, and optomechanics Vahala (2003); Lu et al. (2011); Baaske, Foreman, and Vollmer (2014); Kippenberg, Holzwarth, and Diddams (2011); Papp et al. (2014); Kippenberg and Vahala (2008). The power of microcavities to confine the light is mostly measured by optical quality factor (Q) as the higher the Q goes the more intense the light inside the cavity becomes. Campillo, Eversole, and Lin (1991) High Q microcavities are essential for better detection in sensing applications, lower threshold power for comb generation, and parametric oscillation Kippenberg, Spillane, and Vahala (2004); Ilchenko et al. (2004) and narrower linewidth for laser oscillators. Li et al. (2012)
One of the most important limiting factors for achieving high Q is Rayleigh scattering induced by surface roughness Gorodetsky, Pryamikov, and Ilchenko (2000). Hence, efforts to increase the optical Q has mainly relied on using the expensive fabrication techniques such as stepper lithography Lee et al. (2012) or \ceCO_2 laser reflow Armani et al. (2003) to decrease the surface roughness of microcavities and increase the Q. However, these techniques come with either the need for expensive machinery or incompatibility with monolithic integration. Silica microdisks with Q exceeding 1 billion have been fabricated recently by carving out the Silica and making trenches on grown silica film rather that making stand alone disks. Wu et al. (2020) High Q microresonators and low loss waveguides from other nonlinear materials have also been demonstrated with deposition on silica platforms to take advantage of smooth surface and low loss nature of the oxide. Kim et al. (2020)
Chemo-mechanical polishing (CMP) has been used to increase the optical Q for \ceLiNbO_3 Wu et al. ; Wang et al. (2019) and \ceSi_3N_4 Ji et al. (2017) microdisks, but to the best of our knowledge, this technique has not been used to fabricate \ceSiO_2 microdisks. In this paper we incorporate CMP to conventional photolithography to fabricate ultra-high Q microdisks. Through scanning electron microscopy (SEM) and numerical modelling, we further analyze limiting factors to further Q improvement.
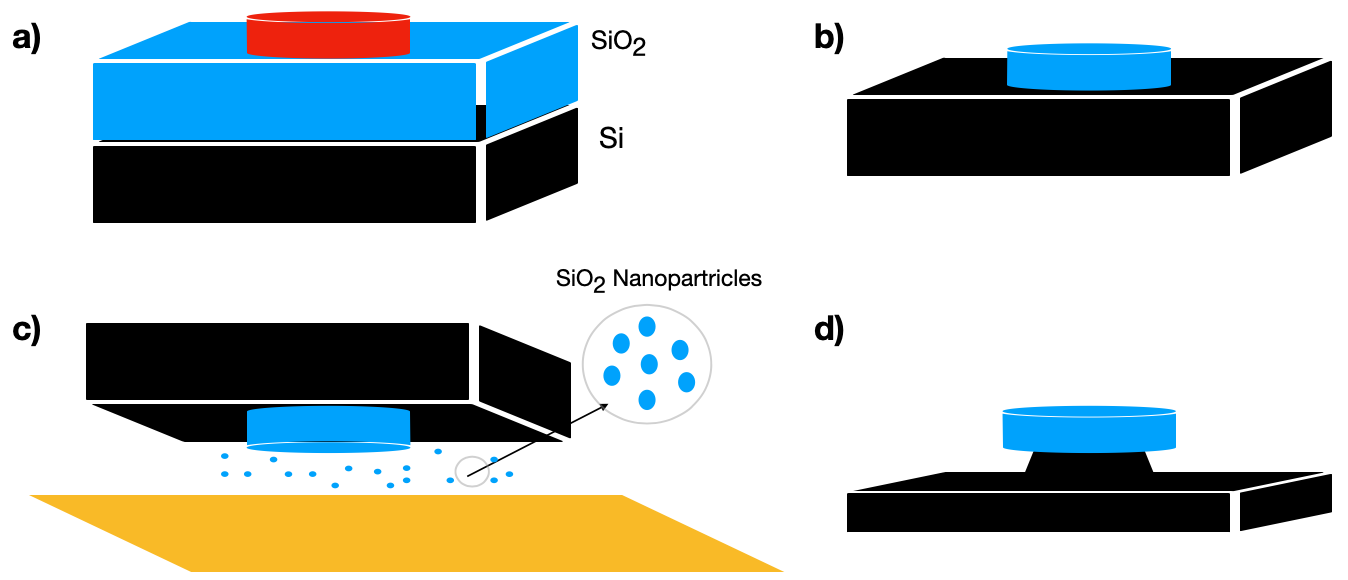
Our fabrication process consists of four steps: a) conventional photolithography using deep UV light, b) wet etching of \ceSiO_2 using buffered \ceHF, c) chemomechanical polishing of the \ceSiO_2 disks with silica slurry, and d) \ceXeF_2 dry etch of the Silicon layer to form the pillars (Fig 1).
The fabrication details are as follows. After applying a standard wafer cleaning process, we spin coat a silica-on-silicon wafer (SoS, University Wafers) with positive resist (S1813). A UV lithography is then applied to transfer the microdisk pattern from the photomask onto the wafer followed by a buffered HF (Transene) wet etch to form disks on the silica thin film. To further improve the surface smoothness of the disks, we proceed to the polishing step using slurry of 70-nm-diameter silica nanoparticles. Before the polishing step can be done, it is important to change the surface chemistry of the sample. Hydrogen passivation surface of the sample after HF wet etching makes the surface extremely hydrophobic, Trucks et al. (1990) which can hinder the flow of slurry and reduce the effectiveness of the CMP step significantly. In order to remedy this problem, we used a 10 minutes Piranha solution (\ceH_2SO_4/\ceH_2O_2) to clean the surface and make it hydrophylic. Hand polishing of the sample was then performed using the silica nanoparticle slurry to reduce the surface roughness. RCA cleaning steps has also been performed after polishing to wash off the slurry particles stick to the surface of the disk. In the last step of fabrication, \ceXeF_2 gas was used inside an etching chamber to undercut the disk and form the pillars by etching the silicon underneath the disks. This step is crucial for achieving high Q micro resonators, since the light silicon interaction inside the cavity should be minimized. The maximum amount of undercut is limited by the buckling effect that happens at larger undercuts, and can degrade the Q or even make the disk crack. However, the problem can be mitigated by high temperature annealing (1,000 ). Wu et al. (2020)
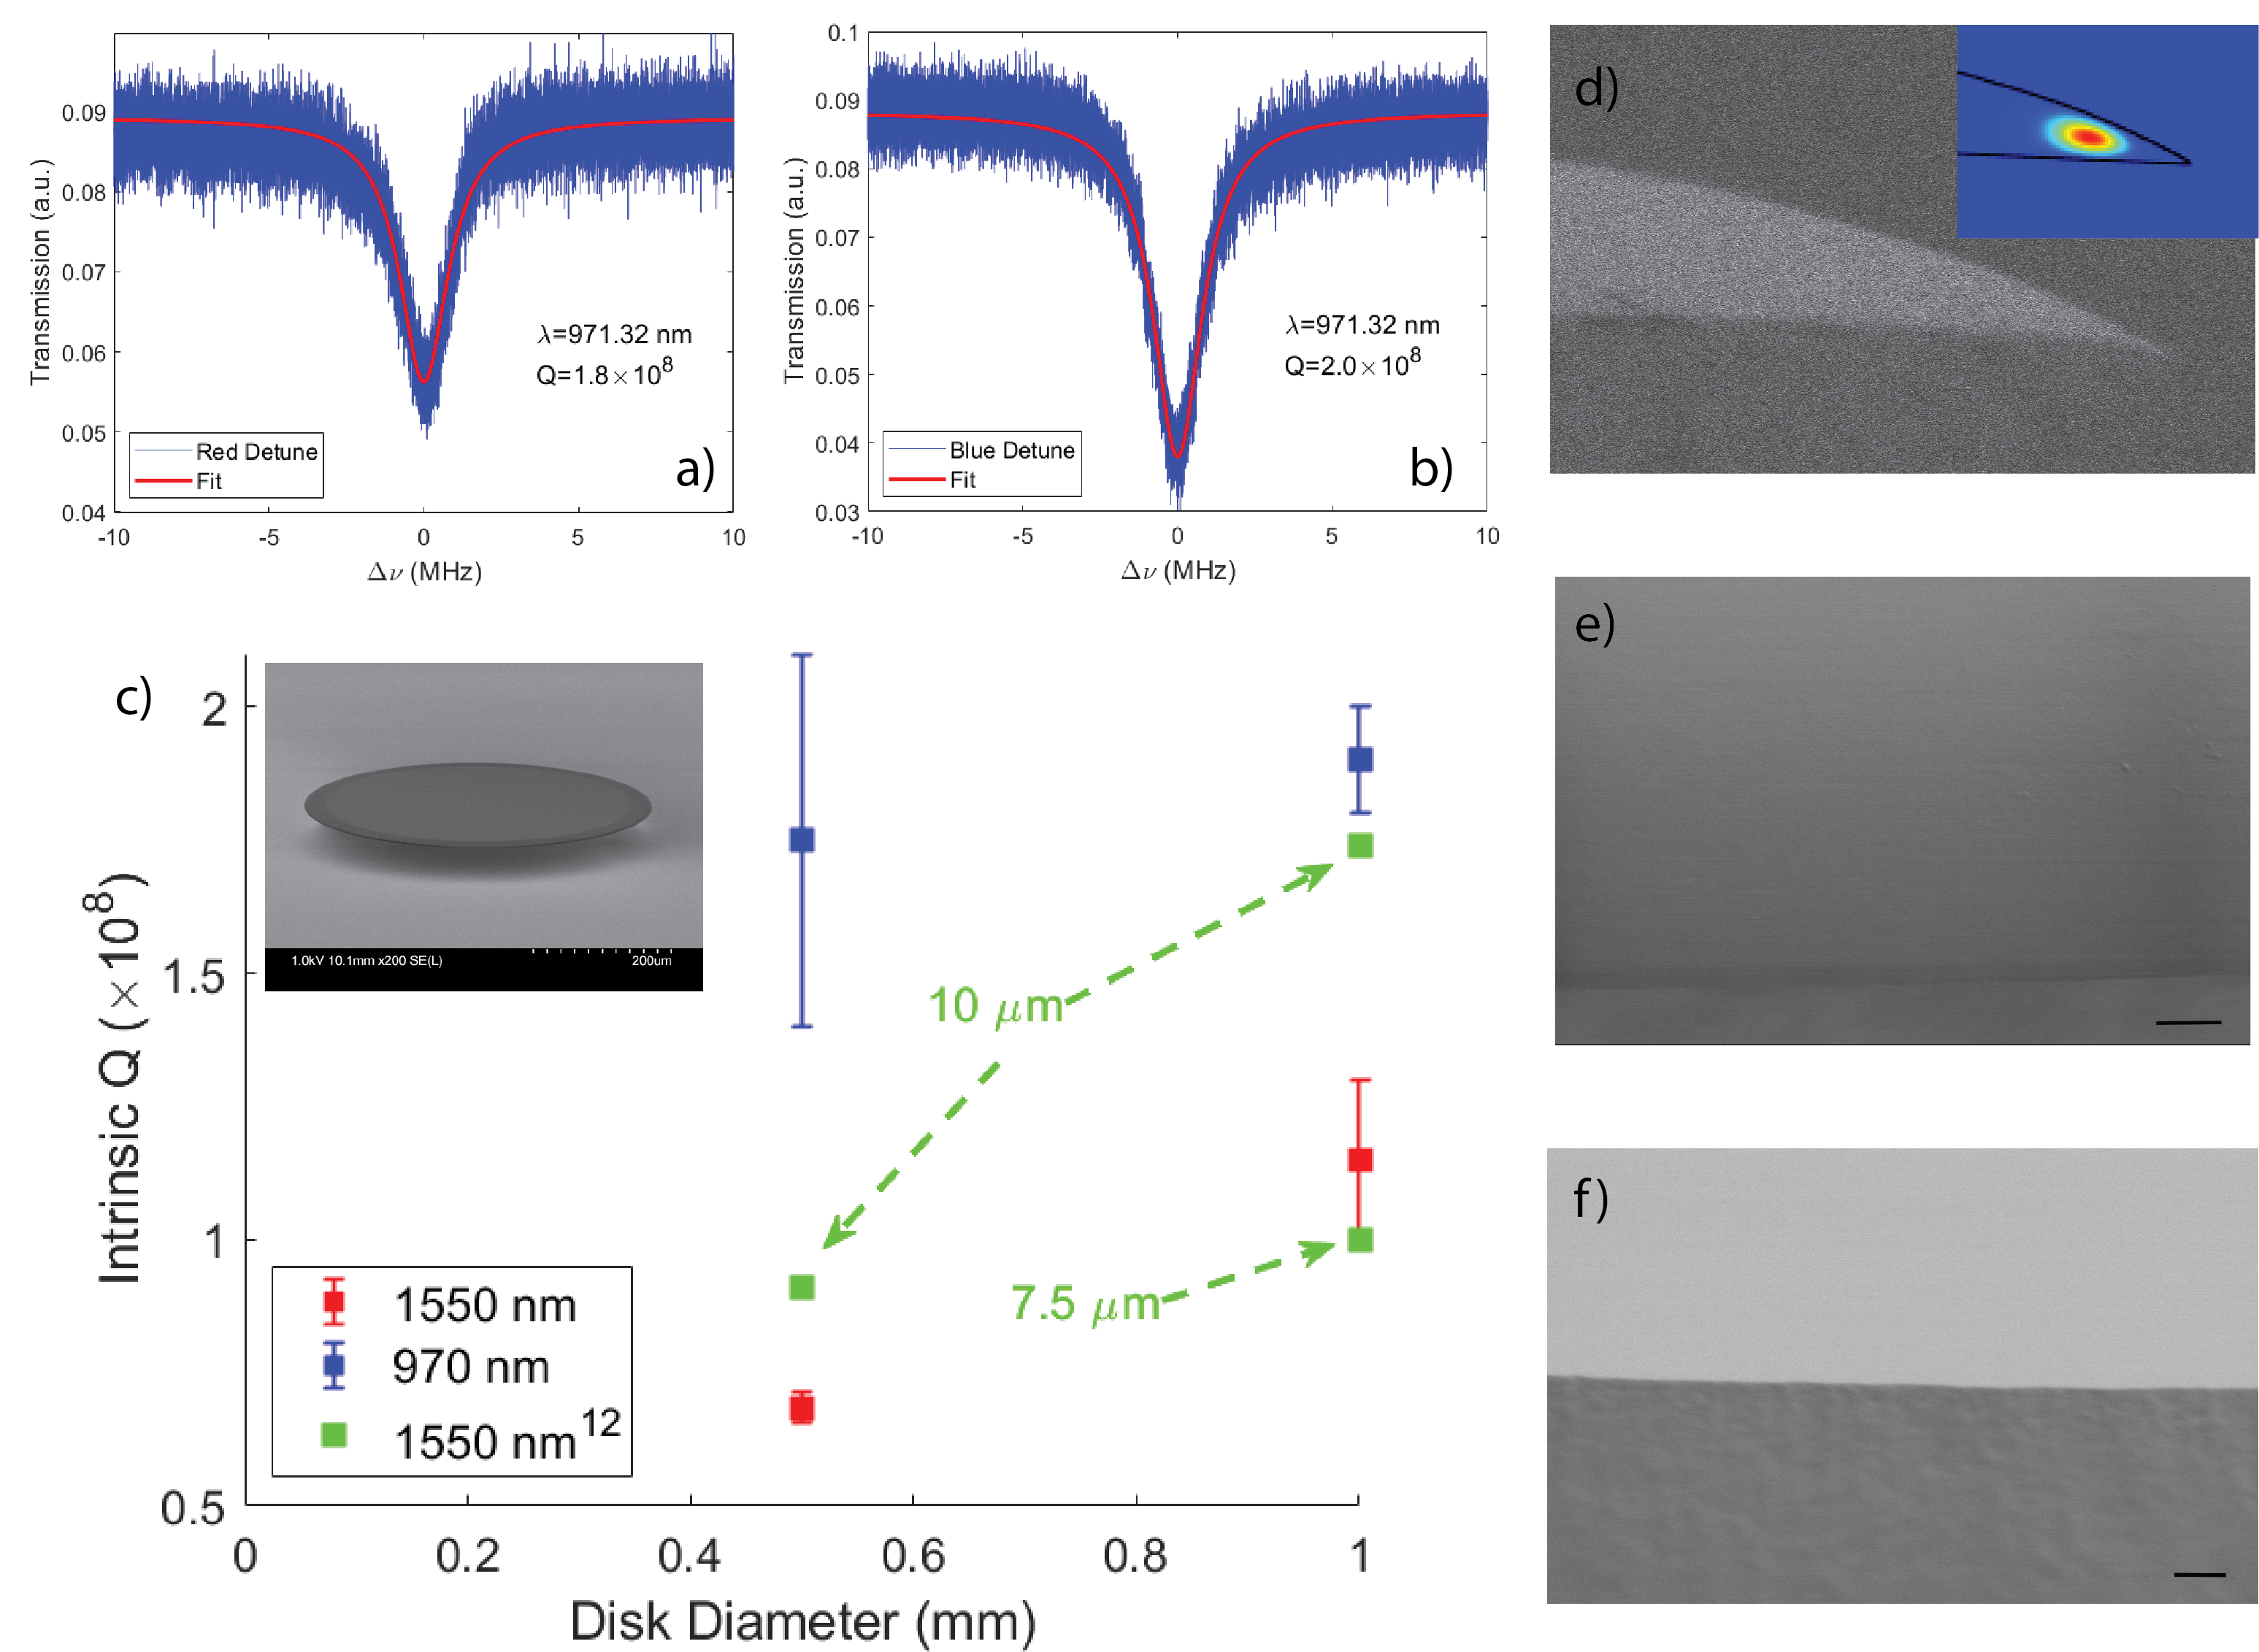
In the next step, we measure the intrinsic Qs at 970 nm and 1550 nm wavelength bands. Here, external cavity tunable lasers (Samtec TSL-550 for 1550 nm, and Newfocus TLB 6718-D for 970 nm) were used to probe the microdisks through a tapered optical fiber. As shown in Fig. 2a, by linearly scanning the laser around the cavity resonance wavelength, a Lorentzian shaped signal will appear at the output transmission of the tapered fiber, from which intrinsic Q can be calculated. Here, to accurately readout the optical frequency, we placed a fiber Mach-Zehnder interferometer in parallel to the microdisk cavity as a reference. Lu et al. (2011) Note that,the intrinsic Q values measured by red detuning and blue detuning of the laser wavelengths are slightly different, due to the thermal effects. Therefore, we take the average of both Qs as the estimated value of intrinsic Q and their difference as the uncertainty. For example, as shown on Fig. 2a, the Q measured from blue detuning on a 10 m (7.5 m after polishing) thick, 1mm diameter microdisk using a 970 nm laser was while Fig. 2b shows that from a red detuned measurement the Q of was obtained. Consequently we determine the intrinsic Q to be as shown in Fig. 2c (blue square with error bars representing the uncertainty). We also used our fabrication process to make 500 m disks, and the average intrinsic Q of was obtained. In order to better compare our work with previously reported results (green squares), Lee et al. (2012) we used 1550 nm laser to measure the Q as well. We observed the optical Q drops to for 1 mm disk and for 500 m disk (red squares in Fig. 2b). Note that the Q of our 1 mm disk is slightly better than the equivalent 7.5 m thick disks reported in. Lee et al. (2012) The side view and top view SEM micrographs in Fig. 2d-e show reduced roughness on the polished surface compared to the unpolished one shown in Fig. 2f and confirms our process make the disk edges more smooth, which will reduce the Rayleigh scattering. The edge shape has altered after the CMP step and the sharp angle between the top surface and the sidewall has changed to a smooth gradual change in angle, so that top surface and the sidewall are almost indistinguishable. This change in turn would affect the mode position inside the cavity as shown in the inset of Fig. 2d.
Further, the observation of lower Q at longer wavelength suggests Rayleigh scattering is not the dominant factor for Q degradation. Instead, water absorption at the disk surface dominates the Q at 1550 nm since otherwise surface roughness induced Rayleigh scattering should make the Q at shorter wavelength (970 nm) even lower. Borselli et al. (2004) This contradicts the previous observations that Q at 1550 nm is limited by surface roughness. Vernooy et al. (1998); Rokhsari, Spillane, and Vahala (2004); Ganta, Dale, and Rosenberger (2014) To confirm, we numerically simulate the modes and compare the intrinsic Q at both wavelengths. In simulation, the side view SEM image of the disk in Fig. 2d was converted to a contour curve for COMSOL simulation as shown on its inset (black trace). In the absence of water layer, the Q of at 970 nm and at 1550 nm were obtained through simulations. Since our SEM does not provide sufficient resolution for surface roughness, the simulated Q were mainly silica material absorption limited. We then added a layer of water at the disk surface and obtained a Q of at 1550 nm when the water layer is 1 nm thick. This is in close agreement to our experiment observation around this wavelength. On the other hand, the simulated Q at 970 nm was due to the significantly lower water absorption at this wavelength band. As the experimental measurement (Q=(1.90.1) is much lower than the simulation value, we confirm that at 970 nm Q is still limited by Rayleigh scattering. In fact, assuming the Rayleigh scattering induced Q () has dependence Borselli et al. (2004) and at 970 nm, one would expect at 1550 nm, which is much higher than the measured Q. From these observations, we concluded that at 1550 nm, Q is limited by a 1-nm water layer absorption while at 970 nm surface roughness is still the limiting factor for Q.
In summary, we made microdisks with ultra high optical Q using conventional photolithography in conjunction with CMP. As a result, surface roughness is no longer a limiting factor for Q at 1550 nm. The Q at shorter wavelength can be further improved by using smaller nanoparticles as slurry to achieve lower surface roughness. Through simulation, we further find that by removing the 1 nm water layer at the microdisk surface, a Q value close to can be reached at 1550 nm.
This work was supported in part by the Nature Science and Engineering Research Council of Canada (NSERC) Discovery (Grant No. RGPIN-2020-05938), and Threat Reduction Agency (DTRA) Thrust Area 7, Topic G18 (Grant No.GRANT12500317). We would like to acknowledge CMC Microsystems for the provision of products and services that facilitated this research, including the use of COMSOL for the numerical analysis. The authors would like to thank Dr. Elaine Humphrey, Mr. Jon Rudge, and the staff of Advanced Microscopy Facility (AMF) at University of Victoria for their help and constructive and valuable discussions. The data that support the findings of this study are available from the corresponding author upon reasonable request.
References
- Vahala (2003) K. J. Vahala, “Optical microcavities,” Nature 424, 839–846 (2003).
- Lu et al. (2011) T. Lu, H. Lee, T. Chen, S. Herchak, J.-H. Kim, S. E. Fraser, R. C. Flagan, and K. Vahala, “High sensitivity nanoparticle detection using optical microcavities,” Proceedings of the National Academy of Sciences 108, 5976–5979 (2011).
- Baaske, Foreman, and Vollmer (2014) M. D. Baaske, M. R. Foreman, and F. Vollmer, “Single-molecule nucleic acid interactions monitored on a label-free microcavity biosensor platform,” Nature Nanotechnology 9, 933 (2014).
- Kippenberg, Holzwarth, and Diddams (2011) T. J. Kippenberg, R. Holzwarth, and S. A. Diddams, “Microresonator-based optical frequency combs,” Science 332, 555–559 (2011).
- Papp et al. (2014) S. B. Papp, K. Beha, P. Del’Haye, F. Quinlan, H. Lee, K. J. Vahala, and S. A. Diddams, “Microresonator frequency comb optical clock,” Optica 1, 10–14 (2014).
- Kippenberg and Vahala (2008) T. J. Kippenberg and K. J. Vahala, “Cavity optomechanics: back-action at the mesoscale,” Science 321, 1172–1176 (2008).
- Campillo, Eversole, and Lin (1991) A. Campillo, J. Eversole, and H. Lin, “Cavity quantum electrodynamic enhancement of stimulated emission in microdroplets,” Physical Review Letters 67, 437 (1991).
- Kippenberg, Spillane, and Vahala (2004) T. Kippenberg, S. Spillane, and K. Vahala, “Kerr-nonlinearity optical parametric oscillation in an ultrahigh-Q toroid microcavity,” Physical Review Letters 93, 083904 (2004).
- Ilchenko et al. (2004) V. S. Ilchenko, A. A. Savchenkov, A. B. Matsko, and L. Maleki, “Nonlinear optics and crystalline whispering gallery mode cavities,” Physical Review Letters 92, 043903 (2004).
- Li et al. (2012) J. Li, H. Lee, T. Chen, and K. J. Vahala, “Characterization of a high coherence, brillouin microcavity laser on silicon,” Optics Express 20, 20170–20180 (2012).
- Gorodetsky, Pryamikov, and Ilchenko (2000) M. L. Gorodetsky, A. D. Pryamikov, and V. S. Ilchenko, “Rayleigh scattering in high-Q microspheres,” JOSA B 17, 1051–1057 (2000).
- Lee et al. (2012) H. Lee, T. Chen, J. Li, K. Y. Yang, S. Jeon, O. Painter, and K. J. Vahala, “Chemically etched ultrahigh-Q wedge-resonator on a silicon chip,” Nature Photonics 6, 369–373 (2012).
- Armani et al. (2003) D. Armani, T. Kippenberg, S. Spillane, and K. Vahala, “Ultra-high-Q toroid microcavity on a chip,” Nature 421, 925–928 (2003).
- Wu et al. (2020) L. Wu, H. Wang, Q. Yang, Q.-x. Ji, B. Shen, C. Bao, M. Gao, and K. Vahala, “Greater than one billion Q factor for on-chip microresonators,” Optics Letters 45, 5129–5131 (2020).
- Kim et al. (2020) D.-G. Kim, S. Han, J. Hwang, I. H. Do, D. Jeong, J.-H. Lim, Y.-H. Lee, M. Choi, Y.-H. Lee, D.-Y. Choi, et al., “Universal light-guiding geometry for on-chip resonators having extremely high Q-factor,” Nature Communications 11, 1–7 (2020).
- (16) R. Wu, J. Zhang, N. Yao, W. Fang, L. Qiao, Z. Chai, J. Lin, and Y. Cheng, “Lithium niobate micro-disk resonators of quality factors above ,” 43, 4116–4119.
- Wang et al. (2019) M. Wang, R. Wu, J. Lin, J. Zhang, Z. Fang, Z. Chai, and Y. Cheng, “Chemo-mechanical polish lithography: A pathway to low loss large-scale photonic integration on lithium niobate on insulator,” Quantum Engineering 1, e9 (2019).
- Ji et al. (2017) X. Ji, F. A. Barbosa, S. P. Roberts, A. Dutt, J. Cardenas, Y. Okawachi, A. Bryant, A. L. Gaeta, and M. Lipson, “Ultra-low-loss on-chip resonators with sub-milliwatt parametric oscillation threshold,” Optica 4, 619–624 (2017).
- Trucks et al. (1990) G. Trucks, K. Raghavachari, G. Higashi, and Y. Chabal, “Mechanism of HF etching of silicon surfaces: A theoretical understanding of hydrogen passivation,” Physical Review Letters 65, 504 (1990).
- Borselli et al. (2004) M. Borselli, K. Srinivasan, P. E. Barclay, and O. Painter, “Rayleigh scattering, mode coupling, and optical loss in silicon microdisks,” Applied Physics Letters 85, 3693–3695 (2004).
- Vernooy et al. (1998) D. Vernooy, V. S. Ilchenko, H. Mabuchi, E. Streed, and H. Kimble, “High-Q measurements of fused-silica microspheres in the near infrared,” Optics Letters 23, 247–249 (1998).
- Rokhsari, Spillane, and Vahala (2004) H. Rokhsari, S. Spillane, and K. Vahala, “Loss characterization in microcavities using the thermal bistability effect,” Applied Physics Letters 85, 3029–3031 (2004).
- Ganta, Dale, and Rosenberger (2014) D. Ganta, E. Dale, and A. Rosenberger, “Measuring sub-nm adsorbed water layer thickness and desorption rate using a fused-silica whispering-gallery microresonator,” Measurement Science and Technology 25, 055206 (2014).