The Extraordinary Outburst in the Massive Protostellar System NGC 6334 I-MM1:
Strong Increase in Mid-Infrared Continuum Emission
Abstract
In recent years, dramatic outbursts have been identified toward massive protostars via infrared and millimeter dust continuum and molecular maser emission. The longest lived outburst ( yr) persists in NGC 6334 I-MM1, a deeply-embedded object with no near-IR counterpart. Using FORCAST and HAWC+ on SOFIA, we have obtained the first mid-IR images of this field since the outburst began. Despite being undetected in pre-outburst ground-based 18m images, MM1 is now the brightest region at all three wavelengths (25, 37, and 53m), exceeding the UCHII region MM3 (NGC 6334 F). Combining the SOFIA data with ALMA imaging at four wavelengths, we construct a spectral energy distribution of the combination of MM1 and the nearby hot core MM2. The best-fit Robitaille radiative transfer model yields a luminosity of . Accounting for an estimated pre-outburst luminosity ratio MM1:MM2 = , the luminosity of MM1 has increased by a factor of 16.34.4. The pre-outburst luminosity implies a protostar of mass 6.7 , which can produce the ionizing photon rate required to power the pre-outburst HCHII region surrounding the likely outbursting protostar MM1B. The total energy and duration of the outburst exceed the S255IR-NIRS3 outburst by a factor of , suggesting a different scale of event involving expansion of the protostellar photosphere (to 20 ), thereby supporting a higher accretion rate (0.0023 yr-1) and reducing the ionizing photon rate. In the grid of hydrodynamic models of Meyer et al. (2021), the combination of outburst luminosity and magnitude (3) places the NGC 6334 I-MM1 event in the region of moderate total accretion (0.1-0.3 ) and hence long duration (40-130 yr).
1 Introduction
The realization that protostellar emission can be highly variable began with the recognition that the 6-magnitude optical brightening of FU Ori arose from a young stellar object (YSO) rather than a nova (Herbig, 1966). Similar scale outbursts have since been found in over two dozen Class I and II low-mass protostars (Gramajo et al., 2014, and references therein), along with the first detection in a Class 0 object (Safron et al., 2015). Such luminosity outbursts, along with smaller ones, offer strong evidence that stars form via continuous slow accretion punctuated by short bursts of rapid, episodic accretion (Vorobyov & Basu, 2015). The observed timescales of outbursts span a broad range from several months to a few hundred years (Hillenbrand & Findeisen, 2015). Such behavior has been reproduced in hydrodynamic simulations (MacFarlane et al., 2019). A study of Orion suggests that episodic accretion accounts for 25% of a star’s mass (Fischer et al., 2019), making it an important ingredient in star formation.
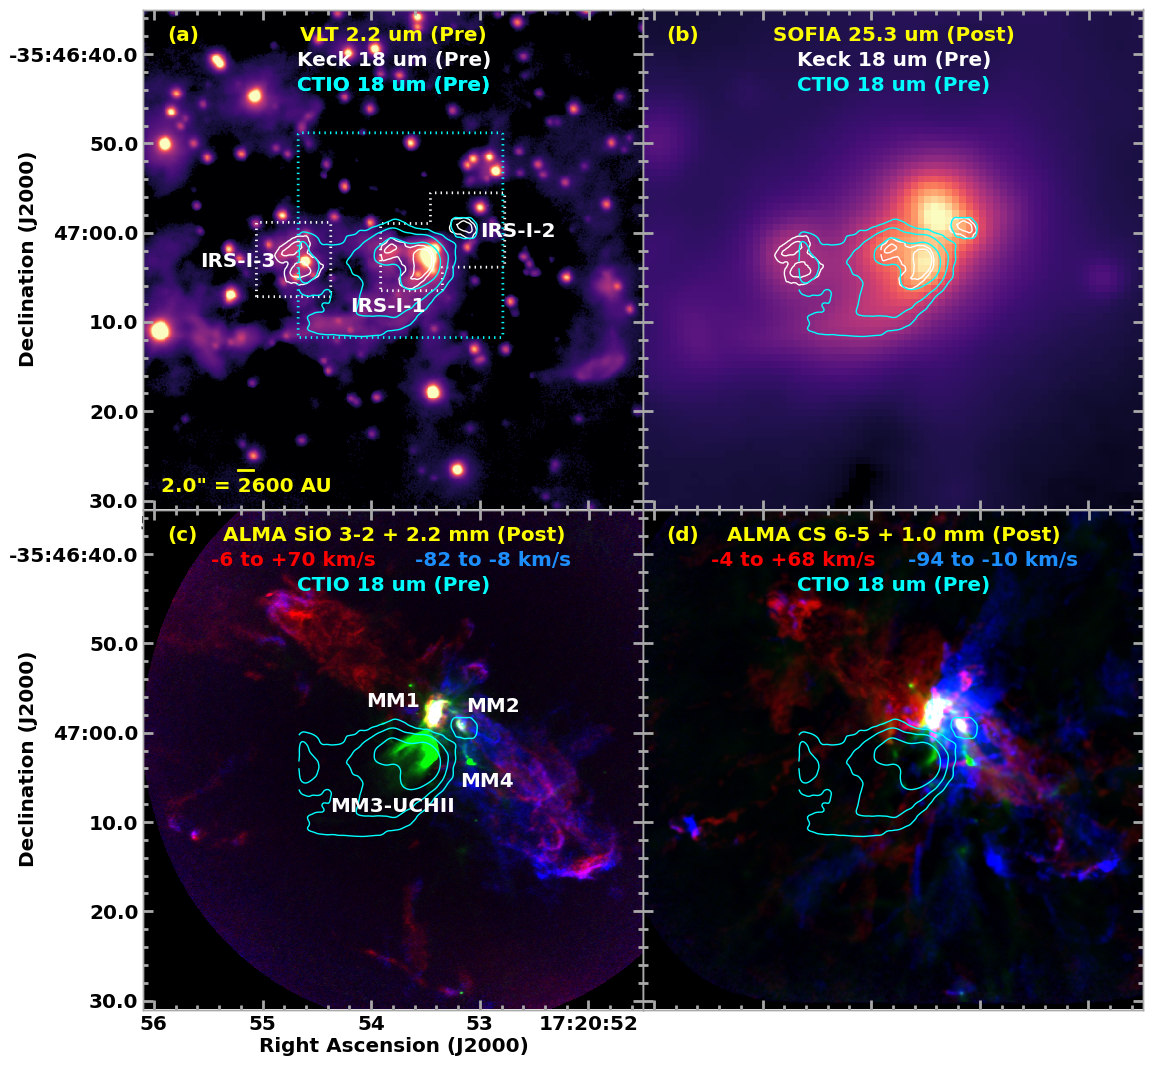
The recent outburst in near-IR through millimeter continuum from S255IR-NIRS3 (Caratti o Garatti et al., 2017; Liu et al., 2018), corresponding to a 5.5 increase in luminosity for 2 years, proved that massive YSOs also exhibit accretion outbursts. In mid-2015, with the Atacama Large Millimeter/submillimeter Array (ALMA), we discovered an outburst from the deeply-embedded massive protocluster NGC 6334 I compared to our earlier 2008 Submillimeter Array (SMA) observations (Hunter et al., 2017). Because NGC 6334 I is relatively nearby (1.3 kpc; Reid et al., 2014; Chibueze et al., 2014), we can resolve the protostars, including the four massive YSOs: MM1..MM4 (Hunter et al., 2006; Brogan et al., 2016). The two brightest millimeter dust sources, MM1 and MM2, contain extremely line-rich hot molecular cores (McGuire et al., 2017; Bøgelund et al., 2018; El-Abd et al., 2019); MM3 corresponds to the more evolved ultracompact (UC)HII region NGC6334F that is bright at mid-IR/cm wavelengths (de Pree et al., 1995). MM1, MM2, and MM4 all drive bipolar outflows (Fig. 1), while MM1 and MM2 each harbor a hypercompact (HC)HII region (MM1B and MM2B, respectively, Brogan et al., 2018c).
The NGC 6334 I millimeter outburst, centered on MM1B, was accompanied by an unprecedented simultaneous flaring in multiple maser species monitored by the Hartebeesthoek Radio Astronomy Observatory (HartRAO) 26 m telescope beginning in January 2015 (MacLeod et al., 2018), signaling that an accretion event had begun. Accretion outbursts sometimes fade quickly, such as the recent heating event in the protocluster G358.93-0.03 (Burns et al., 2020), which flared in numerous methanol maser lines never before seen (Breen et al., 2019; MacLeod et al., 2019; Brogan et al., 2019). In contrast, in continued ALMA and HartRAO monitoring of NGC 6334 I, the elevated dust continuum and maser emission have persisted, while Karl G. Jansky Very Large Array (VLA) imaging revealed that strong 6.7 GHz methanol maser emission had arisen in the vicinity of MM1 as a result of the outburst (Hunter et al., 2018). Here we present the first mid-IR imaging since the event began, along with contemporaneous multi-band ALMA (sub)millimeter measurements, which together provide a more accurate outburst luminosity.
2 Observations
| SOFIA | ALMA | |||||
|---|---|---|---|---|---|---|
| Parameter | FORCAST | HAWC+ | Band 4 | Band 7 | Band 8 | Band 9 |
| Project code | 07_0156_1 | GTO 70_0609_13 | 2017.1.00661.S | 2017.1.00661.S | 2017.1.00370.S | 2017.1.00717.S |
| Configuration(s) | … | … | C43-6 & C43-3 | C43-5 & C43-2 | C43-4 | C43-3 |
| Observation date(s) | 2019-07-09, -10 | 2018-07-14 | 6 executionsaaObserved in configuration C43-6 on 2017-12-03, 2017-12-07, and twice on 2018-01-04, plus twice in C43-3 on 2018-04-23. | 4 executionsbbObserved in configuration C43-5 on 2018-01-23 and 2018-01-14, and in configuration C43-2 on 2018-05-09 and 2018-05-25; the first execution employed J15172422 as flux calibrator. | 2018-09-12 | 2018-08-28 |
| Exposure time (sec) | 1781, 1611 | 448 | 10215 | 5149 | 2118 | 2365 |
| Flux calibrator | … | … | J16175848 | J19242914bbObserved in configuration C43-5 on 2018-01-23 and 2018-01-14, and in configuration C43-2 on 2018-05-09 and 2018-05-25; the first execution employed J15172422 as flux calibrator. | J19242914 | J22531608 |
| Gain calibrator | … | … | J17133418 | J17173342 | J17333722 | J17333722 |
| Wavelength(s) (m) | 25.3, 37.1 | 53 | 2173 | 1005 | 758 | 432 |
| Projected -range (kilo) | 13 – 1218 | 13 – 1380 | 16 – 1613 | 19 – 1746 | ||
| Robust weighting | 0.5 | 0.5 | 0.8 | 0.7 | ||
| Net continuum BW (MHz) | 654 | 404 | 105 | 326 | ||
| rms noise (Jy beam-1) , | 0.056, 0.094 | 0.34 | 0.00009 | 0.000085 | 0.006 | 0.05 |
2.1 SOFIA
We used the Stratospheric Observatory for Infrared Astronomy (SOFIA, Temi et al., 2014) during Cycle 7 to image NGC 6334 I with the Faint Object infraRed CAmera for the SOFIA Telescope (FORCAST, Herter et al., 2012). Observations were performed in the asymmetric chop-and-nod imaging mode C2NC2. This field was also observed with the High-resolution Airborne Wideband Camera-plus (HAWC+, Harper et al., 2018) in Lissajous scanning mode during Guaranteed Time Observations. Further details are listed in Table 1. We used the Level 4 and Level 3 archival data products for FORCAST and HAWC+, respectively. To facilitate closer comparison with higher resolution data, we also generated a deconvolved version of the FORCAST 25m image with resolution.
2.2 ALMA
ALMA observations with the 12m array were obtained with comparable angular resolution in Bands 4, 7, 8, and 9 (2.2, 1.0, 0.76, and 0.43 mm) within 8 months during ALMA Cycle 5 (Table 1). We calibrated the data with the Cycle 7 release of the ALMA pipeline. NGC 6334 I is an extremely line-rich source (§1). The method described in Brogan et al. (2018c) was employed to identify line-free channels; the resulting net continuum bandwidths are listed in Table 1. Iterative self-calibration was performed on the continuum data to improve the image quality (Brogan et al., 2018a). The Briggs robust weighting parameter (smaller values down-weight shorter -spacings) was used to achieve similar angular-scale sensitivity between the different bands beyond that afforded by the projected uv-ranges of the data (see Table 1); these ALMA data are not sensitive to smooth emission larger than about . Spectral cubes of SiO (3-2) and CS (6-5) with 2 km s-1 channels were created from the Band 4 and 7 continuum-subtracted data, respectively. With the exception of the C43-6 Band 4 data (McGuire et al., 2018; Xue et al., 2019; Ligterink et al., 2020), results from these ALMA datasets have not previously been published.
2.3 HartRAO
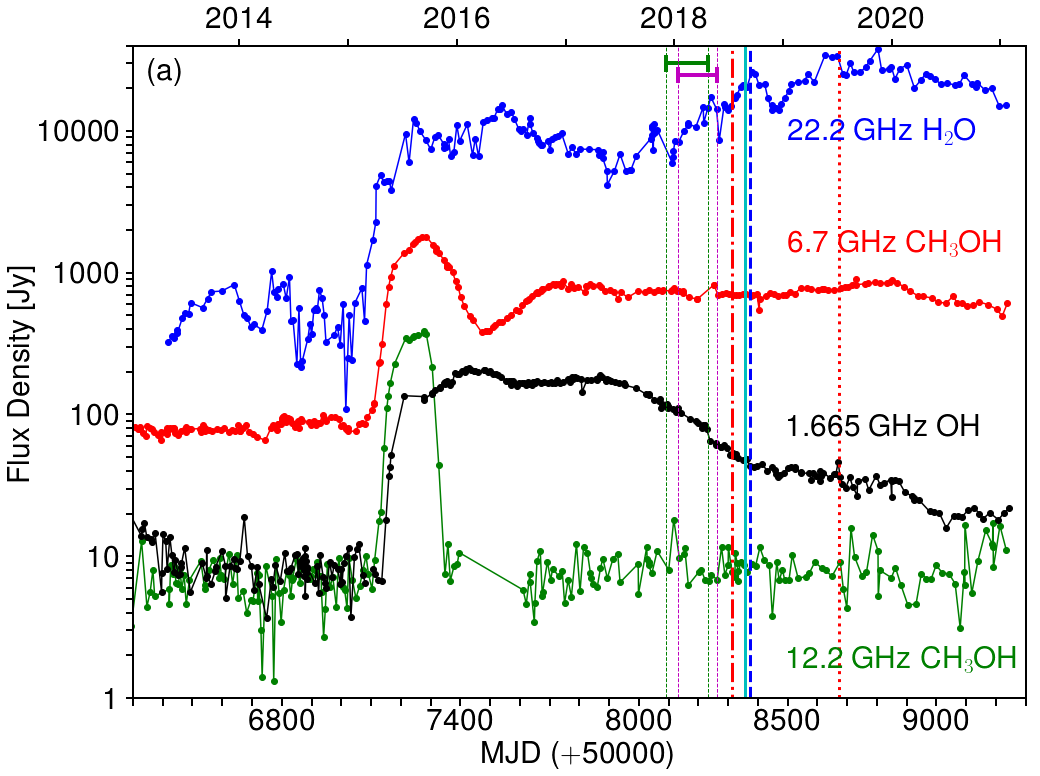
We compiled the latest maser monitoring spectra of NGC 6334 I from the HartRAO 26 m telescope. Observation details are provided by MacLeod et al. (2018). For each maser transition, we extracted a time series of the intensity in the velocity channel closest to the LSR velocity of the thermal gas ( km s-1), which also represents the peak methanol maser emission from MM1 (Hunter et al., 2018).
2.4 Archival data and astrometry
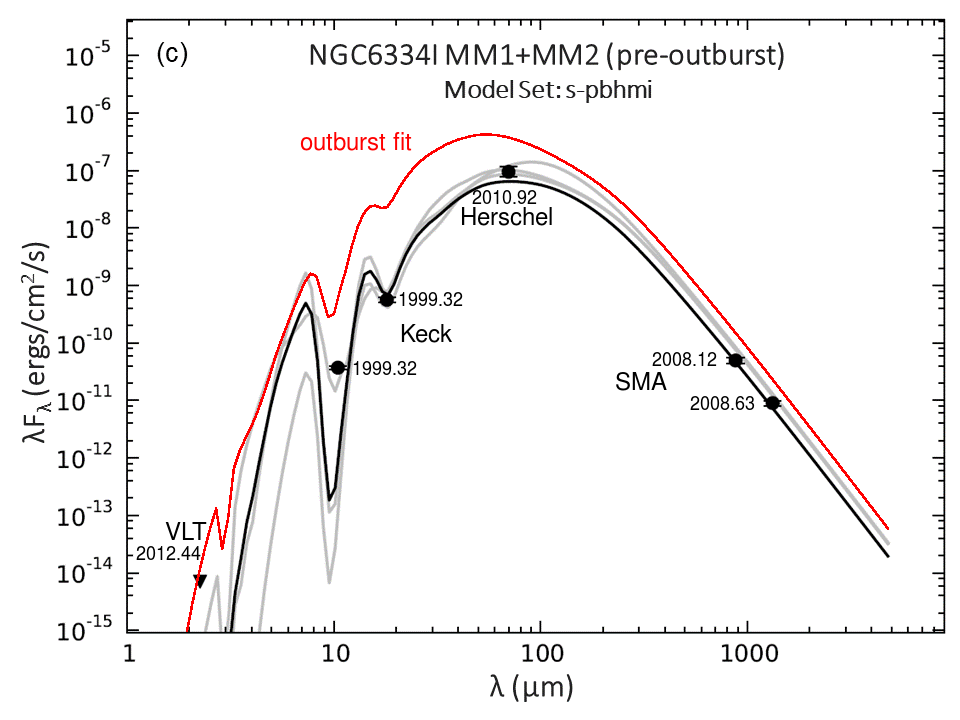
To establish accurate astrometry for the infrared images, we extracted an archival pre-outburst image from the High Acuity Wide field K-band Imager (HAWKI) on the Very Large Telescope (VLT) on 2012-Jun-09. Applying 2MASS photometric calibration, the faintest detected object is 21 mag. Despite the large difference in wavelength, the morphological features from IRS-I-1 and IRS-I-3 are remarkably similar to the 1998 18m image from the Cerro Tololo Inter-American Observatory (CTIO) 4 m telescope (Fig. 1a; De Buizer et al., 2000). We calibrated the HAWKI image astrometry to Gaia DR2 (Lindegren et al., 2018), then aligned the CTIO image to it. We then aligned the three subfields observed in 1999 at W.M. Keck Observatory (De Buizer et al., 2002) to the CTIO image. Next, we aligned the FORCAST images to the CTIO image, and finally the HAWC+ image to the 37m image. We also extracted the 70m PACS image (Tigé et al., 2017) from the Herschel archive and aligned it to the HAWC+ image. Table 2 lists the shifts applied to each image. Finally, we also extracted 3.4 and 4.6m images from the (NEO)WISE survey covering pre- and post-outburst (Mainzer et al., 2011), and images from the VVV/VVVX survey (Minniti et al., 2010), all post-outburst.
3 Results
| Observatory | Mean wavelength | Resolution | Shift applied | Flux densityaaValue from the apertures shown in Fig. 2, except the Keck 10 and 18m measurements, which are only for IRS-I-2. | Mean epoch |
|---|---|---|---|---|---|
| (m) | () | RA(), Dec() | (Jy) | ||
| Data taken prior to the outburst | |||||
| VLT | 2.15 | 0.6 | 0.0, 0.0bbAstrometric reference for IR images; the 70m astrometry was bootstrapped from point sources in the shifted SOFIA 53m image. | 2012.44 | |
| Keck | 10 | 0.33 | +1.08, 1.59 | 0.130.01 | 1999.32 |
| CTIO | 18 | 1.0 | +1.65, +0.14 | 3.490.57 | 1998.50 |
| Keck | 18 | 0.41 | +1.08, 1.59 | 3.430.35 | 1999.32 |
| Herschel PACS (HOBYS) | 70 | 5.9 | +0.0, | 2260452 | 2010.92 |
| SMAc,dc,dfootnotemark: (VEX + EXT) | 878 | 0.540.28, +9∘ | +0.12, +0.12 | 14.61.6 | 2008.12 |
| SMAccData from Hunter et al. (2017) (VEX) | 1326 | 0.800.34, +18∘ | +0.06, +0.4 | 4.00.41 | 2008.63 |
| Data taken since the outburst began in 2015 | |||||
| VVV/VVVX | 2.15 | 0.0, 0.0 | 2017.15 | ||
| SOFIA FORCAST | 25.3 | 3.2 | +0.5, +0.5 | 1014129 | 2019.52 |
| SOFIA FORCAST | 37.1 | 3.5 | +0.25, +0.25 | 3604447 | 2019.52 |
| SOFIA HAWC+ | 53 | 5.6 | +0.5, +0.5 | 76611246 | 2018.53 |
| ALMA | 432 | 0.310.17, | 0.0, 0.0 | 34651 | 2018.65 |
| ALMA | 758 | 0.310.19, +89∘ | 0.0, 0.0 | 65.59.7 | 2018.70 |
| ALMA | 1005 | 0.330.28, +61∘ | 0.0, 0.0eeAstrometric reference for SMA images | 31.73.2 | 2018.38 |
| ALMA | 2173 | 0.320.24, | 0.0, 0.0 | 2.900.29 | 2018.08 |
3.1 Pre and Post-outburst Continuum Morphology
Prior to the 2015 outburst, mid-IR images of NGC 6334 I were dominated by dust emission from the UCHII region MM3 (IRS-I-1; Fig. 1a). Aside from MM3, faint emission at 10 and 18m was detected toward and slightly southwest of MM2 in the CTIO and Keck images (IRS-I-2; Fig. 1a,b). The elongation of this feature coincides with high-velocity blueshifted emission in the ALMA images of SiO 3-2 and CS 6-5 (Fig. 1c,d) leading toward H2 knot C (Eislöffel et al., 2000), providing another example of mid-IR emission tracing outflow cavities in massive star-forming regions (De Buizer et al., 2017). MM1 is undetected in pre-burst mid-IR imaging (De Buizer et al., 2000), with a 4 upper limit of 0.36 Jy at 18m (see Fig. 2d contours).
Figures 2a,b show ALMA continuum images of NGC 6334 I, highlighting the four primary protocluster members (MM1-MM4). The UCHII region MM3 is prominent at 2.2 mm due to its free-free emission, but becomes less apparent at 1.0 mm. The spectral index () image () formed from these images (Fig. 2c) demonstrates that MM1, MM2, and MM4 are dominated by dust emission, with the most optically thick sources ( approaching +2) being MM4 and locations within MM1. In contrast, MM3 shows typical of optically thin free-free emission.
As of mid-2019, MM1 is the brightest source at 25 and 37m, outshining MM3 (Fig. 2d,e; this is also true in the mid-2018 native 53m HAWC+ image, not shown). This remarkable result confirms a large increase in luminosity, first inferred from millimeter data (Hunter et al., 2017). Separated by only , MM1 and MM2 are difficult to distinguish in the native resolution FORCAST images. However, the deconvolved 25m image (Fig. 2f) demonstrates that both objects contribute at this wavelength. Interestingly, the 25m emission peaks not at the center of MM1, where the column density is likely highest, but rather 1′′ southwest toward a cluster of 6.7 GHz masers that were not present prior to the outburst (Hunter et al., 2018). The 25m emission also extends northward following an arc of masers along the N-S outflow (McGuire et al., 2018; Brogan et al., 2018c; Chibueze et al., 2021) and westward, including the MM2 area, supporting the conclusion of De Buizer et al. (2012) that these masers trace mid-IR-bright outflow cavities surrounding massive protostars. The coincidence of all the methanol masers with 25m emission also reflects the expectation of pumping models that require K (Cragg et al., 2005).
3.2 Multiwavelength Photometry
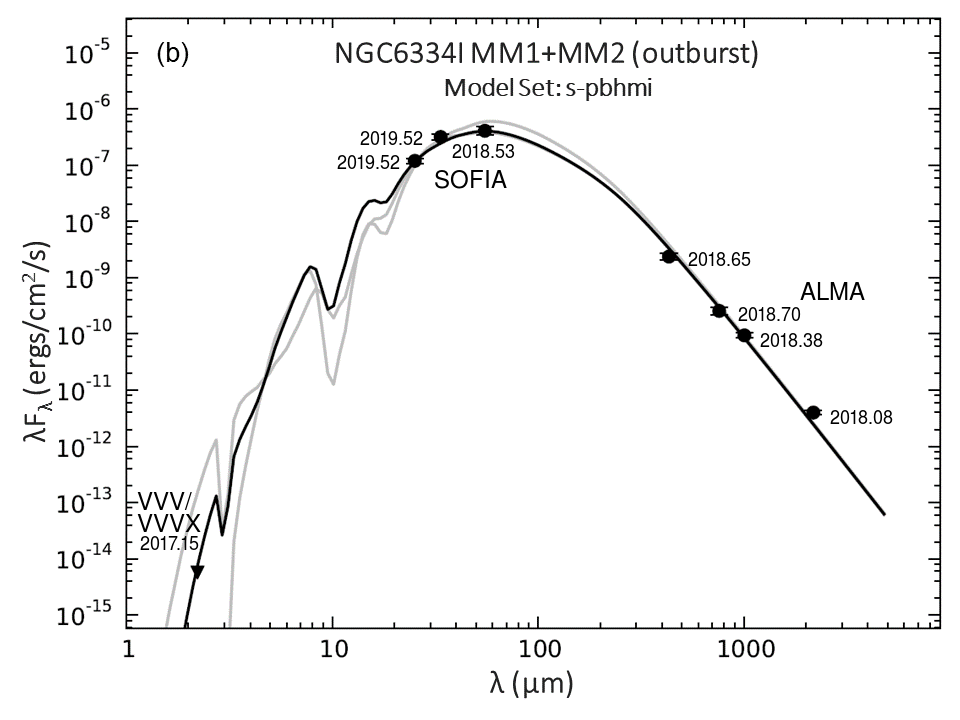
The millimeter-wavelength flux ratio of MM1:MM2 increased from =2.1 in the SMA111The Submillimeter Array is a joint project between the Smithsonian Astrophysical Observatory and the Academia Sinica Institute of Astronomy and Astrophysics and is funded by the Smithsonian Institution and the Academia Sinica. 0.87 mm data to =10.5 in the ALMA 1.0 mm data. However, because MM1 and MM2 cannot be clearly separated in the SOFIA images, the most accurate spectral energy distribution (SED) we can produce is for the combination of the two sources. Thus, we used the ALMA images to define a polygonal aperture that generally follows a low intensity contour of elliptical shape covering MM1 and MM2 but avoiding the bright northern edge of MM3 (Fig. 2a,b). Primary beam correction was applied to all ALMA images prior to measuring flux densities. The ALMA flux density uncertainties are the estimated rms noise in the aperture (rms per beam ) added in quadrature with the absolute flux uncertainty (10% for Bands 4 and 7; 15% for Bands 8 and 9).
Considering the coarser resolution of the mid-IR images, we needed to model and remove the UCHII region emission to avoid contamination. To construct a model, we masked the non-UCHII emission in the CTIO 18m image, then smoothed it to the resolution of each of the longer wavelength images (Fig. 2g-i). Next, each smoothed 18m image was iteratively scaled upward to minimize the residuals when subtracting it from the corresponding longer wavelength image. For the 25, 37, 53, and 70 m images, we found optimal scale factors of 3.33 (), 7.0 (), 12 (), and 2.5, respectively. These values are comparable to intermediate values of computed for massive protostar models by Liu et al. (2020), and the 37:20m and 70:20m flux ratios of the cometary HII region M17UC1 (5.7 and 2.25: Lim et al., 2020).
SOFIA and Herschel values in Table 2 are measured from “UCHII removed” images; to account for the larger 37, 53, and 70m beams, we expanded the photometric aperture radially from its centroid by the relative increase in beam radius compared to 25m (, , and respectively, see expanded apertures in Fig. 2h,i). Removing the UCHII region reduces the measured flux densities by 9.2%, 4.8%, 12%, and 13% at 25, 37, 53 and 70m, respectively. The photometric uncertainty due to astrometric error was estimated by shifting the aperture by 1 pixel in each of the four cardinal directions, repeating the photometry, then computing the rms of these four possible differences with respect to the nominal flux density: it is 5.1%, 5.5%, 1.9%, and 4.5% at 25, 37, 53, and 70 m, respectively. The total flux density uncertainties – 12% at 25 and 37 m, 16% at 53 m, and 20% at 70m – include the estimated noise in the aperture, photometric uncertainty due to astrometric error, UCHII model subtraction uncertainty (half the subtracted contribution), and flux calibration uncertainty (10% for FORCAST, 15% for HAWC+, 5% for PACS, Lim et al., 2020; Chuss et al., 2019; Balog et al., 2014), added in quadrature. The total uncertainty at 70m includes an additional term for the background subtraction.
No emission was detected toward MM1 or MM2 in the HAWKI image, with upper limits of 2.65 and 5.3 Jy, respectively. In the (NEO)WISE images, MM1 is within the saturated PSF core of MM3 in both bands; subtracting pre-outburst from post-outburst images did not reveal any residual toward MM1. Stacking all the band VVV/VVVX images yields an upper limit of 4.2 Jy near both positions.
3.3 Stability of the Post-outburst Emission
In order to assess the stability of the continuum emission from NGC 6334 I over the span of the post-outburst data, we use the maser light curves from HartRAO. Among the four species shown in Fig. 3a, the Class II methanol masers (6.7 and 12.2 GHz) are pumped by mid-IR photons (Cragg et al., 2005) and may be a good proxy for detecting changes in this radiation. Prior to the January 2015 outburst, the methanol masers arose only from MM2 and MM3 (Green et al., 2015). The 12.2 GHz flare lasted only a few months, but the 6.7 GHz flare persists. During the 1.5 yr interval spanning our ALMA and SOFIA observations (Table 1), the 6.7 GHz maser flux density remained constant over 44 epochs with a mean and standard deviation of Jy. Computed using pyMannKendall (Hussain & Mahmud, 2019), the Mann-Kendall normalized test statistic is 0.23 and the Theil-Sen slope estimator is 0.16, both consistent with no trend.
3.4 SEDs and SED fitting
Combining observations spanning 18 months into an SED can be problematic for a variable source. However, massive protostars exhibiting near-IR variability (Kumar et al., 2016) show similar timescale fluctuations as the 6.7 GHz masers surrounding deeply-embedded massive protostars (Goedhart et al., 2014). Also, in a sample of 6.7 GHz masers with radio continuum counterparts observed on arcsecond scales, the maser luminosity correlates significantly with the inferred ionizing photon rate (Szymczak et al., 2018). Along with theoretical expectations, these observational findings suggest that variations in the radiation field will often manifest in maser variations. Thus, the observed constancy of the methanol maser flux density from NGC 6334 I-MM1 during the interval spanning our mid-IR/millimeter observations gives us confidence in constructing the separate SEDs in Fig. 3.
We fit these SEDs to protostellar radiative transfer (RT) models (Robitaille, 2017) using the methodology of Towner et al. (2019). The best fit outburst model (Fig. 3b) includes a power-law envelope with an outflow cavity and a central protostar with bolometric luminosity = 490008000 , where the fractional uncertainty in has been set to that of the flux density measurement nearest the SED peak (53m). The best fit pre-outburst model (Fig. 3c) comes from the same model family, with nearly identical outflow inclination angle but half the opening angle and has = 4300900 (taking the uncertainty from the 70m measurement). MM1 and MM2 both harbor massive protostars, with hot core molecular spectra of comparable complexity and temperature (=150-200 K, El-Abd et al., 2019). Therefore, we use their pre-outburst millimeter flux density ratio, (§3.2), to estimate their pre-outburst luminosity ratio. Since the brightness of MM2 has remained unchanged (Hunter et al., 2017), we compute MM1’s pre-outburst luminosity as =2900600 and its outburst luminosity as = (assuming 20% uncertainty on ). Thus, the outburst ratio is 16.34.4, consistent with a magnitude 3 outburst (Meyer et al., 2021).
4 Discussion
The total luminosity () of a massive protostar is a combination of photospheric luminosity () and accretion luminosity (),
| (1) |
with the accretion rate () increasing during outbursts while having a persistent “background” value in between outbursts (Meyer et al., 2021). If we assume that half of arises from a ZAMS photosphere with solar metallicity, then the progenitor’s properties are: mass =6.7 , radius =2.6 , and effective temperature =22000 K (Tout et al., 1996), which lies between spectral type B1.5V and B2V (Pecaut & Mamajek, 2013). Its ionizing photon rate, ph s-1 (Diaz-Miller et al., 1998), slightly exceeds that required ( ph s-1, using Eq. 7 of Carpenter et al., 1990) to produce the 1.3 cm flux density of the HCHII region MM1B (Brogan et al., 2016). This comparison suggests that MM1B contributes the bulk of the luminosity of MM1, dominating over the other point source, MM1D. Equal luminosity from accretion would require a background rate of yr-1, comparable to the steady accretion rates in the 6 formation model of Haemmerlé et al. (2013).
If the increase in MM1’s luminosity, = - , is entirely attributed to increased accretion, the new accretion rate onto the MM1B protostar would be (/2.6) yr-1. However, a sudden increase in accretion rate may cause the protostellar photosphere to bloat, resulting in a temporary excursion on the HR diagram to higher , larger , lower , and lower (Meyer et al., 2019). Interestingly, in our first post-outburst 1.3 cm VLA observation, we detect a substantial drop in the free-free emission from MM1B (Brogan et al., 2018b), consistent with lower (Brogan et al., in prep.). A larger requires a larger to achieve the same . For example, if dropped by a factor of 4, and remained split equally between accretion and protostellar luminosity, then the photosphere would have 16000 K and 20 , implying an outburst accretion rate of yr-1. Theoretical support for such a rate comes from a hydrodynamical study of outburst parameters, where this event’s combination of and duration places it in a region of parameter space containing magnitude 3 outbursts (below center in Fig. 5a of Meyer et al., 2021). The total mass accreted in the closest analogue events is 0.1-0.3, implying a lifetime for the MM1B outburst of 40-130 yr.
Considering the duration of the ongoing outburst ( yr, based on the maser light curve), we compute the total accretion energy () from J. Because is much greater than the initial rise time prior to the first ALMA observation (7 months), the uncertainty in due to unconstrained details of the luminosity growth profile is of less consequence than for S255IR-NIRS3 and G358.93-0.03, which have J and J, respectively (Stecklum et al., 2021). Thus, the NGC 6334 I-MM1B outburst now exceeds the other outbursts by 3 in both duration and energy. This distinction suggests a different magnitude of event, with a timescale more similar to the FU Ori phenomenon in low mass protostars. While FU Ori outbursts are typically interpreted in the context of self-luminous disk instabilities (Hartmann & Kenyon, 1996), an alternate model involves heating and expansion of the outer layers of the star (Larson, 1980; Herbig et al., 2003), which could explain the longer decay times. Our results emphasize the importance of studying outbursts across the protostellar mass range, which may provide new insights on this pervasive phenomenon. Continuing to monitor the evolution of NGC 6334 I-MM1B from centimeter through mid-IR wavelengths is critical because the variability level and timescale are among the few observables that can constrain the outburst mechanism.

ADS/JAO.ALMA#2017.1.00661.S and
ADS/JAO.ALMA#2017.1.00717.S. ALMA is a partnership of ESO (representing its member states), NSF (USA) and NINS (Japan), together with NRC (Canada) and NSC and ASIAA (Taiwan) and KASI (Republic of Korea), in cooperation with the Republic of Chile. The Joint ALMA Observatory is operated by ESO, AUI/NRAO and NAOJ. This research made use of NASA’s Astrophysics Data System Bibliographic Services. Based in part on observations made with the NASA/DLR Stratospheric Observatory for Infrared Astronomy (SOFIA). SOFIA is jointly operated by the Universities Space Research Association, Inc. (USRA), under NASA contract NNA17BF53C, and the Deutsches SOFIA Institut (DSI) under DLR contract 50 OK 0901 to the University of Stuttgart. Financial support for this work was provided by NASA through award #07_0156 issued by USRA. Based in part on observations collected at the European Organisation for Astronomical Research in the Southern Hemisphere under ESO programme 089.C-0852(A). The Hartebeesthoek telescope is operated by the South African Radio Astronomy Observatory, which is a facility of the National Research Foundation, an agency of the Department of Science and Innovation. This work has made use of data from the European Space Agency (ESA) mission Gaia (https://www.cosmos.esa.int/gaia), processed by the Gaia Data Processing and Analysis Consortium (DPAC, https://www.cosmos.esa.int/web/gaia/dpac/consortium). Funding for the DPAC has been provided by national institutions, in particular the institutions participating in the Gaia Multilateral Agreement. This research made use of APLpy, an open-source plotting package for Python (Robitaille & Bressert, 2012).
References
- Balog et al. (2014) Balog, Z., Muzerolle, J., Flaherty, K., et al. 2014, ApJ, 789, L38
- Bøgelund et al. (2018) Bøgelund, E. G., McGuire, B. A., Ligterink, N. F. W., et al. 2018, A&A, 615, A88
- Breen et al. (2019) Breen, S. L., Sobolev, A. M., Kaczmarek, J. F., et al. 2019, ApJ, 876, L25
- Brogan et al. (2016) Brogan, C. L., Hunter, T. R., Cyganowski, C. J., et al. 2016, ApJ, 832, 187
- Brogan et al. (2018a) Brogan, C. L., Hunter, T. R., & Fomalont, E. B. 2018a, ArXiv e-prints, arXiv:1805.05266
- Brogan et al. (2018b) Brogan, C. L., Hunter, T. R., MacLeod, G., Chibueze, J. O., & Cyganowski, C. J. 2018b, in IAU Symposium, Vol. 336, Astrophysical Masers: Unlocking the Mysteries of the Universe, ed. A. Tarchi, M. J. Reid, & P. Castangia, 255–258
- Brogan et al. (2018c) Brogan, C. L., Hunter, T. R., Cyganowski, C. J., et al. 2018c, ApJ, 866, 87
- Brogan et al. (2019) Brogan, C. L., Hunter, T. R., Towner, A. P. M., et al. 2019, ApJ, 881, L39
- Burns et al. (2020) Burns, R. A., Sugiyama, K., Hirota, T., et al. 2020, NatAs, 4, 506
- Caratti o Garatti et al. (2017) Caratti o Garatti, A., Stecklum, B., Garcia Lopez, R., et al. 2017, NatPh, 13, 276
- Carpenter et al. (1990) Carpenter, J. M., Snell, R. L., & Schloerb, F. P. 1990, ApJ, 362, 147
- Chibueze et al. (2021) Chibueze, J. O., MacLeod, G. C., Vorster, J. M., et al. 2021, ApJ, 908, 175
- Chibueze et al. (2014) Chibueze, J. O., Omodaka, T., Handa, T., et al. 2014, ApJ, 784, 114
- Chuss et al. (2019) Chuss, D. T., Andersson, B. G., Bally, J., et al. 2019, ApJ, 872, 187
- Cragg et al. (2005) Cragg, D. M., Sobolev, A. M., & Godfrey, P. D. 2005, MNRAS, 360, 533
- De Buizer et al. (2012) De Buizer, J. M., Bartkiewicz, A., & Szymczak, M. 2012, ApJ, 754, 149
- De Buizer et al. (2000) De Buizer, J. M., Piña, R. K., & Telesco, C. M. 2000, ApJS, 130, 437
- De Buizer et al. (2002) De Buizer, J. M., Radomski, J. T., Piña, R. K., & Telesco, C. M. 2002, ApJ, 580, 305
- De Buizer et al. (2017) De Buizer, J. M., Liu, M., Tan, J. C., et al. 2017, ApJ, 843, 33
- de Pree et al. (1995) de Pree, C. G., Rodriguez, L. F., Dickel, H. R., & Goss, W. M. 1995, ApJ, 447, 220
- Diaz-Miller et al. (1998) Diaz-Miller, R. I., Franco, J., & Shore, S. N. 1998, ApJ, 501, 192
- Eislöffel et al. (2000) Eislöffel, J., Smith, M. D., & Davis, C. J. 2000, A&A, 359, 1147
- El-Abd et al. (2019) El-Abd, S. J., Brogan, C. L., Hunter, T. R., et al. 2019, ApJ, 883, 129
- Fischer et al. (2019) Fischer, W. J., Safron, E., & Megeath, S. T. 2019, ApJ, 872, 183
- Goedhart et al. (2014) Goedhart, S., Maswanganye, J. P., Gaylard, M. J., & van der Walt, D. J. 2014, MNRAS, 437, 1808
- Gramajo et al. (2014) Gramajo, L. V., Rodón, J. A., & Gómez, M. 2014, AJ, 147, 140
- Green et al. (2015) Green, J. A., Caswell, J. L., & McClure-Griffiths, N. M. 2015, MNRAS, 451, 74
- Haemmerlé et al. (2013) Haemmerlé, L., Eggenberger, P., Meynet, G., Maeder, A., & Charbonnel, C. 2013, A&A, 557, A112
- Harper et al. (2018) Harper, D. A., Runyan, M. C., Dowell, C. D., et al. 2018, JAI, 7, 1840008
- Hartmann & Kenyon (1996) Hartmann, L., & Kenyon, S. J. 1996, ARA&A, 34, 207
- Herbig (1966) Herbig, G. 1966, VA, 8, 109
- Herbig et al. (2003) Herbig, G. H., Petrov, P. P., & Duemmler, R. 2003, ApJ, 595, 384
- Herter et al. (2012) Herter, T. L., Adams, J. D., De Buizer, J. M., et al. 2012, ApJ, 749, L18
- Hillenbrand & Findeisen (2015) Hillenbrand, L. A., & Findeisen, K. P. 2015, ApJ, 808, 68
- Hunter et al. (2006) Hunter, T. R., Brogan, C. L., Megeath, S. T., et al. 2006, ApJ, 649, 888
- Hunter et al. (2017) Hunter, T. R., Brogan, C. L., MacLeod, G., et al. 2017, ApJ, 837, L29
- Hunter et al. (2018) Hunter, T. R., Brogan, C. L., MacLeod, G. C., et al. 2018, ApJ, 854, 170
- Hussain & Mahmud (2019) Hussain, M., & Mahmud, I. 2019, JOSS, 4, 1556
- Kumar et al. (2016) Kumar, M. S. N., Contreras Peña, C., Lucas, P. W., & Thompson, M. A. 2016, ApJ, 833, 24
- Larson (1980) Larson, R. B. 1980, MNRAS, 190, 321
- Ligterink et al. (2020) Ligterink, N. F. W., El-Abd, S. J., Brogan, C. L., et al. 2020, ApJ, 901, 37
- Lim et al. (2020) Lim, W., De Buizer, J. M., & Radomski, J. T. 2020, ApJ, 888, 98
- Lindegren et al. (2018) Lindegren, L., Hernández, J., Bombrun, A., et al. 2018, A&A, 616, A2
- Liu et al. (2020) Liu, M., Tan, J. C., De Buizer, J. M., et al. 2020, ApJ, 904, 75
- Liu et al. (2018) Liu, S.-Y., Su, Y.-N., Zinchenko, I., Wang, K.-S., & Wang, Y. 2018, ApJ, 863, L12
- MacFarlane et al. (2019) MacFarlane, B., Stamatellos, D., Johnstone, D., et al. 2019, MNRAS, 487, 5106
- MacLeod et al. (2018) MacLeod, G. C., Smits, D. P., Goedhart, S., et al. 2018, MNRAS, 478, 1077
- MacLeod et al. (2019) MacLeod, G. C., Sugiyama, K., Hunter, T. R., et al. 2019, MNRAS, 489, 3981
- Mainzer et al. (2011) Mainzer, A., Bauer, J., Grav, T., et al. 2011, ApJ, 731, 53
- McGuire et al. (2017) McGuire, B. A., Shingledecker, C. N., Willis, E. R., et al. 2017, ApJ, 851, L46
- McGuire et al. (2018) McGuire, B. A., Brogan, C. L., Hunter, T. R., et al. 2018, ApJ, 863, L35
- Meyer et al. (2019) Meyer, D. M.-A., Haemmerlé, L., & Vorobyov, E. I. 2019, MNRAS, 484, 2482
- Meyer et al. (2021) Meyer, D. M. A., Vorobyov, E. I., Elbakyan, V. G., et al. 2021, MNRAS, 500, 4448
- Minniti et al. (2010) Minniti, D., Lucas, P. W., Emerson, J. P., et al. 2010, New A, 15, 433
- Pecaut & Mamajek (2013) Pecaut, M. J., & Mamajek, E. E. 2013, ApJS, 208, 9
- Reid et al. (2014) Reid, M. J., Menten, K. M., Brunthaler, A., et al. 2014, ApJ, 783, 130
- Robitaille & Bressert (2012) Robitaille, T., & Bressert, E. 2012, APLpy: Astronomical Plotting Library in Python, , , ascl:1208.017
- Robitaille (2017) Robitaille, T. P. 2017, A&A, 600, A11
- Safron et al. (2015) Safron, E. J., Fischer, W. J., Megeath, S. T., et al. 2015, ApJ, 800, L5
- Stecklum et al. (2021) Stecklum, B., Wolf, V., Linz, H., et al. 2021, A&A, 646, A161
- Szymczak et al. (2018) Szymczak, M., Olech, M., Sarniak, R., Wolak, P., & Bartkiewicz, A. 2018, MNRAS, 474, 219
- Temi et al. (2014) Temi, P., Marcum, P. M., Young, E., et al. 2014, ApJS, 212, 24
- Tigé et al. (2017) Tigé, J., Motte, F., Russeil, D., et al. 2017, A&A, 602, A77
- Tout et al. (1996) Tout, C. A., Pols, O. R., Eggleton, P. P., & Han, Z. 1996, MNRAS, 281, 257
- Towner et al. (2019) Towner, A. P. M., Brogan, C. L., Hunter, T. R., Cyganowski, C. J., & Friesen, R. K. 2019, ApJ, 875, 135
- Vorobyov & Basu (2015) Vorobyov, E. I., & Basu, S. 2015, ApJ, 805, 115
- Xue et al. (2019) Xue, C., Remijan, A. J., Brogan, C. L., et al. 2019, ApJ, 882, 118