Fiber Packing and Morphology Driven Moisture Diffusion Mechanics in Reinforced Composites
Abstract
Fiber reinforced polymer composite (FRPC) materials are extensively used in lightweight applications due to their high specific strength and other favorable properties including enhanced endurance and corrosion resistance. However, these materials are inevitably exposed to moisture, which is known to drastically reduce their mechanical properties caused by moisture absorption and often accompanied with plasticization, weight gain, hygrothermal swelling, and de-bonding between fiber and matrix. Hence, it is important to understand the mechanics of moisture diffusion into FRPCs. The presence of fibers, especially impermeable like Carbon fibers, introduce tortuous moisture diffusion pathways through polymer matrix. In this paper, we elucidate the impact of fiber packing and morphology on moisture diffusion in FRPC materials. Computational models are developed within a finite element framework to evaluate moisture kinetics in impermeable FRPCs. We introduce a tortuosity factor for calculating the extent of deviation in moisture diffusion pathways due to impermeable fiber reinforcements. Two-dimensional micromechanical models are analyzed with varying fiber volume fractions, spatial distributions and morphology to elucidate the influence of internal microscale fiber architectures on tortuous diffusion pathways and corresponding diffusivities. Finally, a relationship between tortuosity and diffusivity is established such that diffusivity can be calculated using tortuosity for a given micro-architecture. Tortuosity can be easily calculated for a given architecture by solving steady state diffusion governing equations, whereas time-dependent transient diffusion equations need to be solved for calculating moisture diffusivity. Hence, tortuosity, instead of diffusivity, can be used in future composites designs, multi-scale analyses, and optimization for enabling robust structures in extreme moisture environments.
Keywords Moisture Diffusion Diffusivity Tortuosity Finite Element Analysis Micromechanics
1 Introduction
Fiber reinforced polymer composite (FRPC) materials are widely used in structural applications within the aerospace, automotive, civil and marine industries due to their high specific strength, improved durability and corrosion resistance. When used in such applications, FRPCs are inevitably exposed to extreme conditions: moisture, low and high temperatures, pH, UV radiation and salinity, among others. Moisture, in particular, is a key environmental factor due to 1) its prevalence, although to different extents; 2) polymer matrices having a relatively high polarity when compared to reinforcing fibers and therefore a high affinity for absorbing moisture in humid environments; 3) the drastic reduction of FRPC properties caused by moisture absorption and often accompanied with plasticization, weight gain, hygrothermal swelling, and de-bonding between fiber and matrix [1, 2]. This necessitates an in-depth study of the mechanisms and avenues of moisture ingression through FRPCs.
Most prior experimental research conducted on FRPCs for establishing the effect of moisture diffusion involves measuring the weight gain response with various reinforcing fiber types (continuous or textile) and materials (Carbon, Glass, Kevlar) [3, 4, 5, 6, 7, 8, 9, 10, 11, 12, 13, 14, 15, 16, 17, 18]. In most studies, FRPC samples are subjected to moisture (chamber, submerged in water/seawater) and their weight gain is measured periodically, and further plotted as weight gain vs. time graphs. Key information obtained are the effective diffusivity and moisture saturation for specific FRPCs. Such studies are very important for identifying the overall effect of moisture diffusion and the extent of moisture absorption, although they only provide a global understanding of moisture diffusion and the local mechanisms are poorly understood or rarely captured. To understand these, other researchers have developed computational models within the finite element method to simulate moisture diffusion through FRPCs [19, 20, 21, 22, 23, 24, 25, 26, 27, 28, 29, 30, 31, 32, 33, 34, 35]. These frameworks have focused on predicting experimentally measured moisture diffusivities and global weight gain curves of FRPCs considering independent parameters like fiber volume fraction, fiber distribution and diffusivities of individual components (fiber and matrix). However, gaining a fundamental understanding of micro-scale moisture diffusion in terms of the effective fiber architecture has seldom been the focus.
Bond et al. [28] investigated the influence of fiber spatial distribution on moisture diffusivity computationally and stated that diffusion coefficient is unaffected between regular and random fiber distribution. Hence, they suggested that the regular fiber model is adequate for estimating diffusion coefficients for composites. However, Joliff et al. [36] showed that fiber arrangement has a significant impact on moisture diffusion when the fibers are in contact with each other, thereby, forming an effective barrier against diffusion. The results also showed that the rate of diffusion is greatly modified during initial (short) exposure times because of fiber arrangement, where the diffusivity of randomly distributed array is lower compared to that of a regular array of fibers. Aditya et al. [37] showed that moisture diffusivity is influenced by the cross-sectional shape of fibers. They computationally showed that the effective diffusivity is minimum for circular fibers, and it increases as the eccentricity of circular cross-section increases to become an elliptical cross-section. In their consecutive work [38], they considered computational models with many irregular shapes of fiber cross-section and determined that the percentage change in diffusivity when compared with circular fibers varies between -15.19% to 10.56%. In summary, prior research has shown that moisture diffusivity of fiber reinforced composites depends on fiber packing, fiber volume fraction, fiber cross-sectional shape and diffusion properties. Although these parameters are studied individually, further investigation is necessary to study the combined effect of these microscale fiber architecture on moisture diffusivity.
In this paper, we propose to capture the combined effect of fiber micro-architecture by introducing a tortuosity factor. Such a factor has previously been considered for capturing diffusive flow in porous electrodes [39]. In this paper, we will numerically determine the effective diffusivity and compare that with the tortuosity factor to account for the influence of fiber architecture on moisture diffusion in FRPCs. Particularly, we used Finite Element Method (FEM) for studying the moisture ingression in impermeable fiber reinforced polymer composites. First, we developed two-dimensional micromechanical models with different fiber volume fractions and fiber distributions to establish the influence of fiber distribution and volume fraction on the effective moisture diffusivity and to determine the tortuosity factor for these composites. Then, we studied the influence of fiber morphology (shapes) on tortuosity. Finally, we established a relationship between tortuosity that captures the fiber architecture (combined effect of fiber volume fraction, fiber distribution and fiber shape) and diffusivity. This relationship was validated for a set of test fiber micro-architectures.
2 Motivation and Significance
The main objective of this paper is to study how moisture diffusion occurs in FRPC composites. In particular, our model system is Carbon fiber reinforced polymer matrix (CFRP) composites, where Carbon fibers are considered to be impermeable to moisture diffusion. Hence, they typically act as barriers that make moisture diffusion pathways tortuous, thereby, delaying moisture ingression and consequently reducing moisture diffusivity. Fiber spatial distribution and morphology induced hindrance to moisture diffusion is quantified using a tortuosity factor, where an increase in tortuosity implies greater resistance to moisture diffusion. The tortuosity is obtained by solving steady state diffusion governing equation, which is computationally less expensive compared to transient diffusion equation that is solved for obtaining moisture diffusivity. Hence, by establishing a relationship between tortuosity and diffusivity, we can directly obtain diffusivity from tortuosity values for a large range of fiber architecture without having to perform diffusion analyses. This is particularly attractive within multi-scale analysis and optimization problems.
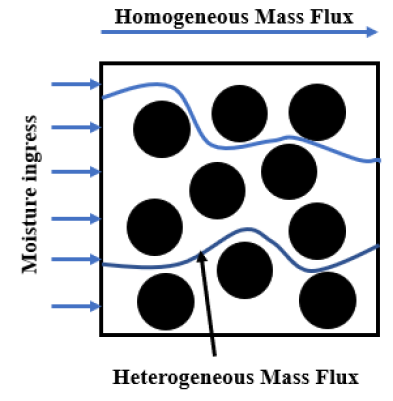
Further in this study, we consider one dimensional diffusion while modelling moisture kinetics. This is because FRPCs are typically used as large thin sheets or plates where thickness is very negligible compared to the in-plane dimensions. When used in structures, the faces are exposed to moisture which results in primary moisture flow direction occurring along the through-thickness direction, as explained in Figure 1.
In summary, the novelty of this paper is twofold:
-
•
We present a novel tortuosity factor within the realm of FRPCs that can capture the collective influence of fiber architecture. Although presented for 2D micromechanics models in this paper, the concept can be extended to 3D space and multiscale architectures. For example, our work can be extended to multi-scale analysis of 2D and 3D textile composites where the effect of weave patterns, tow cross-sections, tow waviness, etc. on moisture diffusion can be captured effectively by relating diffusivity and tortuosity.
-
•
By establishing a relationship between tortuosity and diffusivity, diffusivity can be readily estimated using tortuosity. Further, we can use tortuosity as a design parameter for FRPCs composites, within multi-scale analysis, and optimization problems instead of diffusivity. Such tortuosity factors can also be developed for calculating effective electrical and thermal properties.

3 Computational Models
Finite element method is used here for studying moisture diffusion in FRPCs. Two-dimensional representative volume element (RVE) micromechanical models are developed for understanding the effect of fiber distribution and fiber volume fraction on moisture diffusivity and tortuosity. These models consist of different spatial distribution of fibers in polymer matrix with a range of fiber volume fractions. Then, the influence of fiber morphology/shape on moisture diffusion is elucidated using a unit cell model. Finally, the combined effect of fiber architecture on moisture diffusivity and tortuosity is studied by modelling RVEs of real microstructures of FRPCs. Although the interphase between fibers and matrix could impact moisture diffusion, we have only considered two-phase (fiber and matrix) models in this paper due to lack of sufficient characterization of interphase chemistry in the literature. Having said that, the approach and models can be easily extended to three-phase models to include fiber-matrix interphases.
In this paper, the influence of fiber architecture on moisture diffusion and tortuosity is investigated first in two steps: 1) fiber volume fraction and spatial distribution, and 2) fiber morphology. Next, real microstructures from FRPCs are considered to capture the combined effect of fiber architecture on moisture diffusion and tortuosity.
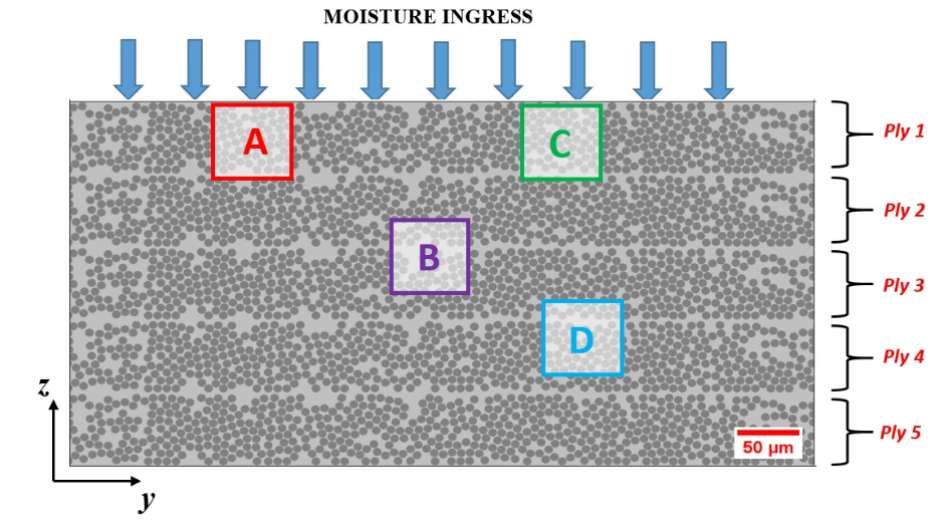
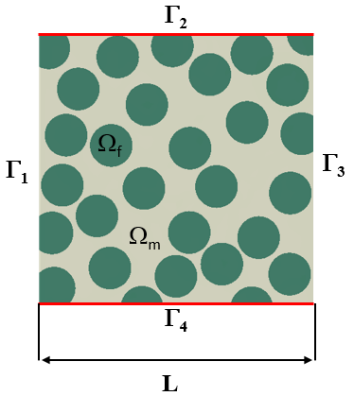
Fiber volume fraction and spatial distribution: 2D micromechanical finite element models of RVEs with spatially distributed fibers are considered as shown in Figure 2. Figure 2shows a representative cross-sectional image of a carbon fiber-reinforced polymer laminate with five plies where the dimensions along the y-axis are larger than dimensions along the z-axis. Here, A-D shows possible RVE types. In general, RVEs like A and C are not considered while modeling the effective elastic properties due to the boundary effect, and only RVEs like B and D which are in the bulk of the material are considered [40]. In our case, since the interest is in modeling the moisture diffusion from the boundary to the interior of the material, we consider RVEs like A and C that are at the boundary. In this work, only the moisture ingression that occurs along the thickness direction is considered since the composite’s length and width are orders of magnitude larger than the thickness. Therefore, the material periodicity in our 2D models is considered only in the y-direction for numerical simulations. Although, geometric periodicity is considered along the y-axis, we have not considered periodic boundary conditions in our models. Typically, there are three types of boundary conditions used for numerical homogenization in diffusion (conduction) problems, which are uniform concentration gradient boundary condition, uniform flux boundary condition, and periodic boundary condition. In this work, we have considered uniform concentration gradient boundary condition to calculate the tortuosity, which is the average flux along the z-axis, while the other surfaces are insulated. This process needs to be repeated depending upon the direction of interest. Further, these three boundary conditions converge to the same effective properties when the model is sufficiently large [41]. In our model, the size of the RVE is large enough such that the influence of either of the three types of boundary conditions mentioned above on the effective properties are minimal. Next, we discuss how we determined the converged size for our RVE.
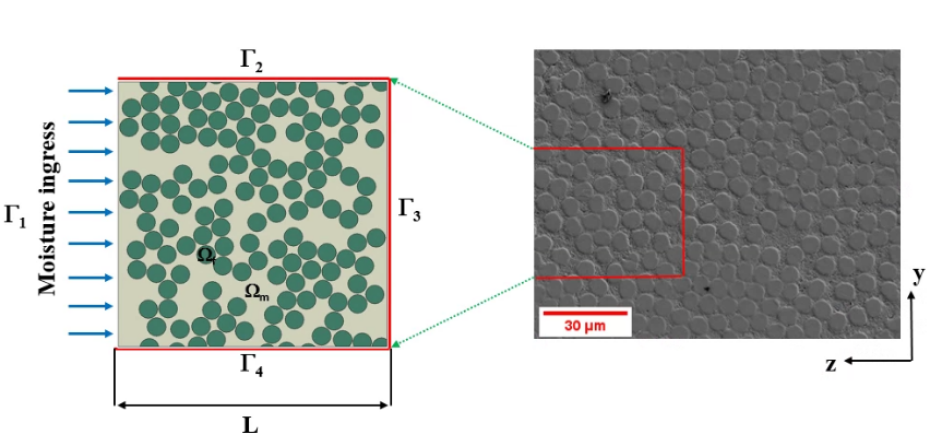
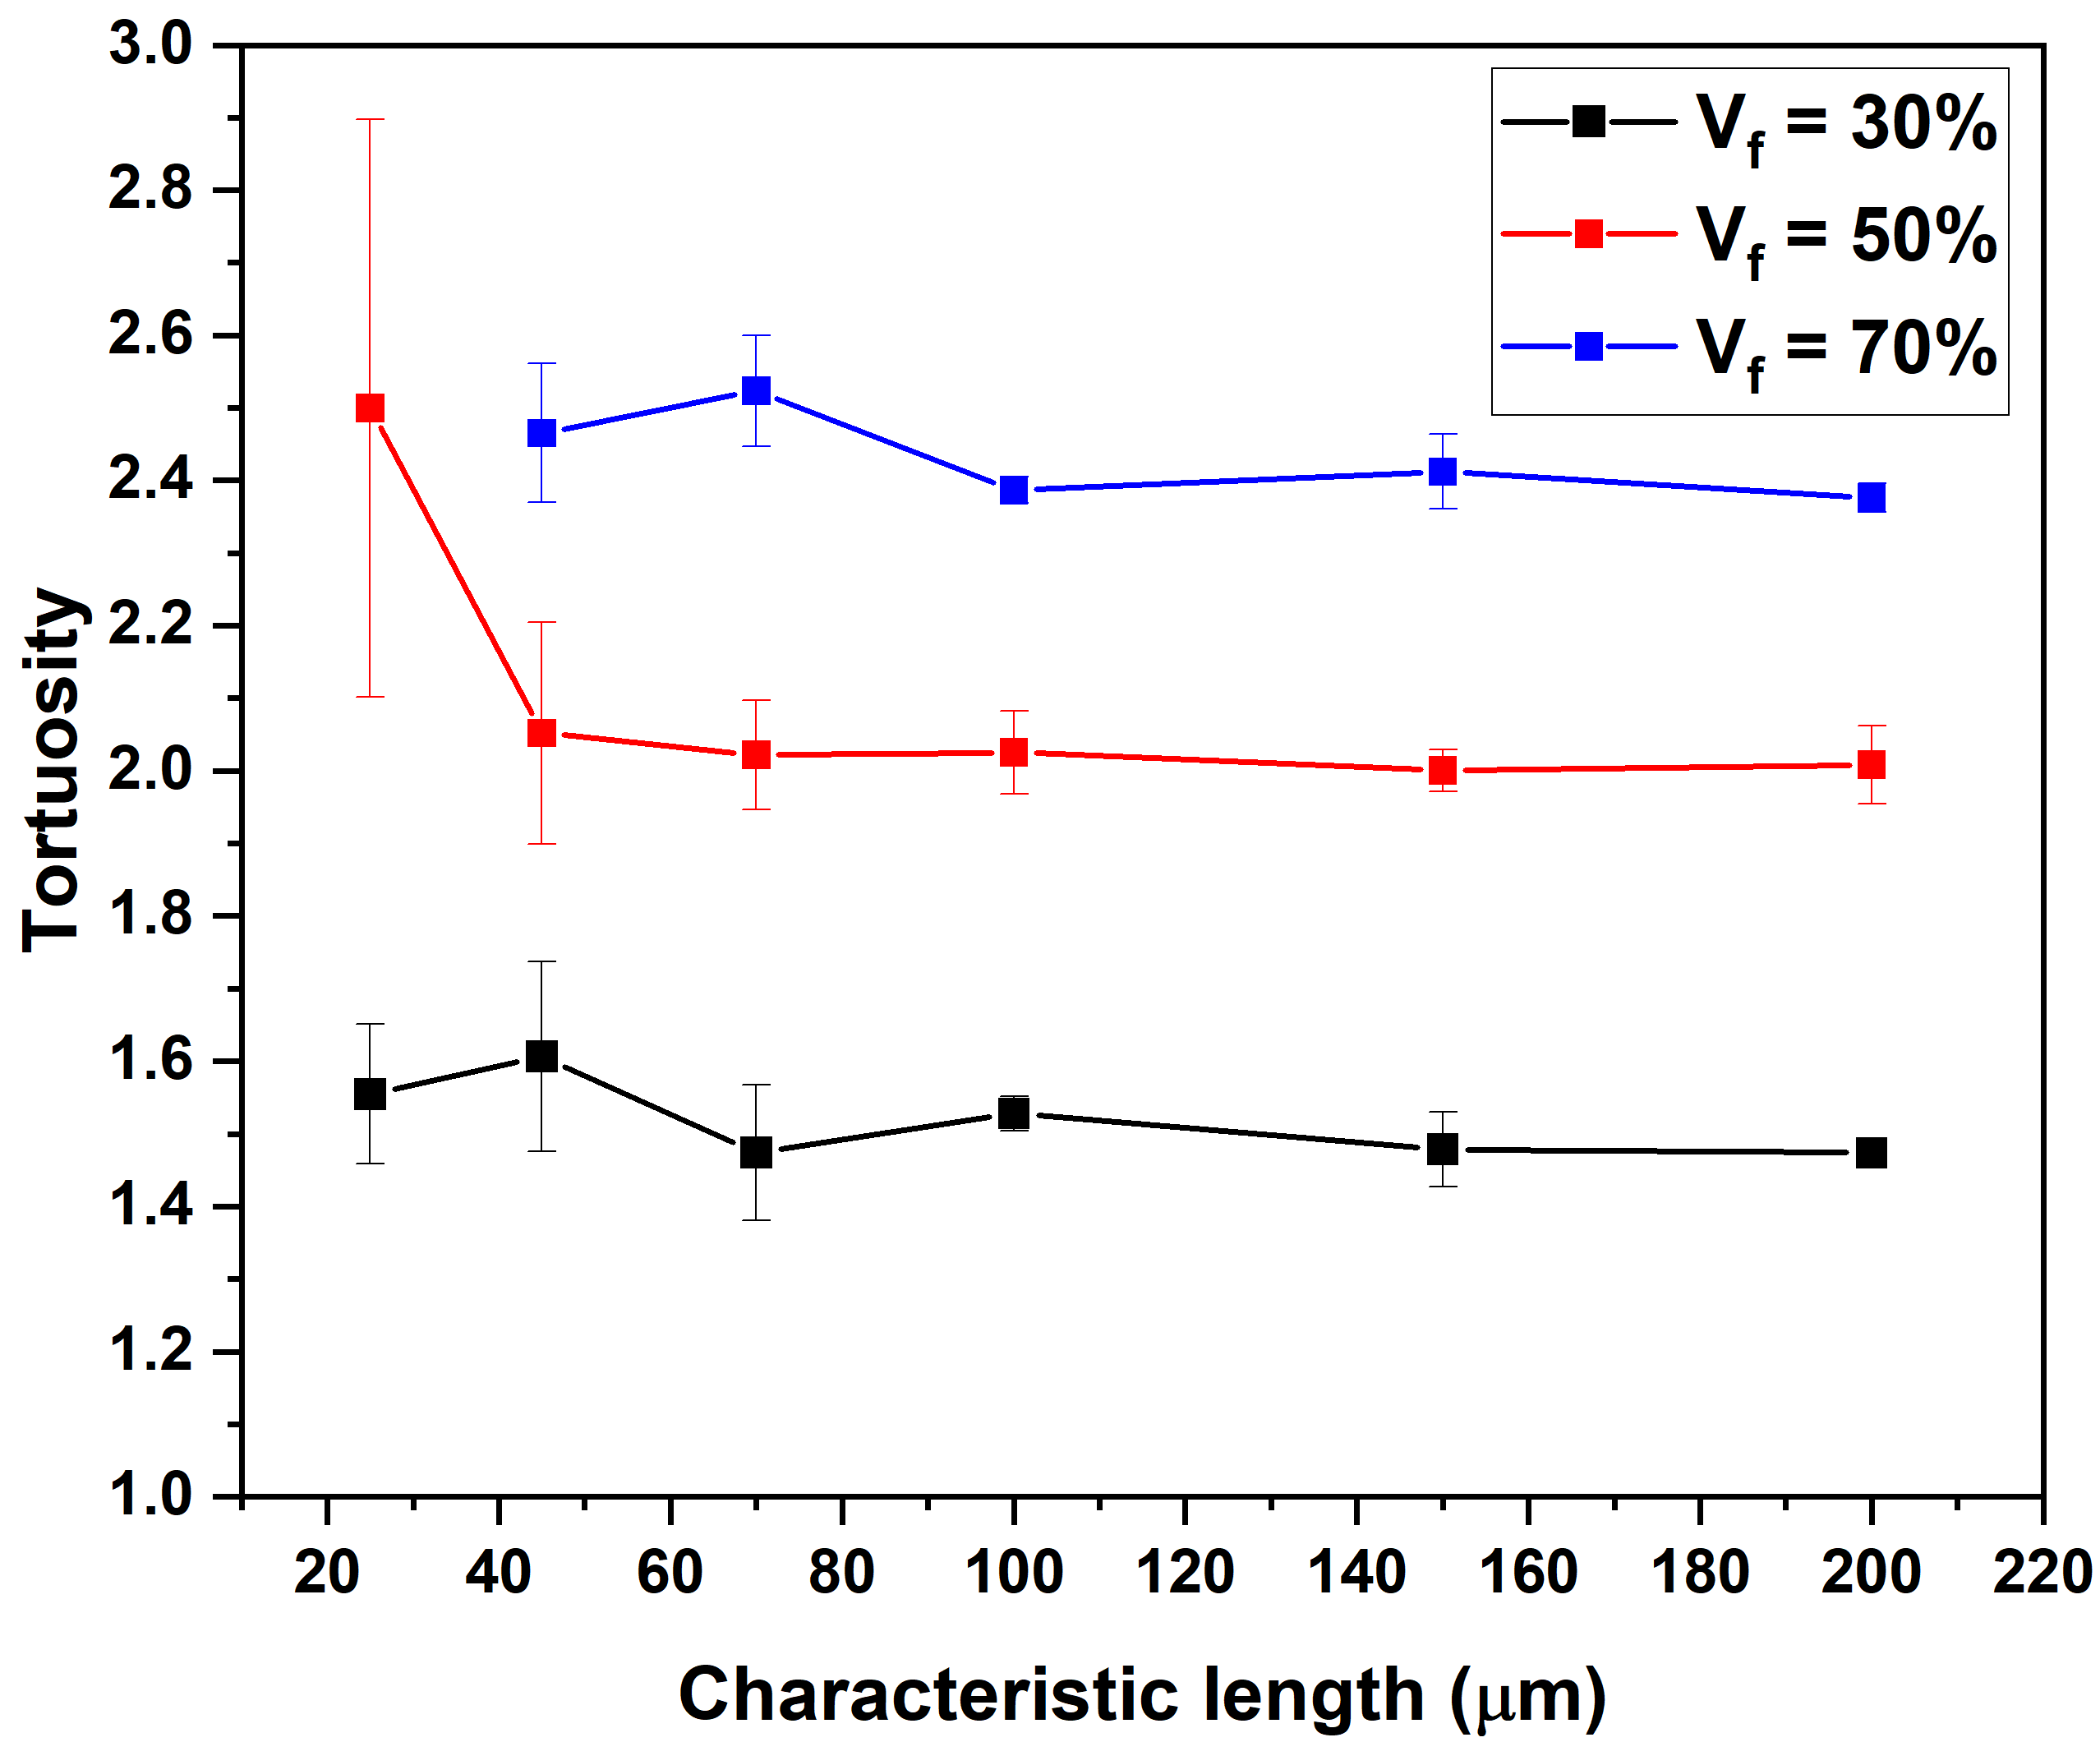
The overall domain of the models, , is the union of fibers and matrix regions given by . The dimensions of the entire domain, , is 100 x 100 and the fiber diameter is 7. The exterior boundaries of the domain are , where . We used a numerical statistical approach to determine the size of the RVE, where 2D square models with edge (characteristic) length of 25, 45, 70, 100, and 200 are first considered. For every RVE size mentioned above, five random fiber distributions each are generated for three fixed fiber volume fractions (30, 50 and 70 %). We then determined the effective diffusion properties in terms of tortuosity as described later in section 4.3. The mean value and standard deviation for all the RVEs for each volume fractions considered are calculated and plotted in Figure 3. We notice that the mean value of tortuosity converges to a plateau as the sample size increases. From this approach, RVE sample size of 100 x 100 is considered, which has less than 3% error compared to the largest RVE size.
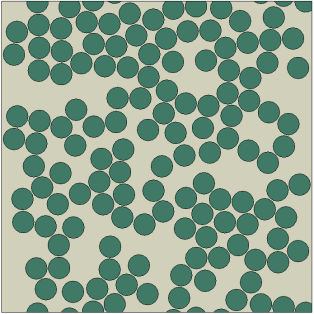
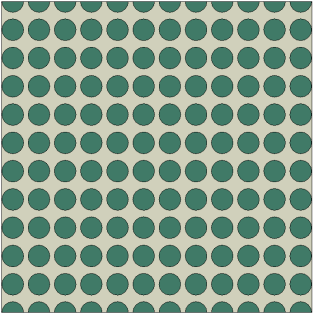
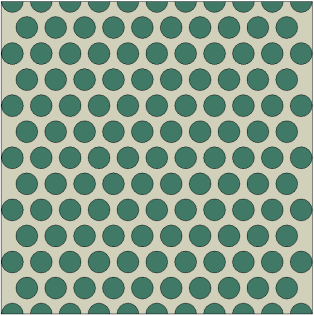
Extensive prior research has been performed using regular arrays of fiber distribution or by considering a unit cell in a 2D micromechanical model [2] [42] to determine the effective diffusivity of composites. In this paper, our model comprises of random fiber distribution and different volume fractions that closely captures the essence of the microstructure of a real composite shown in Figure 2 (right). One of the primary reasons for choosing such a representation is to emphasize the vital role of volume fraction, fiber distribution and associated tortuosity on moisture ingression in composite materials reinforced with fibers. We hypothesize that the tortuosity is enhanced by higher fiber volume fractions and more disorderliness in fiber arrangement, which reduces the effective diffusivity of moisture ingression into composites, thus, increasing the time needed for complete degradation of the material. Therefore, 2D models with different fiber distributions and volume fractions are created as shown in Figures 4, 4 and 4. Randomly distributed models with high fiber volume fractions like 60, 65 and 70% are created using a microstructure generation tool - VIPER [43]. These models are then imported into finite element framework for further analysis. A transient moisture diffusion boundary value problem is solved within the finite element framework in ABAQUS [44] to determine the effective diffusivity of each composite model considered. This time-dependent moisture diffusion is based on Fick’s second law, which will be discussed later in Section 4.
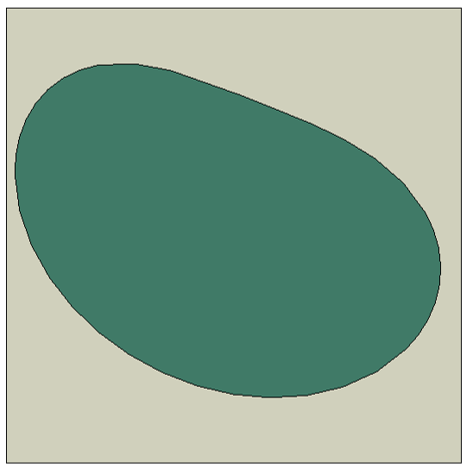
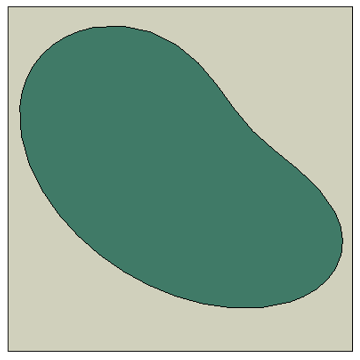
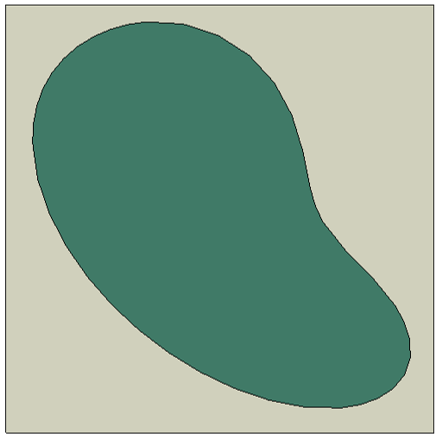
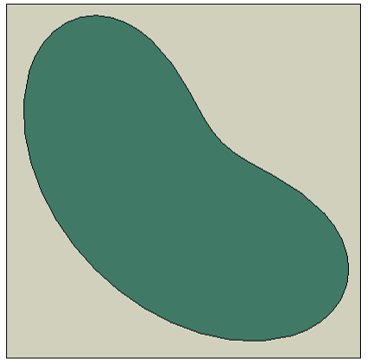
Fiber morphology: The morphology of fiber cross-section in FRPCs can play an important role on moisture diffusivity and tortuosity[37, 38]. In order to gain an in-depth understanding of the influence of fiber morphology on tortuosity, the morphological features have been further subdivided into 1) fiber cross-sectional perimeter (2D) or fiber cross-sectional surface area (3D) and 2) fiber orientation. For the fiber perimeter study, different fiber shapes like square, asteroid, octagon and circle are chosen such that the tortuosity is the same along the x and y directions. Then, to study the influence of fiber cross-section angle, an elliptical cross-section is chosen and the tortuosity is determined for different fiber cross-sectional angle starting at 0 degrees to 90 degrees of the major axis to the x axis. However, since the real microstructure is a combination of circular and deformed shapes, different bean curved cross-sectional shapes are considered using the following parametric equations:
| (1) |
where, r is the radius, a and b are morphology parameters. Few unit cell models with deformed fiber cross-sections having constant cross-sectional area and different morphology parameters are shown in Figure 5.
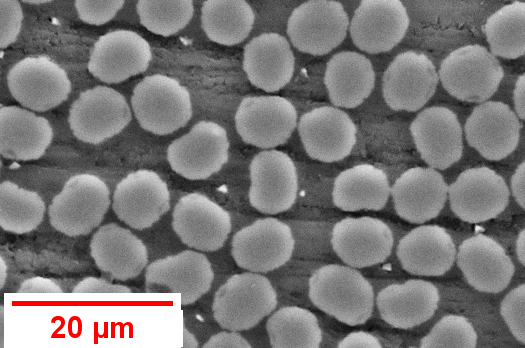
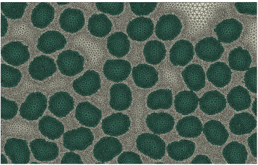
Real microstructure: Diffusivity and tortuosity of real microstructures within FRPCs are determined next by developing their microscale models. To that end, images of CFRP composites at the microscale are obtained using a Zeiss LEO 1550 VP (Carl Zeiss Jena GmbH–Planetariums, Germany) field emission scanning electron microscope (SEM) at UW-Madison. Specimen cross-sections are polished thoroughly using SiC grinding paper up to 1200 grit size followed by polishing using DACRON II polishing cloth with 1-0.1 mm diamond solution. Then, the cross-section of these specimens are examined under 15 kV electron beam and secondary electron detector to obtain different magnified images with high resolution. The polished gray scale cross-section images similar to the one shown in Figure 6 from SEM are converted into two-phase binary images as shown in Figure 6 using an image processing tool. These binary images are imported into MATLAB and converted into finite element mesh using im2mesh and MESH2D, which is a simplified version of the mesh generation algorithm presented in [45, 46].

4 Diffusion and Tortuosity Modeling
4.1 Governing Equations and Input Properties
The governing equation for transient moisture diffusion is given by,
| (2) |
where, is the moisture concentration, is the flux associated with moisture and is the diffusion coefficient of moisture or diffusvitiy. The total domain , where is the fiber domain and is the matrix domain as shown in Figure 2. The exterior boundary of this domain, . Equation 2 cannot be directly applied to composites because of material heterogeneity. Therefore, a normalized concentration term is used for the diffusion analysis in order to overcome the discontinuities at multi-material interfaces. The normalized concentration and corresponding flux are defined in Equation 3.
| (3) |
where, is the solubility.
| (4) |
This approach of normalized concentration can be verified using interfacial chemical equilibrium law, where a wetness fraction (normalized concentration) function is introduced in the paper by Wong et al. [47]
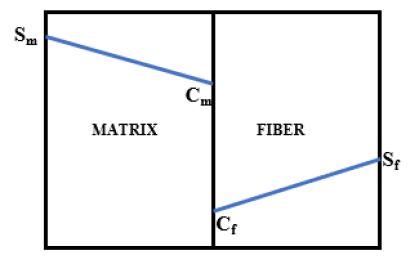
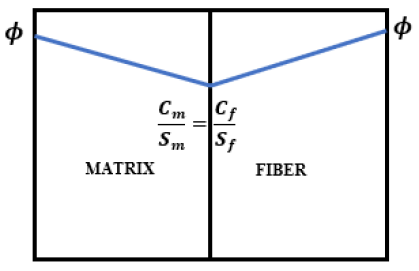
Here, we schematically explain the need for a normalized concentration approach for composites. Consider a bi-material domain as shown in Figure 7 which is representative of a FRPC material with different solubility limits for fiber and matrix. Saturation concentration of fiber is not equal to that of the matrix, which introduces a discontinuity at the interface. Figure 7 shows a schematic of the concentration in the fiber and matrix regions upon solving the original Fick’s law with concentration is the variable. There exists a discontinuity at the interface between the two materials. Here, and are the solubility limits (saturation concentration) of the matrix and fiber, respectively, and and are the moisture concentration of matrix and fiber, respectively. Due to this discontinuity, it is not possible to solve for the concentrations using traditional finite element method.
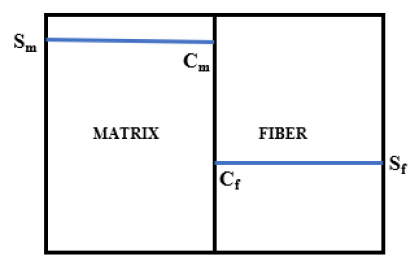
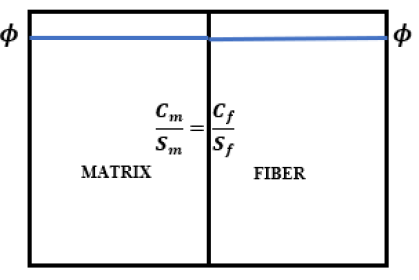
Upon normalizing the concentrations with their respective solubilities, the discontinuity at the interface is removed and becomes continuous according to the Nernst partition rule [48]. Figure 8 represents the normalized concentration approach, where,
| (5) |
The boundary conditions for the 2D micromechanical model are:
| (6) |
The transient diffusion governing equations described in Equations 2 and 6 are solved using finite element method to determine effective diffusivity of moisture in micromechanical models. Quadratic triangular elements (DC2D6) within ABAQUS are used for mesh generation, and a convergence study is performed to determine the optimal mesh. The material properties for both fiber and matrix (resin) are given in Table 1. Here, the diffusivity for fibers is considered to be 0 since the diffusivity of fibers is very negligible compared to that of the matrix [49]. This assumption is valid for Carbon and Glass fibers, whereas invalid for Kevlar fibers as they absorb significant amount of moisture. Material properties of Epoxy Resin (LY 556) with HT 972 Hardener were obtained from [1].
| Properties | Fiber | Matrix |
|---|---|---|
| Diffusivity () | 0 | 1.637 x 10⁻⁷ |
| Solubility | 1 x 10-36 | 2.1 |
4.2 Effective Diffusivity Calculation
For calculating the coefficient of diffusion or moisture diffusivity for FRPCs, we used the theory proposed by Shen and Springer [49] that predicts the coefficient of diffusion under constant temperature and moisture content. They developed an equation that relates moisture content in composites as a function of time with directional diffusivities, geometrical properties and saturation concentration. The percentage moisture gain in composites is given by,
| (7) |
where, is the weight of a dry specimen after manufacturing, that is, at . is the weight of the specimen at a later time instant .
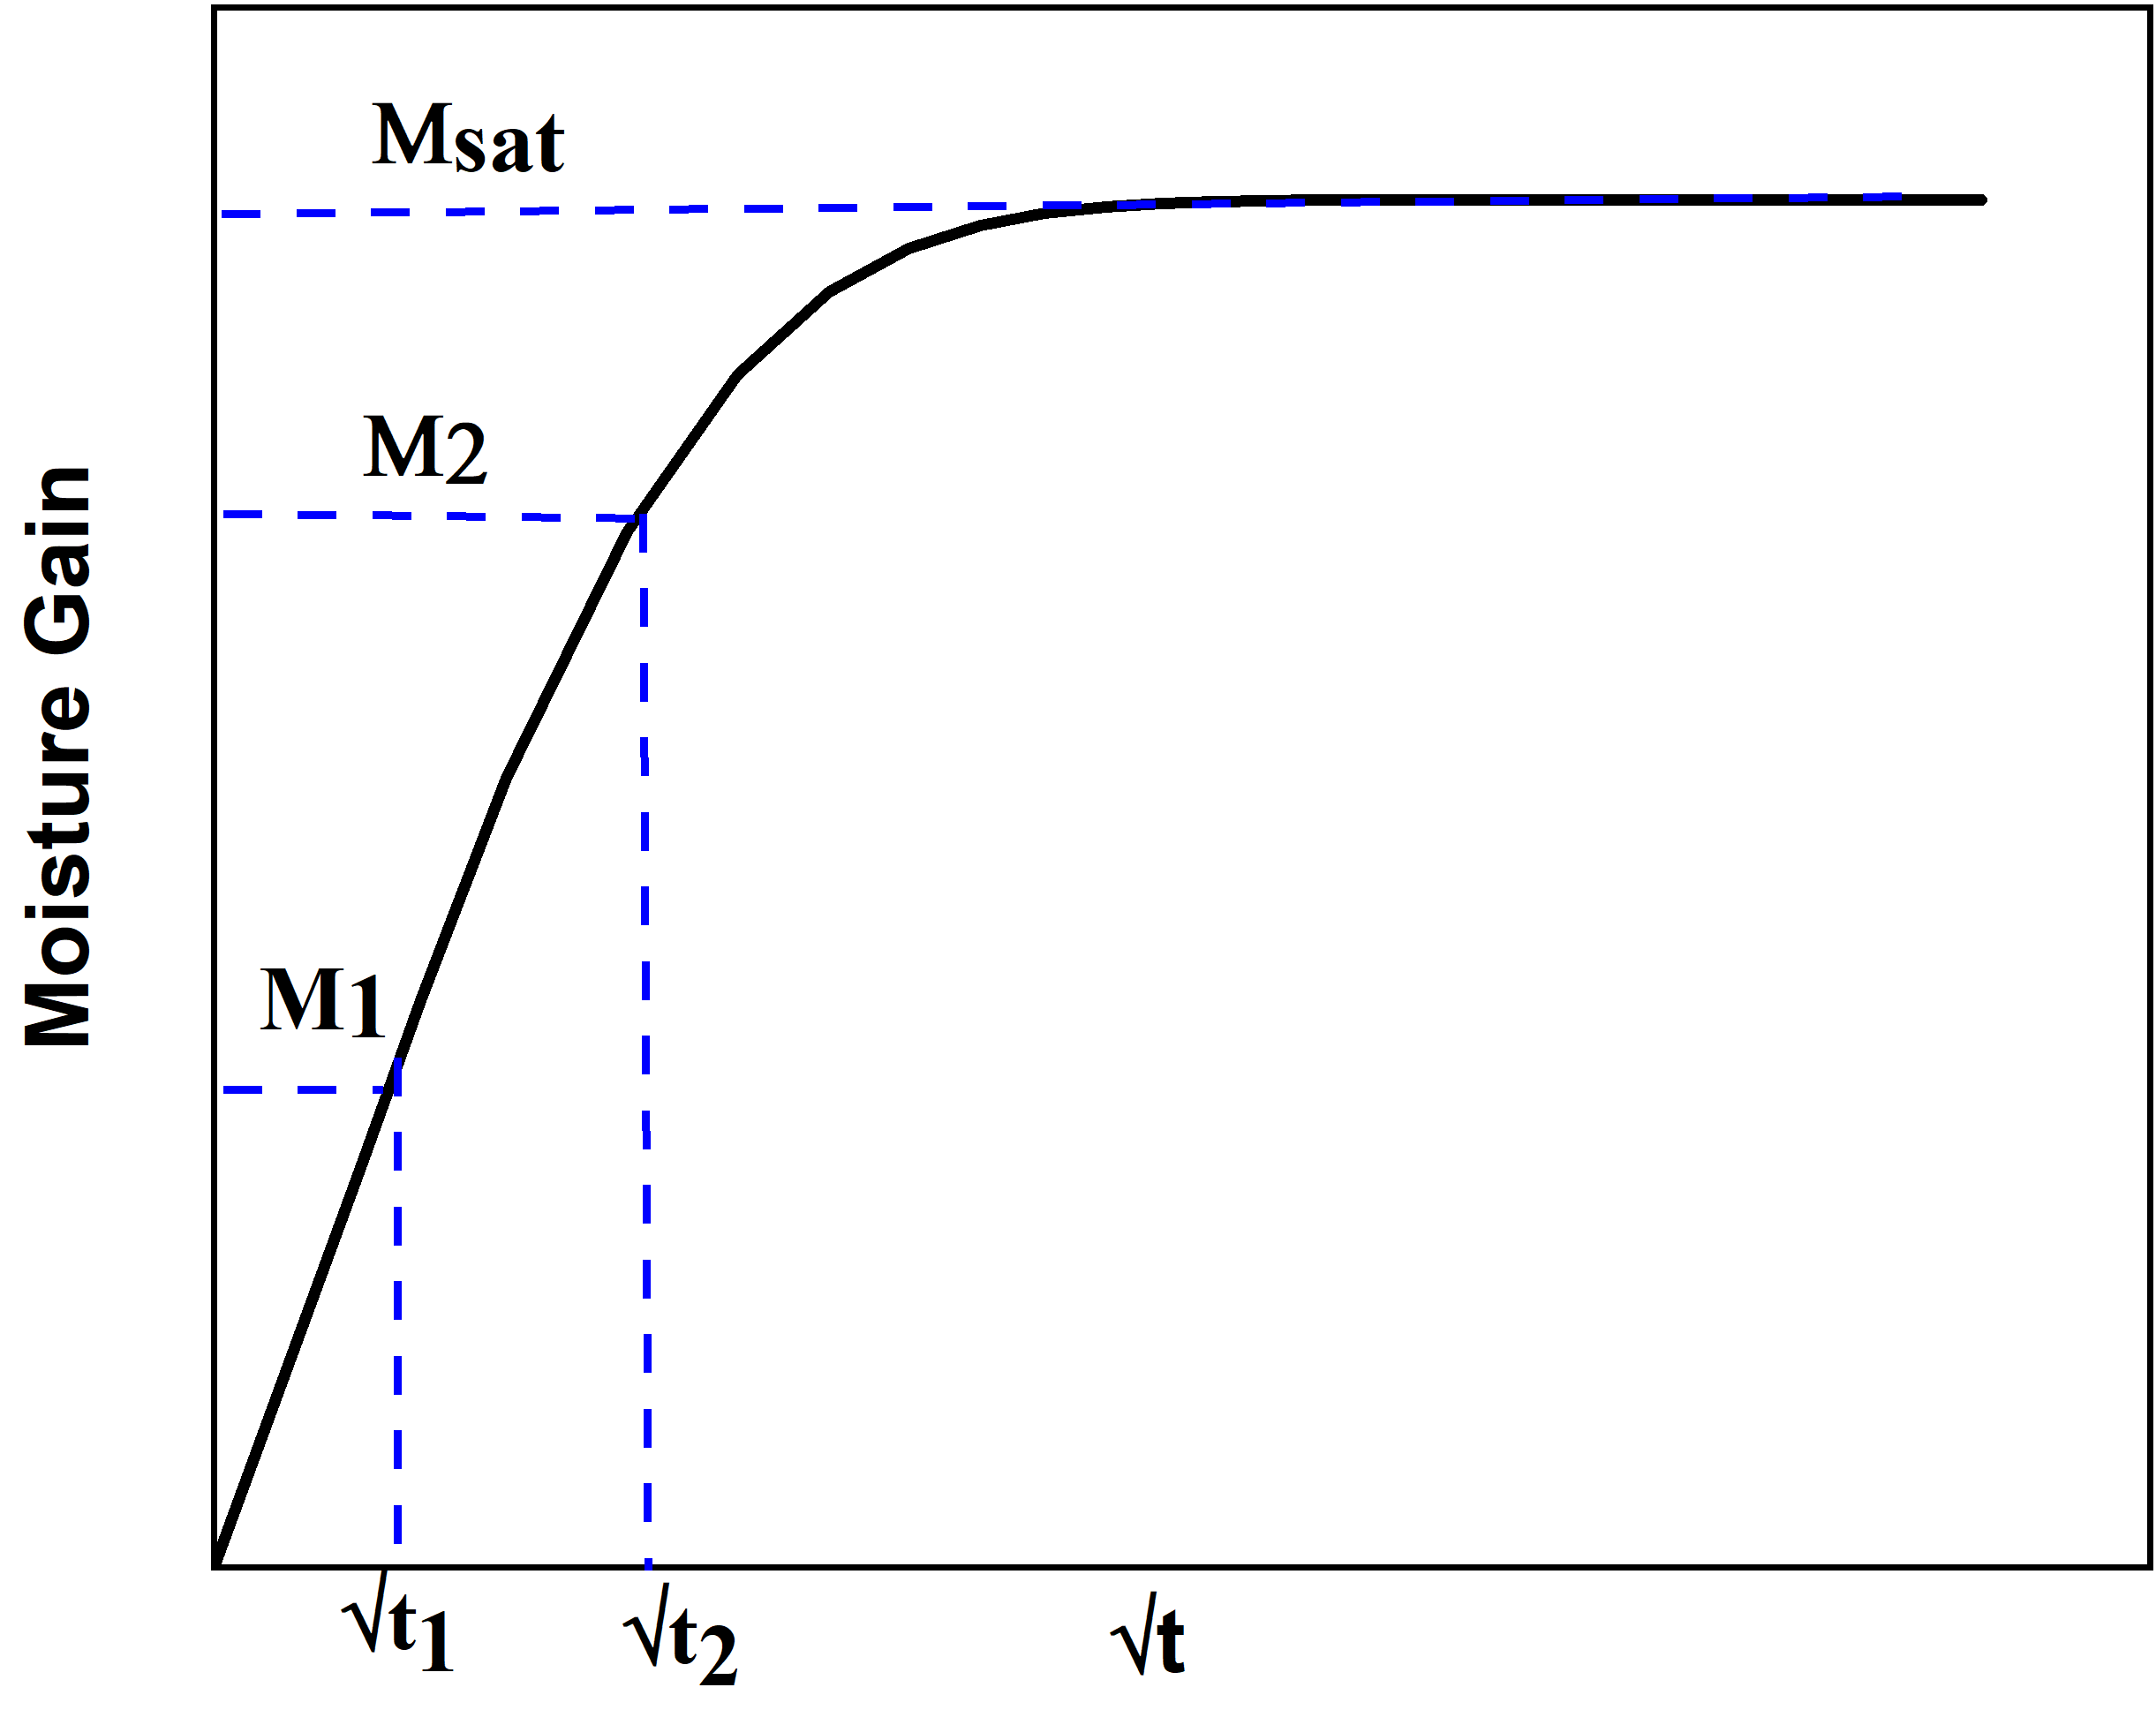
Moisture gain as a function of time is given by,
| (8) |
where, is the moisture concentration at saturation. and are the moisture diffusivities along x,y and z directions, respectively. is time, and and are the thickness, width and length of the composite, respectively. Shen and Springer [49] considered a composite exposed to moisture on the top and bottom surfaces perpendicular to the thickness direction. They also assumed that the dimensions of the composite along the x and y directions to be infinite, which makes the concentration change along the x and y directions to be negligible. In our current study, since the diffusion is considered to occur primarily along thickness direction, in addition to being very small compared to the in-plan dimensions, the moisture gain is considered to primarily occur in the z direction. Hence, the terms and are neglected from Equation 8 making . Equation 8 is rewritten to relate the effective diffusivity with moisture gain as:
| (9) |
Considering time instants and in the initial linear region of the moisture gain response, we pick their corresponding moisture gains and . Hence, we have,
| (10) |
Subtracting the above two equations and rearranging gives:
| (11) |
Diffusivity is numerically calculated by first performing transient moisture diffusion analysis on micromechanical models. Moisture gain percentage the mass concentration at the centroid of each element. These values are averaged over the entire domain at several time instants to obtain the moisture gained by the composite over a time period until it attains moisture saturation concentration. Using the initial slope of the moisture gain curve, thickness along the flow direction and , the effective diffusivity is calculated using Equation 11. An empirical method for calculating effective diffusivity was also proposed by Shen and Springer [49] based on the similarities between heat conduction and mass diffusion. Here, they modified the analytical equation proposed by Springer and Tsai [50] for heat conduction to mass diffusion analysis. The transverse diffusivity is given by,
| (12) |
where and are the diffusion coefficient of resin and fiber volume fraction, respectively.
4.3 Tortuosity Calculation
Tortuosity has been predominantly used in electrochemical devices with highly complex electrode microstructure, which results in very tortuous electrolyte flow that plays an important role in ionic conductivity [51, 52, 53]. Tortuosity in a porous media is a significant parameter that characterizes diffusive flow within hydraulic transport, mass transport, electric, heat or ionic conduction. Several porosity-tortuosity associations have previously been published based on experiments, and a detailed review is given by Shen [39].
Tortuosity is geometrically defined as the ratio of the length of a convoluted path of a diffusive flow in a porous medium to the length of the shortest path in a homogeneous media.
| (13) |
where, is the length of a convoluted path and is the length of the shortest.
Originally, Epstein [54] coined a tortuosity factor that accounts for both the path length and change in diffusivity in a porous media. In their work [54], they use tortuosity factor within diffusion theory, where effective diffusivity of a porous medium is calculated based on the bulk diffusion coefficient.
| (14) |
where, , , and are the effective diffusivity, bulk diffusivity, pore volume fraction and tortuosity, respectively.
In 1935, Bruggeman [55] proposed a Porosity-Tortuosity empirical relationship shown in Equation 15, which is commonly recognized in the field of porous media flow and is often used to derive materials’ effective properties. They assumed that the heterogeneous media consisted of only spherical particles.
| (15) |
Both geometrical and flux based algorithms have been developed by researchers for determining the tortuosity factor. In geometry based algorithms[56, 57], tortuosity is calculated as defined in Equation 13 using the shortest pathway for which the pore centroid method and the fast marching method are commonly used. Whereas, in flux-based algorithms[58, 59, 60], the tortuosity factor is calculated by considering diffusion behaviour. In addition, flux based algorithms can be subdivided into voxel-based and mesh-based algorithms. We used a mesh-based approach [60] in this paper, where we perform finite element analysis to determine flux in heterogeneous media as described next. Mesh sensitivity analysis is performed to reduce the effect of the finite element mesh on the tortuosity calculation.
For calculating tortuosity factor, we run steady state diffusion analyses on micromechanical models with different fiber volume fractions as well as a model with matrix only. The governing equation and the boundary conditions are as follows:
| (16) |
Since tortuosity depends on the flow path, we obtained a tortuosity factor in the direction in which the moisture ingression occurs. By solving the Laplace equation shown in Equation 16 using finite element method, volume average of flux in the heterogeneous medium is determined. The volume average of flux in a homogeneous medium free of barriers (in our case, fibers) is also calculated. The tortuosity factor is determined using the expression shown in Equation 17, which is the same as Equation 14.
| (17) |
Here, is the volume of the heterogeneous domain, is the tortuosity factor and is generally termed as porosity or in our case the volume fraction of domain that is available for the movement of flux. In this paper, since we consider that only the matrix absorbs moisture, can be defined as 1- where is the fiber volume fraction.
5 Results and Discussion
5.1 Effect of Fiber Volume Fraction and Spatial Distribution on Tortuosity and Moisture Diffusivity
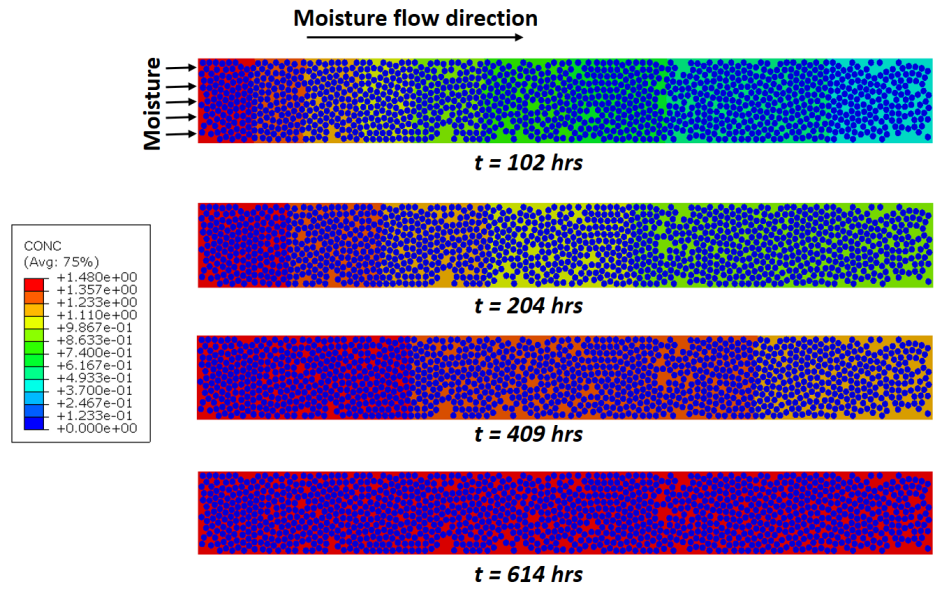
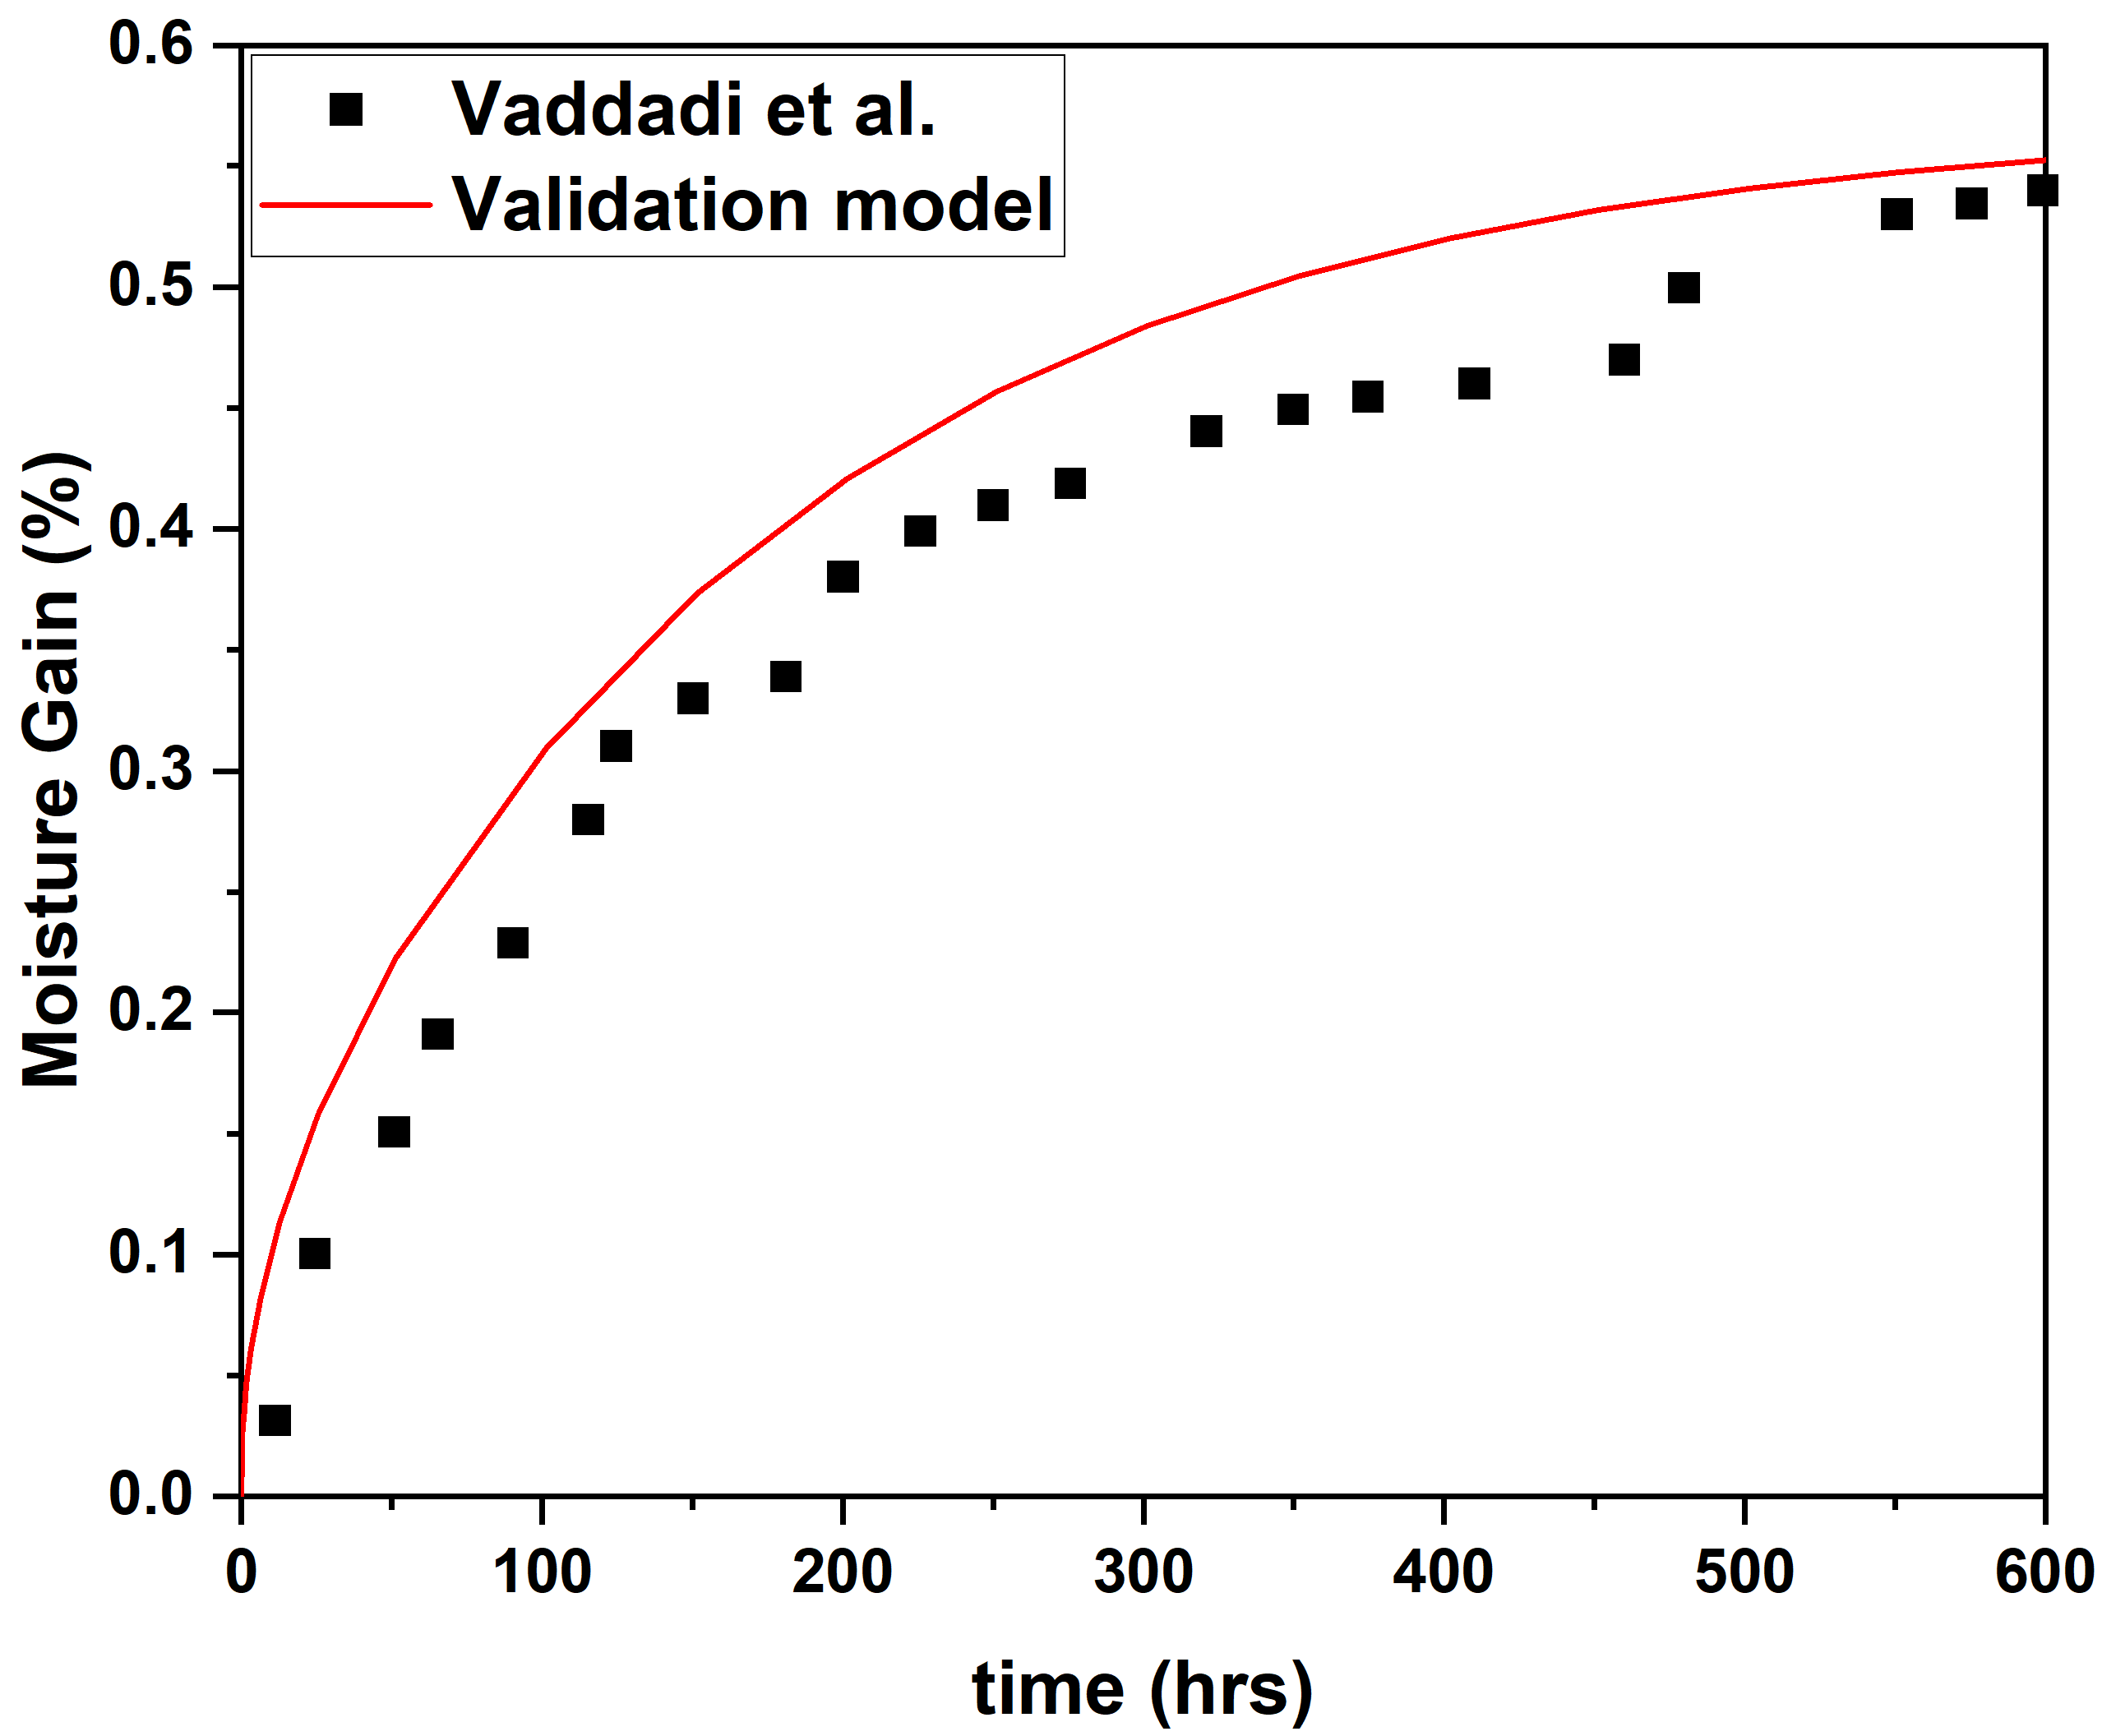
Our micromechanical model was first validated against experimental results from Vaddadi et al. [61] by comparing the rate of moisture gain and moisture saturation. These 2D micromechanical model comprised of carbon fibers and epoxy matrix system. This numerical model for validation considers moisture ingression for the case of temperature = 85°C and relative humidity of 85%. Carbon fibers are considered to be impermeable to moisture. Material properties for the matrix are considered as provided by Vaddadi et al. [61] The validation model is 600µm x 64 µm and consists of 1200 fibers of 5 µm diameter. The moisture ingression happens at the left edge of the sample with no flux boundary condition at all other edges as shown in Figure 11. Figure 12 shows the comparison of the rate of moisture gain and moisture saturation between the experimental and our numerical model. We could see small difference in rate of weight gain between the experimental and our numerical validation model which is mainly attributed to variation in the microstructural distribution between the two.
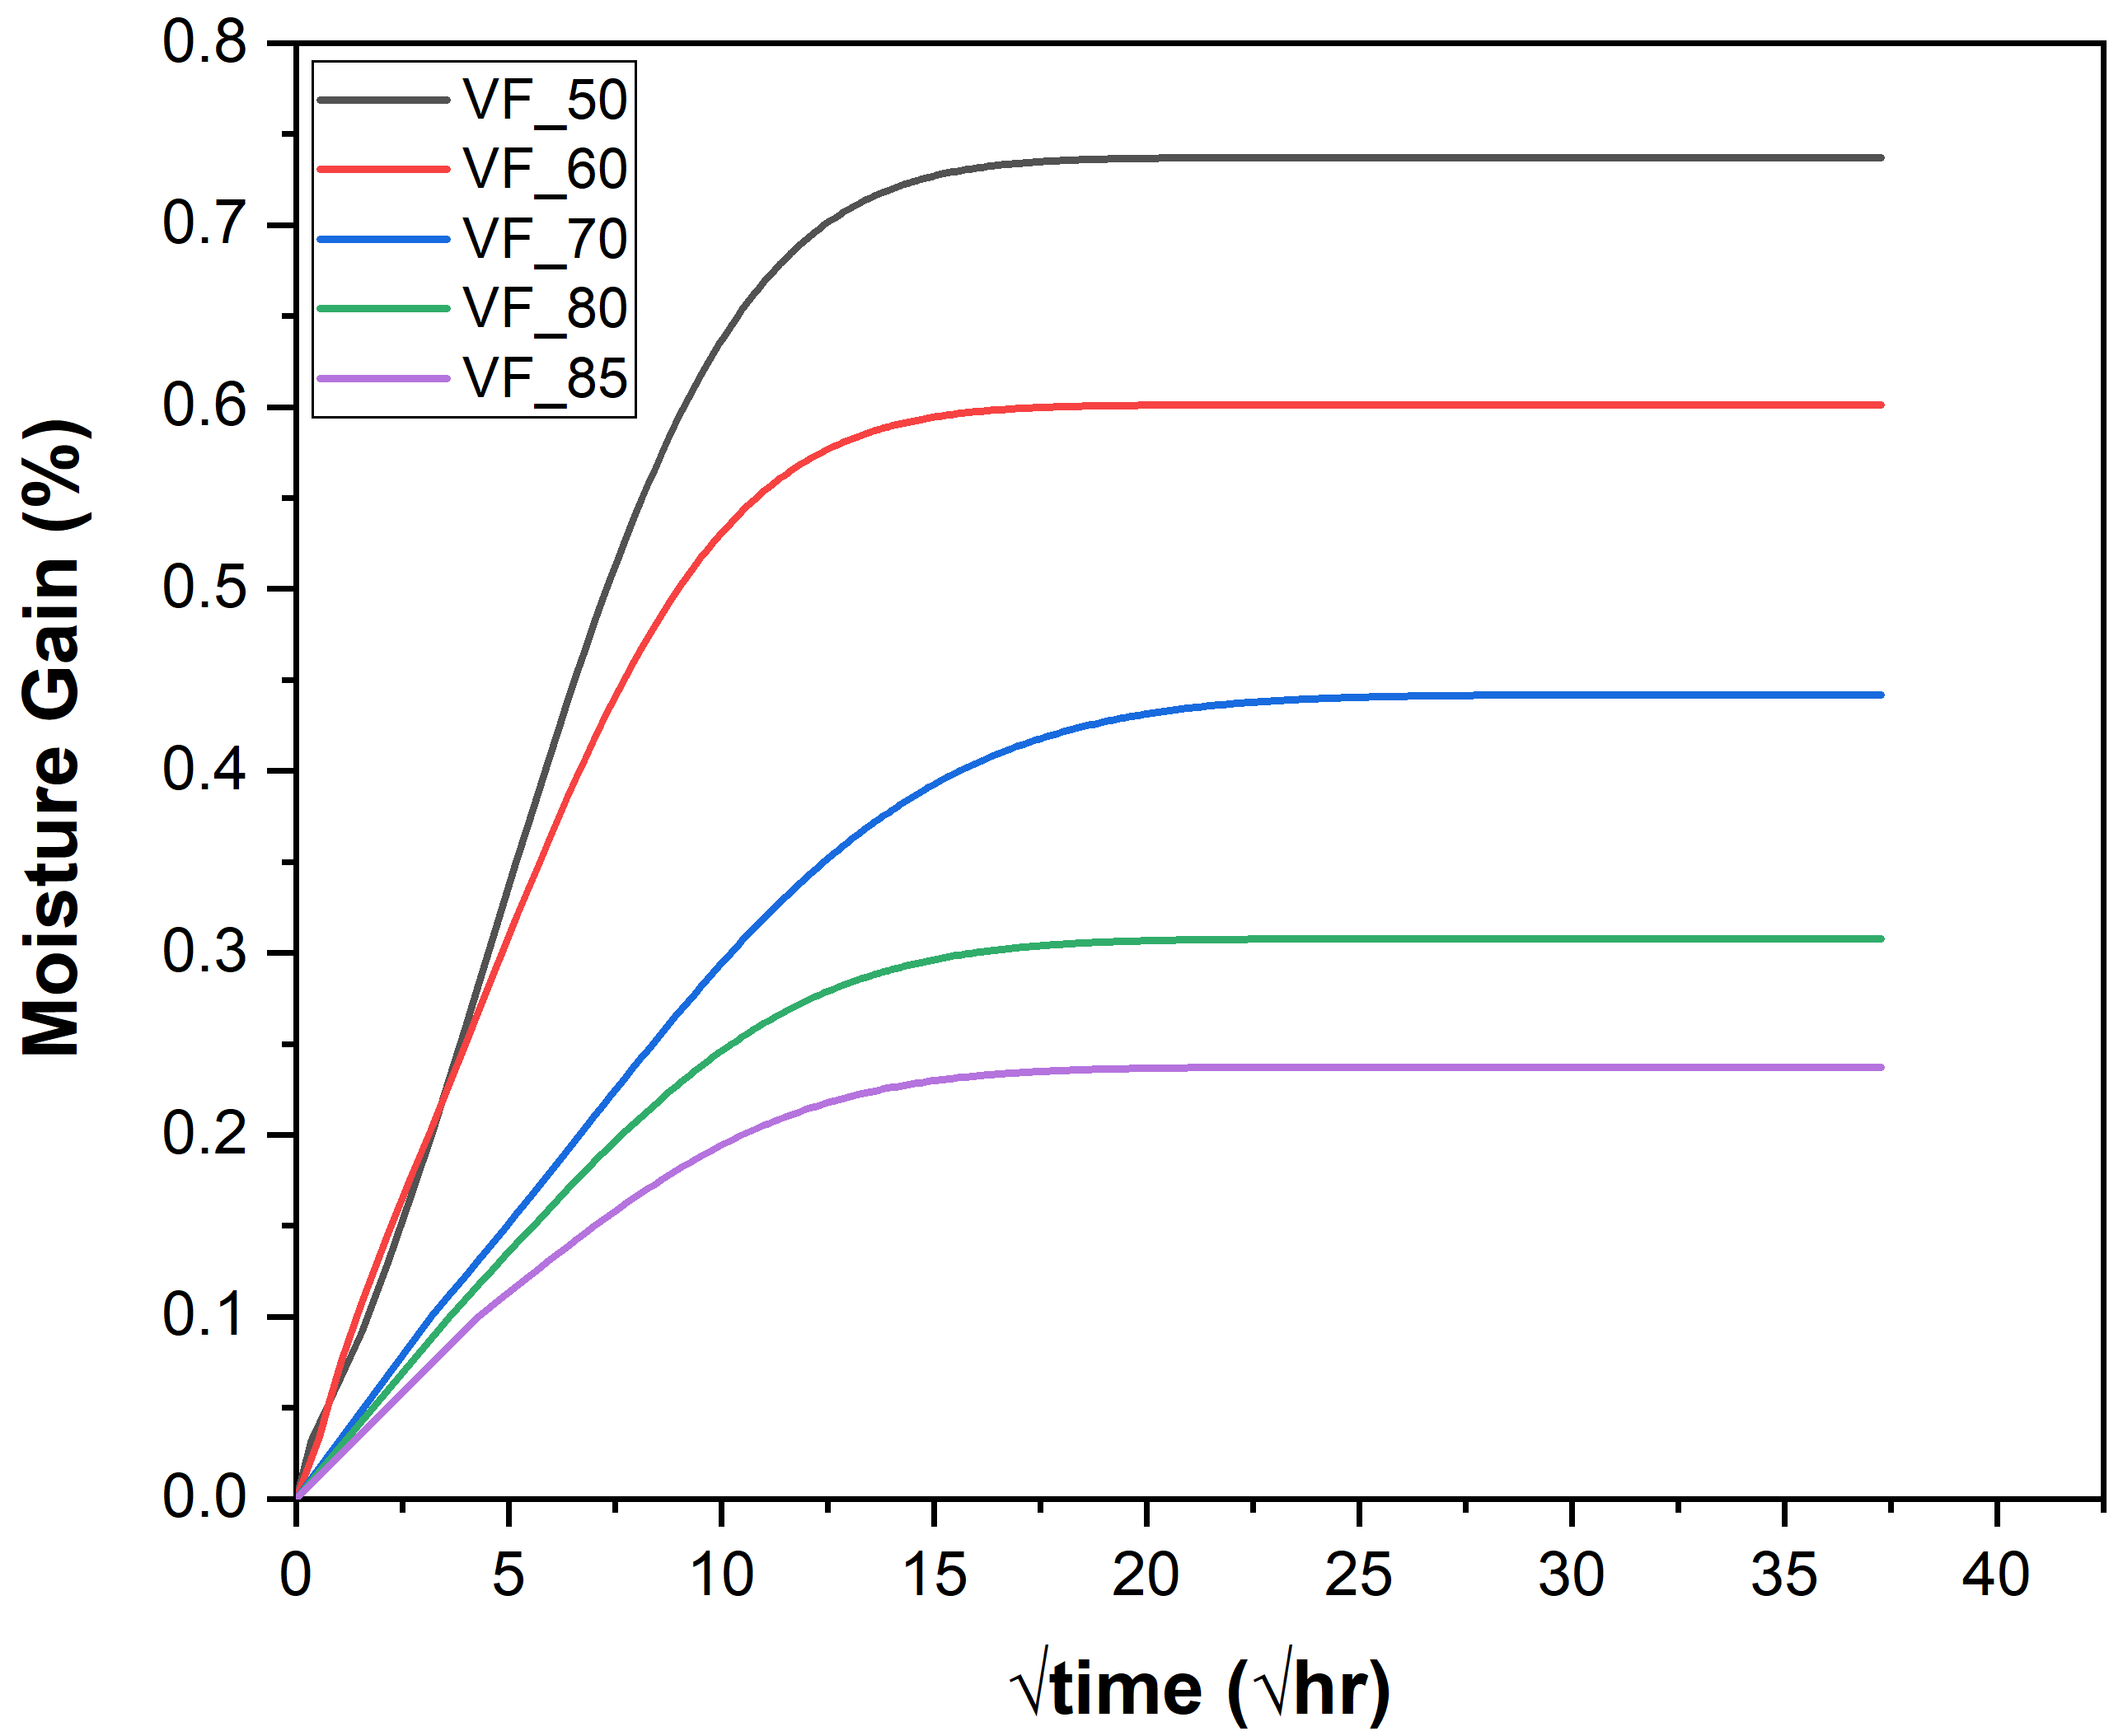
Next, 2D micromechanical models with different fiber spatial arrangements like square, hexagonal and random arrays with a range of fiber volume fractions of 50, 55, 60, 65 and 70% were considered for calculating diffusion and tortuosity. The geometry, material properties, governing equation and boundary conditions were mentioned previously in Section 4. In this model, one edge of the domain was exposed to moisture, while all the other edges were considered impervious to moisture. The average concentration (weight gain percentage) of moisture in the entire domain was recorded at different times from which the weight gain curves for different volume fractions were plotted. Using these weight gain plots, the effective diffusivity of composites was calculated using the method described in Section 4.2. As shown in Figure 13, the moisture saturation concentration changes with volume fraction of fibers.
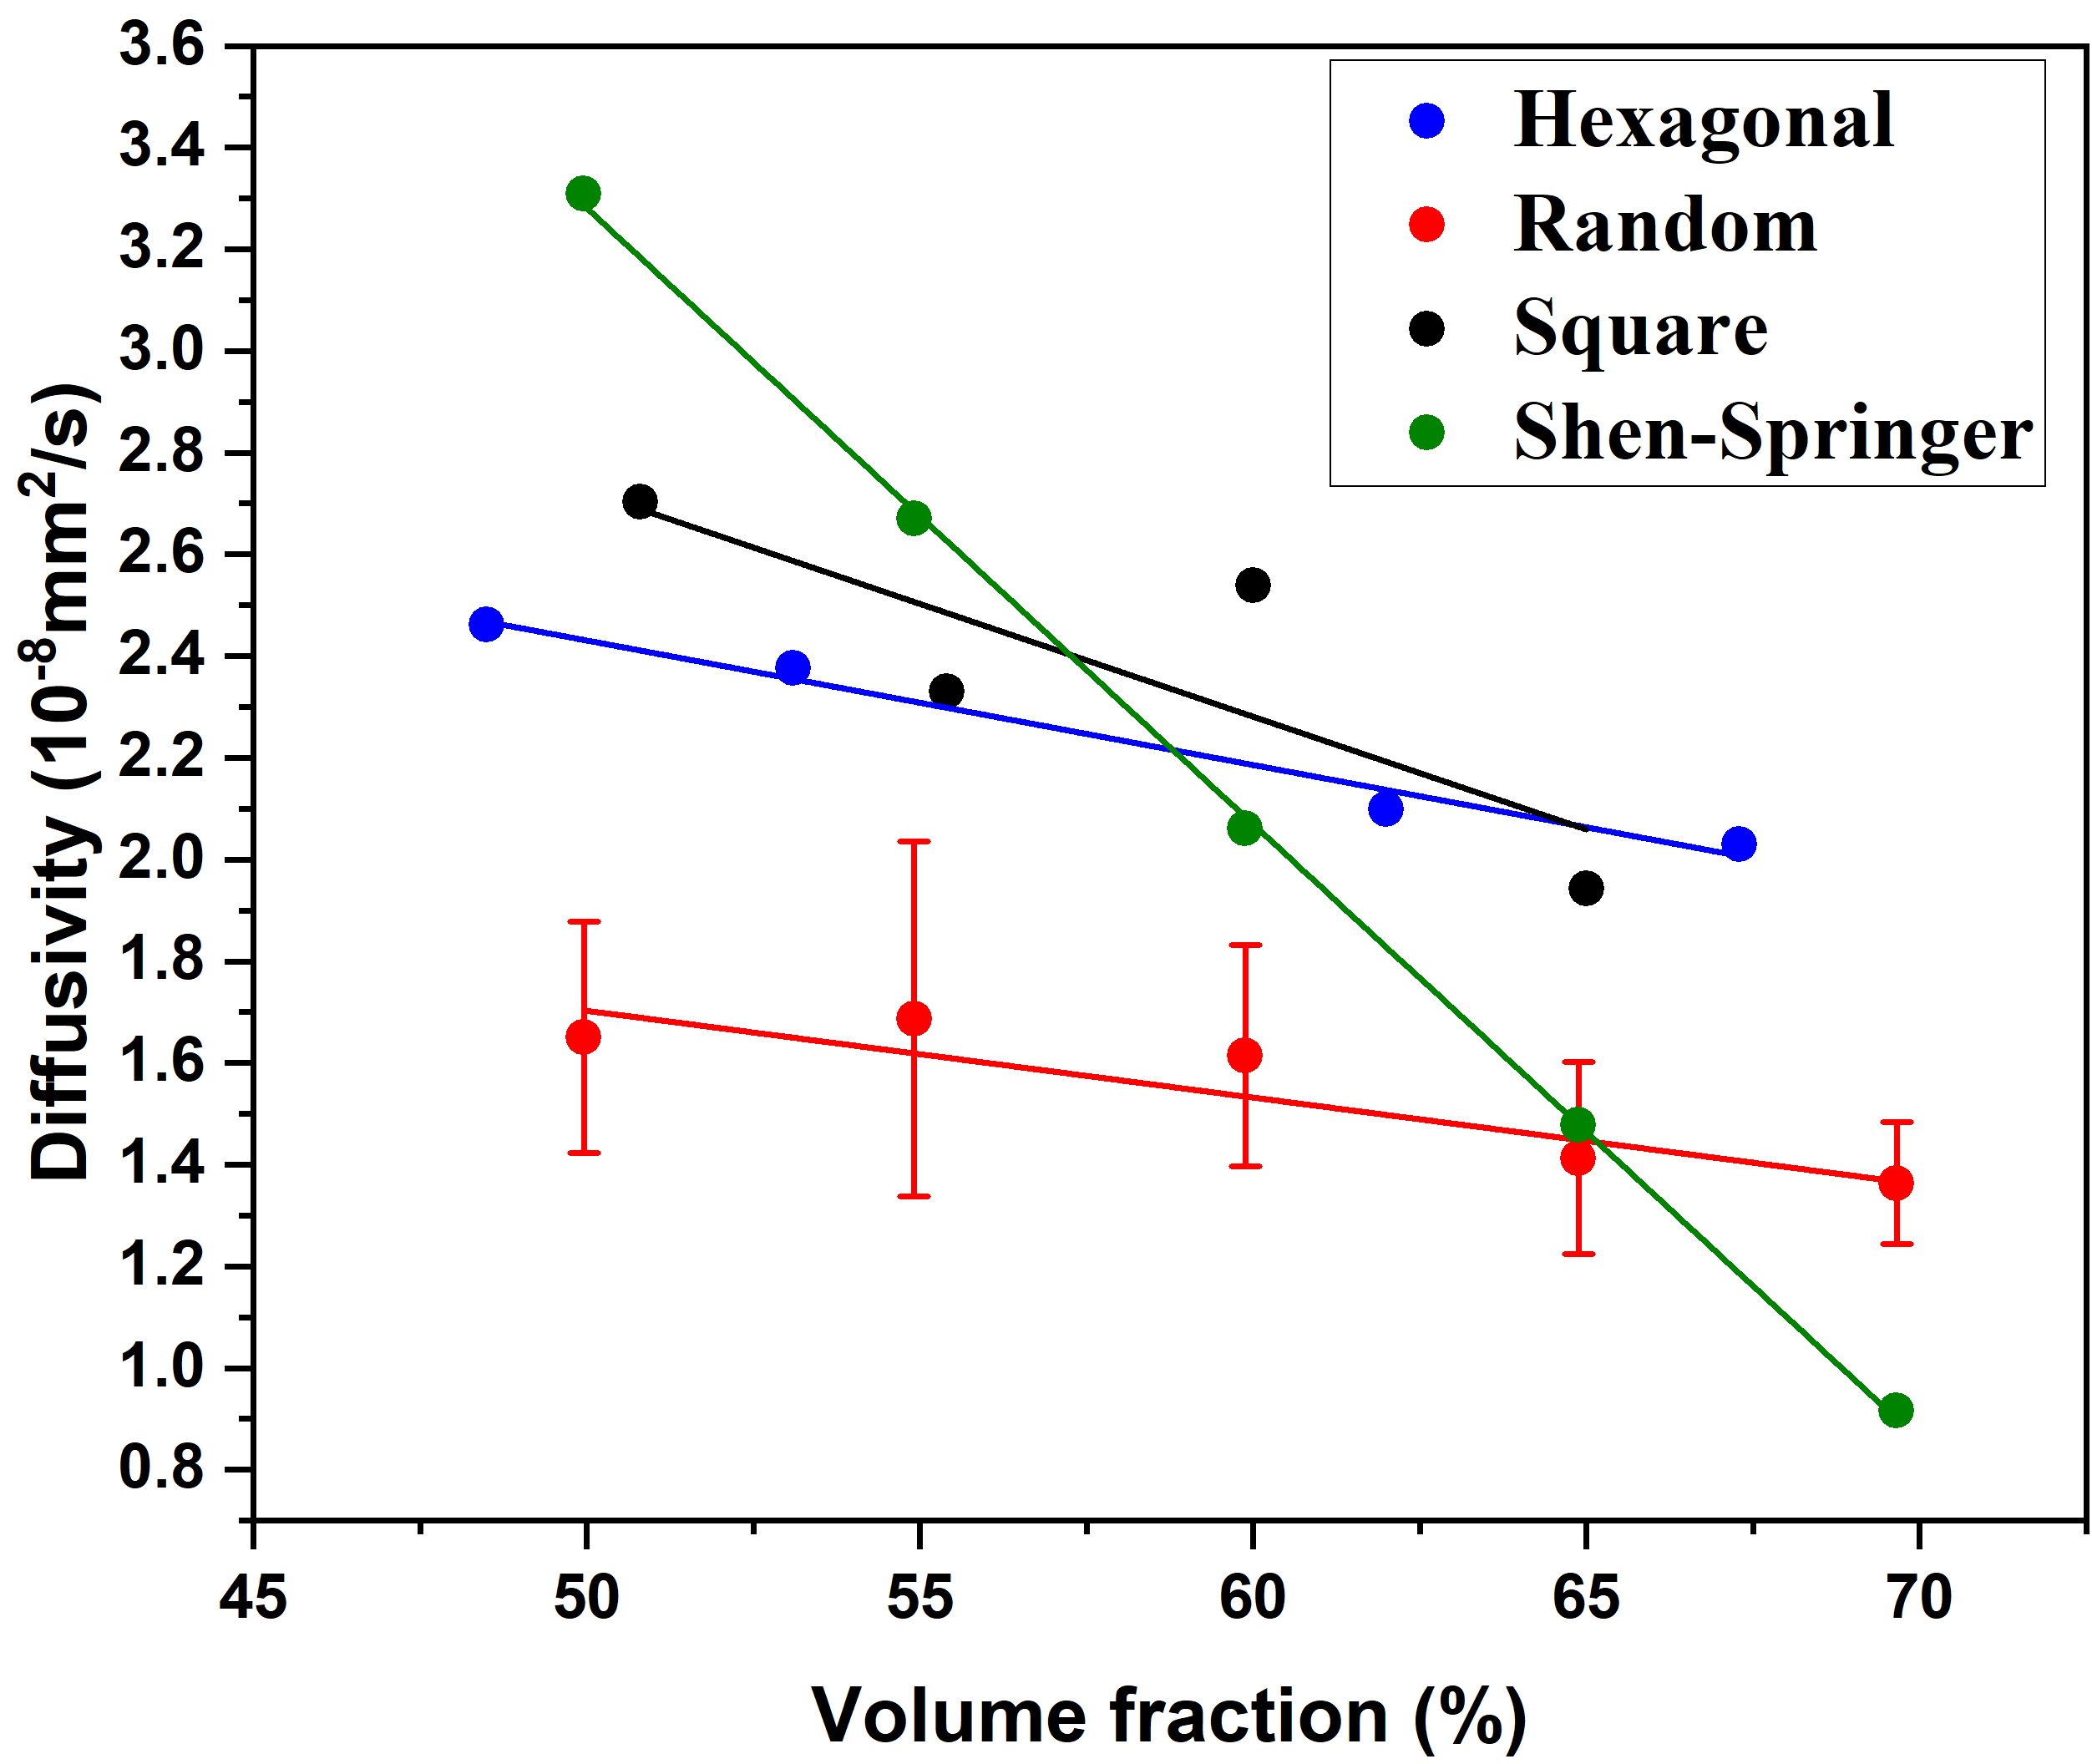
The effective diffusivity is plotted against volume fraction in Figure 14 for various fiber arrangements and an analytical method, where the effective diffusivity decreases with an increase in volume fraction for all models. Among all fiber spatial arrangements considered, the effective diffusivity of random fiber model is the lowest. One of the key reasons for this behavior is the disorderliness of fiber arrangement in this model. As mentioned before, we considered the Carbon fibers to be impermeable [1, 2, 49] in our models, as the moisture absorption by fibers is insignificant compared to matrix (resin). The fibers being impermeable to moisture, act as barriers that hinder the flow of moisture into the composites, thereby, increasing the time to reach saturation. Due to this behavior, the effective diffusivity is lower for the random fiber distribution model compared to those with regular patterns, like square and hexagonal array.
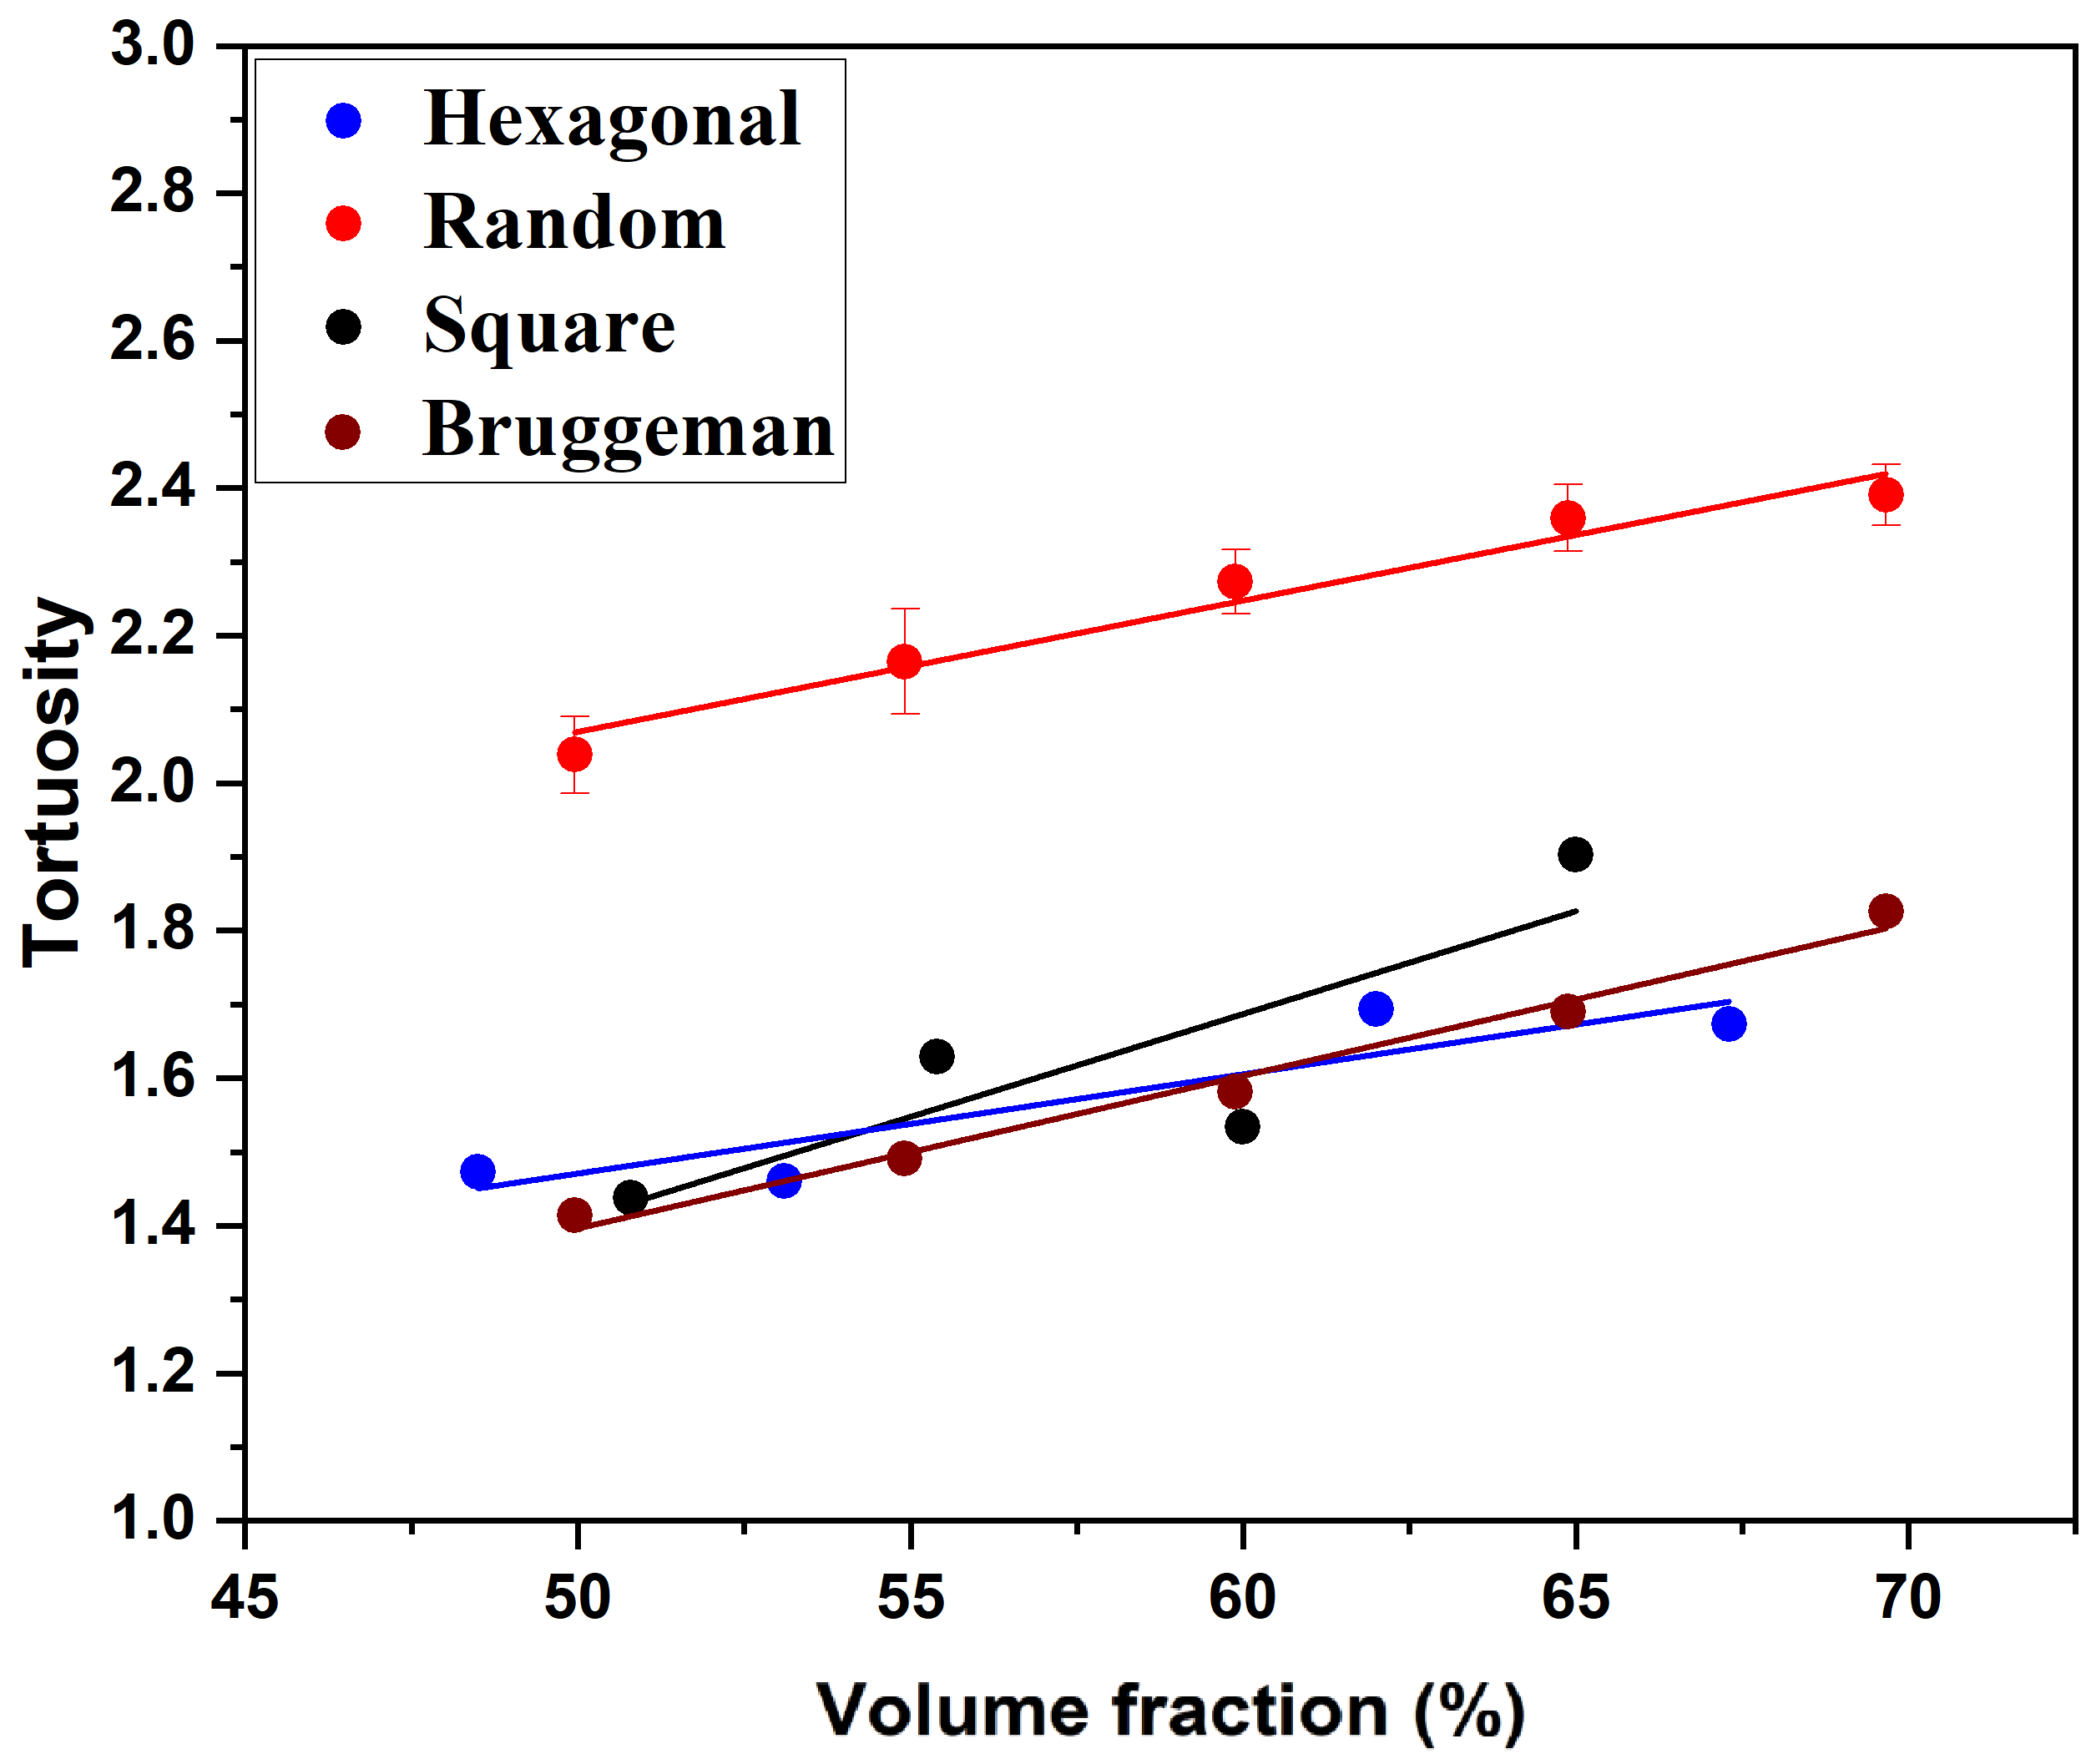
Tortuosity factor (Figure 14) is numerically calculated for different fiber spatial distributions and volume fractions for quantitatively depicting the disorderliness of fibers that cause tortuous diffusive moisture flow pathways into the composite. The tortuosity is also calculated using the Bruggeman relationship given in Equation 15. We observe that these values lie between the numerically calculated tortuosity values from square and hexagonal array models. In general, we observe that tortuosity is inversely proportional to effective diffusivity for all cases as seen from Figure 14 and Figure 14. The tortuosity for randomly distributed fibers is higher compared to that for square and hexagonal array models, which is attributed to fiber distribution. In a regular array, the diffusive flow of moisture is less tortuous compared to that in a random array. An increase in tortuosity decreases the effective diffusivity for each fiber distribution, which is evident from Figures 14 and 14.
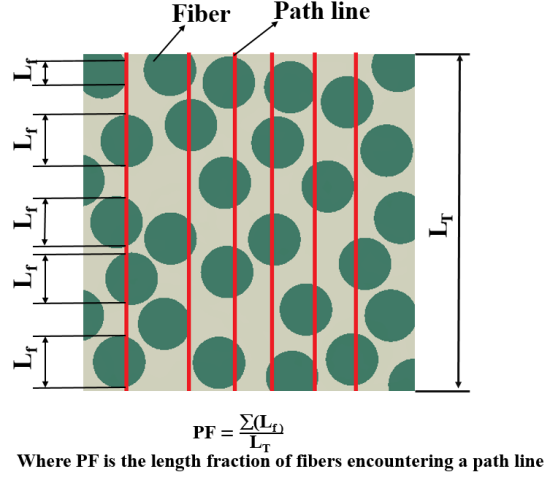
To further examine the impact of spatial distribution of fibers on tortuosity, we established a length fraction called “Perturbation Fraction” that qualitatively reflects fiber disorderliness. As schematically shown in Figure 15, numerous path lines are created in a micromechanical model along the height of the domain at regular intervals. Perturbation Fraction (PF) is defined as the sum of the lengths of each path line encountering fibers divided by the total height of the domain (Equation 18). PF at regular intervals along the x-axis is plotted in Figure 16 and Figure 16 for random and square fiber arrangements, respectively, for different fiber volume fractions.
| (18) |
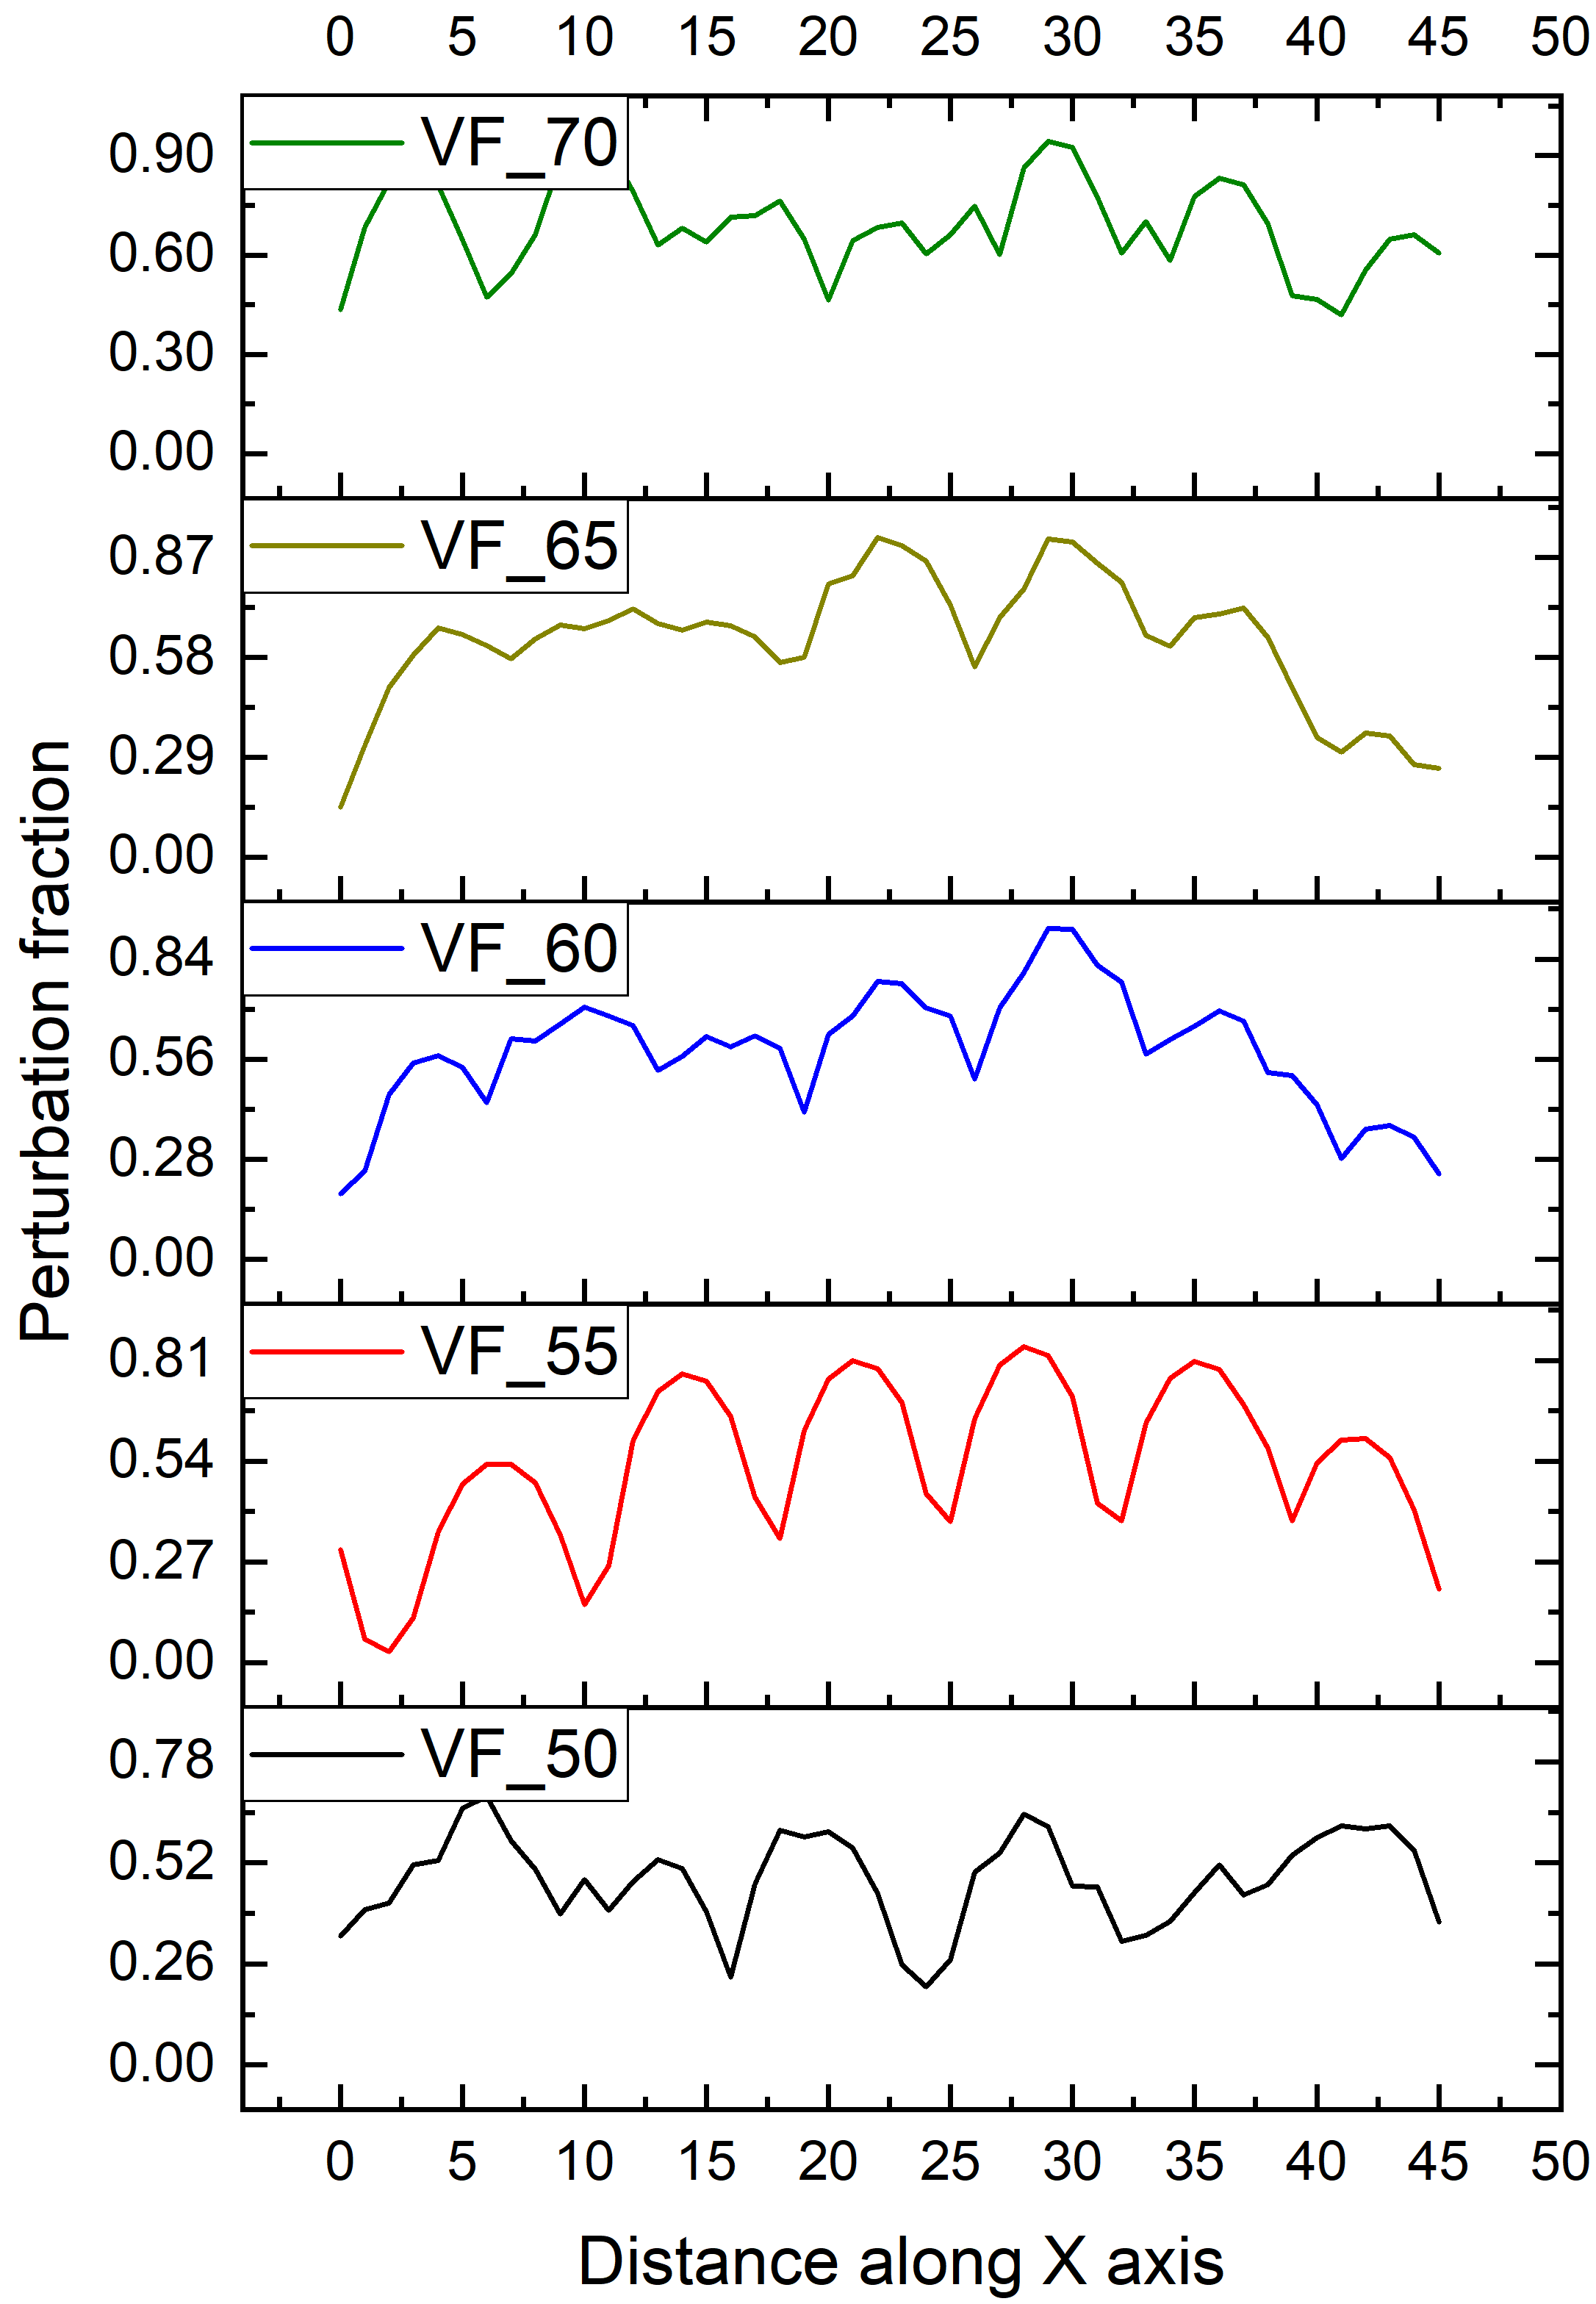
As shown in Figure 16, PF is plotted along the length of the whole domain. Essentially, every point on these plots is a PF value along a vertical path line. These PF plots help us to visualize fiber distribution across the entire domain, which is directly associated with the tortuosity of diffusion pathways. We observe that the variation of PF in a square array is periodic across all fiber volume fractions. The lowest PF value is at 0%, which means that there are clear channels of matrix for moisture to flow that makes a diffusive pathway less tortuous. In case of random fiber distribution, the variation of PF is random across all fiber volume fractions and the lowest value is 26%. This makes the diffusion route more tortuous and corroborates our earlier findings regarding tortuosity in Figure 14.
5.2 Effect of Fiber Morphology on Tortuosity
One of the main objectives of this paper is to study real microstructures that are typically a combination of circular fibers and many other shapes that have an impact on moisture diffusivity. To investigate the effect of fiber morphology on tortuosity, we considered various fiber shapes including several types of curved bean fibers, asteroid, square, octagonal, elliptical and circular fibers. We modeled fiber cross-sections with different morphology but fixed cross-sectional area to understand the influence of fiber cross-sectional perimeter (in 2D space) and orientation of fiber shape on tortuosity. We defined a "Normalized Perimeter" term, which is the ratio of the perimeter of a fiber with non-circular shape to the circumference of a circular fiber.
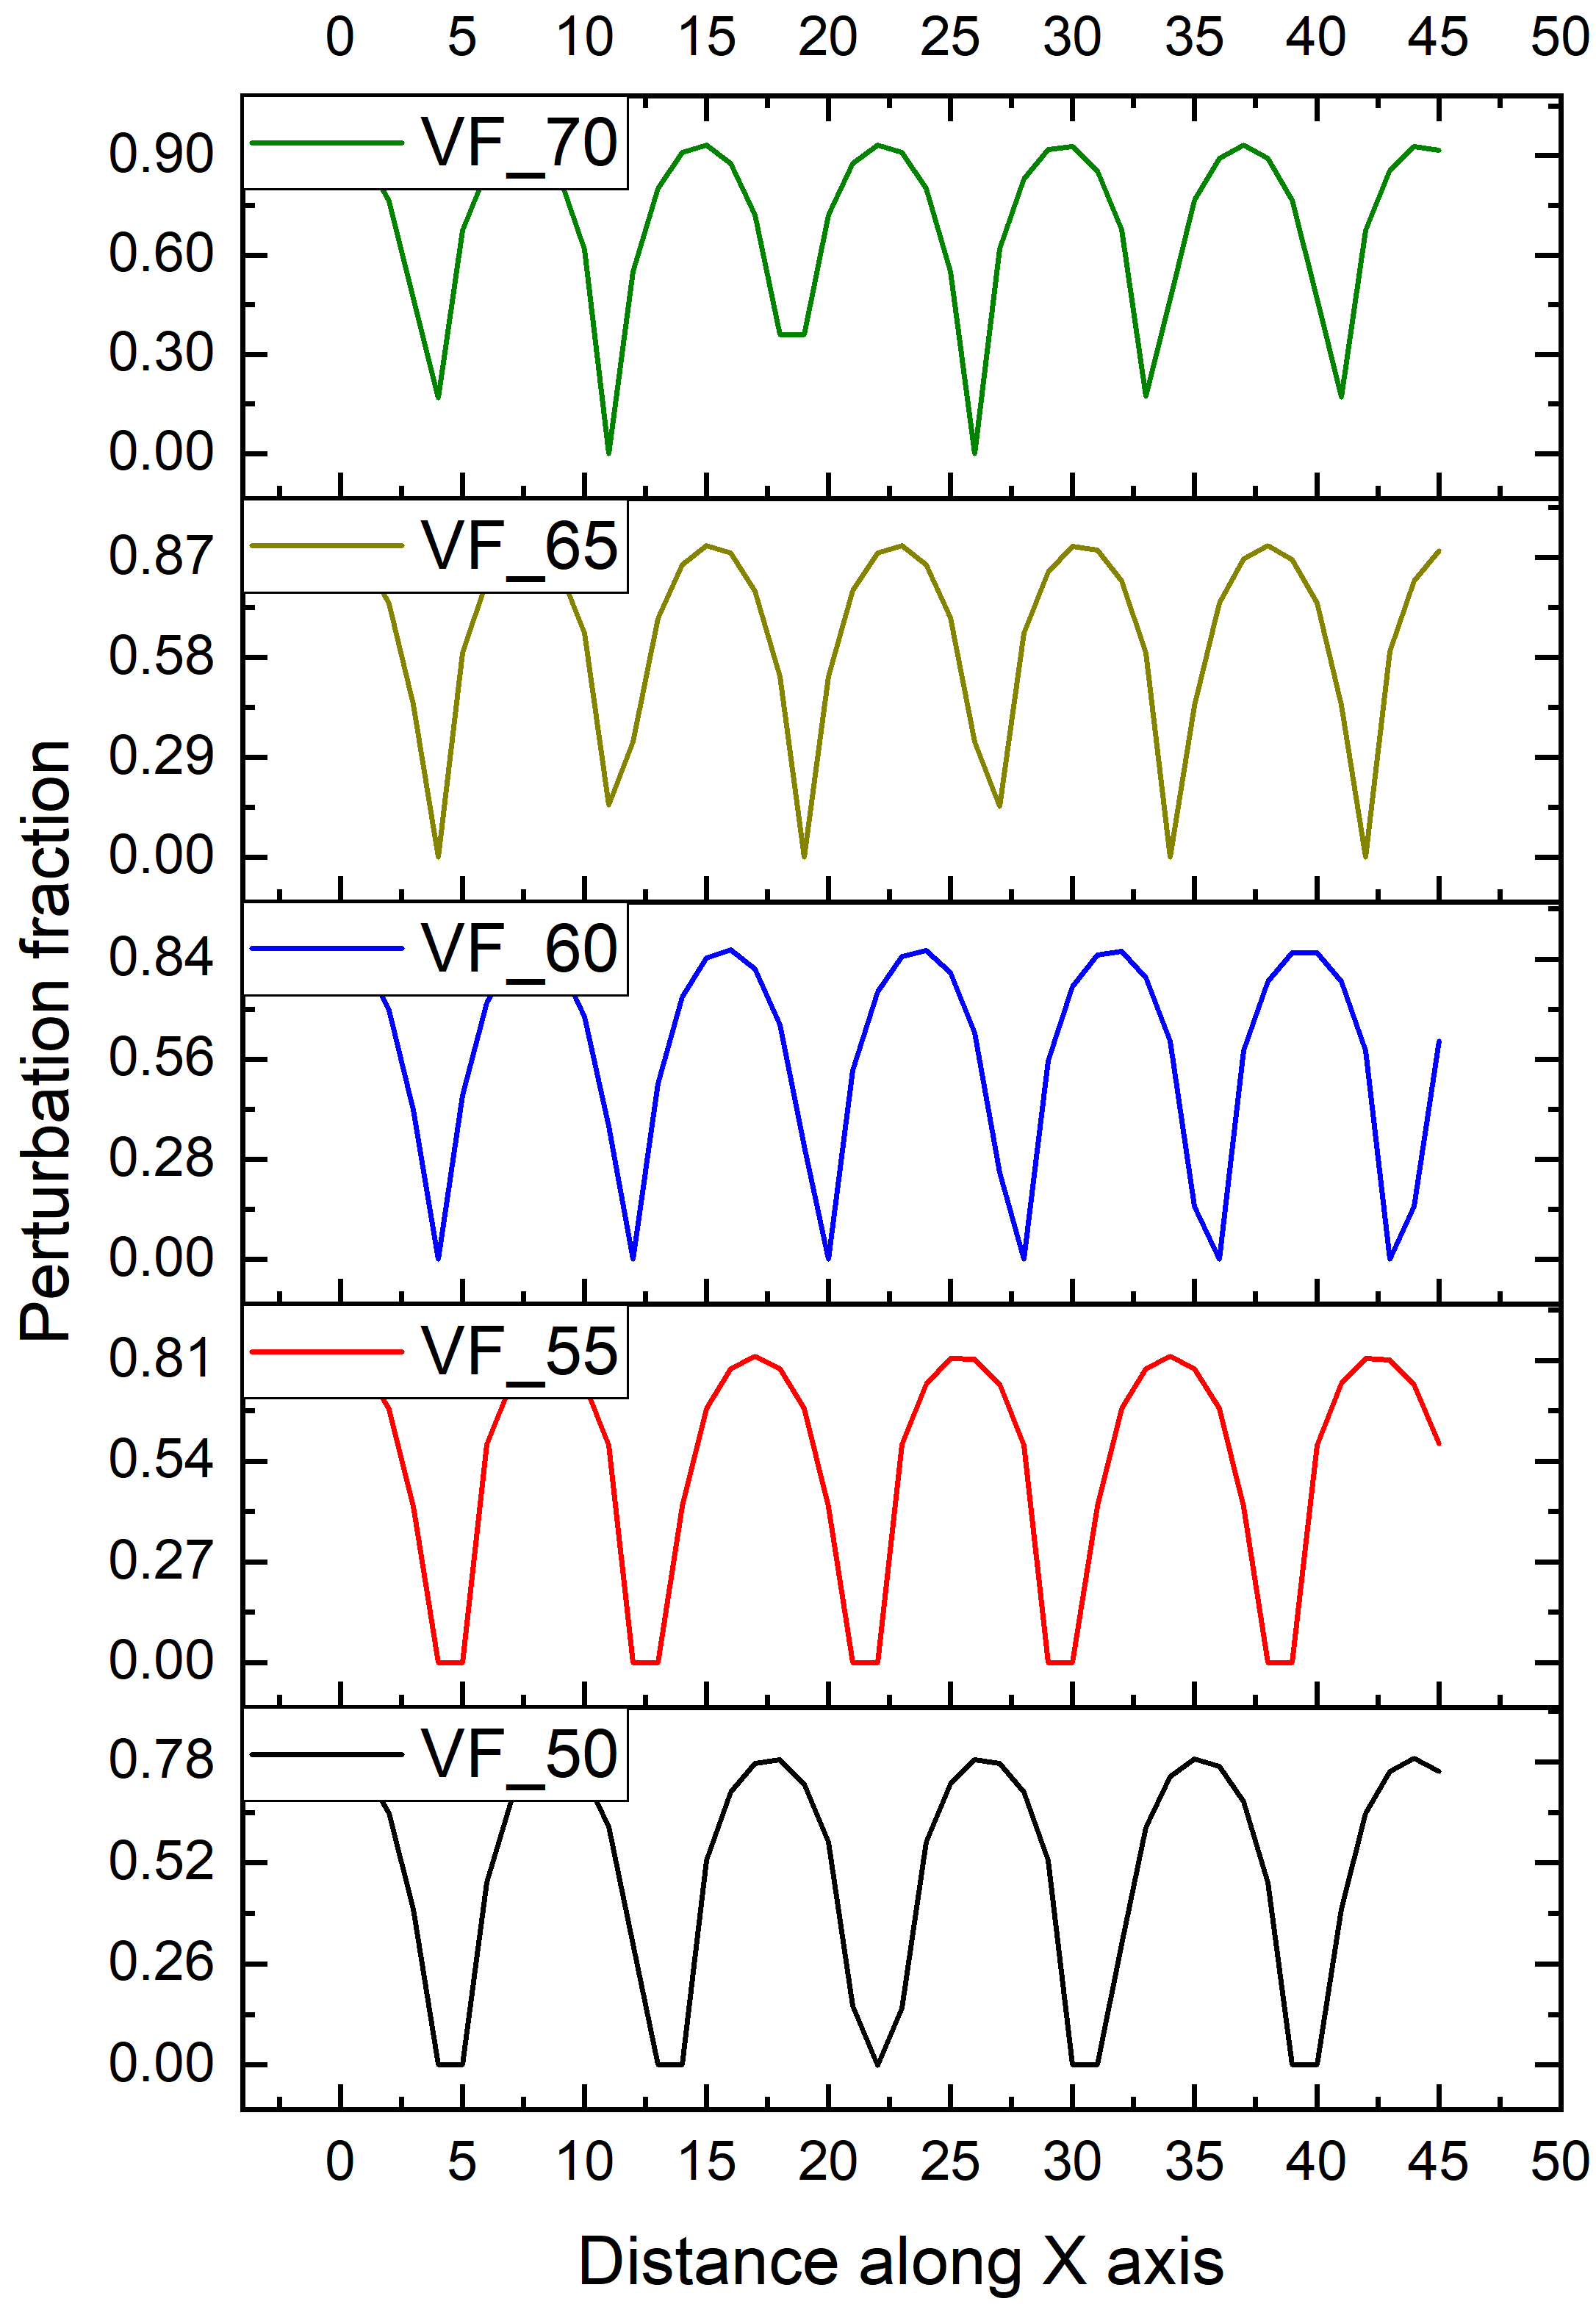
First, we evaluated the impact of fiber perimeter on tortuosity by considering asteroid, cube, circle, and octagonal fibers embedded in a matrix medium. These shapes were particularly chosen as they are symmetric and do not have directional dependencies. Tortuosity is plotted against normalized perimeter in Figure 17 for these different shapes considered. We observe that as the normalized perimeter increases, the tortuosity increases with the highest tortuosity for asteroid, which has the largest perimeter compared to all other shapes considered. Hence, we conclude that larger perimeter has greater hindrance to moisture ingression, thereby, decreasing the moisture diffusivity. The tortuosity of an octagon is marginally higher than that of a circle as its normalized perimeter is close to 1.
In addition to fiber perimeter, the fiber cross-sectional angle , that is the angle that the cross-section makes in its plane, can also have an impact on tortuosity and moisture diffusivity. To understand this effect, we considered elliptical fiber with varying cross-sectional angle from to as shown in Figure 18. Tortuosity is calculated for different fiber cross-sectional angles in this range and plotted in Figure 18. We observe that the tortuosity increases with increase in fiber cross-sectional angle of the elliptical fiber. The main reason for this behavior when moisture flow occurs from left to right is as follows: when the angle is , the distance over which the moisture flow occurs (impact length) is equal to the minor axis or shortest length in an elliptical cross-section. But, as the cross-sectional alignment angle increases, this impact length for moisture flow increases. Thus, the tortuosity is maximum when the fiber cross-sectional angle is along the major axis or longest length of an elliptical cross-section.
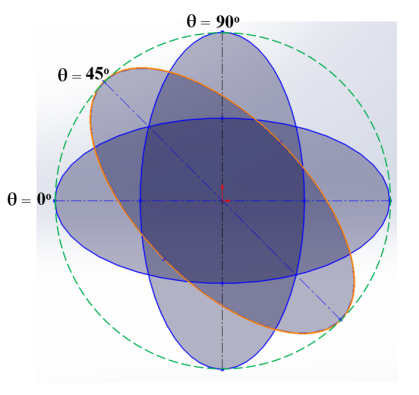
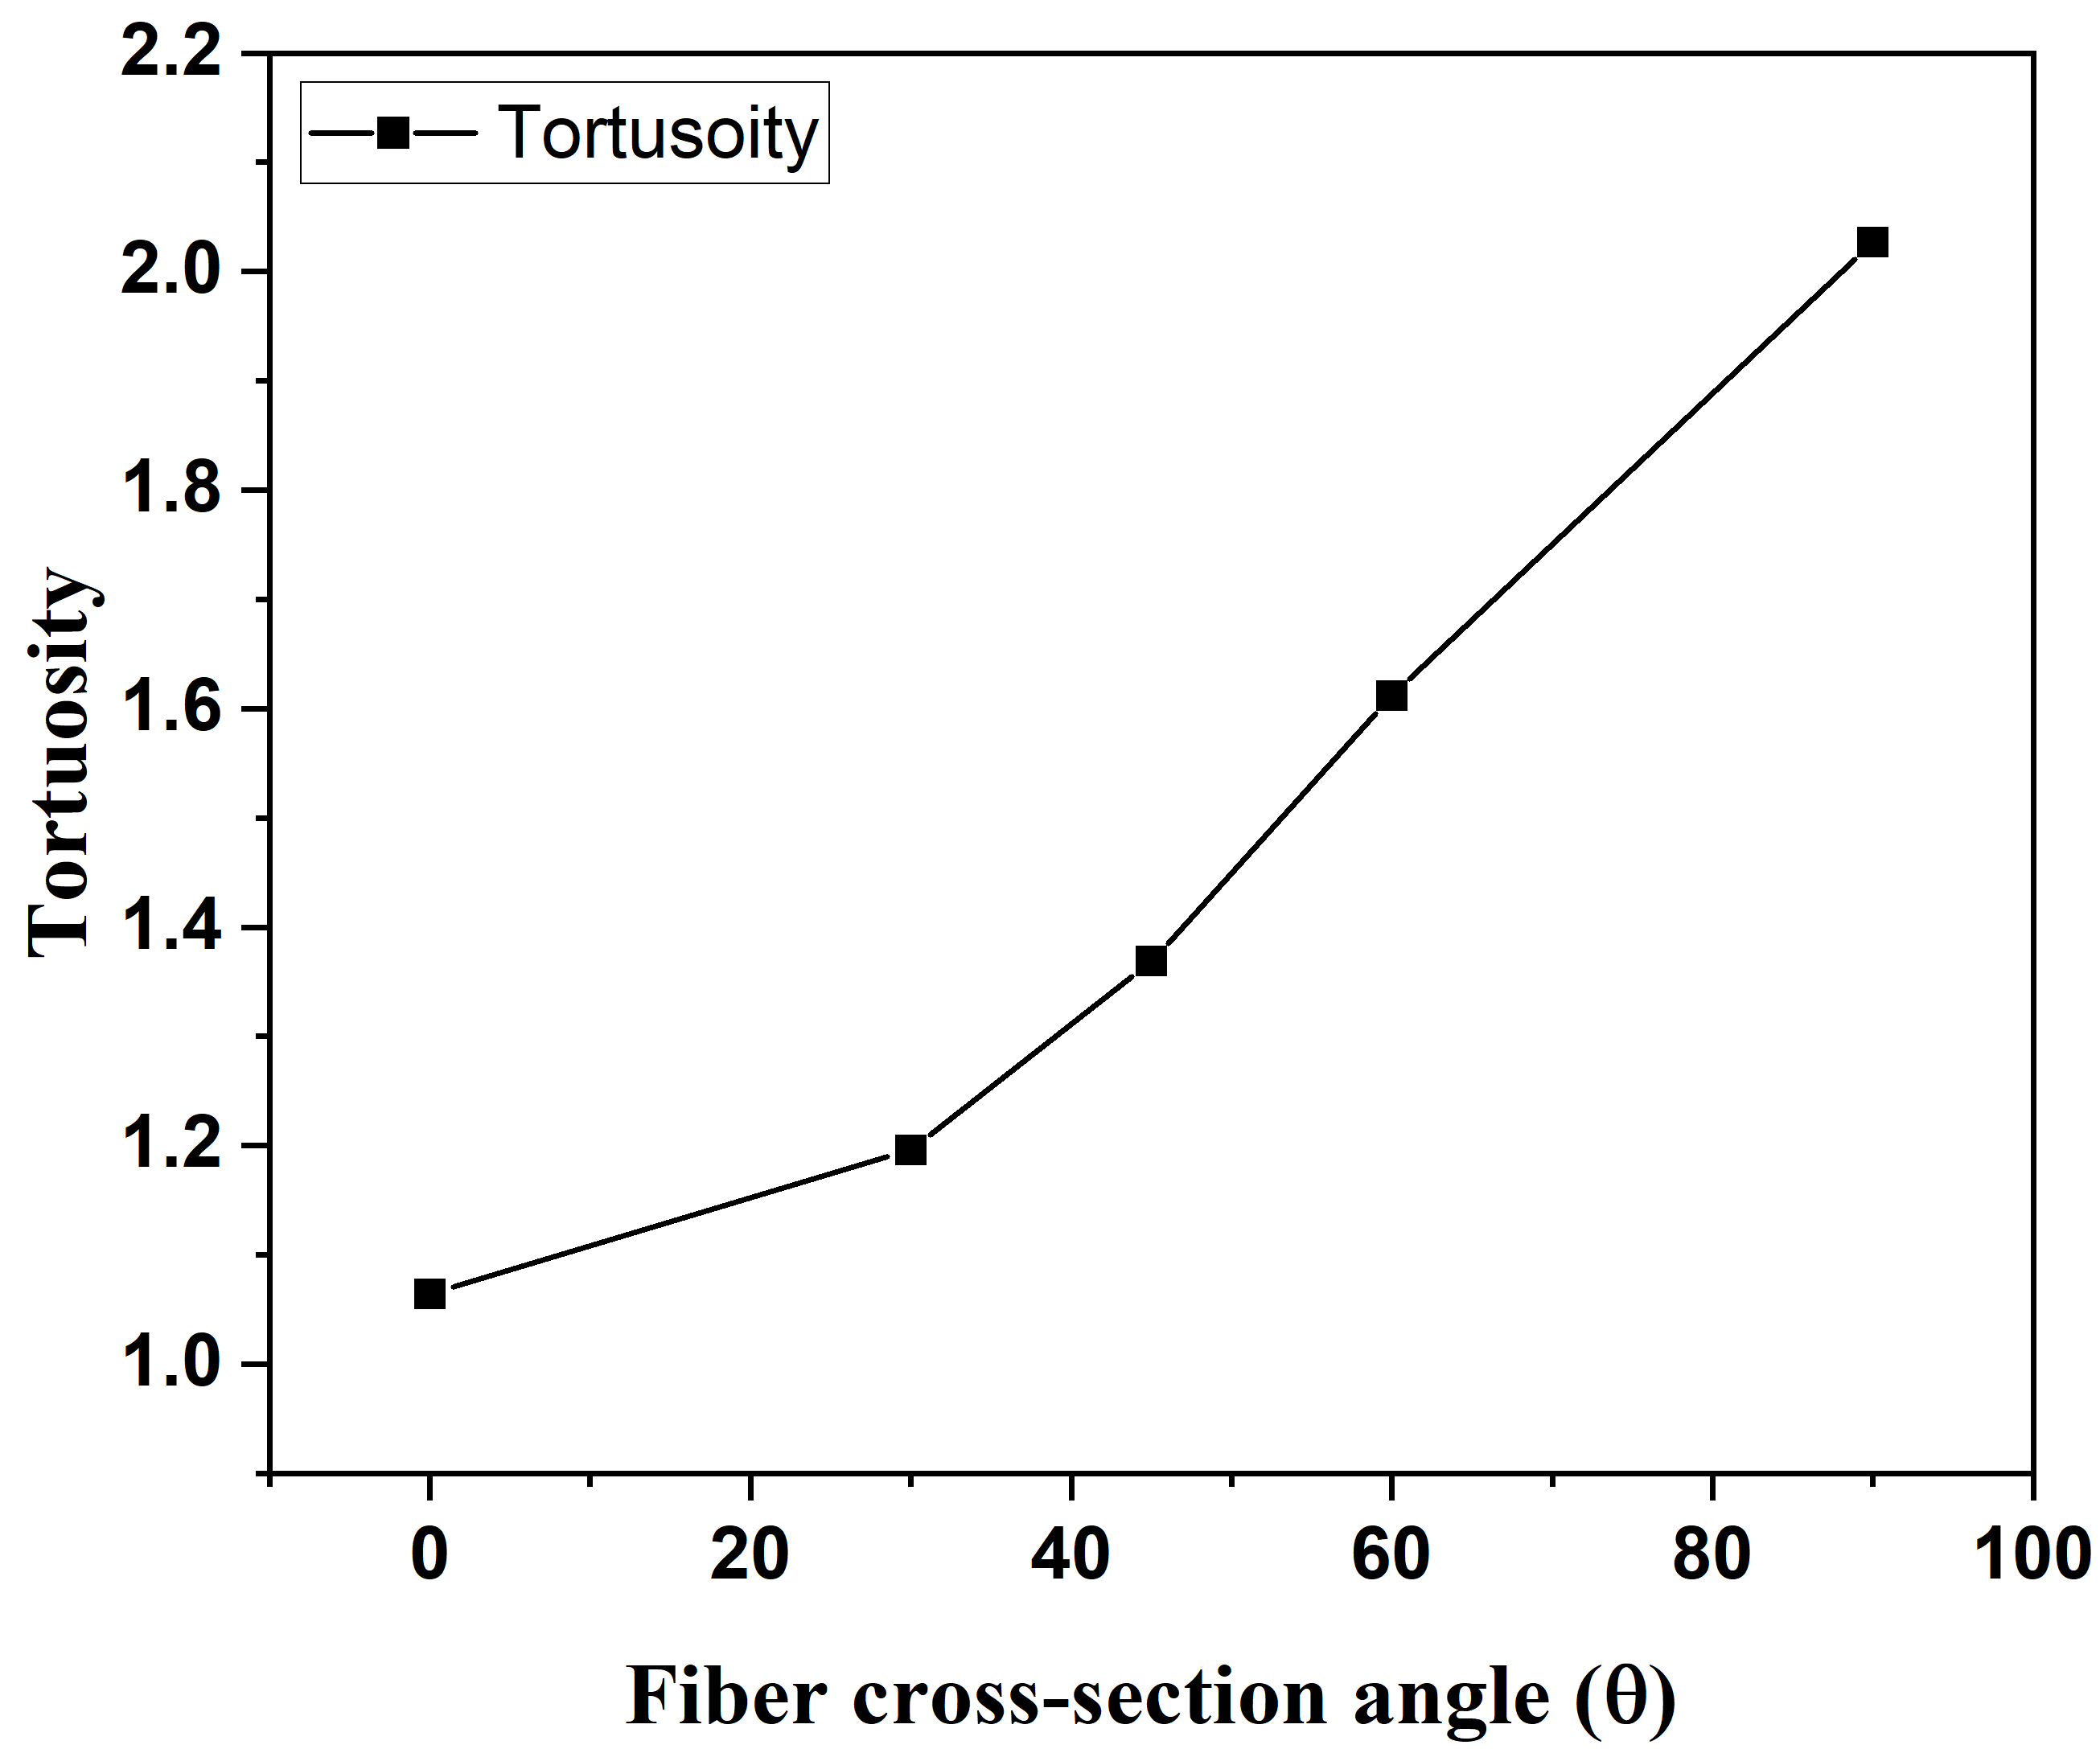
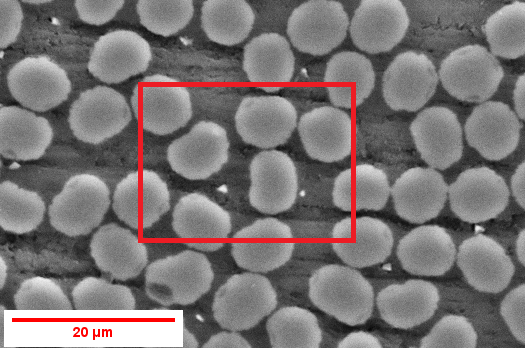
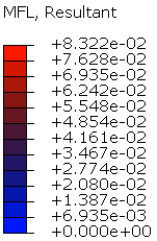
Figure 19 shows the SEM image of the cross-section a real composite at the microscale. This contains carbon fibers with different morphology, and are typically various forms of bean curves. A unit cell with 50% fiber volume fraction is considered for numerical modeling, where the cross-sectional area of all the fiber morphologies considered are kept constant. The governing equation and boundary conditions are applied as described previously in Section 4.3 in order to quantify the tortuosity. Figure 20 and Figure 20 show maps of tortuosity values for different shapes, where the moisture flow is considered to occur along the x and y directions, respectively.
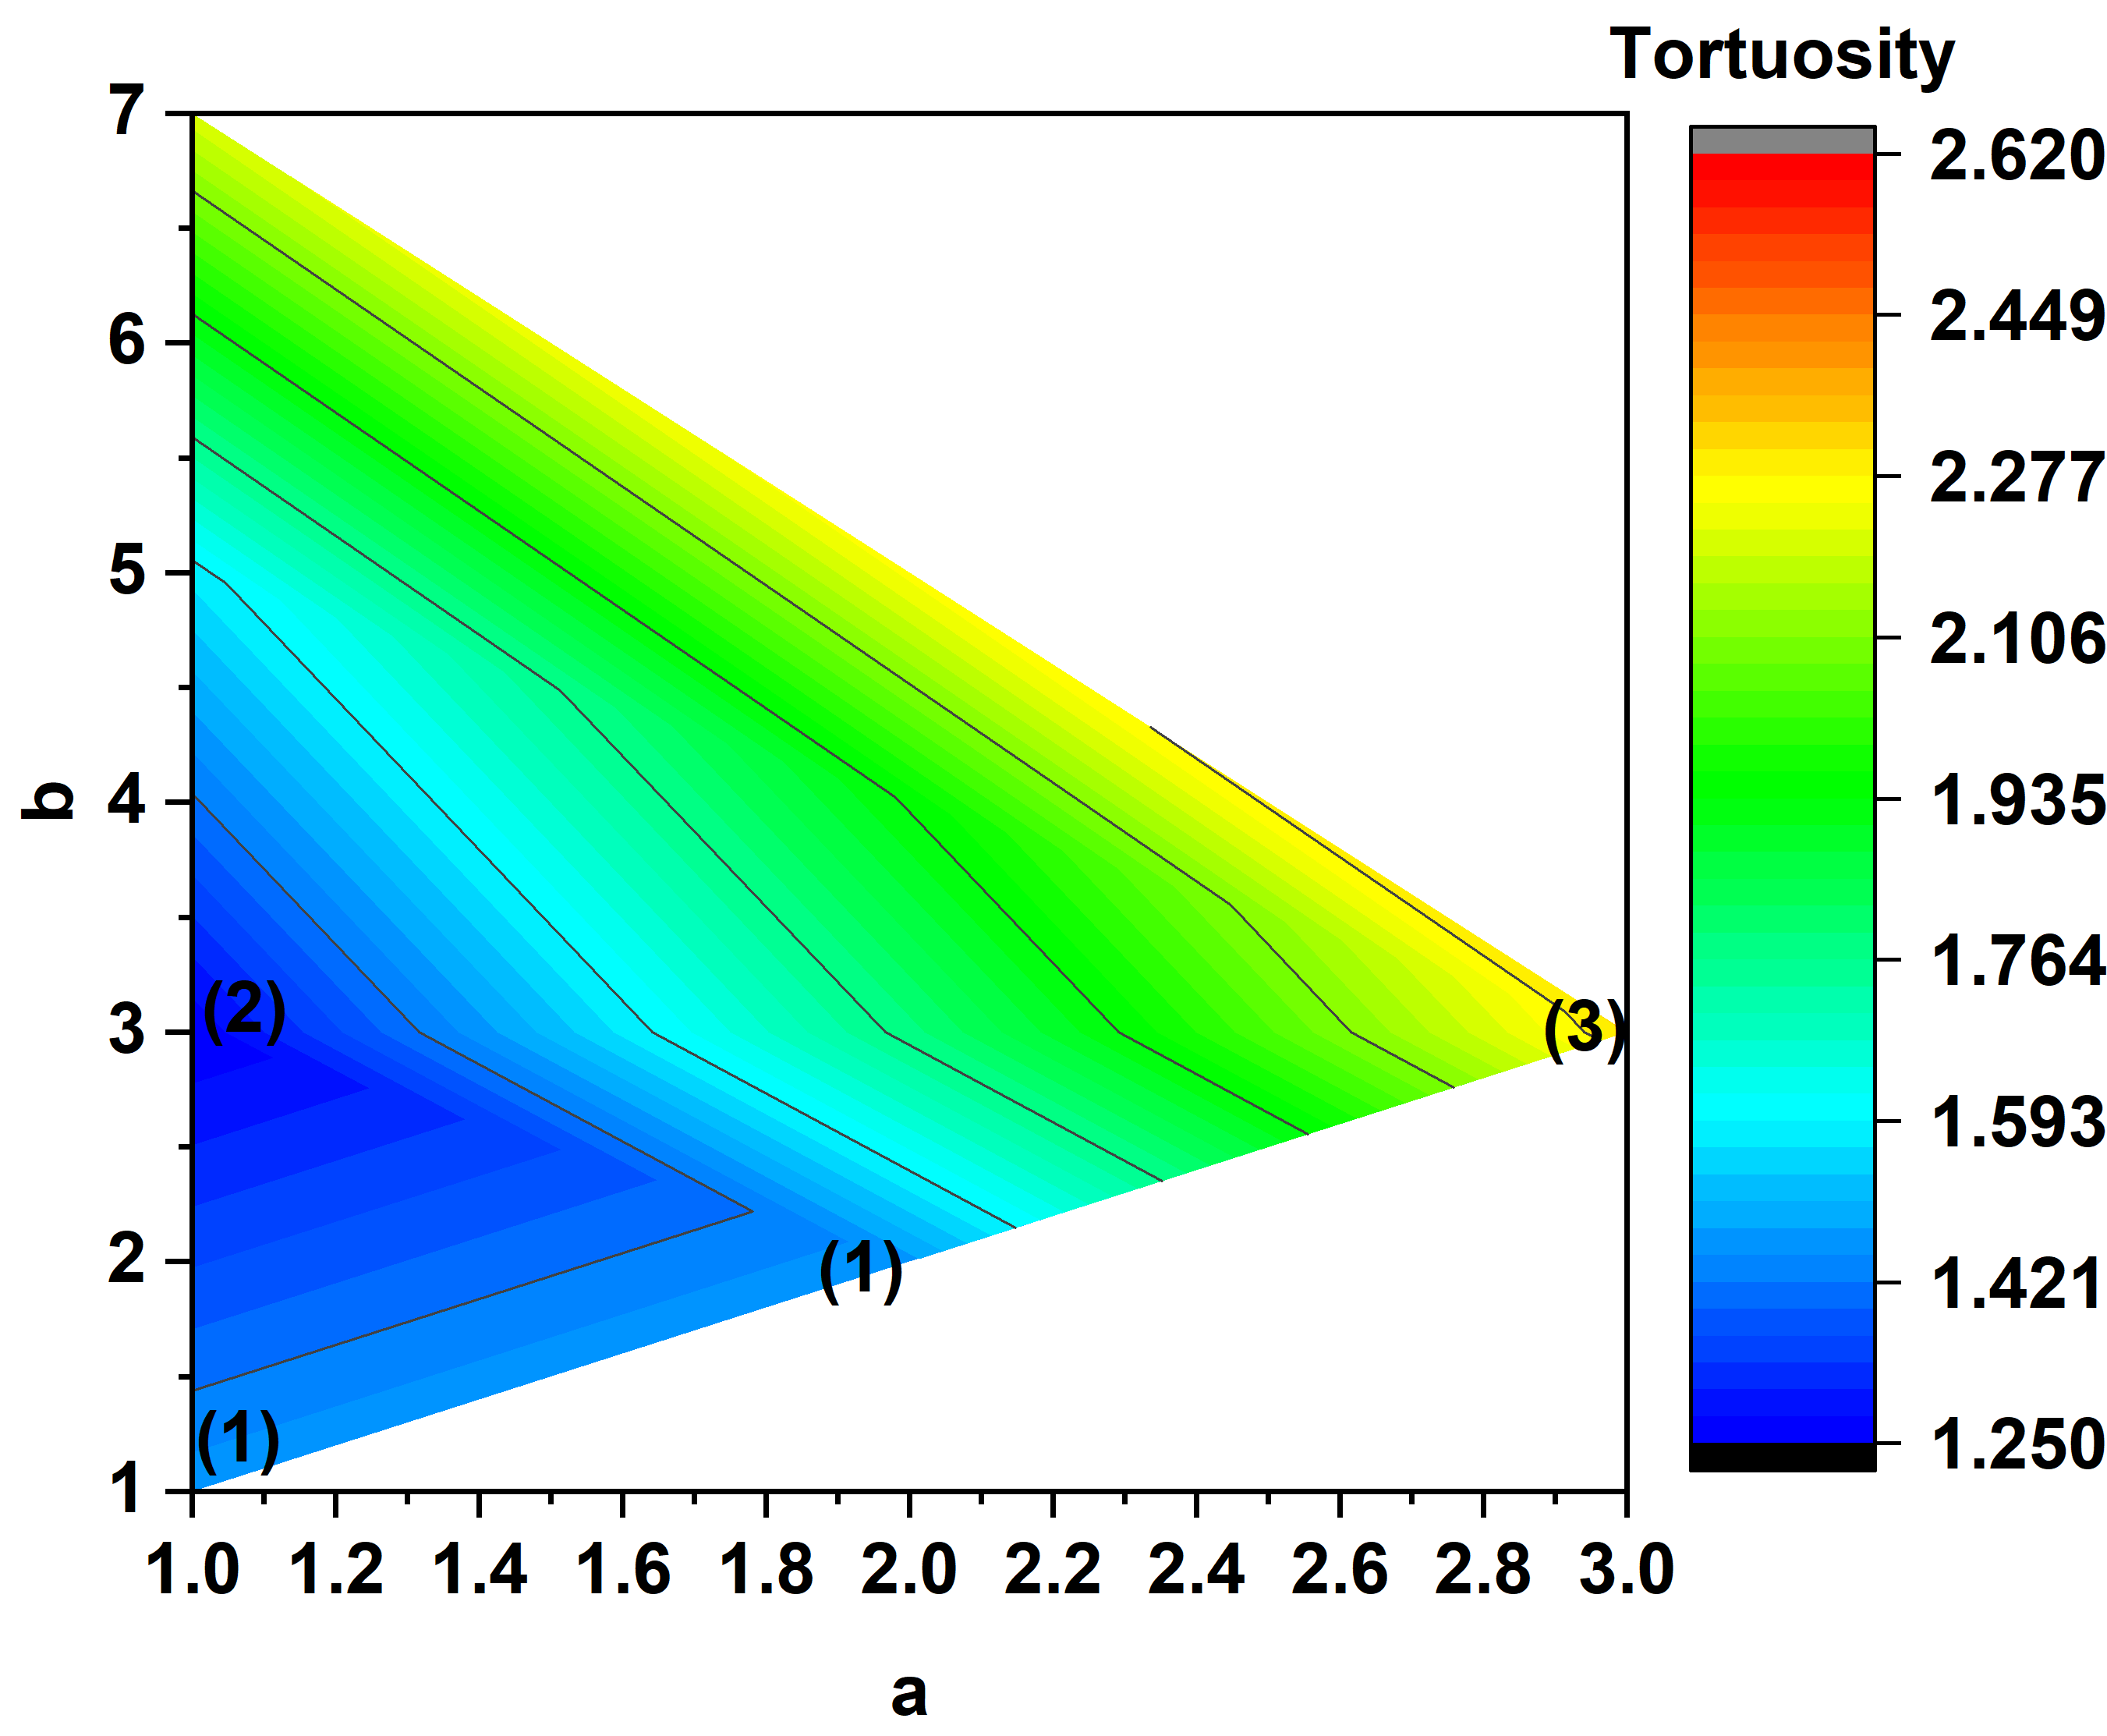
We have highlighted three cases in Figures 20 and 20, which correspond to three fiber cross-sectional shapes shown in Figures 21 and 22, respectively. In Figure 20, we observe that case (2), a bean curve with a=1 and b=3, manifests the lowest tortuosity compared to all other bean curves considered. Case(1) with a=1 and b=1 (also, a=2 and b=2) is essentially a circle which manifests a tortuosity value marginally greater than case (2), but lower than the other types of bean curves considered in this study. Case (3) is a bean curve with a=3 and b=3, which shows the highest tortuosity along the x direction compared to all other fiber shapes. We plotted moisture concentration flux vector distributions for cases (1)-(3) in Figure 21 for moisture flow occurring along the x direction. We observe that the average mass flux in Figure 21 is less compared to that of Figure 21 and Figure 21, which in turn increases the tortuosity.
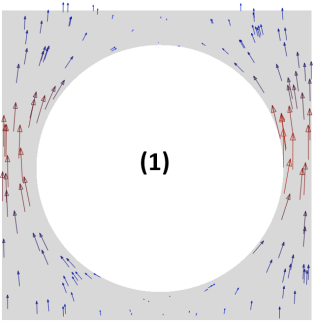
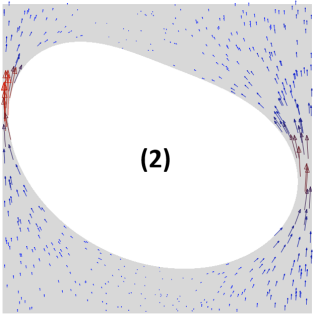
For moisture flow occurring along the y direction, the circular fiber (case (1)) has lower tortuosity compared to the other two bean curves (case (2) and case (3)), as shown in Figure 20. The reason for this behavior is that the distance over which the moisture flow occurs (impact length) is higher for case (2) as can be seen in Figure 22 than that in Figure 22, which hinders the moisture ingression. However, when the moisture flow occurs along x direction for Case(2) as shown in Figure 21, the impact length is lower to that of a circular fiber. This is further corroborated by the tortuosity values for flow along that direction. The real microstructure within a fiber reinforced composite might introduce higher hindrance against moisture diffusion for lesser fiber volume fraction due to the morphology, which will be discussed next.
5.3 Influence of Real Microstructure on Tortuosity
In sections 5.1 and 5.2, we have shown that fiber spatial distribution and morphology independently influence the composite’s moisture diffusivity. Most prior work [2, 36] assumed fibers to be circular and arranged in regular arrays (like square packed and hexagonal packed unit cell models) for calculating effective properties. However, real microstructure is a combination of fiber shapes and distributions in a homogeneous media. Hence, it is important to consider real microstructure for analyzing the kinetics of moisture flow in fiber reinforced composites. Here, we imported real microstructure into a finite element model as explained previously in Section 3. Figure 23 shows five binary images of real microstructure. Their tortuosity and diffusivity values are shown in Figures 24 and 24, respectively, along with those for computer generated random, square and hexagonal fiber arrangements.
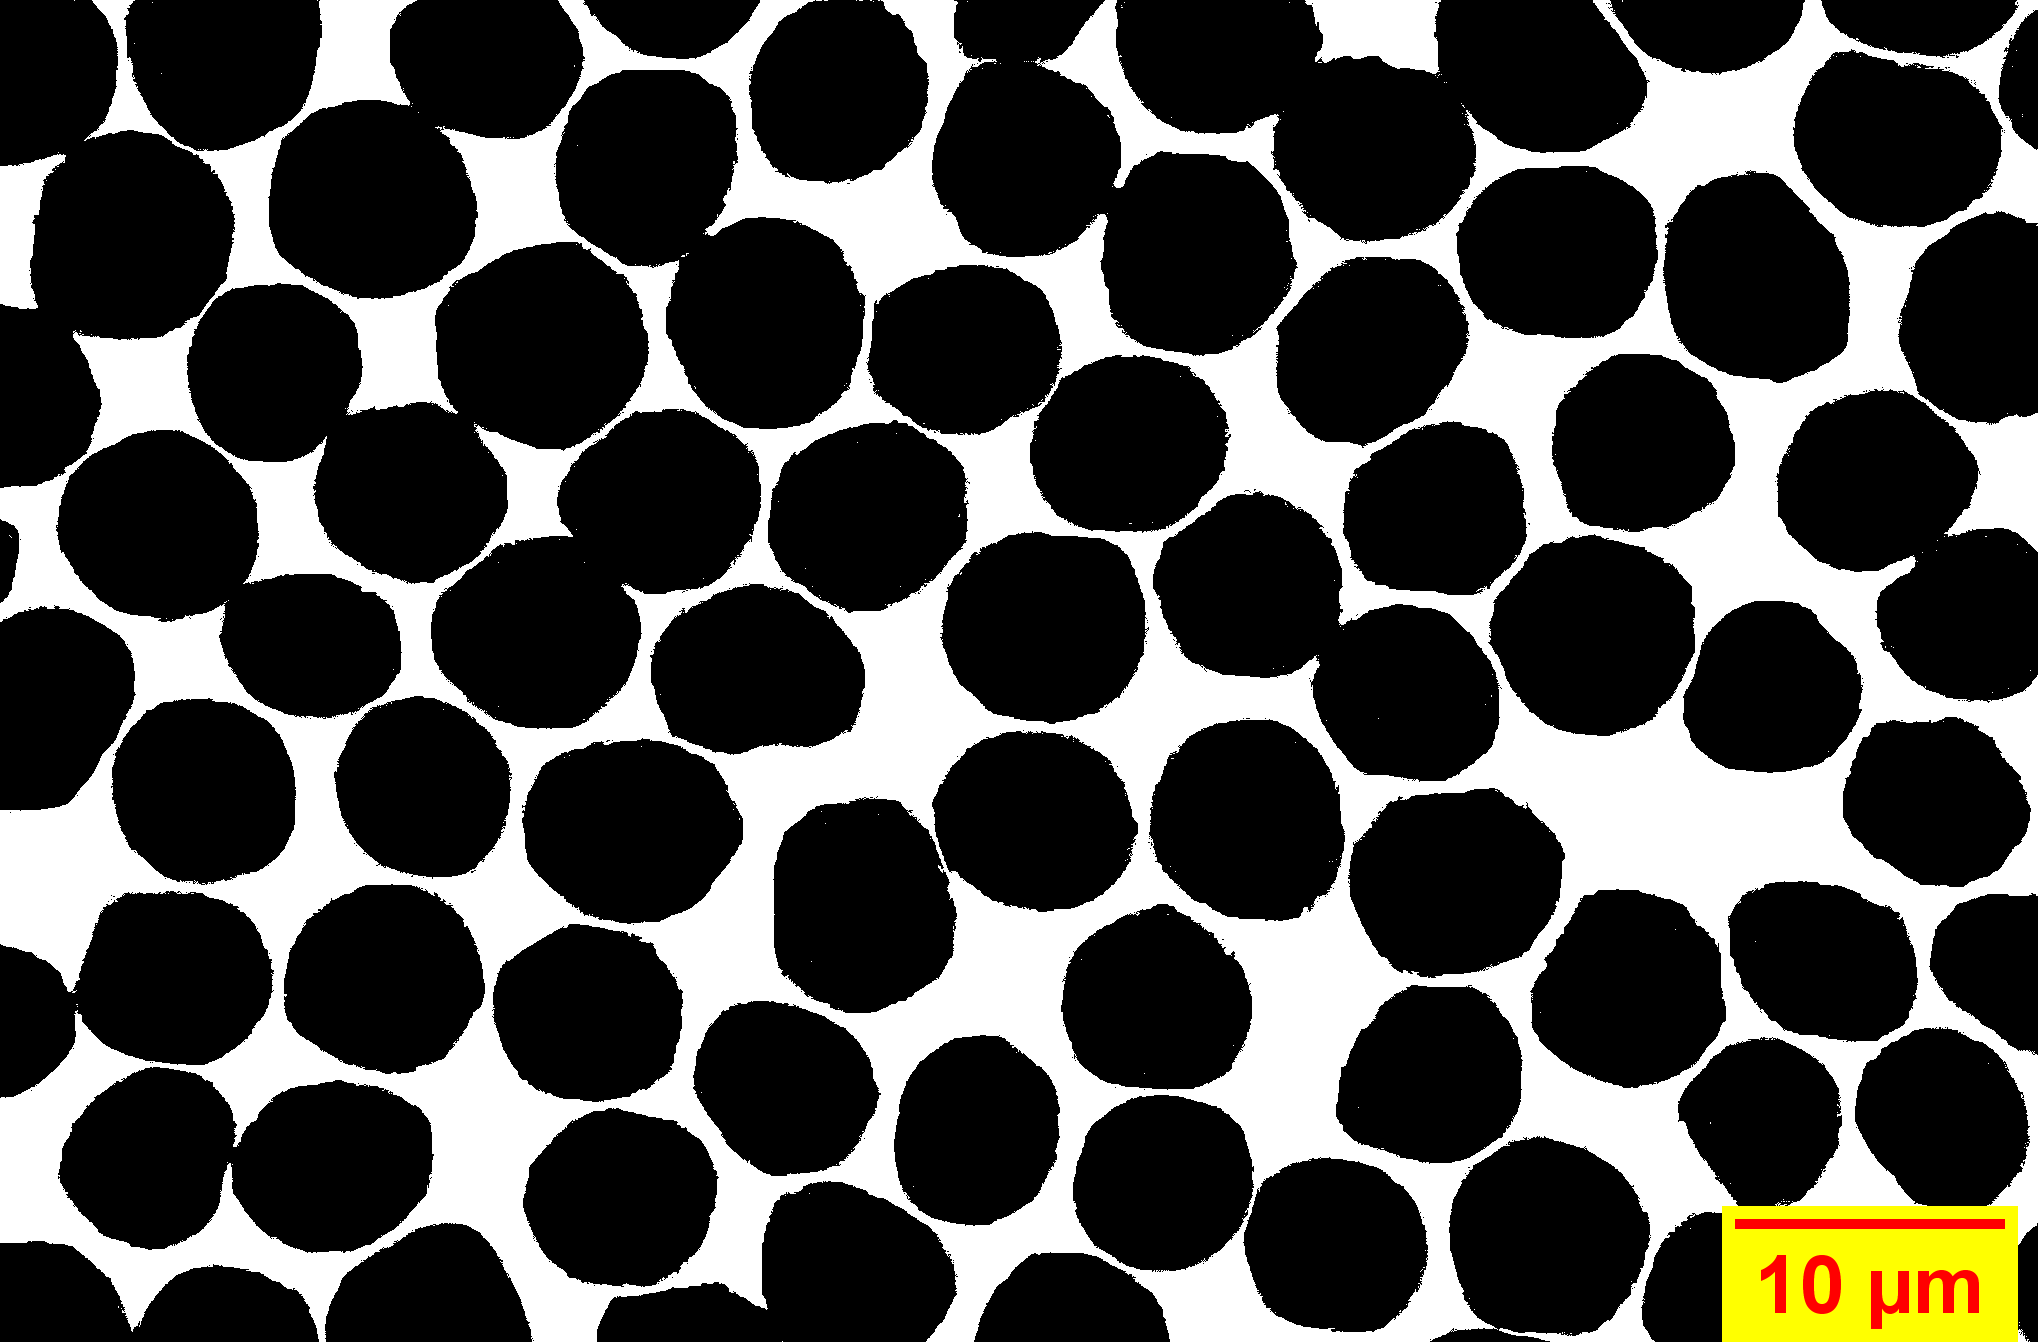
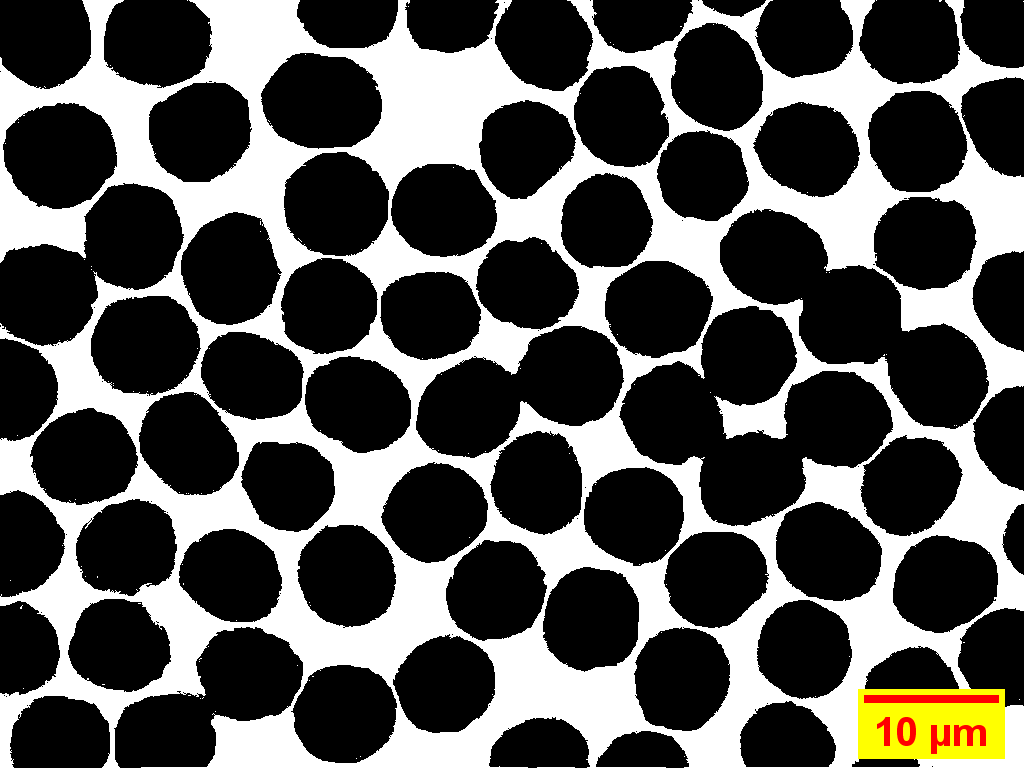
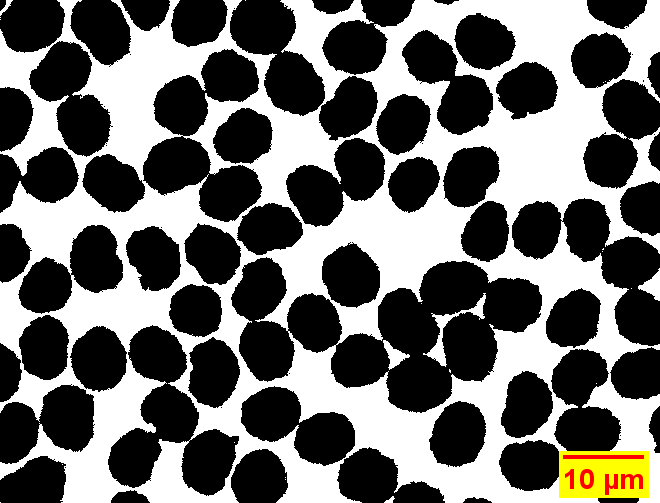
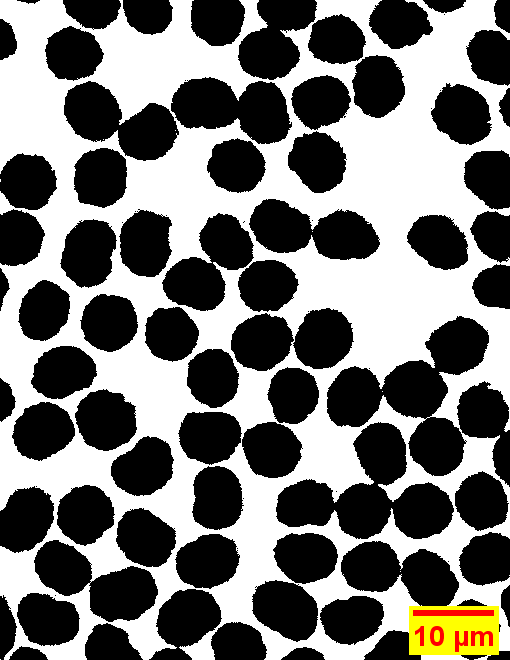
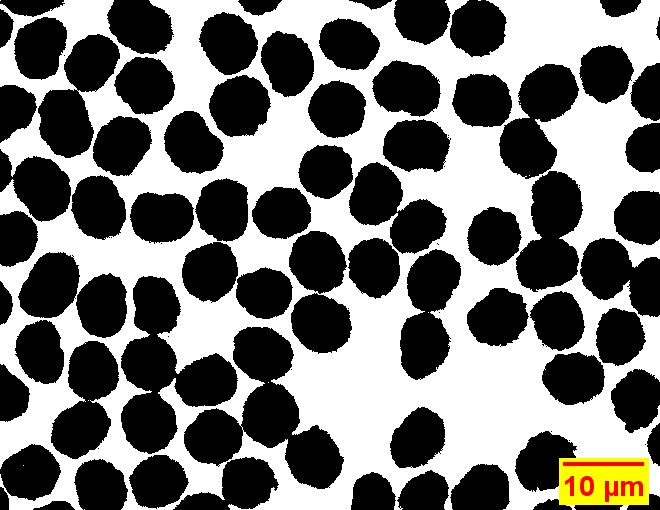
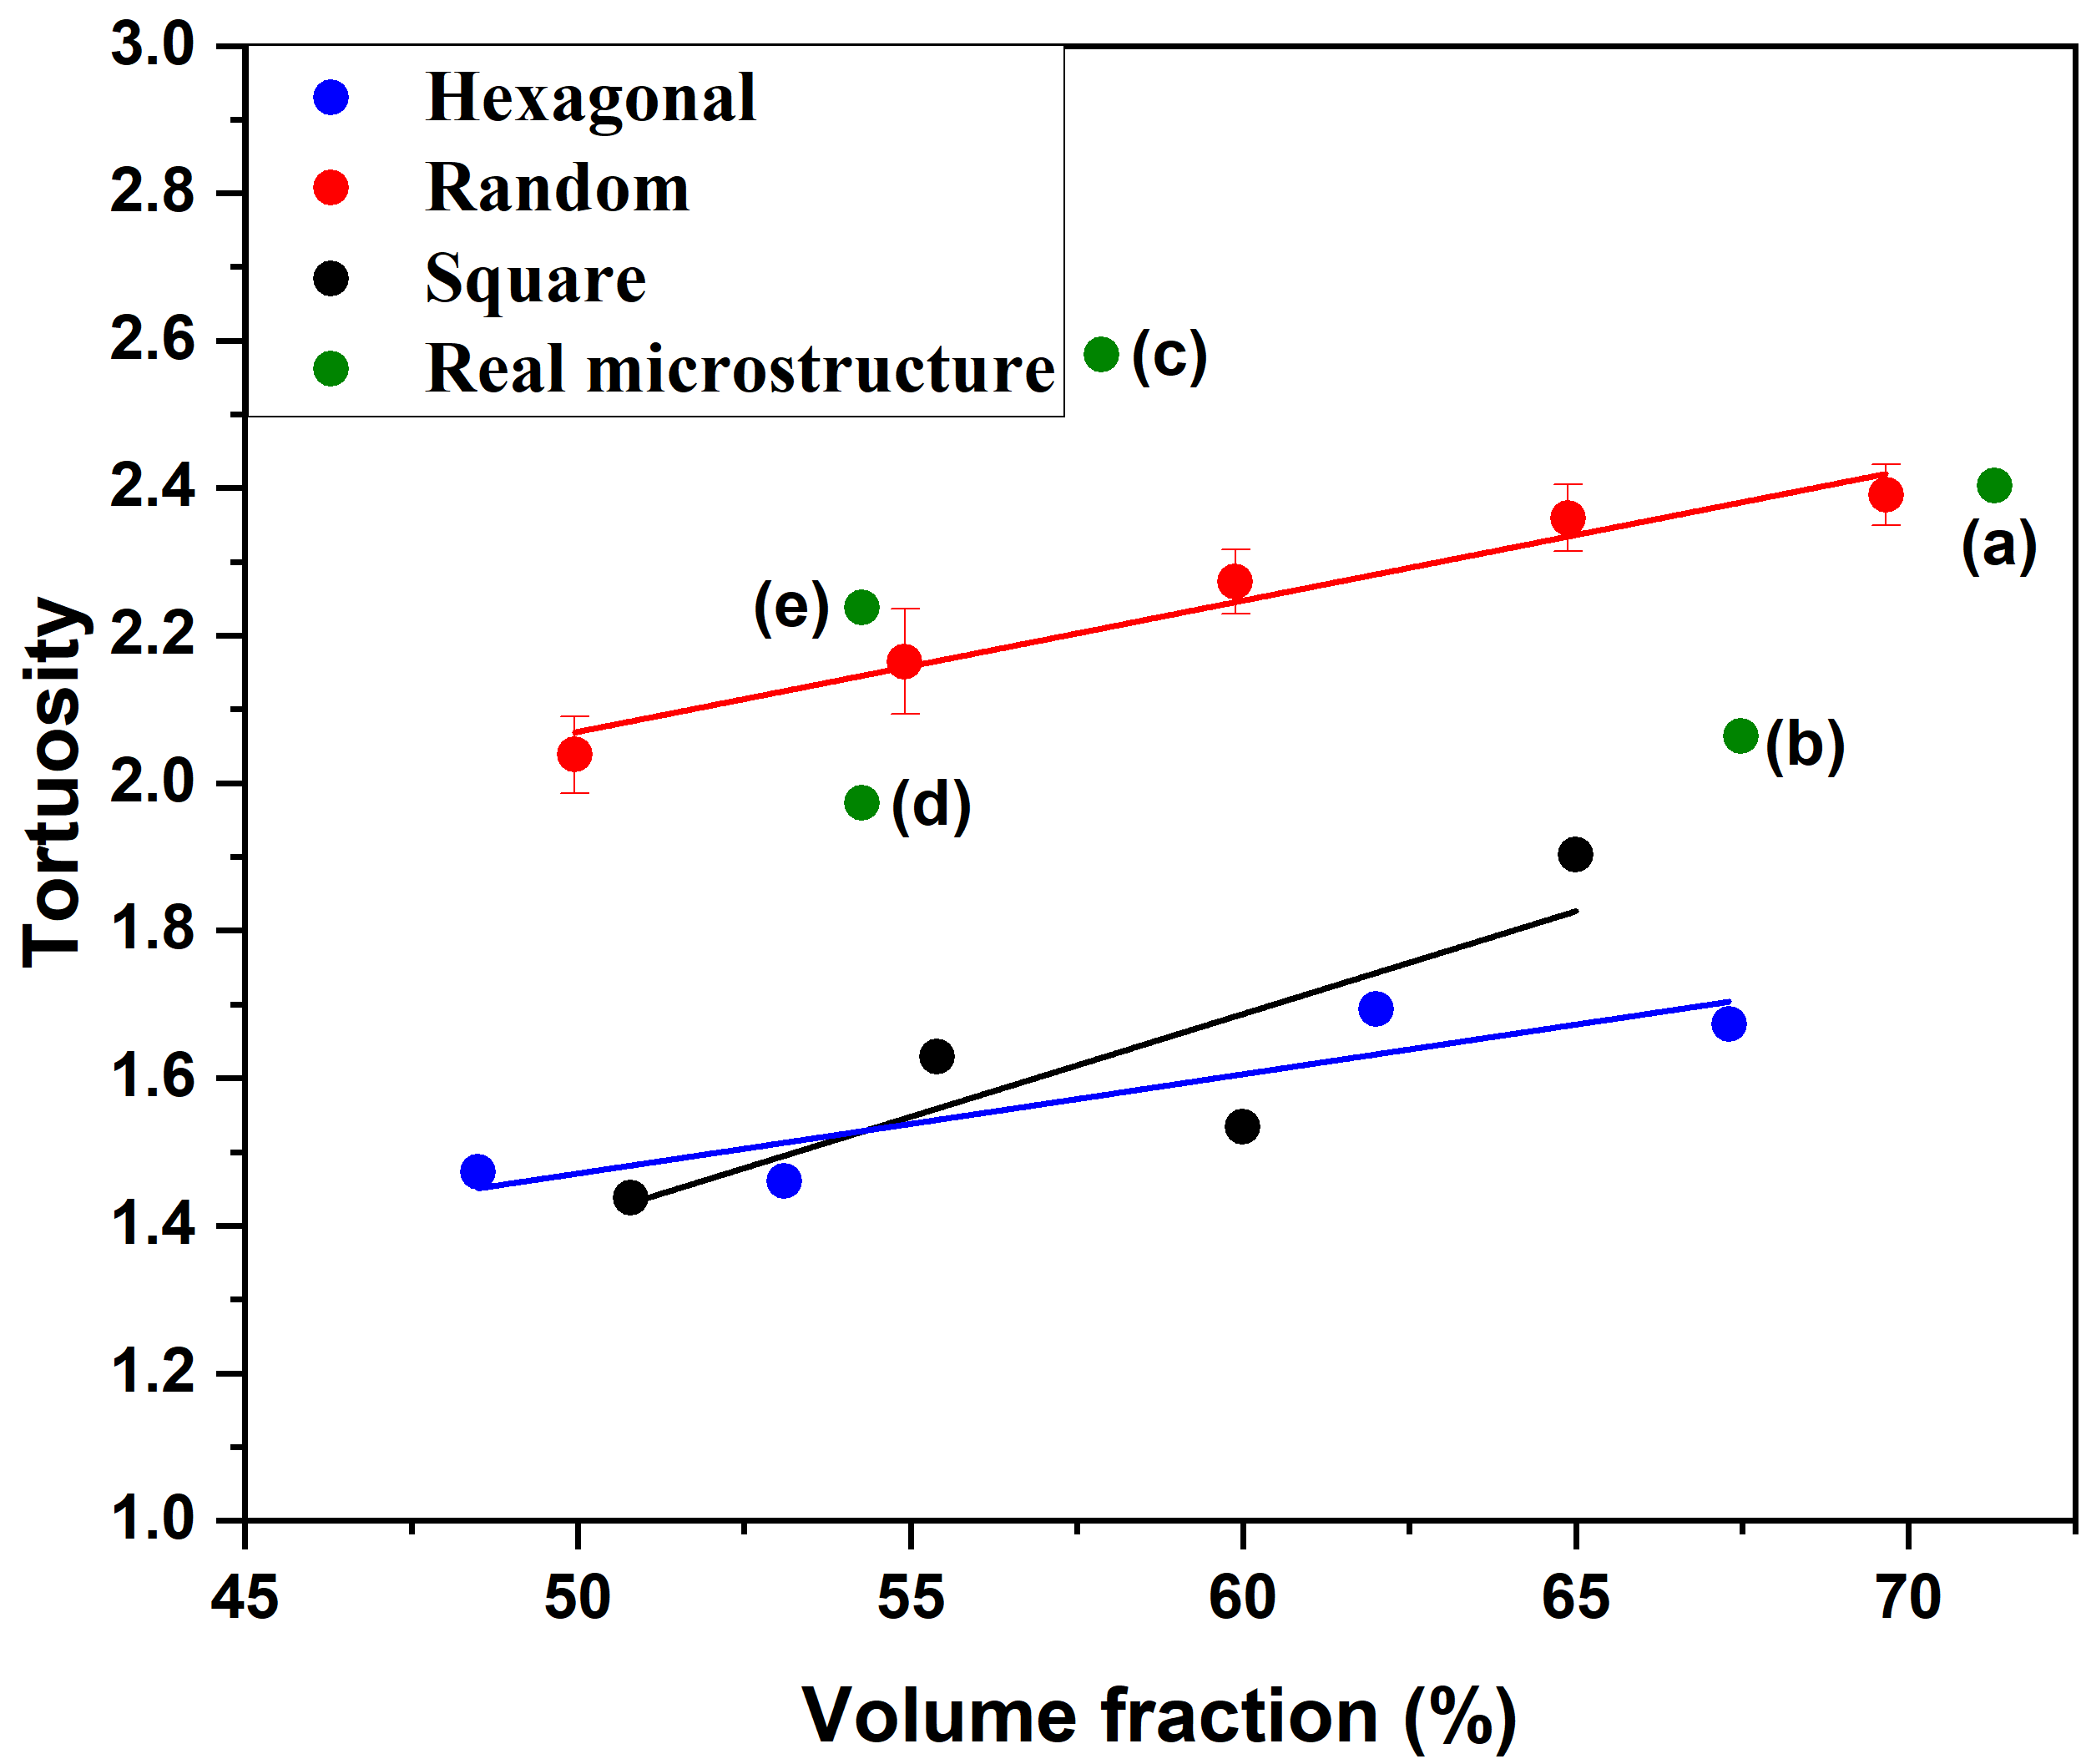
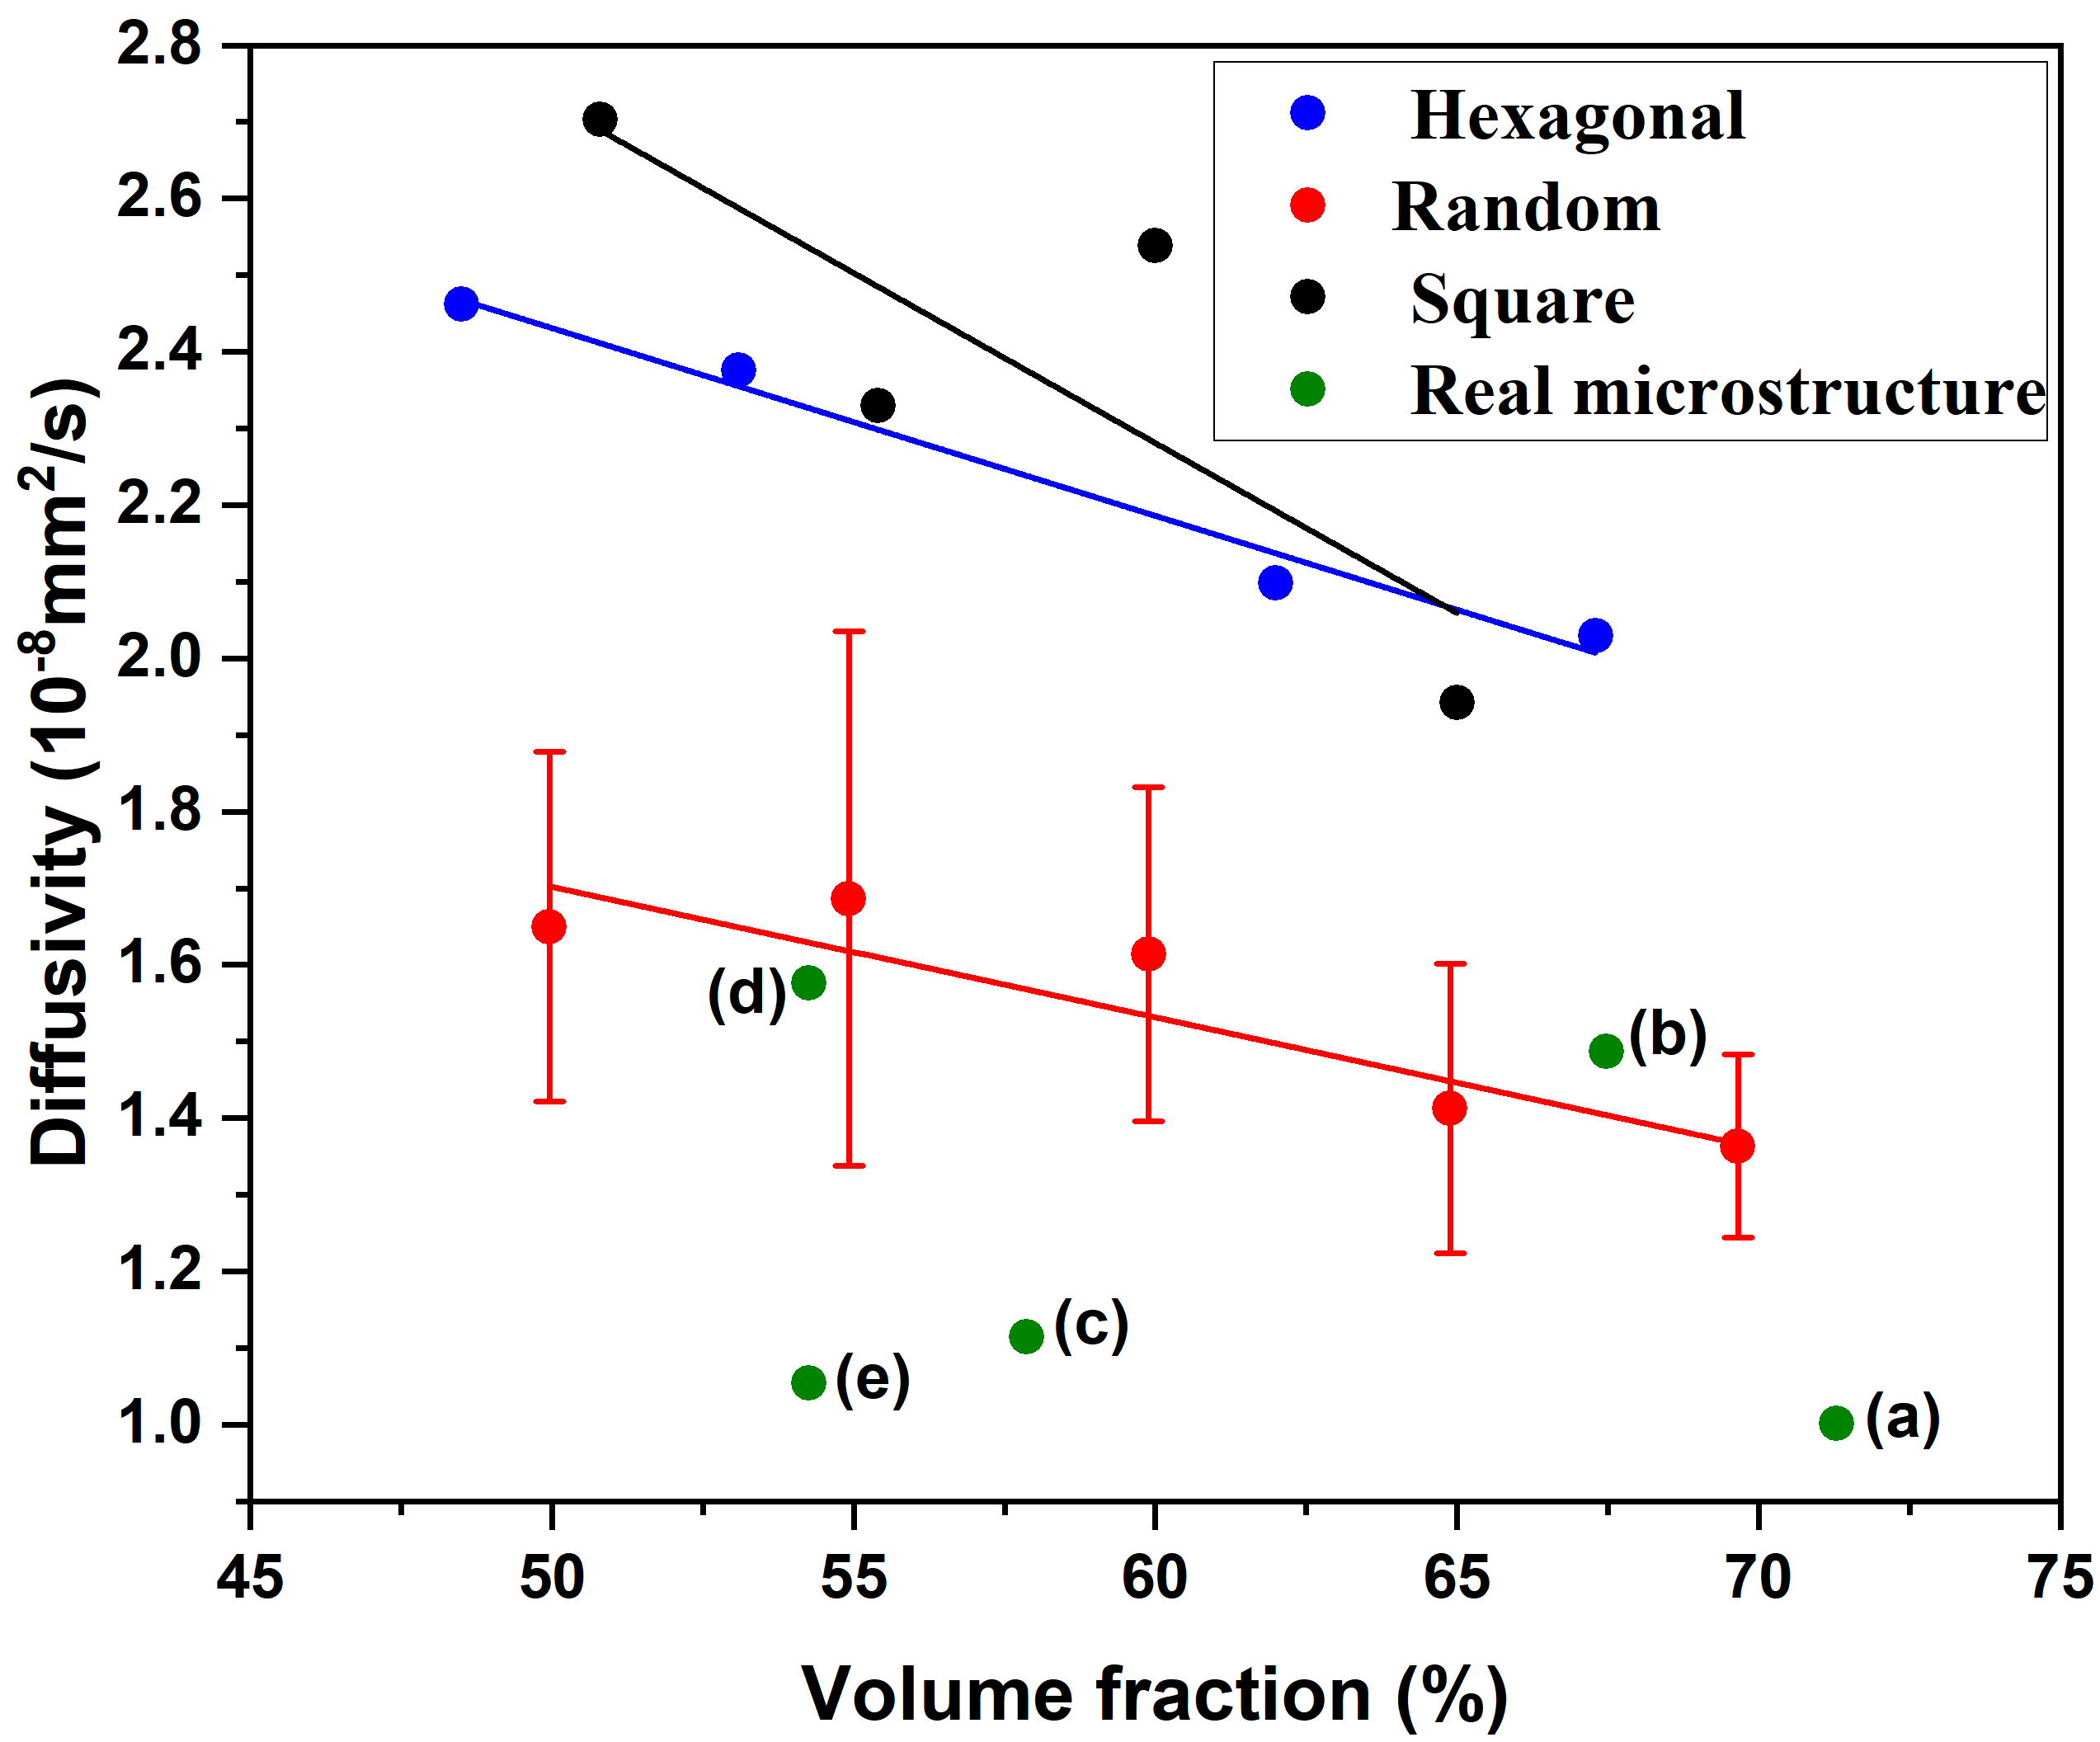
In Figure 24, we observe that the tortuosity values for real microstructures lie in the range of 2D micromechanical models with circular fibers. In addition, the tortuosity values for microstructures in Figures 23 and 23 are in the same range as that for Figure 23, 23 and 23, despite having higher fiber volume fractions. This behavior is attributed to fiber morphology. We observe that the concentration of non-circular (bean curve shaped) fiber cross-sections is higher in Figures 23, 23 and 23 than that in Figures 23 and 23. These fiber shapes create hindrance against moisture diffusion by increasing the tortuosity, as was discussed in section 5.2. We also observe that the tortuosity values in Figure 24 are inversely proportional to diffusivity values in Figure 24, where the diffusivity values are higher for lower tortuosity values, and vice versa. In summary, we have elucidated the influence of fiber morphology and distribution in real microstructures on tortuosity and diffusivity in this paper.
5.4 Relationship between Tortuosity and Diffusivity
Next, we establish a relationship between tortuosity and normalized diffusivity such that we can predict diffusivity of a given microstructure by merely determining their tortuosity. Recall that, we only need to perform a steady state diffusion analysis to determine tortuosity. To that end, we analyzed more than hundred two-dimensional micromechanical models with different fiber architecture that includes fiber distribution, volume fraction and fiber morphology, and determined their diffusivity and tortuosity values. The tortuosity and diffusivity are calculated using the method mentioned in Section 4. We define a "normalized diffusivity" term, which is the ratio of effective diffusivity () to that of homogeneous matrix diffusivity (). Then, we performed a regression analysis to establish a relationship between normalized diffusivity and tortuosity. This relationship is shown in Equation 19:
| (19) |
where, is the normalized diffusivity and x is the tortuosity which is dimensionless. The fitting constants , and are the offset, initial value and rate, respectively, and are also dimensionless. Here, denotes the rate of reduction in the normalized diffusivity with increasing tortuosity as it has a negative value. As the fiber volume fraction decreases to 20% and 30%, the difference in diffusivity values is higher than that of tortuosity values. This can be attributed to an increased variability in the fiber packing at lower volume fractions. Whereas, this variability decreases for higher volume fractions where the fiber packing converges towards a uniform hexagonal packing. This is captured well with in this equation. Using a normalized diffusivity enables us to generalize this relationship to other similarly behaving FRPC materials. Since, a majority of composite materials for structural applications consist of fiber volume fractions ranging between 20% to 70%, models with only these volume fractions are considered in the regression analysis.
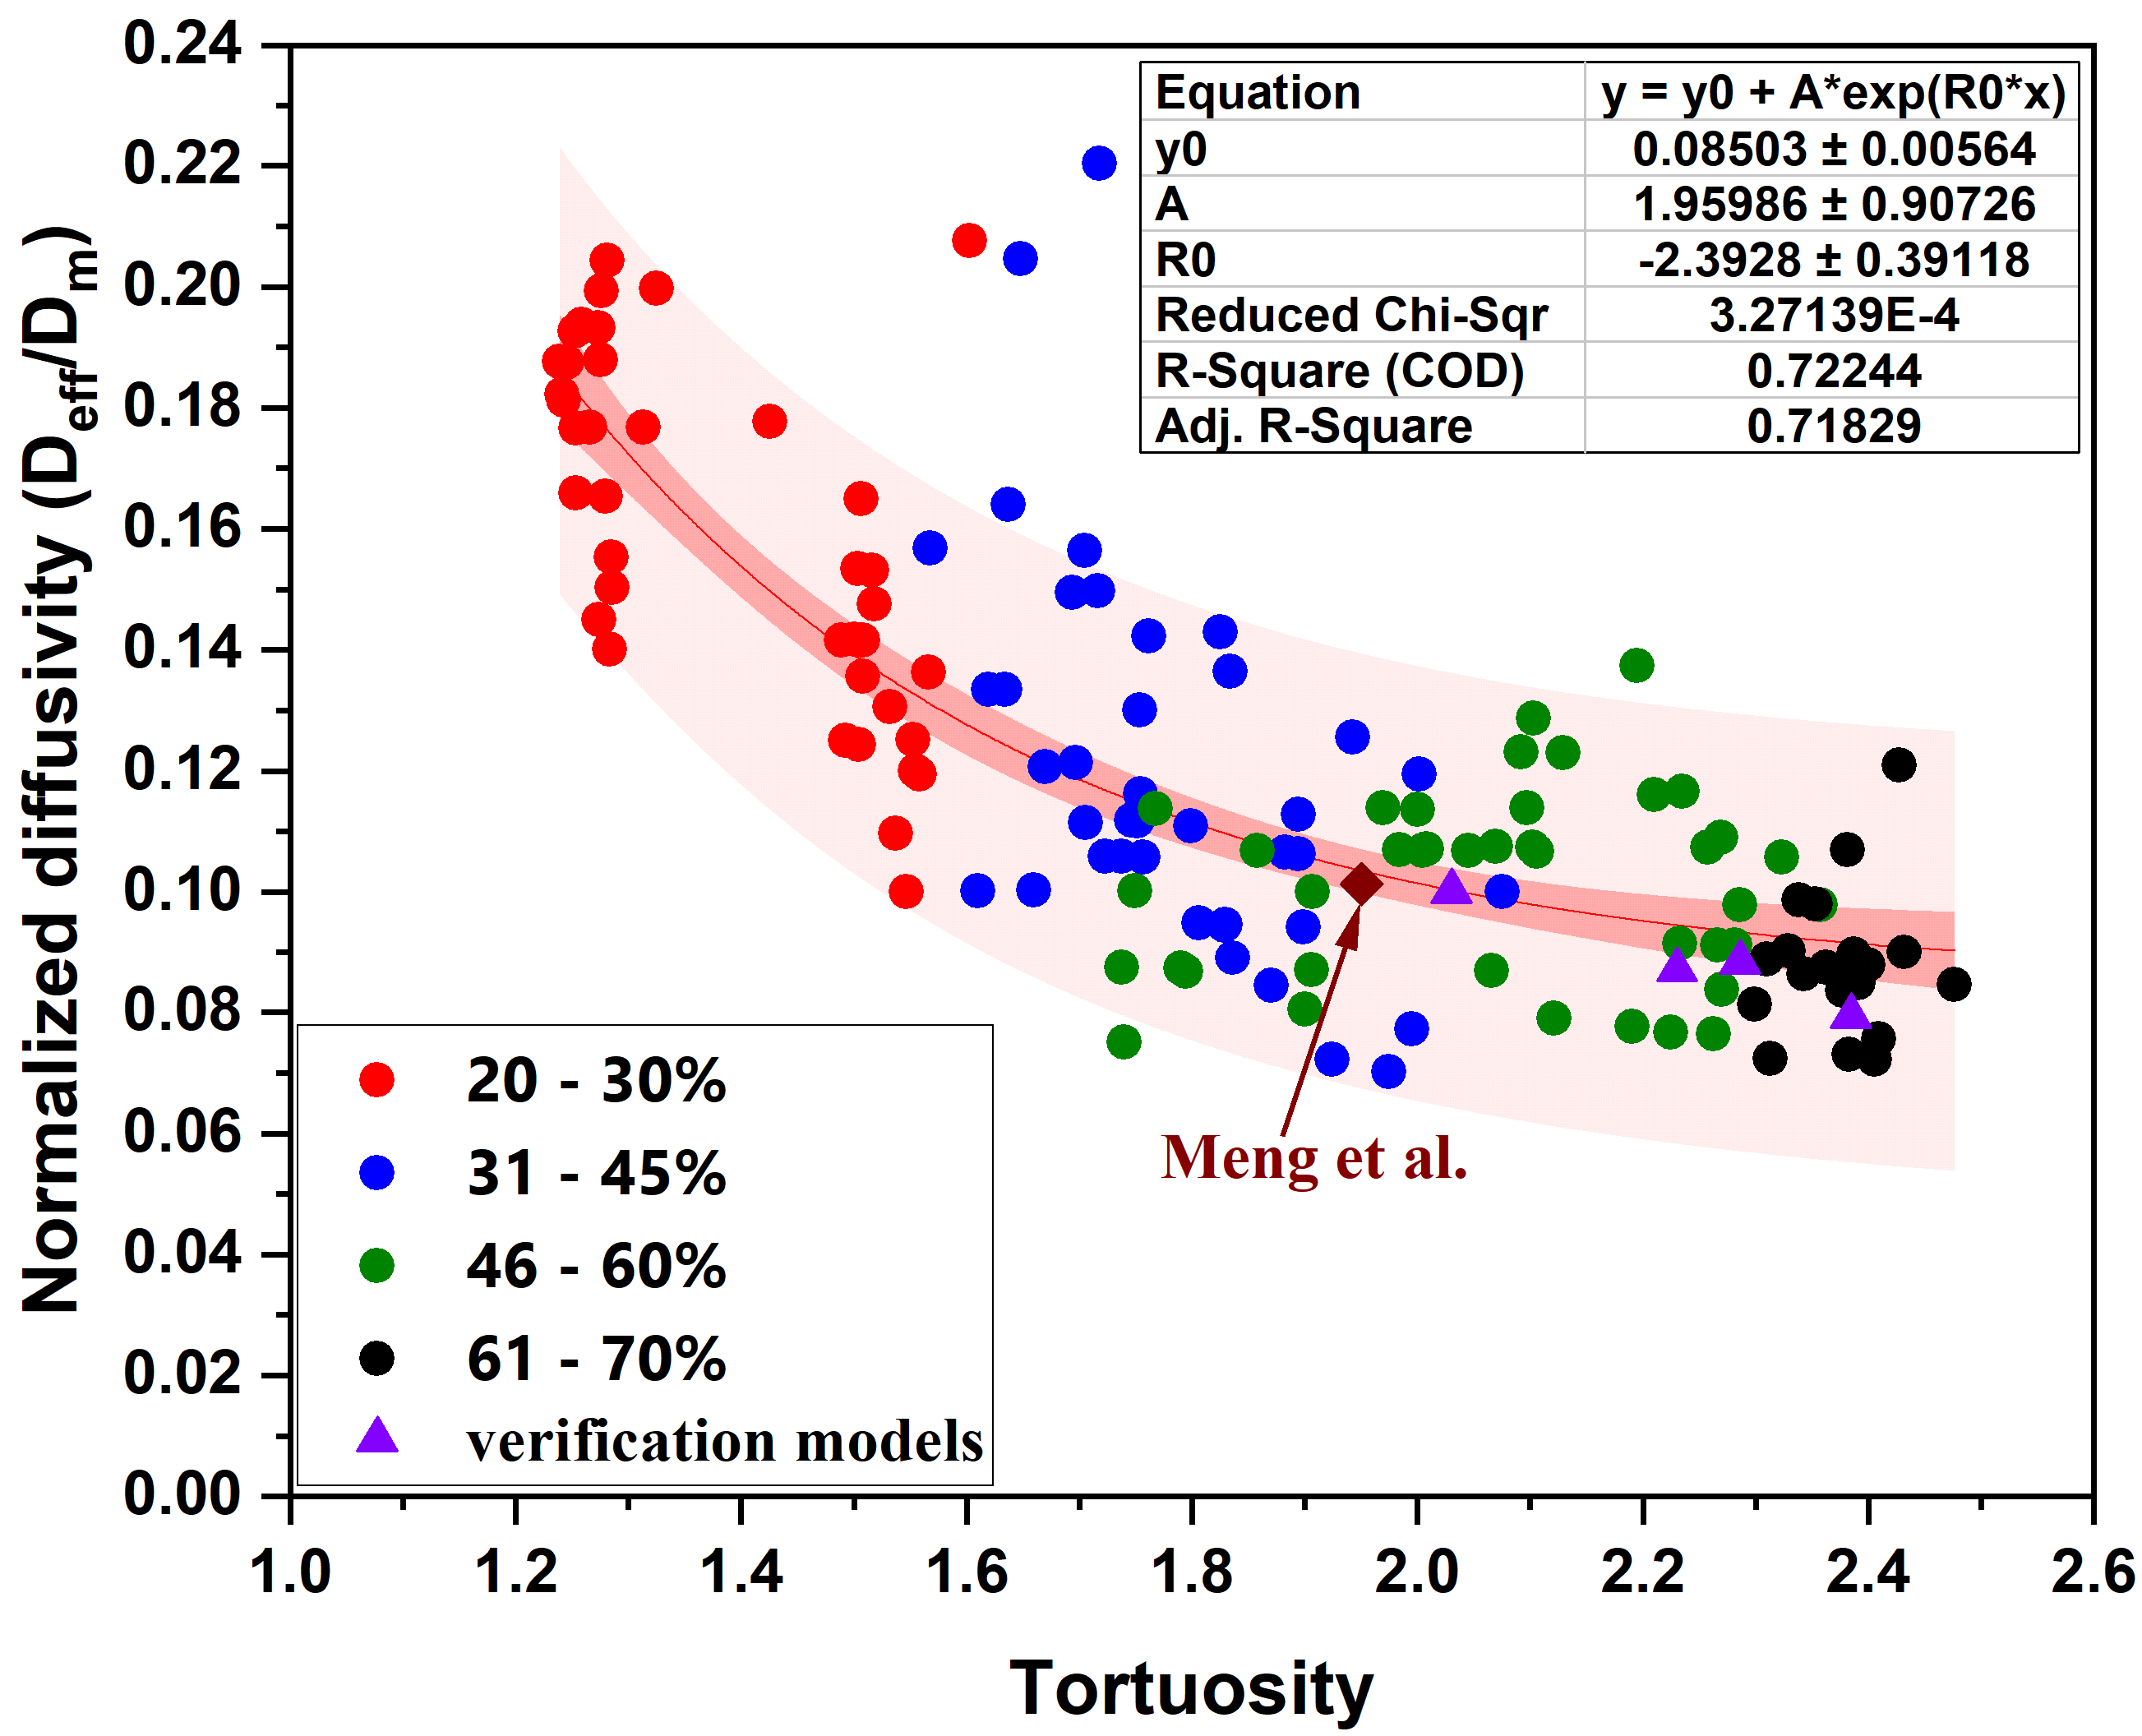
Figure 25 shows the tortuosity and corresponding normalized diffusivity () for several chosen models. The relationship between tortuosity and normalized diffusivity is an exponential fit with an value of 0.72. We show again from Figure 25 that diffusivity decreases with increasing tortuosity, which in turn increases the time required for moisture to reach its saturation limit in a given fiber-reinforced composite. We have also highlighted the diffusivity/tortuosity values using different colors (blue, green and red) for certain ranges of fiber volume fractions. As expected, diffusivity decreases and tortuosity increases in general as fiber volume fraction increases. However, other factors like fiber distribution and morphology introduce overlapping transition zones as seen in Figure 25.
In Figure 25, we see that there is some scatter in the data points around the fit, which we attribute to the well established Fick’s law used for calculating the moisture diffusivity. That is, the weight gain is considered linear in the initial portion, which is followed by a non-linear region prior reaching saturation. However, we observe a small deviation from this behavior in the initial portion of our computational results, that is, there is a sudden rise initially and then a more gradual linear weight gain portion. This is attributed to Fick’s law which assumes that when a sample comes in contact with moisture, equilibrium is instantaneously established between environmental moisture and internal moisture concentration. However, this process is gradual in reality [62, 63]. This dual initial slope from the simulations can introduce some variation in how the initial slope of the weight gain curve is calculated, which can manifest as fluctuations in the calculated diffusivity values.
Finally, for validating the proposed tortuosity-normalized diffusivity relationship, we use four different randomly distributed fiber architectures along with a fiber architecture model presented in Meng et al. [64]. We determined the tortuosity values using finite element method. Then, with the tortuosity values as input, we calculated the normalized diffusivity values using the established relationship. Our validation points fall within a 95% confidence band of the established relationship.
6 Conclusions
Key outcomes of this study are:
-
1.
We elucidated the influence of fiber architecture, which in 2D space includes fiber volume fraction, spatial fiber distribution and fiber morphology, on the effective moisture diffusivity of fiber reinforced composites by presenting a unifying concept of tortuosity. The tortuosity factor captured the effective fiber architecture.
-
2.
We developed micromechanical models consisting of random,square and hexagonal array with varying fiber volume fraction (50-70%) to study the influence of volume fraction and distribution on tortuosity and diffusivity. We noted that an increase in fiber volume fraction increases the tortuosity, thereby, decreasing its moisture diffusivity. We also showed that the fiber distribution has an impact on tortuosity and moisture diffusivity, where the models with randomly distributed fibers manifested higher tortuosity and lower diffusivity compared to that of the regular array models.
-
3.
We investigated the impact of fiber morphology on tortuosity using a unit cell model with fixed (50%) fiber volume fraction, where perfectly circular fibers mostly underestimated the tortuosity values and overestimated the diffusivity values.
-
4.
To understand the combined effect of fiber architecture on tortuosity and diffusivity, we considered real microstructures of CFRP composites. Here, we showed that models with lower fiber volume fractions can manifest higher tortuosity due to the combined influence of fiber morphology and distribution as compared to randomly distributed models with circular fibers.
-
5.
We showed that tortuosity and moisture diffusivity are inversely proportional in fiber reinforced composites. We established a relationship between tortuosity and diffusivity from which diffusivity can be estimated using tortuosity. It is worth noting that tortuosity can be easily calculated by solving steady state diffusion governing equation as compared to time dependent transient diffusion governing equation required to solve for moisture diffusivity. Hence, this can be very valuable for designing fiber architectures, multi-scale analysis and optimization.
-
6.
In summary, we elucidated the influence of fiber architecture on tortuosity, which is inversely related to moisture diffusivity. Using this knowledge, we can devise fiber architectures with greater tortuosity such that it results in increased moisture saturation time, which in turn is expected to increase the time required for moisture driven degradation. Thus, enabling longevity of fiber reinforced composites.
Acknowledgements
The authors would like to acknowledge the support through the U.S. Office of Naval Research - Young Investigator Program (ONR-YIP) award [N00014-19-1-2206] through Sea-based Aviation: Structures and Materials Program for conducting the research presented here.
Data Availability
The raw/processed data required to reproduce these findings cannot be shared at this time as the data also forms part of an ongoing study.
References
- [1] B. Dattaguru. Diffusion Studies on Advanced Fibre Hybrid Composites. 5(January):51–61, 1986.
- [2] J. Whitcomb and X. Tang. Micromechanics of moisture diffusion in composites with impermeable fibers. Journal of Composite Materials, 36(9):1093–1101, 2002.
- [3] L. R. Bao and A. F. Yee. Moisture diffusion and hygrothermal aging in bismaleimide matrix carbon fiber composites: part ii-woven and hybrid composites. Composites Science and Technology, 62(16):2111–2119, 2002.
- [4] S. Pavlidou, K. Krassa, and C. D. Fapaspyrides. Woven glass fabric/polyester composites: Effect of interface tailoring on water absorption. Journal of Applied Polymer Science, 98(2):843–851, 2005.
- [5] N. E. Marcovich, M. M. Reboredo, and M. I. Aranguren. Moisture diffusion in polyester-woodflour composites. Polymer, 40(26):7313–7320, 1999.
- [6] E. Barjasteh and S. R. Nutt. Moisture absorption of unidirectional hybrid composites. Composites Part A: Applied Science and Manufacturing, 43(1):158–164, 2012.
- [7] M. Cavasin, M. Sangermano, B. Thomson, and S. Giannis. Exposure of glass fiber reinforced polymer composites in seawater and the effect on their physical performance. Materials, 12(5), 2019.
- [8] S. G. Taghavi. Moisture Effects on High Performance Polymer Composites. THESIS at University of Toronto, page 96, 2000.
- [9] E. Pérez-Pacheco, J. I. Cauich-Cupul, A. Valadez-González, and P. J. Herrera-Franco. Effect of moisture absorption on the mechanical behavior of carbon fiber/epoxy matrix composites. Journal of Materials Science, 48(5):1873–1882, 2013.
- [10] B. C. Ray. Effects of changing environment and loading speed on mechanical behavior of FRP composites. Journal of Reinforced Plastics and Composites, 25(12):1227–1240, 2006.
- [11] Y. Dan-Mallam, T. W. Hong, and M. S. Abdul Majid. Mechanical characterization and water absorption behaviour of interwoven kenaf/PET fibre reinforced epoxy hybrid composite. International Journal of Polymer Science, 2015, 2015.
- [12] C. Gao and C. Zhou. Moisture absorption and cyclic absorption–desorption characters of fibre-reinforced epoxy composites. Journal of Materials Science, 54(11):8289–8301, 2019.
- [13] R. Zenasni and B. A. Saadi. Moisture effect on the interlaminar resistance of woven fabric thermoplastic composite. Journal of Thermoplastic Composite Materials, 19(6):715–729, 2006.
- [14] G. E. Guloglu, Y. K. Hamidi, and M. C. Altan. Moisture absorption of composites with interfacial storage. Composites Part A: Applied Science and Manufacturing, 134(September 2019):105908, 2020.
- [15] P. Surathi and V. M. Karbhari. Hygrothermal effects on durability and moisture kinetics of fiber-reinforced. Composites, (59):1–9, 2006.
- [16] H. R. Dana, A. Perronnet, S. Fréour, P. Casari, and F. Jacquemin. Identification of moisture diffusion parameters in organic matrix composites. Journal of Composite Materials, 47(9):1081–1092, 2013.
- [17] A. G. Airale, M. Carello, A. Ferraris, and L. Sisca. Moisture effect on mechanical properties of polymeric composite materials. AIP Conference Proceedings, 1736(May 2016):1–5, 2016.
- [18] I. El Sawi, H. Bougherara, R. Zitoune, and Z. Fawaz. Influence of the manufacturing process on the mechanical properties of flax/epoxy composites. Journal of Biobased Materials and Bioenergy, 8(1):69–76, 2014.
- [19] Y. Pan, G. Xian, and H. Li. Numerical modeling of moisture diffusion in an unidirectional fiber-reinforced polymer composite. Polymer Composites, 40(1):401–413, 2019.
- [20] E. H. Wong and S. B. Park. Moisture diffusion modeling – A critical review. Microelectronics Reliability, 65:318–326, 2016.
- [21] M. Brito, W. Santos, B. Correia, R. A. Queiroz, F. Tavares, G. Neto, and A. Lima. Moisture absorption in polymer composites reinforced with vegetable fiber: A three-dimensional investigation via Langmuir model. Polymers, 11(11), 2019.
- [22] A. Gagani, Y. Fan, A. H. Muliana, and A. T. Echtermeyer. Micromechanical modeling of anisotropic water diffusion in glass fiber epoxy reinforced composites. Journal of Composite Materials, 52(17):2321–2335, 2018.
- [23] F. Korkees, S. Alston, and C. Arnold. Directional diffusion of moisture into unidirectional carbon fiber/epoxy Composites: Experiments and modeling. Polymer Composites, 39:E2305–E2315, 2018.
- [24] V. Kostopoulos. Models for Combined Diffusion and Moduli Degradation Analysis of Glass Reinforced Cyanate Ester Composites Structures. MOJ Polymer Science, 1(2):41–52, 2017.
- [25] R. Pasupuleti, Y. Wang, I. Shabalin, L. Y. Li, Z. Liu, and S. Grove. Modelling of moisture diffusion in multilayer woven fabric composites. Computational Materials Science, 50(5):1675–1680, 2011.
- [26] S. Laurenzi, T. Albrizio, and M. Marchetti. Modeling of Moisture Diffusion in Carbon Braided Composites. International Journal of Aerospace Engineering, 2008:1–10, 2008.
- [27] X. Tang, J. Whitcomb, Y. Li, and H. Sue. Micromechanics modeling of moisture diffusion in woven composites. Composites Science and Technology, 65(6):817–826, 2005.
- [28] D. Bond. Moisture diffusion in a fiber-reinforced composite: Part I - Non-Fickian transport and the effect of fiber spatial distribution. Journal of Composite Materials, 39(23):2113–2142, 2005.
- [29] M. Fichera. Transport of Seawater and Its Influence on the Transverse Tensile Strength of Unidirectional Composite Materials. Thesis, Master of Science, Florida Atlantic University Boca Raton , Florida, (May), 2015.
- [30] J. Yang, Q. Yang, L. Ma, and W. Liu. Moisture diffusion behavior of permeable fiber-reinforced polymer composite. Frontiers of Mechanical Engineering in China, 5(3):347–352, 2010.
- [31] Z. Huo. Modeling and evaluation of moisture diffusion in polymer composite materials. PhD Disseratation, MISSOURI UNIVERSITY OF SCIENCE AND TECHNOLOGY, 2016.
- [32] N. Roe, Z. Huo, and K. Chandrashekhara. Advanced Moisture Modeling of Polymer Composites. Proceedings of the 6th Annual ISC Graduate Research Symposium ISC-GRS 2012, pages 1–6, 2012.
- [33] D. Gueribiz, F. Jacquemin, and S. Fréour. A moisture diffusion coupled model for composite materials. European Journal of Mechanics, A/Solids, 42:81–89, 2013.
- [34] L. Chu, J. Shi, H. Yu, and E. Souza De Cursi. Uncertainty propagation in moisture absorption of flax/glass fiber reinforced hybrid composites. Materials Research Express, 6(11), 2019.
- [35] H. Zheng, C. Zhou, and Y. Yuan. Meso-scale finite element modeling of moisture diffusion in 3D braided composite. International Journal of Heat and Mass Transfer, 129:862–872, 2019.
- [36] Y. Joliff, L. Belec, M. B. Heman, and J. F. Chailan. Experimental, analytical and numerical study of water diffusion in unidirectional composite materials - Interphase impact. Computational Materials Science, 64:141–145, 2012.
- [37] P. K. Aditya and P. K. Sinha. Effects of Fiber Shapes on Moisture Diffusion Coefficients. Journal of Reinforced Plastics and Composites, 12(9):973–986, 1993.
- [38] P. K. Aditya and P. K. Sinha. Effects of Arbitrarily Shaped Fibers on Moisture Diffusion Coefficients of Polymeric Composites. Journal of Reinforced Plastics and Composites, 13(2):142–154, 1994.
- [39] L. Shen and Z. Chen. Critical review of the impact of tortuosity on diffusion. Chemical Engineering Science, 62(14):3748–3755, 2007.
- [40] I. M. Gitman, H. Askes, and L. J. Sluys. Representative volume: Existence and size determination. Engineering Fracture Mechanics, 74(16):2518–2534, 2007.
- [41] Julien Yvonnet. Solid Mechanics and Its Applications Computational Homogenization of Heterogeneous Materials with Finite Elements.
- [42] D. Gueribiz, M. Rahmani, F. Jacquemin, S. Fréour, R. Guillén, and K. Loucif. Homogenization of moisture diffusing behavior of composite materials with impermeable or permeable fibers - Application to porous composite materials. Journal of Composite Materials, 43(12):1391–1408, 2009.
- [43] M. Herráez, J. Segurado, C. González, and C. S. Lopes. A microstructures generation tool for virtual ply property screening of hybrid composites with high volume fractions of non-circular fibers – VIPER. Composites Part A: Applied Science and Manufacturing, 129(October 2019):105691, 2020.
- [44] ABAQUS/Standard User’s Manual, Version 6.22. Dassault Systèmes Simulia Corp, United States, 2016.
- [45] M. Jiexian. Im2mesh (2D image to triangular meshes) (https://www.mathworks.com/matlabcentral/fileexchange/71772-im2mesh-2d-image-to-triangular-meshes). MATLAB Central File Exchange, 2021.
- [46] D. Engwirda. Locally optimal Delaunay-refinement and optimisation-based mesh generation. Ph.D Thesis, page 204, 2014.
- [47] E. H. Wong, Y. C. Teo, and T. B. Lim. Moisture diffusion and vapour pressure modeling of IC packaging. Proceedings - Electronic Components and Technology Conference, Part F133492:1372–1378, 1998.
- [48] D. Liu, J. Wang, R. Liu, and S. B. Park. An examination on the direct concentration approach to simulating moisture diffusion in a multi-material system. Microelectronics Reliability, 60:109–115, 2016.
- [49] C. Shen and G. S. Springer. Moisture Absorption and Desorption of Composite Materials. Journal of Composite Materials, 10(1):2–20, 1976.
- [50] G. Springer, A. Arbor, and S. Tsai. Thermal Conductivities of Unidirectional Materials. 1:166–173, 1967.
- [51] B. Suthar, P. Northrop, D. Rife, and V. Subramanian. Effect of Porosity, Thickness and Tortuosity on Capacity Fade of Anode. Journal of The Electrochemical Society, 162(9):A1708–A1717, 2015.
- [52] L. Froboese, J. F. van der Sichel, T. Loellhoeffel, L. Helmers, and A. Kwade. Effect of Microstructure on the Ionic Conductivity of an All Solid-State Battery Electrode. Journal of The Electrochemical Society, 166(2):A318–A328, 2019.
- [53] M. M. Forouzan, M. Wray, L. Robertson, and D. R. Wheeler. Tortuosity of Composite Porous Electrodes with Various Conductive Additives in an Alkaline System. Journal of The Electrochemical Society, 164(13):A3117–A3130, 2017.
- [54] N. Epstein. On tortuosity and the tortuosity factor in flow and diffusion through porous media. Chemical Engineering Science, 44(3):777–779, 1989.
- [55] V. D. A. G. Bruggeman. Calculation of Various Physics Constants in Heterogeneous Substances I Dielectricity Constants and Conductivity of Mixed Bodies from Isotropic Substances. Annalen der Physik, 1935.
- [56] N. Vivet, S. Chupin, E. Estrade, A. Richard, S. Bonnamy, D. Rochais, and E. Bruneton. Effect of Ni content in SOFC Ni-YSZ cermets: A three-dimensional study by FIB-SEM tomography. Journal of Power Sources, 196(23):9989–9997, 2011.
- [57] S. J. Cooper, D. S. Eastwood, J. Gelb, G. Damblanc, D. J. L. Brett, R. S. Bradley, P. J. Withers, P. D. Lee, A. J. Marquis, N. P. Brandon, and P. R. Shearing. Image based modelling of microstructural heterogeneity in LiFePO 4 electrodes for Li-ion batteries. Journal of Power Sources, 247:1033–1039, 2014.
- [58] J. Izzo, A. Joshi, K. Grew, W. Chiu, A. Tkachuk, S. Wang, and W. Yun. Nondestructive Reconstruction and Analysis of SOFC Anodes Using X-ray Computed Tomography at Sub-50 nm Resolution. Journal of The Electrochemical Society, 155(5):B504, 2008.
- [59] A. Nanjundappa, A. S. Alavijeh, M. El Hannach, D. Harvey, and E. Kjeang. A customized framework for 3-D morphological characterization of microporous layers. Electrochimica Acta, 110:349–357, 2013.
- [60] J. R. Wilson, W. Kobsiriphat, R. Mendoza, H. Chen, J. M. Hiller, D. J. Miller, K. Thornton, P. W. Voorhees, S. B. Adler, and S. A. Barnett. Three-dimensional reconstruction of a solid-oxide fuel-cell anode. Nature Materials, 5(7):541–544, 2006.
- [61] P. Vaddadi, T. Nakamura, and R. P. Singh. Transient hygrothermal stresses in fiber reinforced composites: A heterogeneous characterization approach. Composites Part A: Applied Science and Manufacturing, 34(8):719–730, 2003.
- [62] L. W. Cai and Y. Weitsman. Non-fickian moisture diffusion in polymeric composites. Journal of Composite Materials, 28(2):130–154, 1994.
- [63] S. P. Pilli, L. V. Smith, and S. Vaithiyalingam. Measuring time-dependent diffusion in polymer matrix composites. Mechanics of Time-Dependent Materials, 18(4):633–641, 2014.
- [64] M. Meng, M. J. Rizvi, H. R. Le, and S. M. Grove. Multi-scale modelling of moisture diffusion coupled with stress distribution in CFRP laminated composites. Composite Structures, 138:295–304, 2016.