Assessing Reference-Free Peer Evaluation for Machine Translation
Abstract
Reference-free evaluation has the potential to make machine translation evaluation substantially more scalable, allowing us to pivot easily to new languages or domains. It has been recently shown that the probabilities given by a large, multilingual model can achieve state of the art results when used as a reference-free metric. We experiment with various modifications to this model, and demonstrate that by scaling it up we can match the performance of BLEU. We analyze various potential weaknesses of the approach, and find that it is surprisingly robust and likely to offer reasonable performance across a broad spectrum of domains and different system qualities.
1 Introduction
Traditional automatic metrics for machine translation (MT), such as BLEU Papineni et al. (2002), score MT output by comparing it to one or more reference translations. This has several disadvantages. First, high-quality reference translations are expensive to create. This means that in practice, evaluation is usually carried out with relatively small, carefully curated test corpora. The need for careful preparation limits the number of domains for which an MT system can be conveniently assessed, and small test-set sizes can make it difficult to draw robust conclusions Card et al. (2020). Second, enshrining ground truth in a small number of references (usually just one) is inherently problematic, since valid translations can vary along many dimensions; Freitag et al. (2020b) demonstrate that different (correct) references for the same test set can result in different system rankings according to the same reference-based metric. Finally, scoring the similarity between an MT hypothesis and a reference translation involves recognizing the extent to which they are mutual paraphrases. When gross discrepancies exist, this is a relatively easy problem for which surface-level metrics can provide a reliable signal, but capturing the subtle errors typical of high-quality MT is more difficult, and it is not clear whether it is substantially easier than scoring the similarity between texts in different languages.
These problems can be avoided by looking only at the source text when assessing MT output. There is evidence that this is the best practice for human evaluation Toral (2020). Moreover, it has recently been investigated for automatic metrics as well Yankovskaya et al. (2019); Lo (2019); Zhao et al. (2020); Ma et al. (2019). Such reference-free metrics are flexible and scalable, but since they are essentially performing the same task as an MT model, they raise a circularity concern: if we can reliably score MT output, why wouldn’t we use the scoring model to produce better output? One answer to this is practical: the scoring model might be too large to deploy, or it might not easily support efficient inference Yu et al. (2016). A more interesting answer is that a scoring model could be set up to provide a signal that is complementary to the systems under evaluation. That is, it might be capable of correctly ranking competing MT hypotheses even when its own preferred hypothesis is worse on average than those of the systems it is evaluating. In our experiments we find that this can indeed be the case.
In recent work, Thompson and Post (2020) showed that a single multilingual MT model trained on 39 languages can achieve excellent paraphrase recognition when used in zero-shot mode to compare MT output with reference sentences in the same language. On the WMT 2019 metrics task, their method (Prism) beat or tied all previous reference-based metrics on all languages.111Except Gujarati, which was absent from their training corpus. Although it was not the main focus of their work, Prism achieved a new state-of-the-art as a reference-free metric, simply scoring target given source text using an MT model, in a post-competition comparison to the 2019 “Quality Estimation as a metric” shared task Ma et al. (2019).
Our aim in this paper is to characterize the conditions under which the Prism approach—using one MT system to perform peer evaluation on other systems—can be successful: what properties does the evaluating system need to have, how powerful should it be, and how close can it be to the systems under evaluation? We focus on system-level evaluation, which we believe is the most compelling use case for reference-free methods, targeting a broad characterization that complements the potentially more precise picture furnished by reference-based metrics for a specific test corpus. We first replicate the correlation with human judgment results from Thompson and Post (2020) on WMT 2019, using the same corpora and architecture. Next, we examine several alternative design decisions in an attempt to improve Prism and further our understanding. These include the effects of varying training corpora (domain, number of languages, use of monolingual data); model capacity (scaling up and down from the original architecture); and different methods for regularizing token-level probabilities (Monte-Carlo dropout, subword sampling) and for combining them into system-level scores (summary statistics over tokens, confidence thresholds over sentences). Finally, we analyze the results of our best model, measuring how its performance depends on various factors: language pair and human-judgment methodology, output quality, proximity to the systems under evaluation, and size of the test set.
We demonstrate improvements over the original Prism metric due to model capacity and different methods for combining probabilities; surprisingly, we find little gain from adjusting the domain or languages in the original multilingual corpus (although we show that a competition-grade English-German system outperforms the generic multilingual system). We find that the evaluating MT system’s output quality is generally correlated with its performance as a metric, although we corroborate the surprising finding from Thompson and Post (2020) that it is not necessary to be the best—our system is middle-of-the-road or worse according to BLEU across most WMT 2019 languages. We measure the proximity between our system and the systems under evaluation and find no evidence that this is a source of bias. Despite using no references, our model achieves approximate parity with BLEU both in system-level correlation with human judgment, and when used for pairwise comparisons.
2 Related Work
Reference-free evaluation is widely used for many NLP tasks such as grammatical error correction Napoles et al. (2016), dialog Sinha et al. (2020); Mehri and Eskenazi (2020) and text generation Ethayarajh and Sadigh (2020). There has been recent interest in reference-free evaluation for MT, which was a joint track between the WMT 2019 metrics task Ma et al. (2019) and quality estimation task Fonseca et al. (2019). Reference-free metrics competed head-to-head with standard metrics, and generally did worse. However, the results from the best reference-free systems, UNI+ Yankovskaya et al. (2019) and YiSi-2 Lo (2019) were surprisingly close to the standard metric scores on the language pairs for which they were evaluated.
UNI+ computes word-level embeddings for source and MT output sentences using pre-trained multilingual BERT and LASER Artetxe and Schwenk (2019) models, then feeds averaged vectors to a neural classifier trained to predict human scores from previous MT metrics tasks. YiSi-2 is similar, except that it works in an unsupervised fashion, computing similarities between mBERT embeddings for aligned source and target words, and returning an F-measure statistic. In more recent work, Zhao et al. (2020) adopt a similar approach based on mBERT, aligning representations from multilingual embedding spaces before computing distances with MoverScore Zhao et al. (2019), and adding a GPT-based target-side language model. The current state-of-the-art in reference-free evaluation for MT is represented by the Prism approach Thompson and Post (2020) which we extend here.
It is worth distinguishing reference-free evaluation from two related tasks that share formal similarities. The first is quality or confidence estimation Blatz et al. (2004); Specia and Shah (2018); Chelba et al. (2020), which aims to score the fitness of MT output for a downstream application. This is typically supervised, although a recent approach Fomicheva et al. (2020) dispenses with the need to learn from human annotations, as do most of the approaches we study in this paper. Quality estimation is most usefully applied at the sentence level, and it can make use of powerful “glass-box” features which capture the internals of an MT system. In contrast, reference-free evaluation is most naturally applied at the system (test-set) level, and ideally should make no assumptions about the systems under evaluation. The second task is parallel-corpus mining Zhang et al. (2020); Yang et al. (2019), which aims to identify valid translations at various levels of granularity. Its scoring aspect is similar to reference-free evaluation, but it is applied to a different input distribution, attempting to identify human-generated translation pairs rather than scoring MT outputs for a given human-generated source text.
3 Methods
We aim to generate a quality score for source and target texts which consist of segment (nominally, sentence) pairs . We assume no document or ordering information among segments, and do not directly evaluate scores for individual segment pairs. All methods we consider make use of token-level log-probabilities from a standard autoregressive neural MT system: , where . We experimented with reverse probabilities , but like Thompson and Post (2020) found these gave no advantage, and do not include them in our reported results. The following sections describe our model architecture, scoring techniques, and evaluation methodology.
3.1 Model
Our baseline NMT model uses a standard Transformer architecture identical to that of Thompson and Post (2020) (up to toolkit differences), trained on the same multilingual corpus. To encourage language-agnostic encoder representations for zero-shot scoring, the baseline uses target-language tags at the beginning of each target sentence Johnson et al. (2017). Since we do not require such representations for reference-free evaluation, we also tried introducing the tags earlier, at the beginning of each source sentence. We vary training corpora and model capacity as described in section 4.1, but otherwise make no changes to the model.
3.2 Scoring
We investigated various techniques for deriving segment-level scores : regularization, different methods for aggregating token-level probabilities, and segment-level confidence thresholds.
Regularization
To obtain smoother scores, we used Monte-Carlo dropout Gal and Ghahramani (2016) and subword regularization Kudo (2018). These involve estimates of the form:
where is a probability estimate that depends on the smoothing method. For MC-dropout, it is obtained by dropping neural connections with probability . For subword regularization, , where and are randomly-sampled alternative subword segmentations of and .222We perform an approximate search for the 10-best subword segmentations, then sample from this list with probability proportional to a unigram estimate . Note that MC-dropout decomposes over tokens, yielding smoother per-token probabilities; subword regularization does not, since it does not preserve tokenization.
Aggregating token-level log-probabilities
Given a sequence of token probabilities , , we derive segment-level scores using various statistics. Following Thompson and Post (2020), we sum to obtain segment log-probabilities or average to obtain mean token-wise log-probabilities. To eliminate the effect of outliers, we tried the median instead of the mean. To test the opposite intuition, we also tried the minimum. Finally, to reflect overall consistency, we compute standard deviation.
Confidence Thresholds
Quality scores implicitly reflect the presence or absence of errors in MT output. In some cases, model probabilities provide strong evidence for or against the existence of errors, but in other cases the model may be agnostic. To capture this intuition, we used the following mapping to obtain segment scores:
To set the thresholds we used a coarse grid search on development data.
3.3 Evaluation
We evaluate reference-free metric scores on data from the WMT19 metrics task Ma et al. (2019), consisting of outputs from different MT systems for 18 language pairs. For each language pair, we compute a metric score for each system, then use correlation with the provided human scores to assess the quality of our metric.333Human annotators assign segment-level scores on a scale which are averaged across segments, then normalized to correct for annotator differences, then averaged across annotators to produce system-level scores. For out-of-English language pairs, annotations are made by comparison to the source text, which directly corresponds to our setting; for other pairs, they are made by comparing to reference translations. Following Ma et al. (2019) we measure correlation using Pearson’s coefficient, and use Williams’ test Williams (1959) to compute the significance of correlation differences, with a p-value 0.05.
Ma et al. (2019) note that correlation scores are unrealistically high for many language pairs, and suggest using only the best systems for small values of . However, Mathur et al. (2020) show that this results in noisy and unreliable estimates. We adopt their suggestion to instead remove outlier systems whose scores have large deviations from the median according to the formula:
where is a system-level human score, and is the median score across all systems for a given language pair.
To summarize a metric’s performance across a set of language pairs, we report the weighted average of its Pearson correlations across languages. We first apply the Fisher Z-transformation to normalize raw language-specific correlations, then weight by the number of MT systems per language (post outlier filtering), then invert the Fisher Z-transformation and take the mean Hedges and Olkin (2014).
4 Experimental Settings
4.1 Data
We used four training corpora. Prism-39 consists of noise-filtered multi-way parallel data curated by Thompson and Post (2020), extracted primarily from Wikimatrix, Global Voices, EuroParl, SETimes, and United Nations, consisting of 99.8M sentence pairs in 39 languages, including direct parallel data for 706 language pairs. Wiki-39-Mono consists of monolingual data extracted from the multilingual Wikipedia corpus for the languages available in Prism-39. WMT-15 is the parallel training data provided for the WMT 2019 News Translation Task Barrault et al. (2019), augmented with 5 languages from previous WMT years—Estonian (et), Spanish (es), Latvian (lt), Hindi (hi) and Turkish (tr). All language pairs are to/from English except French-German. Sizes range from 60 million sentence pairs for English-Czech to 10k pairs for English-Gujarati (Table 4). Finally, WMT-15-Mono is the monolingual data provided alongside WMT-15.
Test data is from the WMT 2019 Metrics Task Ma et al. (2019), consisting of system outputs on news-domain text for all 18 language pairs included in the task: English (en) to/from Czech (cs), German (de), Finnish (fi), Gujarati (gu), Kazakh (kk), Lithuanian (lt), Russian (ru), and Chinese (zh), excluding cs-en. There are three other language pairs not including English: de-cs, de-fr and fr-de. The average number of systems per language is 12, and the average test-set size is 1,633.
4.2 MT Systems
| Scale | Params | Layers | Hidden | Heads | Model |
|---|---|---|---|---|---|
| Big | 473M | 6 | 8192 | 16 | 1024 |
| Prism | 900M | 8 | 12288 | 20 | 1280 |
| Massive | 1.8B | 8 | 16384 | 32 | 2048 |
We used the Lingvo toolkit Shen et al. (2019), to train Transformer sequence-to-sequence models of various sizes as shown in Table 1, where the baseline Prism configuration matches that of Thompson and Post (2020). We use AdaFactor optimization with a learning rate of 1.0 and batch size of 8000 samples. Our shared vocabulary comprises 64k subwords.
5 Results
This section presents our main results. All correlations in the tables below are for system-level scores, after outlier systems have been discarded for each language pair. For brevity, we report average correlations, normalized and weighted as described in section 3.3; full results are provided in Appendix B. Unless otherwise stated, all methods score system outputs using average log probabilities normalized by segment length.
5.1 Baselines
| Metric | All | en-xx | xx-en | xx-yy |
|---|---|---|---|---|
| BLEU | 0.911 | 0.917 | 0.921 | 0.838 |
| CHRF | 0.933 | 0.937 | 0.919 | 0.954 |
| UNI+* | 0.808 | 0.746 | 0.822 | - |
| Yisi-2* | 0.487 | 0.272 | 0.646 | 0.489 |
| Prism | 0.861 | 0.814 | 0.887 | 0.911 |
| Prism-trg2xx | 0.853 | 0.812 | 0.872 | 0.907 |
| Prism-src2xx | 0.858 | 0.822 | 0.871 | 0.914 |
Table 2 shows key WMT19 baseline results for reference-based metrics (top two lines), reference-free metrics (next three lines), and our reimplementation of the Prism model (bottom lines). We achieve slightly better results for source-side tagging (Prism-src2xx), and on average match the original Prism results that use target-side tagging with this configuration, which we adopt for further experiments. The en-xx results are affected negatively by the inclusion of en-gu, which is absent from the Prism-39 corpus and has low correlation (); however, interestingly, results for gu-en are on par with other language pairs, presumably due to the prevalence of English in the corpus.
5.2 Training data
| Data | All | en-xx | xx-en | xx-yy |
|---|---|---|---|---|
| Prism-39 | 0.858 | 0.822 | 0.871 | 0.914 |
| WMT-15 | 0.840 | 0.776 | 0.890 | 0.854 |
| Prism-13 | 0.863 | 0.828 | 0.888 | 0.888 |
| Prism-39 + WMT-15 | 0.867 | 0.811 | 0.896 | 0.923 |
| Adding monolingual data | ||||
| Prism-39 + Wiki-39 | 0.832 | 0.792 | 0.859 | 0.869 |
| WMT-15 + WMT-15-Mono | 0.870 | 0.839 | 0.910 | 0.818 |
| Prism-39 + WMT-15-Mono | 0.851 | 0.831 | 0.863 | 0.874 |
Table 3 gives results for training on different corpora described in section 4.1. The first four lines correspond to different multilingual training corpora, beginning with the Prism-39 model from the previous section. We see no gain on average from using the provided WMT-15 training corpora, despite possibly better domain fit and generally larger sizes for the language pairs in the test set (Table 4). We speculate that this is due to preprocessing as we made no effort to clean or filter the WMT-15 corpus. This hypothesis is supported by the Prism-13 results, where we trained on the language pairs in Prism-39 that overlapped with the WMT-15 corpus, achieving slightly better average performance. Combining Prism-39 and WMT-15 improves further, yielding a relatively small but statistically significant average gain over pure Prism-39, at the cost of lower performance for the en-xx language pairs.
| LP | Prism-39 | WMT-15 |
|---|---|---|
| en-zh | 1.49 | 64.33 |
| en-fr | 3.52 | 40.44 |
| en-ru | 2.25 | 38.49 |
| en-cs | 0.65 | 25.98 |
| en-es | 4.40 | 15.18 |
| de-fr | 0.65 | 9.82 |
| en-fi | 0.28 | 6.58 |
| en-de | 1.36 | 4.50 |
| en-et | 0.22 | 2.17 |
| en-lv | 0.09 | 0.63 |
| en-lt | 0.16 | 0.63 |
| en-kk | 0.20 | 0.22 |
| en-gu | 0.00 | 0.01 |
| de-cs | 0.37 | 0.00 |
| Data | en-de | en-lt | en-ru | en-zh | de-en | lt-en | ru-en | zh-en |
|---|---|---|---|---|---|---|---|---|
| BLEU | 0.806 | 0.986 | 0.946 | 0.802 | 0.794 | 0.985 | 0.812 | 0.808 |
| Prism-39 | 0.730 | 0.939 | 0.901 | 0.789 | 0.796 | 0.978 | 0.739 | 0.828 |
| Bilingual Models | 0.726 | 0.695 | 0.867 | 0.769 | 0.801 | 0.862 | 0.650 | 0.826 |
| Competition-grade | 0.913 | - | - | - | - | - | - | - |
| LP | WMT-15-Mono | Wiki-39 |
|---|---|---|
| de | 275.69 | 59.93 |
| en | 199.90 | 130.79 |
| fr | 160.93 | 48.52 |
| lt | 106.19 | 4.85 |
| ru | 80.14 | 46.27 |
| cs | 72.15 | 9.44 |
| fi | 18.84 | 7.88 |
| kk | 13.82 | 3.34 |
| gu | 4.64 | 0.00 |
| zh | 2.15 | 21.79 |
| et | 51.68 | 3.03 |
| es | 43.81 | 36.17 |
| hi | 23.61 | 2.37 |
| lv | 10.20 | 1.36 |
| tr | 9.65 | 5.42 |
Inspired by improvements for low-resource languages from monolingual data Siddhant et al. (2020), we used the MASS denoising objective to add general-domain monolingual data (Wiki-39) to Prism-39 and in-domain data (WMT-15-Mono) to both Prism-39 and WMT-15 (Table 6 for a comparison on the relative sizes of the monolingual corpora). Overall, the general-domain data hurts correlation significantly, while in-domain helps significantly, but only for WMT-15. As expected, monolingual data tends to help lower-resource languages (gu, kk, lt) most, with a particularly large gain for xx-en with WMT-15 + WMT-15-Mono. However, the correlation for xx-yy language-pairs degrades significantly, which we attribute to the en-centric nature of the WMT-15 dataset.
5.3 Bilingual Systems
Can we use bilingual MT systems for peer evaluation? We chose four representative language pairs from Prism-39 and trained “Big” models (see Table 1) in eight directions, with dedicated 64k subword vocabularies. Table 5 shows that for medium and high resource languages (de, ru, and zh), the bilingual model performs comparably to the multilingual model. However, for the low resource language “lt”, the multilingual model is significantly better. As with the results elsewhere in this section, this suggests that correlation tends to follow the pattern one would expect if we were mainly interested in model quality. This is corroborated by the results in the last line of the table, where we compare a competition-grade model for en-de Freitag et al. (2020a), similar to the winning submission from WMT19, to our models. The competition-grade model achieves a much better correlation and also improves on BLEU by a wide margin.
5.4 Model Capacity
| Metric | All | en-xx | xx-en | xx-yy |
|---|---|---|---|---|
| BLEU | 0.911 | 0.917 | 0.921 | 0.838 |
| Big | 0.808 | 0.745 | 0.838 | 0.885 |
| Prism | 0.858 | 0.822 | 0.871 | 0.914 |
| Massive | 0.883 | 0.858 | 0.890 | 0.927 |
Motivated by the link between correlation and model quality, we varied model capacity according to the settings in Table 1, using the Prism-39 training corpus. The results in Table 7 show a clear pattern of gains with increasing capacity. The Massive configuration does best overall, achieving statistical parity with BLEU on average.
5.5 Scoring Methods
| Aggregation Method | All | en-xx | xx-en | xx-yy |
|---|---|---|---|---|
| Mean | 0.883 | 0.858 | 0.890 | 0.927 |
| Std-dev | 0.882 | 0.847 | 0.903 | 0.919 |
| Median | 0.870 | 0.859 | 0.876 | 0.887 |
| Min | 0.872 | 0.840 | 0.895 | 0.896 |
| MC-dropout (Mean) | 0.877 | 0.847 | 0.888 | 0.926 |
| SP-Norm (Mean) | 0.884 | 0.861 | 0.892 | 0.924 |
| Confidence threshold | 0.886 | 0.898 | 0.858 | 0.910 |
Table 8 shows results for the scoring methods described in section 3.2 applied to the Massive configuration. Aggregating token probabilities using statistics other than mean gives small gains on some languages, but hurts on average. Regularizing with MC-dropout or subwords (SP-norm) leads to significant gains in some cases, with a slight overall increase over mean for SP-norm. We tuned confidence thresholds on WMT18 Metrics task data using a grid of 16 log-probability points in , which yielded optimal thresholds . This produced our best overall result, with systematic gains on en-xx pairs.
6 Analysis
In this section we analyze various aspects of metric performance, confining our attention to the Massive model with mean scoring for consistency.
6.1 Performance across conditions
| Subset | Avg |
|---|---|
| All | 0.883 |
| All - gu | 0.893 |
| Source-based evaluation | 0.858 |
| Source-based - gu | 0.883 |
| Reference-based evaluation | 0.901 |
| Reference-based - gu | 0.901 |
| Corpus 1M | 0.839 |
| Corpus 1M | 0.924 |
| No data | 0.741 |
Different languages have different relations to our model, to the systems participating in the WMT task, and to the human scoring procedure used in the WMT19 data. Table 9 shows results for various conditions. Removing the language (gu) for which we have no training data improves average correlation substantially. The human evaluations for out-of-English language pairs involve comparing MT output to the source text; the evaluations for remaining pairs involve comparing it to reference translations. We see no boost from the language pairs for which source-based human evaluation was used (matching our setting), and in fact do somewhat worse on these pairs than the others, on average. Finally, we achieve better performance for lower-resource ( 1M parallel segments) language pairs than higher-resource pairs (with respect to the Prism-39 corpora), but poor average performance on the pairs (en-gu/gu-en) for which we had no training data.
6.2 Pairwise comparisons
Correlation statistics give an overall picture of metric performance, but do not directly reflect the frequent use case of deciding which of two systems is better. To measure this, we examined whether our metric agrees with human pairwise ranking decisions over all pairs of systems. Following Mathur et al. (2020), we apply the Wilcoxon ranksum test and paired t-test to detect when such decisions are significant according to human and metric scores respectively.
| Metric | Human-S | Human-NS | ||||
|---|---|---|---|---|---|---|
| C () | IC () | NS | C () | IC () | NS | |
| All Systems | ||||||
| BLEU | 768 | 37 | 80 | 126 | 71 | 70 |
| Prism | 778 | 61 | 46 | 136 | 93 | 38 |
| en-xx Systems | ||||||
| BLEU | 411 | 25 | 53 | 38 | 25 | 26 |
| Prism | 421 | 36 | 32 | 39 | 29 | 21 |
| xx-en Systems | ||||||
| BLEU | 285 | 8 | 20 | 67 | 40 | 33 |
| Prism | 277 | 23 | 13 | 74 | 53 | 13 |
| xx-yy Systems | ||||||
| BLEU | 72 | 4 | 7 | 21 | 6 | 11 |
| Prism | 80 | 2 | 1 | 23 | 11 | 4 |
Table 10 shows ranking performance for Prism compared to BLEU, categorized according to language pair grouping. The general pattern across all groupings is that Prism is more decisive: it makes more significant decisions than BLEU, leading to higher rates of both correct and incorrect rankings. Among the 885 system pairs (across all languages) that are considered significantly different according to human judgment, Prism correctly ranks 88% with significantly different scores, compared to 87% for BLEU.
6.3 Quality of the evaluating model
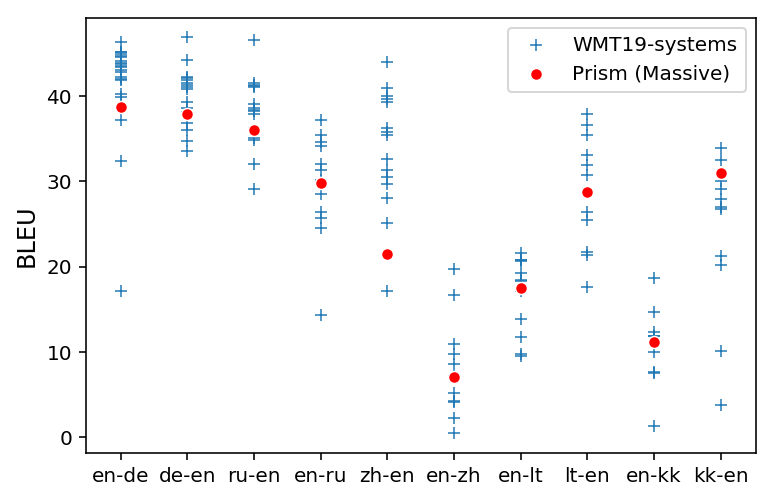
How good is our multilingual MT system compared to the systems under evaluation? We generated translations of the test text for a subset of languages and compared the quality of the generated system outputs using BLEU. Figure 1 shows that our evaluating model achieves worse BLEU scores than many of the systems under evaluation, ranking around the median for most language pairs. Although Table 5 provides evidence that stronger systems produce better metrics, clearly it is not necessary to be among the top-ranked systems in order to generate a signal that is approximately as reliable as BLEU.444It would be interesting to try to characterize the relation between system quality and metric strength more precisely, but in the absence of human judgments of our output quality, any such picture we could currently draw would be clouded by metric noise.
6.4 Proximity Bias
A potential pitfall in peer evaluation is bias toward one or more of the systems under evaluation. Clearly, the evaluating system will prefer its own output—how far from an evaluated system does it have to be in order to judge it fairly? Lacking access to the systems in the WMT19 task, we measure proximity using cross-BLEU score (using one output as hypothesis and the other one as reference translation) between the system output and the output generated by our Prism model. In the presence of bias, we would expect the metric to result in higher ranking for closer systems and lower ranking for farther systems (relative to human scores).
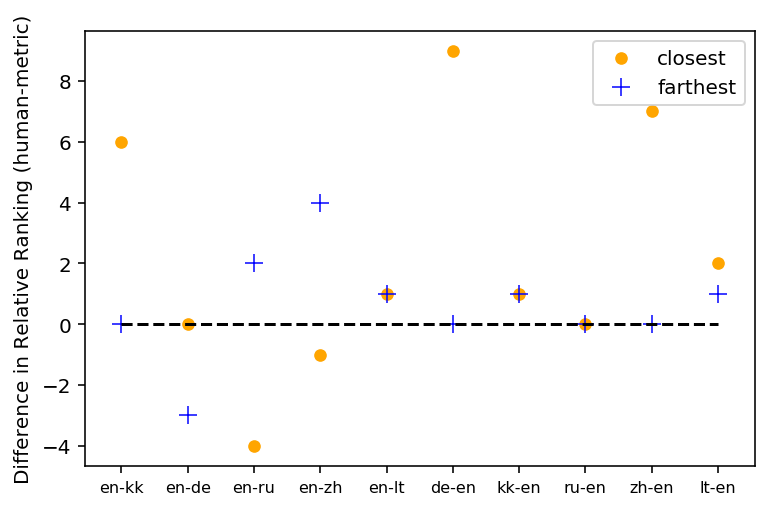
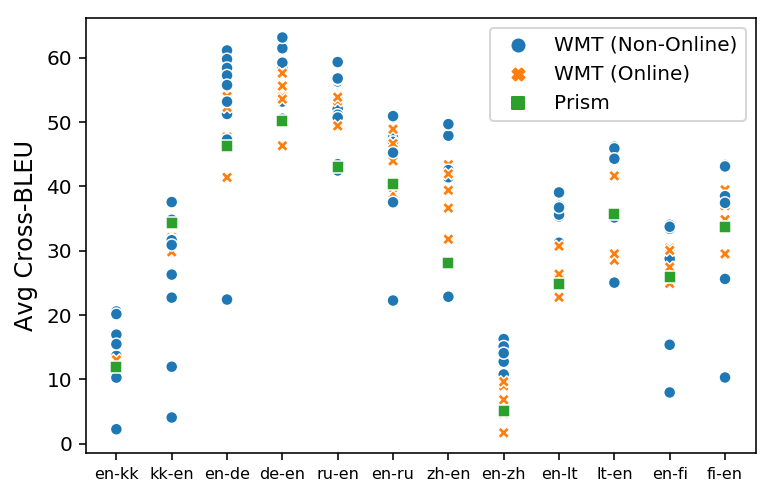
Figure 2 shows the relative ranking of the closest and the farthest system to Prism (relative to human). Since the model makes mistakes in both directions—ranks closest and farthest system both higher and lower than human—there is no evidence from this analysis that it exhibits a strong bias in favour of systems whose outputs are closer to its own. A potential explanation is that it is sufficiently far from most of the evaluated systems due to its multilingual training corpus. To verify this, we computed the average cross-BLEU for each evaluated system (relative to all others), and compared it to the same quantity for our system. Figure 3 shows that we are indeed an outlier system for most language pairs. The systems with lower cross-BLEU than Prism are mostly online or rule-based systems.555For Kazakh (kk), Prism-39 includes the WMT-15 dataset, resulting in higher cross-BLEU compared to other language pairs.
6.5 Test-set Size
| Size | Bleu | Prism |
|---|---|---|
| 100 | 0.735 | 0.720 |
| 200 | 0.783 | 0.771 |
| 400 | 0.804 | 0.784 |
| 800 | 0.828 | 0.807 |
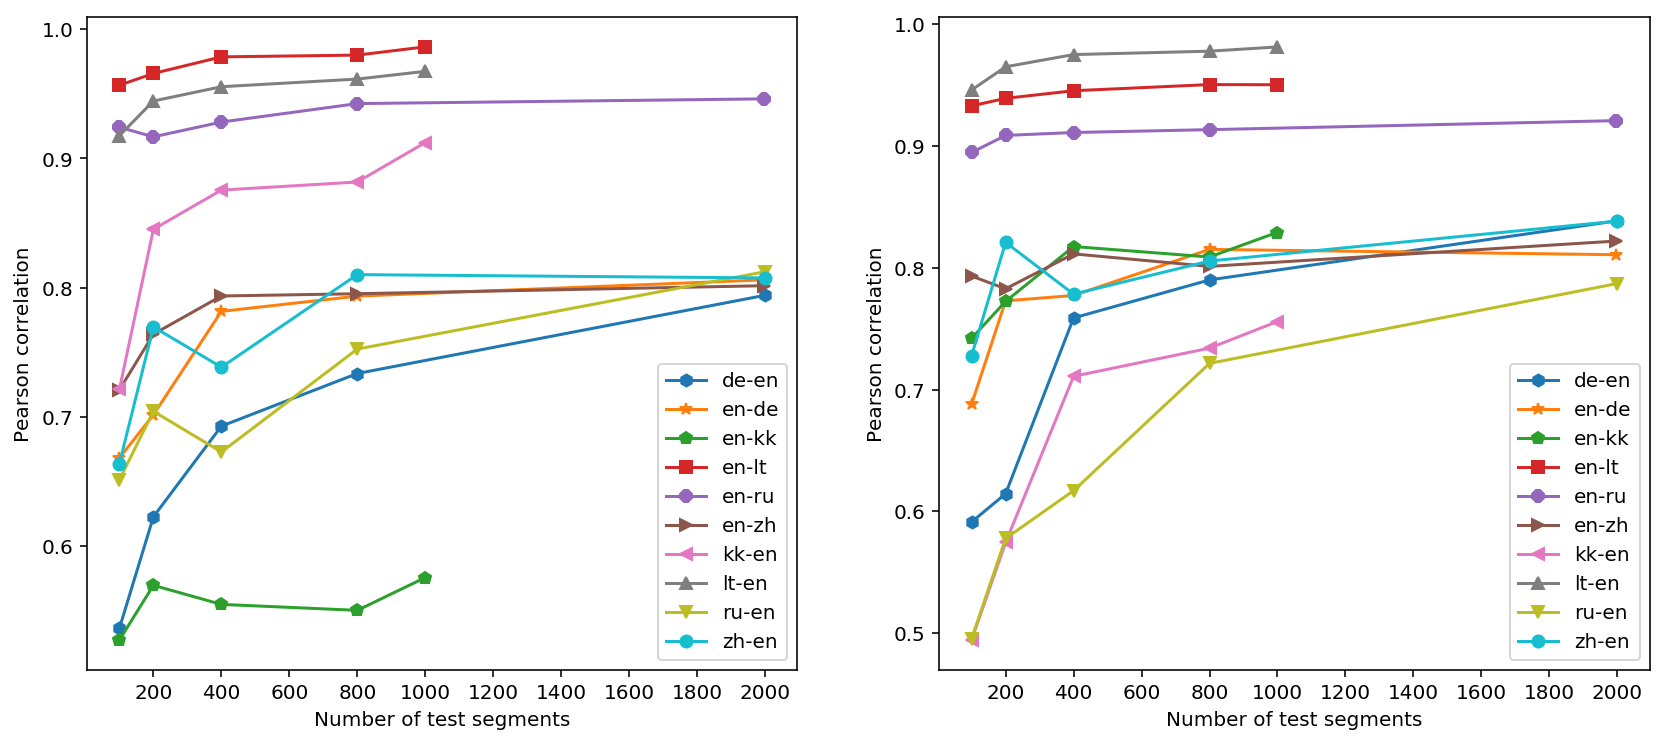
In principle, a major advantage of reference-free evaluation is that it can make use of arbitrarily large test sets, being constrained only by the amount of source-language data in the domain of interest. We hypothesize that this will improve metric performance by reducing sampling error. To test this hypothesis in the absence of larger human-scored test sets for WMT19, we sampled subsets of various sizes and measured average correlation. As shown in Table 11, we observe a steady increase with test-size size. This provides persuasive, though not definitive, evidence that test sets beyond the scale of WMT19 would yield further improvements in accuracy for both metrics, a setting that would be more feasible for Prism than BLEU. Full curves are plotted in Figure 4 (See Appendix C).
7 Conclusion
In this paper, we have shed some light on the remarkable finding by Thompson and Post (2020) that a multilingual model trained on a large (but not enormous) general-domain corpus can be highly effective as an MT metric when used to score the outputs of other MT systems in the absence of reference translations. By scaling up the model and making small adjustments to tagging and scoring, we improve over the original results and achieve approximate parity with BLEU in correlation with human judgment on WMT19 data. We argue that this metric is a useful complement to reference-based metrics—including ones that are significantly more powerful than BLEU—due to its flexibility; and we provide evidence that scoring reliability can be further improved by using larger source-side-only test sets.
We find that the major determinant of success in peer evaluation is the quality of the evaluating model. However, there is no hard requirement that it be better than the models under evaluation: surprisingly, it can correctly rank models that outperform it on average. If we abstract away from quality, performance does not appear to be highly sensitive to the domain or the multilingual versus bilingual nature of the training corpus. Taken together, these results have the important practical implication that a single multilingual system such as ours could be broadly applicable for evaluating systems in a large number of language pairs (706 in our case), at different quality levels, and across a wide range of domains. In future work, we look forward to probing these results further, and determining whether alternative architectures or loss functions might be valuable in specializing an MT model for evaluating its peers.
Acknowledgments
We thank Julia Kreutzer, Ciprian Chelba, Aditya Siddhant, and the anonymous reviewers for their helpful and constructive comments.
References
- Artetxe and Schwenk (2019) Mikel Artetxe and Holger Schwenk. 2019. Margin-based parallel corpus mining with multilingual sentence embeddings. In Proceedings of the 57th Annual Meeting of the Association for Computational Linguistics, pages 3197–3203, Florence, Italy. Association for Computational Linguistics.
- Barrault et al. (2019) Loïc Barrault, Ondřej Bojar, Marta R. Costa-jussà, Christian Federmann, Mark Fishel, Yvette Graham, Barry Haddow, Matthias Huck, Philipp Koehn, Shervin Malmasi, Christof Monz, Mathias Müller, Santanu Pal, Matt Post, and Marcos Zampieri. 2019. Findings of the 2019 conference on machine translation (WMT19). In Proceedings of the Fourth Conference on Machine Translation (Volume 2: Shared Task Papers, Day 1), pages 1–61, Florence, Italy. Association for Computational Linguistics.
- Blatz et al. (2004) John Blatz, Erin Fitzgerald, George Foster, Simona Gandrabur, Cyril Goutte, Alex Kulesza, Alberto Sanchis, and Nicola Ueffing. 2004. Confidence estimation for machine translation. In COLING 2004: Proceedings of the 20th International Conference on Computational Linguistics, pages 315–321, Geneva, Switzerland. COLING.
- Card et al. (2020) Dallas Card, Peter Henderson, Urvashi Khandelwal, Robin Jia, Kyle Mahowald, and Dan Jurafsky. 2020. With little power comes great responsibility. In Proceedings of the 2020 Conference on Empirical Methods in Natural Language Processing (EMNLP), pages 9263–9274, Online. Association for Computational Linguistics.
- Chelba et al. (2020) Ciprian Chelba, Junpei Zhou, Hideto Kazawa, Jeff Klingner, Mengmeng Niu, et al. 2020. Data troubles in sentence level confidence estimation for machine translation. arXiv preprint arXiv:2010.13856.
- Ethayarajh and Sadigh (2020) Kawin Ethayarajh and Dorsa Sadigh. 2020. BLEU neighbors: A reference-less approach to automatic evaluation. In Proceedings of the First Workshop on Evaluation and Comparison of NLP Systems, pages 40–50, Online. Association for Computational Linguistics.
- Fomicheva et al. (2020) M. Fomicheva, Shuo Sun, L. Yankovskaya, F. Blain, Francisco Guzmán, M. Fishel, Nikolaos Aletras, Vishrav Chaudhary, and Lucia Specia. 2020. Unsupervised quality estimation for neural machine translation. Transactions of the Association for Computational Linguistics, 8:539–555.
- Fonseca et al. (2019) Erick Fonseca, Lisa Yankovskaya, André F. T. Martins, Mark Fishel, and Christian Federmann. 2019. Findings of the WMT 2019 shared tasks on quality estimation. In Proceedings of the Fourth Conference on Machine Translation (Volume 3: Shared Task Papers, Day 2), pages 1–10, Florence, Italy. Association for Computational Linguistics.
- Freitag et al. (2020a) Markus Freitag, George Foster, David Grangier, and Colin Cherry. 2020a. Human-paraphrased references improve neural machine translation.
- Freitag et al. (2020b) Markus Freitag, David Grangier, and Isaac Caswell. 2020b. BLEU might be guilty but references are not innocent. In Proceedings of the 2020 Conference on Empirical Methods in Natural Language Processing (EMNLP), pages 61–71, Online. Association for Computational Linguistics.
- Gal and Ghahramani (2016) Y Gal and Z Ghahramani. 2016. Dropout as a bayesian approximation: Representing model uncertainty in deep learning. In 33rd International Conference on Machine Learning, ICML 2016, volume 3, pages 1651–1660.
- Hedges and Olkin (2014) Larry Hedges and Ingram Olkin. 2014. Statistical methods for meta-analysis. Academic press.
- Johnson et al. (2017) Melvin Johnson, Mike Schuster, Quoc V. Le, Maxim Krikun, Yonghui Wu, Zhifeng Chen, Nikhil Thorat, Fernanda Viégas, Martin Wattenberg, Greg Corrado, Macduff Hughes, and Jeffrey Dean. 2017. Google’s multilingual neural machine translation system: Enabling zero-shot translation. Transactions of the Association for Computational Linguistics, 5:339–351.
- Kudo (2018) Taku Kudo. 2018. Subword regularization: Improving neural network translation models with multiple subword candidates. In Proceedings of the 56th Annual Meeting of the Association for Computational Linguistics (Volume 1: Long Papers), pages 66–75, Melbourne, Australia. Association for Computational Linguistics.
- Lo (2019) Chi-kiu Lo. 2019. YiSi - a unified semantic MT quality evaluation and estimation metric for languages with different levels of available resources. In Proceedings of the Fourth Conference on Machine Translation (Volume 2: Shared Task Papers, Day 1), pages 507–513, Florence, Italy. Association for Computational Linguistics.
- Ma et al. (2019) Qingsong Ma, Johnny Wei, Ondřej Bojar, and Yvette Graham. 2019. Results of the WMT19 metrics shared task: Segment-level and strong MT systems pose big challenges. In Proceedings of the Fourth Conference on Machine Translation (Volume 2: Shared Task Papers, Day 1), pages 62–90, Florence, Italy. Association for Computational Linguistics.
- Mathur et al. (2020) Nitika Mathur, Timothy Baldwin, and Trevor Cohn. 2020. Tangled up in BLEU: Reevaluating the evaluation of automatic machine translation evaluation metrics. In Proceedings of the 58th Annual Meeting of the Association for Computational Linguistics, pages 4984–4997, Online. Association for Computational Linguistics.
- Mehri and Eskenazi (2020) Shikib Mehri and Maxine Eskenazi. 2020. USR: An unsupervised and reference free evaluation metric for dialog generation. In Proceedings of the 58th Annual Meeting of the Association for Computational Linguistics, pages 681–707, Online. Association for Computational Linguistics.
- Napoles et al. (2016) Courtney Napoles, Keisuke Sakaguchi, and Joel Tetreault. 2016. There’s no comparison: Reference-less evaluation metrics in grammatical error correction. In Proceedings of the 2016 Conference on Empirical Methods in Natural Language Processing, pages 2109–2115, Austin, Texas. Association for Computational Linguistics.
- Papineni et al. (2002) Kishore Papineni, Salim Roukos, Todd Ward, and Wei-Jing Zhu. 2002. Bleu: a method for automatic evaluation of machine translation. In Proceedings of the 40th Annual Meeting of the Association for Computational Linguistics, pages 311–318, Philadelphia, Pennsylvania, USA. Association for Computational Linguistics.
- Shen et al. (2019) Jonathan Shen, Patrick Nguyen, Yonghui Wu, Zhifeng Chen, Mia X Chen, Ye Jia, Anjuli Kannan, Tara Sainath, Yuan Cao, Chung-Cheng Chiu, et al. 2019. Lingvo: a modular and scalable framework for sequence-to-sequence modeling. arXiv preprint arXiv:1902.08295.
- Siddhant et al. (2020) Aditya Siddhant, Ankur Bapna, Yuan Cao, Orhan Firat, Mia Chen, Sneha Kudugunta, Naveen Arivazhagan, and Yonghui Wu. 2020. Leveraging monolingual data with self-supervision for multilingual neural machine translation. In Proceedings of the 58th Annual Meeting of the Association for Computational Linguistics, pages 2827–2835, Online. Association for Computational Linguistics.
- Sinha et al. (2020) Koustuv Sinha, Prasanna Parthasarathi, Jasmine Wang, Ryan Lowe, William L. Hamilton, and Joelle Pineau. 2020. Learning an unreferenced metric for online dialogue evaluation. In Proceedings of the 58th Annual Meeting of the Association for Computational Linguistics, pages 2430–2441, Online. Association for Computational Linguistics.
- Specia and Shah (2018) Lucia Specia and Kashif Shah. 2018. Machine Translation Quality Estimation: Applications and Future Perspectives. Springer International Publishing, Cham.
- Thompson and Post (2020) Brian Thompson and Matt Post. 2020. Automatic machine translation evaluation in many languages via zero-shot paraphrasing. In Proceedings of the 2020 Conference on Empirical Methods in Natural Language Processing (EMNLP), pages 90–121, Online. Association for Computational Linguistics.
- Toral (2020) Antonio Toral. 2020. Reassessing claims of human parity and super-human performance in machine translation at WMT 2019. In Proceedings of the 22nd Annual Conference of the European Association for Machine Translation, pages 185–194, Lisboa, Portugal. European Association for Machine Translation.
- Williams (1959) Evan James Williams. 1959. Regression Analysis, volume 14. Wiley, New York.
- Yang et al. (2019) Yinfei Yang, Gustavo Hernandez Abrego, Steve Yuan, Mandy Guo, Qinlan Shen, Daniel Cer, Yun-hsuan Sung, Brian Strope, and Ray Kurzweil. 2019. Improving multilingual sentence embedding using bi-directional dual encoder with additive margin softmax. In Proceedings of the Twenty-Eighth International Joint Conference on Artificial Intelligence, IJCAI-19, pages 5370–5378. International Joint Conferences on Artificial Intelligence Organization.
- Yankovskaya et al. (2019) Elizaveta Yankovskaya, Andre Tättar, and Mark Fishel. 2019. Quality estimation and translation metrics via pre-trained word and sentence embeddings. In Proceedings of the Fourth Conference on Machine Translation (Volume 3: Shared Task Papers, Day 2), pages 101–105, Florence, Italy. Association for Computational Linguistics.
- Yu et al. (2016) Lei Yu, Phil Blunsom, Chris Dyer, Edward Grefenstette, and Tomas Kocisky. 2016. The neural noisy channel. arXiv preprint arXiv:1611.02554.
- Zhang et al. (2020) Boliang Zhang, Ajay Nagesh, and Kevin Knight. 2020. Parallel corpus filtering via pre-trained language models. In Proceedings of the 58th Annual Meeting of the Association for Computational Linguistics, pages 8545–8554, Online. Association for Computational Linguistics.
- Zhao et al. (2020) Wei Zhao, Goran Glavaš, Maxime Peyrard, Yang Gao, Robert West, and Steffen Eger. 2020. On the limitations of cross-lingual encoders as exposed by reference-free machine translation evaluation. In Proceedings of the 58th Annual Meeting of the Association for Computational Linguistics, pages 1656–1671, Online. Association for Computational Linguistics.
- Zhao et al. (2019) Wei Zhao, Maxime Peyrard, Fei Liu, Yang Gao, Christian M. Meyer, and Steffen Eger. 2019. MoverScore: Text generation evaluating with contextualized embeddings and earth mover distance. In Proceedings of the 2019 Conference on Empirical Methods in Natural Language Processing and the 9th International Joint Conference on Natural Language Processing (EMNLP-IJCNLP), pages 563–578, Hong Kong, China. Association for Computational Linguistics.
Appendix A Outlier Systems
| lang | Outliers |
|---|---|
| de-cs | CAiRE.6949 |
| de-en | online-X.0 |
| de-fr | - |
| en-cs | - |
| en-de | online-X.0, en_de_task.6790 |
| en-fi | apertium-fin-eng-unconstrained-en-fi.6448 |
| en-gu | - |
| en-kk | NICT.6550, DBMS-KU_ENKK.6730 |
| en-lt | - |
| en-ru | NICT.6563 |
| en-zh | - |
| fi-en | - |
| fr-de | MSRA.MADL.6893, eTranslation.6262, online-X.0 |
| gu-en | Ju_Saarland.6525 |
| kk-en | UMD.6736, DBMS-KU_KKEN.6726 |
| lt-en | online-X.0 |
| ru-en | NICT.6561 |
| zh-en | online-X.0, Apprentice-c.6706 |
Appendix B WMT 2019 System-Level results for all language pairs
| Metric | Avg | en-cs | en-de | en-fi | en-gu | en-kk | en-lt | en-ru | en-zh |
|---|---|---|---|---|---|---|---|---|---|
| BLEU | 0.911 | 0.994 | 0.806 | 0.939 | 0.737 | 0.575 | 0.986 | 0.946 | 0.802 |
| CHRF | 0.933 | 0.983 | 0.871 | 0.964 | 0.843 | 0.829 | 0.969 | 0.989 | 0.799 |
| UNI+ | 0.808 | - | - | - | - | - | - | 0.746 | - |
| Yisi-2 | 0.487 | 0.324 | - | 0.478 | 0.314 | 0.685 | 0.055 | 0.134 | -0.097 |
| Prism | 0.861 | 0.865 | 0.754 | 0.858 | 0.444 | 0.789 | 0.908 | 0.903 | 0.793 |
| Prism-trg2xx | 0.853 | 0.867 | 0.717 | 0.876 | 0.365 | 0.811 | 0.936 | 0.902 | 0.778 |
| Prism-src2xx | 0.858 | 0.871 | 0.730 | 0.878 | 0.400 | 0.813 | 0.939 | 0.901 | 0.789 |
| Metric | de-en | fi-en | gu-en | kk-en | lt-en | ru-en | zh-en | de-cs | de-fr | fr-de |
| BLEU | 0.794 | 0.985 | 0.975 | 0.912 | 0.967 | 0.812 | 0.808 | 0.743 | 0.891 | 0.846 |
| CHRF | 0.852 | 0.991 | 0.946 | 0.836 | 0.930 | 0.877 | 0.831 | 0.981 | 0.957 | 0.833 |
| UNI+ | 0.805 | 0.924 | - | - | - | 0.669 | - | - | - | - |
| Yisi-2 | 0.612 | 0.642 | 0.820 | 0.662 | 0.346 | 0.708 | 0.622 | 0.122 | 0.721 | 0.62 |
| Prism | 0.829 | 0.941 | 0.915 | 0.724 | 0.985 | 0.769 | 0.826 | 0.987 | 0.889 | 0.269 |
| Prism-trg2xx | 0.798 | 0.943 | 0.911 | 0.683 | 0.979 | 0.752 | 0.830 | 0.989 | 0.882 | 0.212 |
| Prism-src2xx | 0.796 | 0.942 | 0.893 | 0.709 | 0.978 | 0.739 | 0.828 | 0.991 | 0.882 | 0.203 |
| Data | Avg | en-cs | en-de | en-fi | en-gu | en-kk | en-lt | en-ru | en-zh |
|---|---|---|---|---|---|---|---|---|---|
| Prism-39 | 0.858 | 0.871 | 0.730 | 0.878 | 0.400 | 0.813 | 0.939 | 0.901 | 0.789 |
| WMT-15 | 0.840 | 0.825 | 0.530 | 0.815 | 0.423 | 0.909 | 0.914 | 0.845 | 0.774 |
| Prism-13 | 0.863 | 0.869 | 0.779 | 0.891 | 0.379 | 0.820 | 0.925 | 0.901 | 0.795 |
| Prism-39 + WMT-15 | 0.867 | 0.862 | 0.653 | 0.854 | 0.446 | 0.860 | 0.932 | 0.880 | 0.789 |
| Adding monolingual data | |||||||||
| Prism-39 + Wiki-39 | 0.832 | 0.839 | 0.649 | 0.854 | 0.446 | 0.823 | 0.917 | 0.877 | 0.757 |
| WMT-15 + WMT-15-Mono | 0.869 | 0.855 | 0.646 | 0.826 | 0.848 | 0.913 | 0.940 | 0.867 | 0.793 |
| Prism-39 + WMT-15-Mono | 0.851 | 0.869 | 0.766 | 0.871 | 0.487 | 0.850 | 0.945 | 0.892 | 0.754 |
| Bilingual Models | 0.726 | 0.695 | 0.867 | 0.769 |
| Data | de-en | fi-en | gu-en | kk-en | lt-en | ru-en | zh-en | de-cs | de-fr | fr-de |
| Prism-39 | 0.796 | 0.942 | 0.893 | 0.709 | 0.978 | 0.739 | 0.828 | 0.991 | 0.882 | 0.203 |
| WMT-15 | 0.815 | 0.954 | 0.918 | 0.509 | 0.986 | 0.841 | 0.835 | 0.970 | 0.851 | 0.116 |
| Prism-13 | 0.845 | 0.943 | 0.911 | 0.745 | 0.983 | 0.749 | 0.836 | 0.985 | 0.863 | 0.124 |
| Prism-39 + WMT-15 | 0.802 | 0.950 | 0.921 | 0.734 | 0.986 | 0.851 | 0.810 | 0.993 | 0.881 | 0.170 |
| Adding monolingual data | ||||||||||
| Prism-39 + Wiki-39 | 0.742 | 0.934 | 0.907 | 0.684 | 0.975 | 0.680 | 0.836 | 0.982 | 0.822 | 0.117 |
| WMT-15 + WMT-15-Mono | 0.842 | 0.956 | 0.976 | 0.584 | 0.987 | 0.838 | 0.824 | 0.903 | 0.890 | 0.238 |
| Prism-39 + WMT-15-Mono | 0.803 | 0.944 | 0.952 | 0.680 | 0.952 | 0.722 | 0.754 | 0.972 | 0.875 | 0.233 |
| Bilingual Models | 0.801 | 0.862 | 0.650 | 0.826 |
| Metric | Avg | en-cs | en-de | en-fi | en-gu | en-kk | en-lt | en-ru | en-zh |
|---|---|---|---|---|---|---|---|---|---|
| BLEU | 0.911 | 0.994 | 0.806 | 0.939 | 0.737 | 0.575 | 0.986 | 0.946 | 0.802 |
| Big | 0.808 | 0.791 | 0.541 | 0.833 | 0.381 | 0.785 | 0.898 | 0.861 | 0.698 |
| Prism | 0.858 | 0.871 | 0.730 | 0.878 | 0.400 | 0.813 | 0.939 | 0.901 | 0.789 |
| Massive | 0.883 | 0.900 | 0.819 | 0.899 | 0.423 | 0.820 | 0.953 | 0.923 | 0.819 |
| Metric | de-en | fi-en | gu-en | kk-en | lt-en | ru-en | zh-en | de-cs | de-fr | fr-de |
|---|---|---|---|---|---|---|---|---|---|---|
| BLEU | 0.794 | 0.985 | 0.975 | 0.912 | 0.967 | 0.812 | 0.808 | 0.743 | 0.891 | 0.846 |
| Big | 0.702 | 0.926 | 0.891 | 0.649 | 0.970 | 0.640 | 0.819 | 0.989 | 0.827 | 0.040 |
| Prism | 0.796 | 0.942 | 0.893 | 0.709 | 0.978 | 0.739 | 0.828 | 0.991 | 0.882 | 0.203 |
| Massive | 0.840 | 0.948 | 0.906 | 0.751 | 0.981 | 0.789 | 0.834 | 0.991 | 0.906 | 0.301 |
| Aggregation Method | Avg | en-cs | en-de | en-fi | en-gu | en-kk | en-lt | en-ru | en-zh |
|---|---|---|---|---|---|---|---|---|---|
| Mean | 0.883 | 0.900 | 0.819 | 0.899 | 0.423 | 0.820 | 0.953 | 0.923 | 0.819 |
| Std-dev | 0.882 | 0.913 | 0.778 | 0.900 | 0.448 | 0.755 | 0.950 | 0.929 | 0.780 |
| Median | 0.870 | 0.849 | 0.868 | 0.884 | 0.408 | 0.862 | 0.945 | 0.908 | 0.849 |
| Min | 0.872 | 0.925 | 0.765 | 0.907 | 0.489 | 0.623 | 0.945 | 0.939 | 0.722 |
| MC-dropout (Mean) | 0.877 | 0.936 | 0.826 | 0.904 | 0.432 | 0.699 | 0.929 | 0.940 | 0.881 |
| MC-dropout (Std-dev) | 0.855 | 0.890 | 0.800 | 0.894 | 0.417 | 0.809 | 0.947 | 0.920 | 0.803 |
| SP-Norm (Mean) | 0.884 | 0.903 | 0.814 | 0.895 | 0.407 | 0.872 | 0.949 | 0.921 | 0.839 |
| Confidence threshold | 0.886 | 0.941 | 0.828 | 0.966 | 0.569 | 0.696 | 0.987 | 0.940 | 0.774 |
| Aggregation Method | de-en | fi-en | gu-en | kk-en | lt-en | ru-en | zh-en | de-cs | de-fr | fr-de |
| Mean | 0.840 | 0.948 | 0.906 | 0.751 | 0.981 | 0.789 | 0.834 | 0.991 | 0.906 | 0.301 |
| Std-dev | 0.831 | 0.970 | 0.946 | 0.712 | 0.987 | 0.769 | 0.809 | 0.989 | 0.907 | 0.276 |
| Median | 0.851 | 0.895 | 0.885 | 0.761 | 0.970 | 0.788 | 0.870 | 0.973 | 0.888 | 0.341 |
| Min | 0.829 | 0.973 | 0.902 | 0.644 | 0.990 | 0.757 | 0.794 | 0.978 | 0.900 | 0.280 |
| MC-dropout (Mean) | 0.813 | 0.956 | 0.485 | 0.189 | 0.941 | 0.834 | 0.821 | 0.974 | 0.923 | 0.330 |
| MC-dropout (Std-dev) | 0.837 | 0.946 | 0.903 | 0.743 | 0.981 | 0.786 | 0.837 | 0.992 | 0.901 | 0.286 |
| SP-Norm (Mean) | 0.834 | 0.948 | 0.902 | 0.795 | 0.980 | 0.801 | 0.833 | 0.990 | 0.906 | 0.318 |
| Confidence threshold | 0.823 | 0.930 | 0.906 | 0.670 | 0.970 | 0.716 | 0.765 | 0.971 | 0.935 | 0.386 |
Appendix C Correlation versus test-set size