Discovery of the most X-ray luminous quasar SRGE J170245.3+130104 at redshift z
Abstract
SRGE J170245.3+130104 was discovered by the eROSITA telescope aboard the SRG space observatory on March 13-15, 2020 during the first half-year scan of its all-sky X-ray survey. The optical counterpart of the X-ray source was photometrically identified as a distant quasar candidate at . Follow-up spectroscopic observations, done in August/September 2020 with the SCORPIO-II instrument at the BTA 6-m telescope, confirmed that SRGE J170245.3+130104 is a distant quasar at redshift . The X-ray luminosity of the quasar during the first half-year scan of the eROSITA all-sky survey was erg/s (in the 2–10 keV energy range), whereas its X-ray spectrum could be described by a power law with a slope of . Six months later (September 13–14, 2020), during the second half-year scan of the eROSITA all-sky survey, the quasar was detected again and its X-ray luminosity had decreased by a factor of 2 (at the confidence level). SRGE J170245.3+130104 proves to be the most X-ray luminous among all known X-ray quasars at . It is also one of the radio-loudest distant quasars (with radio-loudness ), which may imply that it is a blazar. In the Appendix, we present the list of all quasars detected in X-rays to date.
keywords:
quasars, X-rays, sky surveys, photo-z, spectroscopy, BTA, eROSITA.2021473155[173] \submittedDecember 15, 2020
1 Introduction
Launched July 13, 2019, the SRG X-ray observatory (Sunyaev et al., 2021; Predehl et al., 2020) is orbiting around Lagrangian point L2 of the Earth-Sun system. The main purpose of the observatory is the four-year X-ray All-Sky Survey over a wide range of energies 0.2–30 keV. In the course of the sky survey it is expected to discover with the SRG/eROSITA telescope (Predehl et al., 2020) about three million active galactic nuclei (AGNs), including distant quasars (Kolodzig et al., 2012, 2013), about 100,000 galaxy clusters and groups, and few X-ray sources of various nature in our Milky Way Galaxy. After four year of operation, the SRG All-Sky Survey is expected to be about 25 times more sensitive in the soft X-ray band (0.5-2 keV) than the previous X-ray survey conducted by the ROSAT (Trümper, 1982) satellite in the early 1990s, and will help to solve a number of important problems in modern astrophysics and cosmology. One of the main aims of the SRG/eRosita survey is to search unique objects, whose spectral characteristics are outstanding among astronomical sources of their class. In particular, the detection and detailed study of extremely bright quasars will shed light on the growth history of the most massive black holes in the Universe.
In June 2020, the SRG observatory completed first half-year scan of X-ray All-Sky Survey. For all new X-ray sources discovered with the eROSITA telescope, most probable optical counterparts were identified by SRGz machine learning system (Meshcheryakov, 2021). This software automatically searches and classifies the most probable optical counterparts of extragalactic X-ray sources, and estimates their photometric redshifts based on data from optical and infrared sky surveys. The SRGz system was created in the Science Working Group of RU eROSITA consortium on X-ray source detection, identification and eROSITA source catalog.
The high performance of SRGz predictions was confirmed by a set of follow-up spectroscopic bservations of SRGz candidates: distant quasars at and quasars at lower redshifts from deep X-ray survey of the Lockman Hole extragalactic field (observed by eROSITA during the Performance Verification phase) and from the first scan of eROSITA All-Sky Survey. The optical spectra of the candidates were obtained on AZT-33IK 1.6-m telescope of the Sayan Observatory (Khorunzhev et al., 2020), Russian-Turkish 1.5-m telescope (RTT-150, Bikmaev et al. 2020) and 2.5-m KGO telescope of the Lomonosov Moscow State University (Dodin et al., 2020).
Of particular interest are bright in X-rays (with luminosity erg/s in the 2–10 keV energy range) and distant () quasars, which are rarely found in deep X-ray surveys of small area and were not be detected in previous X-ray All-Sky Survey conducted by ROSAT observatory (because of its insufficient depth). Already at the very beginning scans of the X-rya survey, SRG observatory managed to find a unique distant quasar CFHQS J142952+544717 = SRGE J142952.1+544716, which happened to be the brightest in X-rays among known quasars at (Medvedev et al., 2020).
The Science Working Group of RU eROSITA consortium for Active Galactic Nuclei Studies has created a separate observational program called111Name ’daleqo’ was invented by V.D.Borisov, from Russian it translates as ’far away’ DaLeQo (Distant and Luminous eROSITA Quasi-stellar objects, Khorunzhev et al., 2021) dedicated to spectroscopy of SRGz candidates for distant () and bright ( erg/s) X-ray quasars. This paper describes the discovery of the most outstanding (so far) object found in the DaLeQoprogram — the brightest X-ray and Radio distant quasar SRGE J170245.3+130104 at , identified by spectral observations on the 6th BTA optical telescope.
In the paper the following cosmological parameters were adopted (for calculation of luminosities): =69.6 km/s/Mpc =0.286 (Bennett et al., 2018).
2 X-ray data
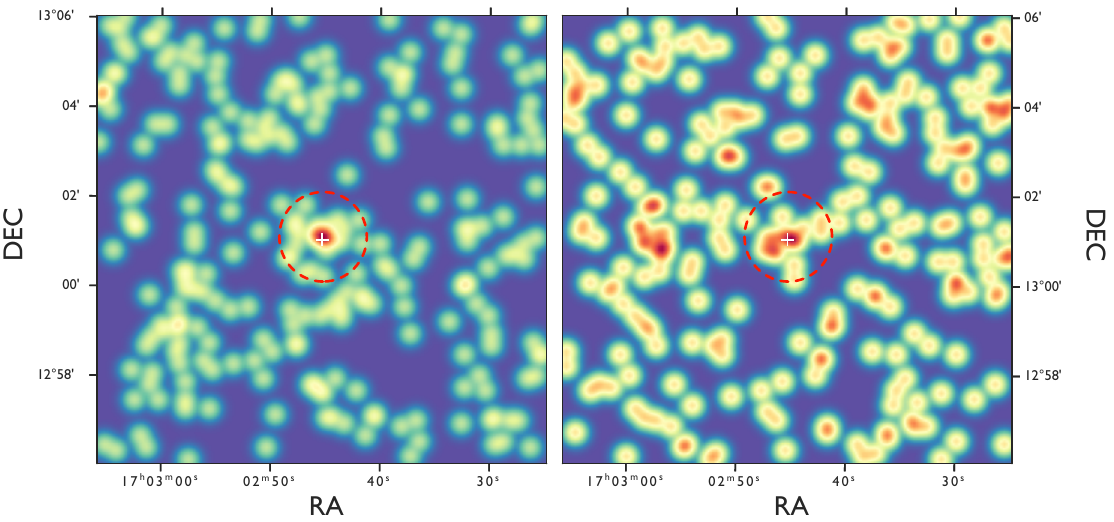
The SRGE J170245.3+130104 source was discovered by eROSITA telescope during the first half-year scan of the X-ray All-Sky Survey, the position of the source was scanned nine times between March 13 and 15, 2020. The total time the source was scanned with the eROSITA telescope was 256 s. The source was found in the energy range 0.3–2.2 keV at coordinates RA deg, DEC deg with localization accuracy of arcsec (95%). In the 0.3–2.2 keV energy range 30 counts were recorded inside a 60 arcsec radius circle (centered on the X-ray source position), with an expected background counts of 7.4. Approximation of the counts distribution in the source vicinity by the point spread function model gives a statistical significance of source detection .
In the second half-year scan of the X-ray All-Sky Survey, the position of the source was observed by the SRG observatory from September 13 to 14, 2020. The total exposure time was 268 s, during which only 18 counts in the 0.3–2.2 keV energy range were obtained within 60 arcsec aperture. 18 counts with 7.3 expected background counts give detection significance (see Figure 1). The position of the source from the second scan appeared to be consistent (within uncertainty) with the coordinates measured in the first scan.
The primary processing of data from the eROSITA telescope was carried out by software developed at IKI RAS by using components of the eSASS system (Max Planck Institute for Extraterrestrial Physics, Germany). The X-ray photon map of the region centered at the source is shown in Fig. 1. The source spectrum was extracted from a circular aperture with a 35 arcsec radius. Background spectrum was estimated in a ring centered at the source with inner and outer radii of 85 and 435 arcsec, respectively. Other sources detected in 1+2 scans data and falling inside the background region were masked out using a circular aperture with a radius of 40 arcsec. The obtained spectra were approximated by using the standard tools of the XSPEC (version 12.11, Arnaud, 1996) software package, using C-statistics (Cash, 1979) modified for data with a Poisson background (the so-called W-statistics, see the XSPEC documentation for details222https://heasarc.gsfc.nasa.gov/xanadu/xspec/manual). The energy channels of the spectra were grouped so that the number of counts in each channel was at least one. This procedure was performed using a standard grouppha333https://heasarc.gsfc.nasa.gov/ftools tool.
| Model | Parameter | Value | C-stat/d.o.f | goodness | AIC |
|---|---|---|---|---|---|
| cm-2 | |||||
| tbabs*cflux*pow | erg cm-2 sec-1 | 23.18/17 | 53.9% | 27.18 | |
| cm-2 | |||||
| erg cm-2 sec-1 | |||||
| tbabs*cflux*zphabs*pow | cm-2 | 14.95/16 | 8.8% | 20.95 | |
| cm-2 | |||||
| erg cm-2 sec-1 | |||||
| tbabs*cflux*(zedge*pow | 19.98/15 | 51.8% | 27.98 | ||
| + zgauss) | 670 eV | ||||
| 10 eV |
∗ The parameter is fixed.
| OBJID SDSS | RAopt | DECopt | sep | ||||
|---|---|---|---|---|---|---|---|
| 1237665106509826046 | 1.4 | 22.04 | QSO | 5.486 | 0.84 |
Spectral analysis of the data was performed in the energy range of 0.3–5 keV. Only data from the first half-year scan were used to fit the X-ray spectrum, since the number of counts in the second scan is not sufficient for a meaningful spectral analysis. A joint analysis of the data from the two 1+2 scans was not performed due to the possible variability of the source spectrum.
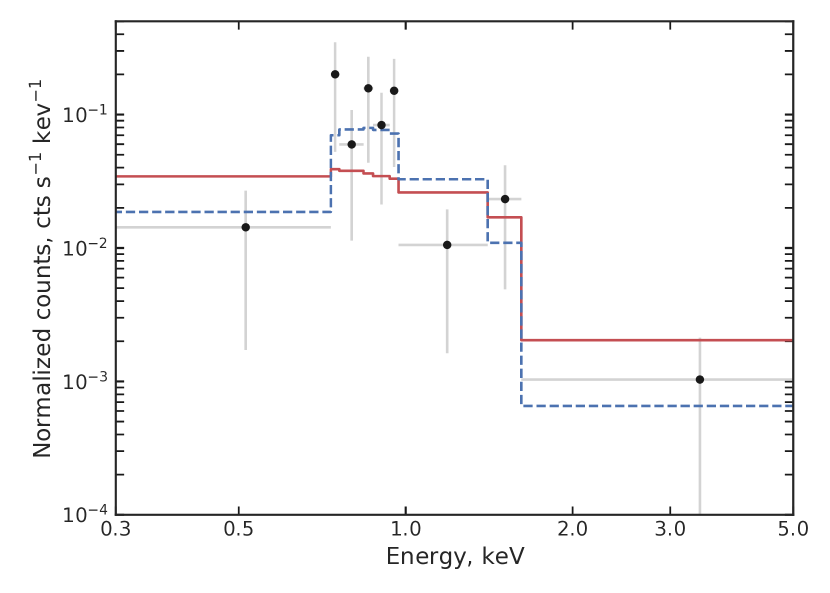
We used simple absorbed power law spectral model to fit data. The hydrogen column density was fixed to the Galactic absorption value according to HI4PI (HI4PI Collaboration et al., 2016) maps: cm-2. The derived parameters of the best fit model are given in Table 1, model spectrum is shown in Figure 2 with the red line. As can be seen from Table 1, derived ”goodness of the fit” value indicates that the proposed model adequately describes the data.
Relatively small number of source counts recorded from SRGE J170245.3+130104 does not allow one to investigate in detail a more complex spectral models. Nevertheless, we applied two more models to the data, taking into account possible internal absorption and spectral features associated with reflected component in the quasar spectrum.
Firstly, we added multiplicative intrinsic absorption component (in the quasar rest frame with a free absorption parameter) to the basic absorbed power law spectral model. Such a modification of the model (shown as blue dashed line in Fig. 2) leads to a noticeable decrease (as compared to the basic model) both in the value of -statistics (-stat at d.o.f.) and in the information criterion value (Akaike, 1974). However, such a model requires large and apparently unrealistic absorption and photon spectral index values: cm-2, , although determined with large statistical errors. Therefore, our analysis does not allow us to make an unambiguous conclusion about the presence of internal absorption in the source.
We studied possible contributions to the source spectrum from reflected emission — from a neutral optically thick medium (e.g., accretion disk or molecular torus). We added to the basic power law model the Fe fluorescence line at an energy of 6.4 keV and Fe K-edge absorption at an energy of 7.1 keV (in the quasar rest frame). The resulting best fit model formally describes data somewhat better (-stat) than a simple power law model, but from small difference in AIC (see Table 1) one can conclude that data does not provide sufficient information to justify this complication of the model. Thus, more accurate conclusions regarding the shape or presence of any features in the spectrum SRGE J170245.3+130104 require X-ray data with a higher signal-to-noise ratio.
In order to calculate internal (unabsorbed) X-ray luminosity of SRGE J170245.3+130104 we used a basic power law model described above, i.e., we corrected for absorption in the Galaxy’s interstellar medium. We obtained unabsorbed X-ray luminosity of the source erg/c in the 2–10 keV energy range (in the quasar rest frame).
In the second half-year scan of eROSITA All-Sky Survey source counts were decreased by a factor of 2. More precisely, the 0.3–2.2 keV countrate drop by a factor of (with statistical confidence ). By using the basic spectral model shape from the first eROSITA scan data fit, one can estimate X-ray flux and luminosity (in the 2–10 keV energy range) in the second eROSITA scan as erg/s/cm2 and erg/s2, respectively.
3 Selection of distant X-ray quasars candidates
We made a cross-match of SRG/eROSITA sources from the first half-year X-ray scan at 10 arcsec radius (corresponds to median 98% localization error of X-ray sources) with photometric catalogs from three optical surveys: DESI Legacy Imaging Survey DR8 (DESI LIS, Dey et al. 2019), PanSTARRS1 DR2 (Chambers et al., 2016), SDSS DR14 (Abolfathi et al., 2018). We used WISE (Lang, 2016) forced infrared photometry measurements from the DESI LIS catalog.
Optical data from different optical catalogs were combined into a master photometric catalog by performing a cross-match of all optical sources within a 1” radius, photometric measurements with the highest signal-to-noise ratio were selected separately in each filter. Further, the eROSITA X-ray sources with more than one optical object in DESI LIS (within the selected radius) were excluded from consideration.
The resulting list of optical candidates was processed by the SRGz system, which operates over the entire Eastern Galactic hemisphere region of the eROSITA X-ray survey and automatically analyzes photometry and positions of optical objects in the X-ray sources vicinity. SRGz use tree-based machine learning algorithms (Gradient Boosting and Random Forest, see Meshcheryakov et al., 2018), which are trained on samples of quasars, galaxies, and stars from the SDSS spectroscopic catalog, sample of distant quasars (Ross & Cross, 2020) and sample of GAIA DR2 stars associated with 3XMM DR8 sources. For more details on the principles of operation of SRGz and the algorithms implemented in it see Meshcheryakov (2021).
Based on the SRGz predictions, we selected optical candidates with the photometric class ”quasar” and photometric redshift measured with high confidence (calculated for each object from the full conditional probability distribution as the integral in the neighborhood of photo-z point estimate ).
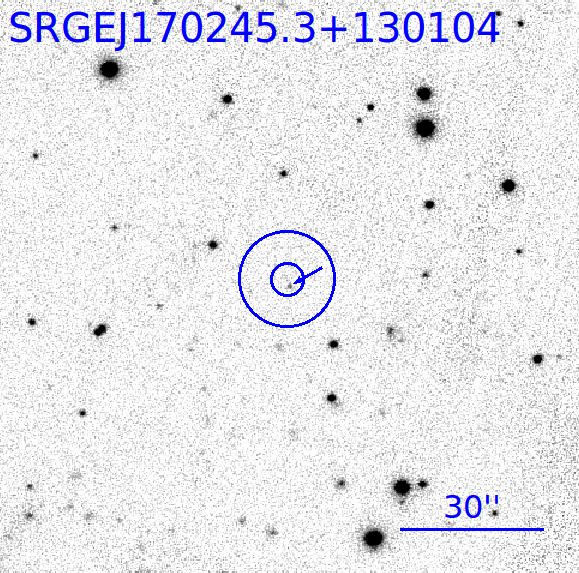
The X-ray source SRGE J170245.3+130104 and its associated optical companion (see Table LABEL:tab:optsample) were selected by SRGz system as the most reliable candidate for a distant X-ray quasar at . SRGE J170245.3+130104 has single optical source within 95% X-ray localization radius, located 1”.5 from X-ray source coordinates. At Figure 4 we show -band archival image of SRGE J170245.3+130104 region from Pan-STARRS survey.
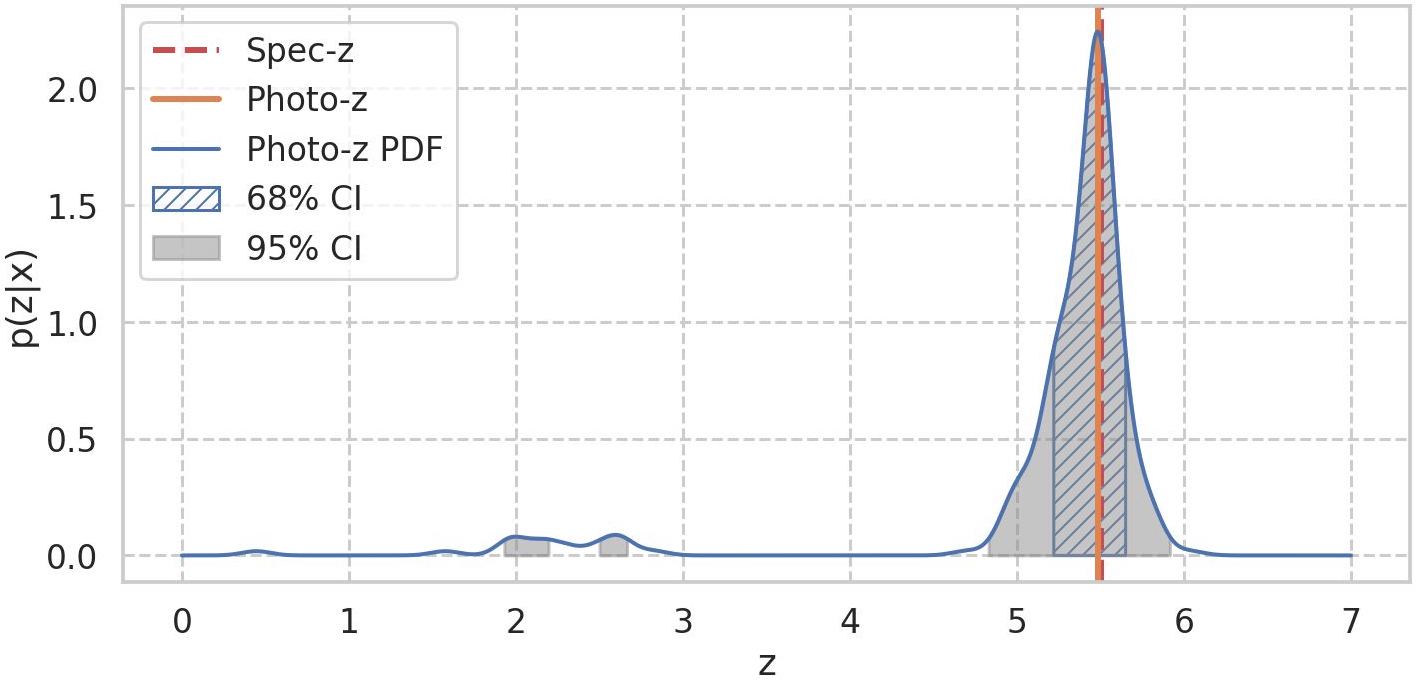
At Figure 3 we show a full probability density function predicted for optical companion of X-ray source SRGE J170245.3+130104, confidence intervals with 68% and 95% significance levels (shaded areas), point photo-z prediction (solid vertical line), and the spectral redshift measured at the BTA telescope (dashed vertical line). The conditional probability density function shows a sharp peak at . The spectral measurement of quasar redshift (see below) agrees perfectly with the photometric estimate obtained by the SRGz system.
Note that the optical companion of SRGE J170245.3+130104 has not been identified previously in the literature as a quasar candidate. The optical source has a radio companion in the NVSS survey at 1.4 GHz. (Condon et al., 1998).
4 BTA observations
The distant X-ray quasar photometric candidate was included in the observational program of the 6-m telescope BTA.
Observations at BTA were conducted with the SCORPIO-2 spectrograph (Afanasiev, Moiseev, 2011; Afanasiev, Amirkhanyan, 2012) in August and September 2020 (see Table 3) in the dark time (moon phase less than 0.3) and at mean atmosphere seeing less than 2 arcsec. A slit width of 2 arcsec was used. Technical specifications of the SCORPIO-2 spectrograph are described in the user manual.
Spectra were processed using standard IRAF444http://iraf.noao.edu mathematical software. The spectral shape was corrected by using observations of spectrophotometric standards from the Massey et al. (1988) list.
In August 2020, the first spectrum of the source was obtained, in which a broad line with a characteristic break was clearly seen, associated with absorption on neutral hydrogen (Fig. 5). There are no other emission lines typical for quasars (such as CIV 1549Å) in the spectrum. Sky background lines interfere, and it would take time by a factor of 2 longer to get spectrum of better quality with the VPHG1200@860 grating. The line, from which the source redshift could be more accurately determined, does not fall within the operating range of the VPHG1200@860 grating. In September 2020, we repeated spectral observations with the VPHG1026@735 grating, the Lyman-alpha forest can be clearly seen (Fig. 5). Unfortunately, the line is very wide, and its peak is in the absorption.
| Date | Grating | Exposure time, sec | S/N |
|---|---|---|---|
| 2020/08/17 | VPHG1200@860 | 2x1200 | 3 |
| 2020/09/13 | VPHG1026@735 | 5x1200 | 4 |
Note. Date — date of the observation beginning, Grating — name of the dispersing element, S/N — average signal-to-noise ratio in the spectrum.
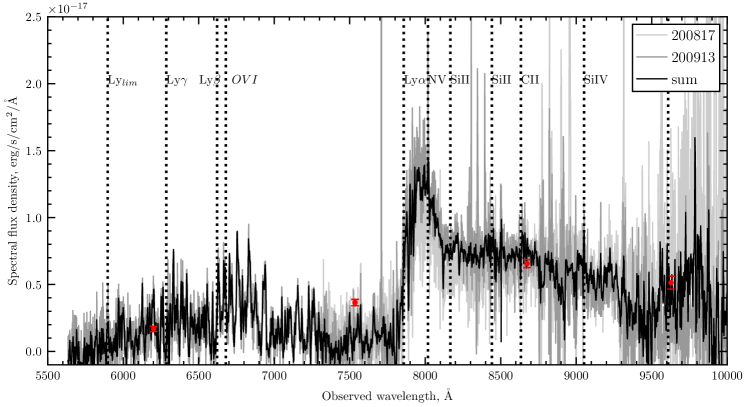
According to the results of observations in August and September 2020, the combined spectrum of the quasar SRGE J170245.3+130104 was obtained (shown at Fig. reffig:qsospec). This spectrum is similar to the spectra of distant radio-luminosity quasars (Romani et al., 2004; Bañados et al., 2018; Belladitta et al., 2020). Broad emission lines (with exception of ) do not dominate the continuum.
There are no narrow emission lines seen in the spectrum of the quasar, which could be used to determine the spectroscopic redshift with higher accuracy. Therefore, the redshift of the source was determined by fitting a template of the mean spectrum of the quasar Vanden Berk et al. (2001). The systematic redshift error is and is caused by differences between the source spectrum and the template. The obtained spec-z value is in excellent agreement with the photometric redshift estimate obtained by SRGz.
In the quasar spectrum a prominent narrow absorption line feature at a wavelength of 8119 Åcan be seen. Assuming that this is the SiII(1263Å) line, the other minima of the spectrum (with insufficient detection significance) will agree with the narrow absorption lines (, NV, SiII, SiIV) placed at . Note that in the spectrum of another radio-loud quasar PSO J352.403415.3373 at a complex of narrow absorption lines at (Bañados et al., 2018) was also detected.
5 Spectral Energy Distribution
With measured spectoscopic redshift of the quasar SRGE J170245.3+130104, now we can investigate its spectral energy distribution (SED). We used the following data to construct the SED: Radio — TGSS (Intema et al., 2017), NVSS (Condon et al., 1998), VLASS (Gordon et al., 2020), IR — WISE (Wright et al., 2010; Dey et al., 2019; Lang, 2016), Optical — DESI Legacy Imaging Surveys DR8 (DESI LIS, Dey et al. (2019)), Pan-STARRS PS1 DR2 stacked (Chambers et al., 2016).
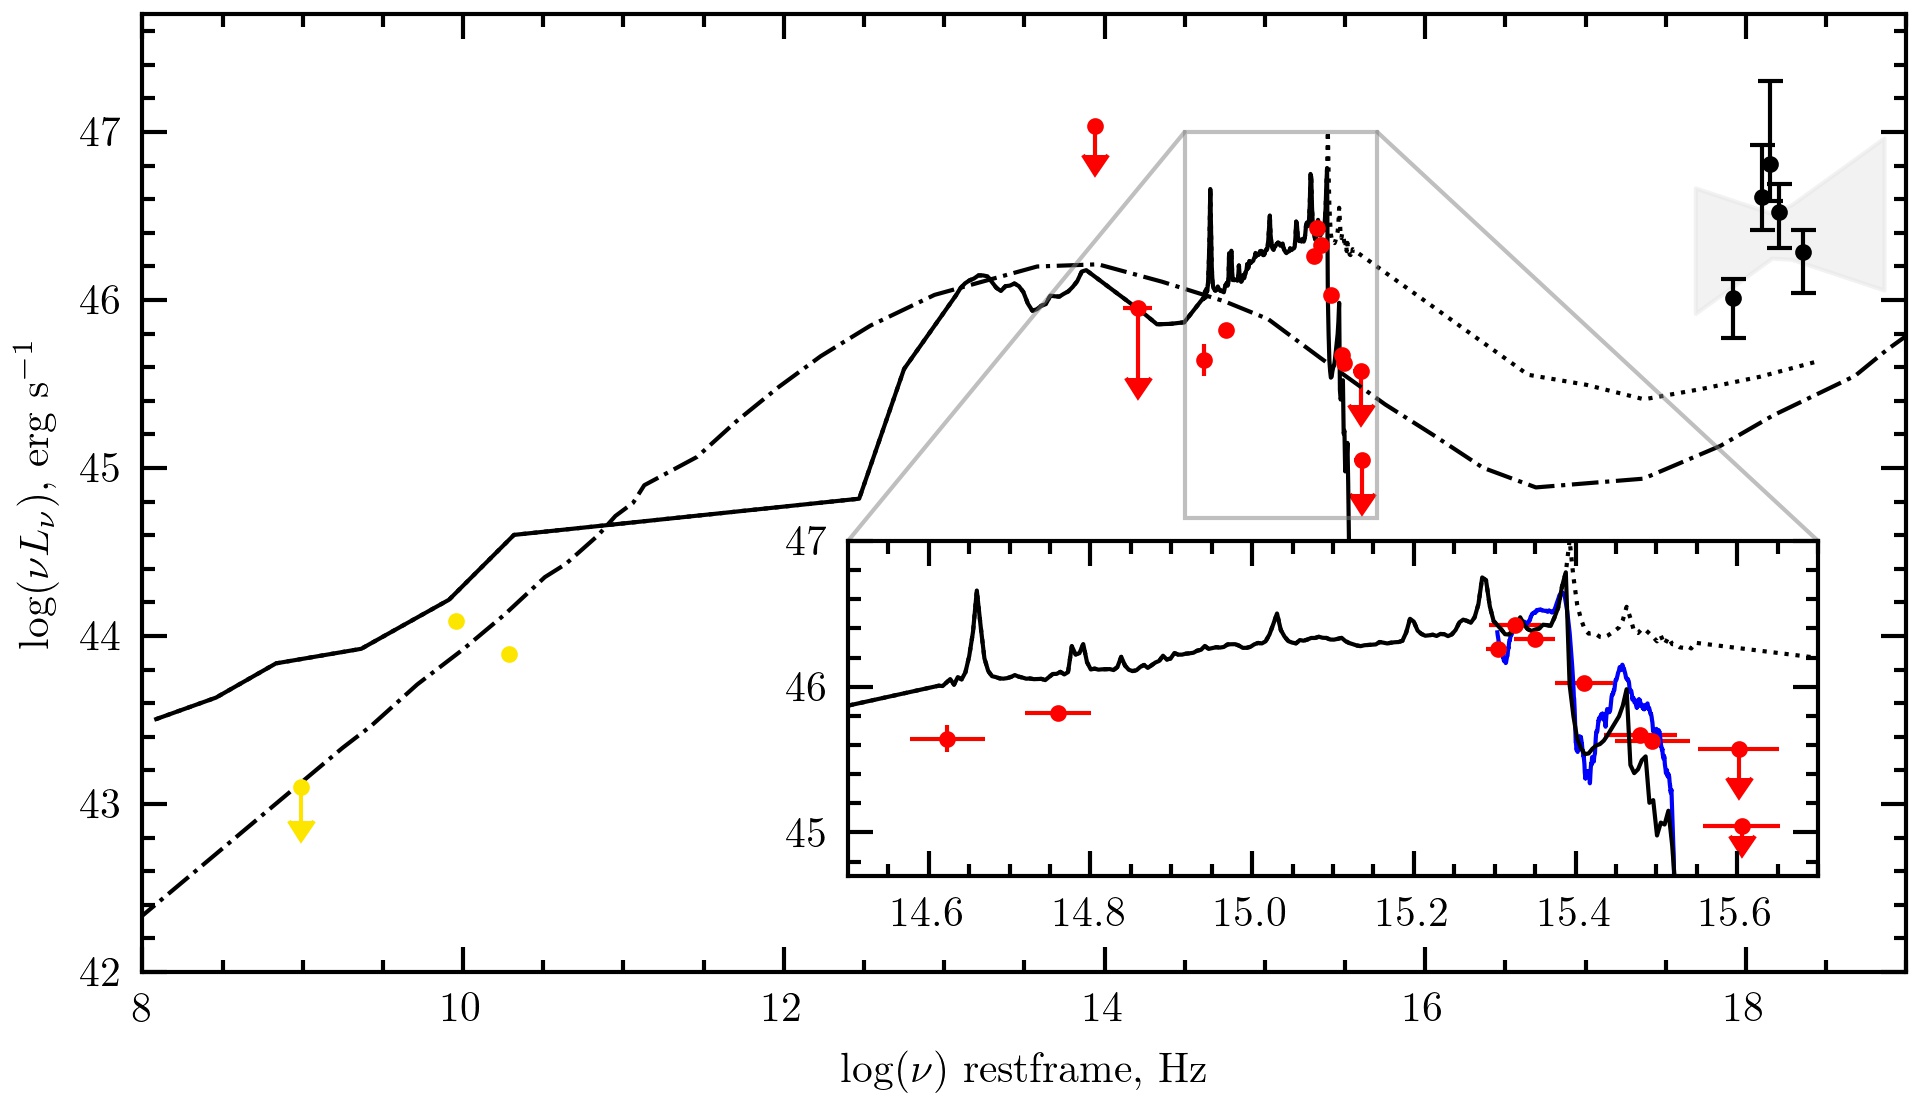
The resulting SED is shown at Fig. 6 (data used for SED construction are given in the Table 4). Optical and Infrared photometric measurements, as well as luminosities calculated from them, were corrected for Galactic absorption by using the color excess value towards the quasar — (Schlegel et al., 1998). For DESI LIS optical filters and WISE filters, the corresponding correction factors mw_transmission from the DESI LIS DR8 catalog were used. The standard absorption law (Cardelli et al., 1989) with was used to correct the Pan-STARRS photometry for Galactic absorption.
5.1 Radio properties
SRGE J170245.3+130104 is reliably detected in the NRAO VLA Sky Survey (NVSS) at 1.4 GHz (survey observations conducted in the 1990s). In addition, radio source is registered in the Very Large Array Sky Survey Epoch 1 (VLASS)555https://cirada.ca/vlasscatalogueql0 at 2.99 GHz (Gordon et al., 2020) (see Table 4). One can use the lack of meaningful detection of the SRGE J170245.3+130104 in the TGSS survey (survey covered 3.6 steradian of the celestial sphere, including the location of the quasar) to put 25 mJy upper limit to the source flux density at MHz (see §4.2 Intema et al. 2017).
Thus, at the moment we have two measurements and one upper limit on the flux density in the 150 MHz – 3 GHz radio range. As can be seen at Fig. 6, according to these data, the radio emission spectrum should have maximum between 1 and 10 GHz (in the quasar rest frame). However, this conclusion should be treated with caution because of the probable variability of the object, since the radio observations discussed above were made at different epochs (in particular, NVSS and VLASS measurements are separated by more than 20 years). It is worth noting, that X-ray brightness quasar SRGE J170245.3+130104 has changed by a factor of 2 at a half-year scale (see”X-ray data”section for more details).
High source flux density measured in the gigahertz spectral range unequivocally indicates that the quasar SRGE J170245.3+130104 is radio-loud. A standard parameter can be used to quantitatively describe radio-loudness:
| (1) |
where and are the flux densities at 5 GHz and at the frequency corresponding to the wavelength 4400 Å in the quasar rest frame. To estimate one can assume that the source spectrum around this frequency is described by a power law with slope (), and normalize spectrum by the NVSS measurement at the observed frequency of 1.4 GHz. The value of can be calculated based on the slope of the ultraviolet (in the quasar rest frame) part of the spectrum, determined by the measured flux density values in the and bands (see Table 4).
Thus, for the quasar SRGE J170245.3+130104 we get a value of . Such a high radio luminosity is typical for (Belladitta et al., 2020) blazars, i.e., a special category of radio-loud quasars in which the relativistic jet is directed in the observer direction. Only a few objects at are known to have (Belladitta et al., 2019). However, if using the method described above to calculate using VLASS data instead of NVSS data, the spectral density of will be lower by a factor of 3. As a consequence, the radio loudness estimate will also decrease: , and values are more typical of ”ordinary” radio-loud quasars than of blazars (see Belladitta et al., 2020).
It is interesting to compare the SED of the quasar SRGE J170245.3+130104 with typical broad-band spectra of radio-loud quasars and blazars. For this purpose at Fig. 6 we show the radio-loud quasar average spectrum template from (Shang et al., 2011) and the blazar average spectrum template (for the radio luminosity range – in which our quasar SRGE J170245.3+130104 falls) from (Fossati et al., 1998). The radio-loud quasar template was normalized by using stellar magnitude measured for the quasar SRGE J170245.3+130104 (in the DESI LIS band).
As can be seen in Fig. 6, the blazar template is poorly suited to describe the SED of the SRGE J170245.3+130104 quasar. The template of the radio-loud quasar shows significantly better agreement with the observational data. However, it is necessary to take into account the fact that this template is not a universal SED of radio-loud quasars, and the spectral shapefor individual objects may significantly differ (see Shang et al., 2011).
The quasar SRGE J170245.3+130104 is characterized by the largest measured flux density at 1.4 GHz (26 mJy) among known radio-loud quasars (including blazars) at (see Table A.1 in Belladitta et al., 2020). In particular, it is nearly twice as bright as the quasar PSO J352.403415.3373 (14.9 mYan, Bañados et al., 2018), which prior to the discovery of the first blazar at (23.7 mYan, Belladitta et al., 2020) was considered as the most powerful radio-luminous quasar at . It should be noted, however, that at smaller redshifts there are sources with even larger radio-highness values up to (Belladitta et al., 2019; Kopylov et al., 2006).
Concluding the discussion about the radio properties of the quasar SRGE J170245.3+130104, we note that to clarify whether it is a blazar, it is necessary to conduct a more detailed study of its spectral and spatial characteristics in the radio range.
5.2 X-ray/UV luminosity ratio
The effective spectrum slope () between 2500 Å and 2 keV (Tananbaum et al., 1979) is often used in studies of quasars:
| (2) |
where , — spectral luminosity density in the quasar rest frame (measured in units of erg s-1 Hz-1) at 2500 Å and 2 keV, respectively. The parameter depends on relative contribution of different emission mechanisms to the energy release, such as: thermal radiation of accretion disk, re-emission of radiation energy in broad lines, hot disk corona emission, and radiation from relativistic jets.
To estimate the parameter for the SRGE J170245.3+130104 quasar, its monochromatic X-ray luminosity at 2 keV was determined from data of the eROSITAtelescope, assuming that the X-ray spectrum is described by a power law with slope (see section ”X-ray data”). To calculate , it was assumed that object optical spectrum can be approximated by radio-loud quasar average spectrum template (Shang et al., 2011) (normalized by the measured apparent magnitude in the DESI LIS filter). The derived values of the X-ray and UV luminosities are shown in Table 4.
We obtained the following power law slope estimate for SRGE J170245.3+130104: . This value suggests that the broad-band SED of the quasar has a powerful X-ray excess compared with the vast majority of quasars studied so far. This conclusion is also evidenced by a direct comparison of the SRGE J170245.3+130104 SED with average spectra templates for radio-quiet quasars and blazars (see Fig. 6). Radio-quiet quasars are characterized by average slope (Lusso et al., 2010). Radio-loud quasars are characterized by slightly higher relative X-ray brightness, but is extreme for this class of objects as well (see, e.g., Zhu et al., 2020).
In this sense, the quasar SRGE J170245.3+130104 is similar to the quasar CFHQS J142952+544717 = SRGE J142952.1+544716 at studied in Medvedev et al. (2020), for which the slope was obtained. As discussed in Medvedev et al. (2020, 2021), the powerful X-ray excess in broad-band SED of the quasar CFHQS J142952+544717 may be related to the backward Compton scattering of the cosmic microwave background radiation (whose energy density increases with redshift as ) in relativistic jets. It is possible that we observe a similar phenomenon in a slightly closer quasar SRGE J170245.3+130104.
5.3 Bolometric luminosity
On the basis of the broad-band SED presented at Fig. 6 we can estimate the bolometric luminosity of the quasar SRGE J170245.3+130104 in a similar was as it was done in (Medvedev et al., 2020) for another distant radio-loud quasar CFHQS J142952+544717 = SRGE J142952.1+544716.
Using the radio-loud quasar template from (Shang et al., 2011), we can estimate the luminosity at energies below 2 keV. It is erg/s. The luminosity in the 2–100 keV range can be estimated by extrapolating the X-ray spectrum with slope , measured (at energies 2–32 keV in the quasar rest frame) with the eROSITA telescope. Thus, we obtain erg/s. Assuming that the contribution from higher energies (above 100 keV) is negligible, we find that the bolometric luminosity of the quasar SRGE J170245.3+130104 is (1.5–2) erg/s.
Assuming that the bolometric luminosity does not exceed the Eddington critical luminosity, we can obtain a lower limit on the mass of a supermassive black hole in the SRGE J170245.3+130104 quasar as .
Thus, the bolometric luminosity and black hole mass of the SRGE J170245.3+130104 quasar appear to be comparable to the corresponding characteristics of other brightest radio-loud quasars at (see, e.g., Medvedev et al. (2020)).
6 SRGE J170245.3+130104 —the brightest X-ray quasar at
Discovered by eROSITA telescope of SRG observatory, quasar SRGE J170245.3+130104 has enormous X-ray luminosity and at the moment is the brightest in X-rays among all known quasars at at Eastern Galactic Hemisphere (processing data SRG/eROSITA on which the Russian scientists are responsible). Is such a high X-ray luminosity unique at all for quasars at ?
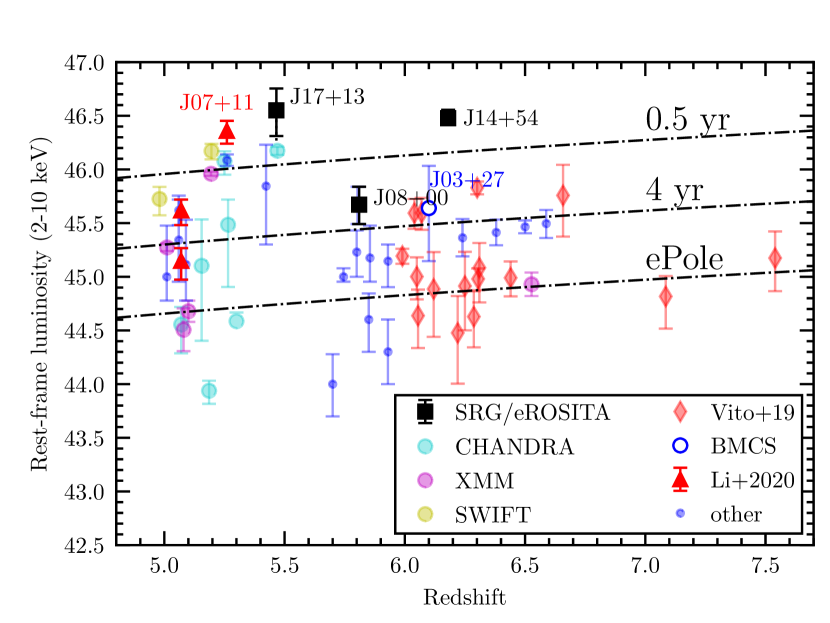
To answer this question, we’ve cataloged all the X-ray registered quasars at the moment at . Details of how this information was collected are described in the Appendix at the end of the paper. The resulting catalog (a total of 52 objects) is presented in Table LABEL:tab:xzcat, references to the X-ray data and redshifts are given in Tables LABEL:tab:xref and LABEL:tab:oref, respectively. Based on the information collected. it is possible to compare the X-ray luminosities of the SRGE J170245.3+130104 quasar and previously known quasars. The results of this comparison are presented in Fig. 7. It can be seen that the radio-loud quasar SRGE J170245.3+130104 is the brightest in X-ray luminosity among all known quasars at (including blazars).
Note that in the second scan of SRG/eROSITA All-Sky Survey (six months after the first observation) X-ray luminosity of the quasar SRGE J170245.3+130104 has decreased by about factor of 2 (see section ”X-ray data”). It is worth noting, that the previously known brightest X-ray radio-loud quasar SDSS 074749.18+115352.46 exhibits X-ray variability of comparable amplitude on a scale of few hours (Li et al., 2021).
Fig. 7 shows that X-ray observatories so far has been focused mainly on quasars at . The unique data from the four-year SRG/eROSITA survey will reveal all objects in the poorly understood part of quasar luminosity function at extremely large X-ray luminosities ( erg/s). The combined use of the data from X-ray and Optical sky surveys will help improve the purity of distant quasars candidate samples selection and allow to fill the apparent gap in the redshift distribution of luminous quasars ( Fig. 7).
7 Conclusion
The X-ray quasar SRGE J170245.3+130104 at discovered by the SRG X-ray observatory and the BTA 6-m telescope is the most X-ray luminous quasar among known objects in the early Universe () and also one of the most powerful quasars in radio.
The large radio-loudness () of the quasar indicates that it can be a blazar. To test this hypothesis, it is necessary to carry out interferometric radio observations of the object at several wavelengths. Note that only a few blazars at (Belladitta et al., 2020) are currently known, and all of them have lower X-ray luminosities than the quasar SRGE J170245.3+130104.
Spectroscopic measurements in the near-infrared range ( microns) could also significantly complement the physical picture. It is expected that a broad MgII emission line should appear in the near-IR, which could be used to measure the mass of the black hole.
The quasar SRGE J170245.3+130104 shows significant X-ray variability in the first two scans of the eROSITA all-sky survey. We will continue to monitor its variability in the following scans.
The X-ray detection of the radio-loud quasars CFHQS J142952+544717 = SRGE J142952.1+544716 at (Medvedev et al., 2020) and SRGE J170245.3+130104 at with record-breaking X-ray luminosities of erg/s by the SRG observatory opens a new page in the study of supermassive black hole growth in the early Universe. We hope that the sample of such interesting objects will be substantially expanded during the ongoing all-sky X-ray survey. Spectroscopic verification of new X-ray sources plays a key role. Searches for unique quasars among the sources discovered by the SRG observatory are continuing with the help of the BTA 6-m telescope, AZT-33IK 1.6-m telescope (Burenin et al., 2016) and the Russian-Turkish RTT-150 1.5-m telescope (Bikmaev et al., 2020).
Observations on the telescopes of the SAO RAS are carried out with the support of the Ministry of Science and Higher Education of the Russian Federation (Ministry of Education and Science of Russia).
This study is based on observations of the telescope eROSITA aboard the SRG observatory. The observatory was built by Roscosmos on behalf of the Russian Academy of Sciences, represented by the Institute of Space Research (IKI) within the framework of the Russian Federal Science Program with participation of the German Center for Aeronautics and Astronautics (DLR). The X-ray telescope SRG/eROSITA was made by a consortium of German institutes led by the Max Planck Society Institute for Extraterrestrial Astrophysics (MPE) with the support of DLR. The spacecraft SRG/eROSITA is designed, manufactured, launched, and operated by the Lavochkin Research Center and its subcontractors. Scientific data are received by a complex of long-range space communications antennas in Bear Lakes, Ussuriysk and Baikonur and are funded by Roscosmos. The eRosita telescope data used in this work are processed using the eSASS software developed by the German consortium eROSITA and the software developed by the Russian telescope consortium SRG/eROSITA. The SRGz system was created in the Science Working Group of RU eROSITA consortium on X-ray source detection, identification and SRG/eROSITA source catalog.
The functions from the astropy(Robitaille et al., 2013), pysynphot(Lim et al., 2015), and specutils666https://pysynphot.readthedocs.io libraries were used to calculate Galactic777https://extinction.readthedocs.io/en/latest/ and extragalactic888https://specutils.readthedocs.io/ absorption, distances and other astrophysical quantities. The transmission curves and other characteristics of the photometric filters are taken from the Spanish Virtual Observatory Filter Profile Service999http://svo2.cab.inta-csic.es/theory/fps/ Rodrigo et al. (2012, 2020). The catalogs of the VizieR database Ochsenbein et al. (2000) were used in this work.
This study was supported by the Russian Science Foundation (grant 19-12-00396).
8 Appendix: Catalogue of X-ray quasars at
Commonly known and widely used samples of distant () X-ray quasars were compiled several years ago (see, e.g., Nanni et al., 2017; Vito et al., 2019). The search for new quasars is actively ongoing in all bands of the electromagnetic spectrum, so published catalogs are rapidly becoming outdated. In light of the successful work of the SRG observatory, we have prepared our updated and complete (at December 2020) catalog of all spectroscopically confirmed quasars at , registered in the X-ray range (Table LABEL:tab:xzcat).
The catalog is based on a joint sample of spectroscopically confirmed quasars at from ”The Million Quasars catalog, v7.0a”
citepflesch19 and from ”VHzQ” quasars catalog (Ross & Cross, 2020). The later sample (contains 542 ”optical” quasars at ) was correlated with the list of X-ray sources optical counterparts taken from the list of articles given in TableLABEL:tab:xref. Information on the X-ray fluxes and luminosities of the X-ray sources is given in the Table LABEL:tab:xzcat, together with information about coordinates of the optical counterparts and their spectral redshifts (from Flesch (2021), Ross & Cross (2020)). The observed X-ray flux of 0.5–2 keV is given for most objects.
As in the Salvestrini et al. (2019) paper there was no information about X-ray fluxes of sources, we also does not provide this information in our Table LABEL:tab:xzcat. In the REF() column for each source we give reference to the paper from which the X-ray fluxes are taken, and than mention all the articles with X-ray observations of the source. Luminosities are given in the range 2–10 keV in the quasar reference frame.
The values of the X-ray flux and the luminosity for sources from (Vito et al., 2019) are taken mainly from Table 7 of the Vito et al. (2019).
For the remaining optical quasars, for which no X-ray companion was found in the literature, we searched X-ray catalogs for the nearest object in 6 arcsec aperture radius. We used the following X-ray catalogs: Chandra source catalog Release 2.0 (Evans et al., 2010, 2020), XMM-Newton4XMM-DR10 Catalog (Webb et al., 2020), 2SXPS Swift X-ray telescope Point source catalog (Evans et al., 2020b). The X-ray luminosities were calculated in the 2–10 keV energy range (in the quasar rest frame). This assumed a power law spectrum with and used measurements from the Chandra and XMM-Newton observatories in the 0.5–2 eV range and data from the Swift observatory in the 0.3–10 eV range.
As a result, a catalog of 52 X-ray quasars at was obtained, including the quasar SRGE J170245.3+130104 discussed in this paper. Table LABEL:tab:oref contains references to the articles with spectroscopic redshifts for these objects.
References
- Abolfathi et al. (2018)
- [2] [B. Abolfathi, D. Aguado, G. Aguilar, P. Allende, A. Almeida, T. Ananna, et al.] 235422018
- Afanasiev, Amirkhanyan (2012)
- [4] [V. Afanasiev, V. Amirkhanyan] 674382012]
- Afanasiev, Moiseev (2011)
- [6] [V. Afanasiev and A. Moiseev] 203632011
- Akaike (1974)
- [8] [Akaike, H.] IEEE Transact. Automat. Control 19, 716 (1974).
- Afanasiev et al. (2016)
- [10] [V. L. Afanasiev, S. N. Dodonov, V. R. Amirkhanian, and A. V. Moiseev] 715142016
- Arnaud (1996) Arnaud (K. Arnaud), Astronomic.Data Analys. Software and Systems V, eds. Jacoby G. and Barnes J., ASP Conf. 101, 17 (1996).
- Bañados et al. (2016)
- [13] [E. Bañados, B. Venemans, R. Decarli, E. Farina, C. Mazzucchelli, F. Walter, et al.] 227112016
- Bañados et al. (2018)
- [15] [E. Bañados, C. Carilli, F. Walter, E. Momjian, R. Decarli, E. Farina, et al.] 861142018
- Bañados et al. (2018b)
- [17] [E. Bañados, B. Venemans, C. Mazzucchelli, E. Farina, F. Walter, F. Wang, et al.] 5534732018
- Barger et al. (2002)
- [19] [A. Barger, L. Cowie, W. Brandt, P. Capak, G. Garmire, and A. Hornschemier] 12418392002
- Becker et al. (2001)
- [21] [R. Becker, X. Fan, R. White, M. Strauss, V. Narayanan, and R. Lupton] 12228502001
- Belladitta et al. (2019)
- [23] [S. Belladitta, A. Moretti, A. Caccianiga, G. Ghisellini, C. Cicone, T. Sbarrato, et al.] 629682019
- Belladitta et al. (2020)
- [25] [S. Belladitta, A. Moretti, A. Caccianiga, C. Spingola, P. Severgnini, R. Della Ceca, et al.] 63572020
- Bennett et al. (2018)
- [27] [ C. Bennett, D. Larson, J. Weiland, and G. Hinshaw] 7941352014
- Bikmaev et al. (2020)
- [29] [I. Bikmaev, E. Irtuganov, E. Nikolaeva, N. Sakhibullin, R. Gumerov, M. Sklyanov, M. Glushkov, V. Borisov et al.] 466452020
- Burenin et al. (2016)
- [31] [R. Burenin, A. Amvrosov, M. Eselevich, M. Grigor’ev, V. Aref’ev, V. Vorobyev, et al.] 422952016
- Cardelli et al. (1989)
- [33] [J. Cardelli, G. Clayton, J. Mathis] 3452451989
- Carnall et al. (2015)
- [35] [A. Carnall, T. Shanks, B. Chehade, M. Fumagalli, M. Rauch, M. Irwin, et al.] 451162015
- Cash (1979) Cash (Cash, W.), Astrophys. J. 228, 939 (1979).
- Chambers et al. (2016)
- [38] [K. Chambers, E. Magnier, N. Vetalfe, H. Flewelling, M. Huber, C. Waters, et al.] arXiv:1612.05560 (2016)
- Civano et al. (2016)
- [40] [F. Civano, S. Marchesi, A. Comastri, M. Urry, M. Elvis, N. Cappelluti, et al.] 819622016
- Condon et al. (1998)
- [42] [J. Condon, W. Cotton, E. Greisen, Q. Yin, R. Perley, G. Taylor, J. Broderick] 11516931998
- Connor et al. (2019)
- [44] [T. Connor, E Banados, D. Stern, R. Decarli, J. Schindler, X. Fan, E .Farina] 8871712019
- Davis et al. (2007)
- [46] [S. Davis, J. Woo, O. Blaes] 66822007
- Dey et al. (2019)
- [48] [A. Dey, D. Schlegel, D. Lang, R. Blum, K. Burleigh, X. Fan, et al.] 1571682019
- Dodin et al. (2020)
- [50] [A. Dodin, A. Potanin, N. Shatsky, A. Belinski, K. Atapin, M. Burlak, O. Egorov, A. Tatarnikov et al.] 464292020
- Evans et al. (2010)
- [52] [I. Evans, F. Primini, K. Glotfelty, C. Anderson, N. Bonaventura, Judy C. Chen]18912010
- Evans et al. (2020)
- [54] [I. Evans, F. Primini, J. Miller, J. Evans, C. Allen, C. Anderson,et al.] 5212020
- Evans et al. (2020b)
- [56] [P. Evans, K. Page, P. Osborne, P. Beardmore, R. Willingale, D. Burrows, et al.]247542020
- Fan et al. (2003)
- [58] [X. Fan, M. Strauss, D. Schneider, R. Becker, R. White, Z. Haiman, et al.] 12516492003
- Fan et al. (2004)
- [60] [X. Fan, J. Hennawi, G. Richards, M. Strauss, D. Schneider, J. Donley, et al.] 1285152004
- Fan et al. (2006)
- [62] [X. Fan, M. Strauss, G. Richards, J. Hennawi, R. Becker, R. White, et al.] 13112032006
- Flesch (2015)
- [64] [E. W. Flesch]320102015; (version 5.2, 5 August 2017)
- Flesch (2021)
- [66] [E. W. Flesch]Milliquas v7.0 (2021) update, Flesch E.W., arXiv:1912.05614
- Fossati et al. (1997)
- [68] [G. Fossati, A. Celotti, G. Ghisellini and L. Maraschi] 2891361997
- Fossati et al. (1998)
- [70] [G. Fossati, L. Maraschi, A. Celotti, A. Comastri and G. Ghisellini] 2994331998
- Goodman & Weare (2010)
- [72] [J. Goodman, J. Weare] 65-8052010
- Goodrich et al. (2001)
- [74] [R. Goodrich, R. Campbell, F. Chaffee, G. Hill, D. Sprayberry, W. Brandt,et al.] 561232001
- Gordon et al. (2020)
- [76] [Y. Gordon, M. Boyce, C. O’Dea, L. Rudnik, H. Andernach, A. Vantyghem, et al.] 41752020
- HI4PI Collaboration et al. (2016)
- [78] [HI4PI Collaboration et al., B. Bekhti, L. Floeer, R. Keller, J. Kerp, D. Lenz, et al.]A1165942016
- Intema et al. (2017)
- [80] [H. Intema, P. Jagannathan, K. Mooley, D. Frail] 598782017
- Jiang et al. (2015)
- [82] [L. Jiang, I. McGreer, X. Fan, F. Bian, Z. Cai, B. Clement, et al.] 1491882015
- Khorunzhev et al. (2017)
- [84] [G. Khorunzhev, R. Burenin, S. Sazonov, A. Amvrosov, M. Eselevich] 431592017
- Khorunzhev et al. (2020)
- [86] [G. Khorunzhev, A. Meshcheryakov, R. Burenin, A. Lyapin, P. Medvedev, S. Sazonov, M. Eselevich, R. Sunyaev et al.] 461552020
- Khorunzhev et al. (2021)
- [88] In preparation, 2021
- Kolodzig et al. (2012)
- [90] [A. Kolodzig, M. Gilfanov, R. Sunyaev, S. Sazonov, and M. Brusa] 558A892013
- Kolodzig et al. (2013)
- [92] [A. Kolodzig, M. Gilfanov, G. Huetsi, R. Sunyaev] 558A902013
- Kopylov et al. (2006)
- [94] [A. Kopylov, W. Goss, Yu. Priiskii, N. Soboleva, O. Verkhodanov, A. Temirova, O. Zhelenkova] 324332006
- Lang (2014)
- [96] [D. Lang] 1471082014
- Lang (2016)
- [98] [D. Lang, D. Hogg, D. Schlegel] 151362016
- Lim et al. (2015)
- [100] [P. Lim, R. Diaz, V. Laidler] PySinphot User’s Guide (Baltimore, MD: STScl) https://pysynphot.readthedocs.io/
- Li et al. (2021)
- [102] [J. Li, F. Wang, J. Yang, Y. Zhang, Y. Fu, F. Bian, et al.] 9061352021
- Lusso et al. (2010)
- [104] [E. Lusso, A. Comastri, C. Vignali, G. Zamorani, M. Brusa, R. Gilli, K. Iwasawa, M. Salvato, et al.] 512342010
- Lyke et al. (2020)
- [106] [B. Lyke, A. Higley, J. McLane, D. Schurhammer, A. Myers, A. Ross, et al.] 25082020
- Madau (1995)
- [108] [P. Madau] 441181995
- Mahabal et al. (2005)
- [110] [A. Mahabal, D. Stern, M. Bogosavljevic, S. Djorgovski, D. Thompson] 63492005
- Maiolino et al. (2004)
- [112] [R. Maiolino, E. Oliva, F. Ghinassi, M. Pedani, F. Mannucci, R. Mujica, Y. Juarez] 4208892004
- Massey et al. (1988)
- [114] [P. Massey, K. Strobel, J. Barnes, E. Anderson] 3283151988
- Masters et al. (2012)
- [116] [D. Masters, P. Capak, M. Salvato, F. Civano, B. Mobasher, B. Siana, et al.] 7551692012
- Mazzucchelli et al. (2017)
- [118] [C. Mazzucchelli, E. Bañados, B. Venemans, R. Decarli, E. Farina, F. Walter, et al.] 849912017
- McGreer et al. (2009)
- [120] [I. McGreer, D. Helfand, R. White] 13819252009
- McGreer et al. (2013)
- [122] [I. McGreer, L. Jiang, X. Fan, G. Richards, M. Strauss, N. Ross] 7681052013
- Medvedev et al. (2020)
- [124] [P. Medvedev, S. Sazonov, M. Gilfanov, R. Burenin, G. Khorunzhev, A. Meshcheryakov, R. Sunyaev, I. Bikmaev, and E. Irtuganov] 49718422020
- Medvedev et al. (2021)
- [126] [P. Medvedev, M. Gilfanov, S. Sazonov, N. Schartel, R. Sunyaev] arXiv:2011.13724 (2020)
- Merloni et al. (2014)
- [128] [A. Merloni, P. Predehl, W. Becker, H. Bohringer, T. Boller, H. Brunner et al.] arXiv:1209.3114 (2012)
- Merloni et al. (2020)
- [130] [A. Merloni, K. Nandra, P. Predehl] 46342020
- Meshcheryakov et al. (2015)
- [132] 413072015
- Meshcheryakov et al. (2018)
- [134] [A. Mescheryakov, V. Glazkova, S. Gerasimov, I. Mashechkin] 447352018
- Meshcheryakov (2021)
- [136] [A. Mescheryakov] in preparation (2021)
- Mortlock et al. (2011)
- [138] [D. Mortlock, S. Warren, B. Venemans, M. Patel, P. Hewett, R. McMahon, et al.] 4746162011
- Mufakharov et al. (2020)
- [140] [T. Mufakharov, A. Mikhailov, Yu. Sotnikova, M. Mingaliev, V. Stolyarov, A. Erkenov] arXiv:2011.12072 (2020)
- Nanni et al. (2017)
- [142] [R. Nanni, C. Vignali, R. Gilli, A. Moretti, W. Brandt] 6031282017
- Ochsenbein et al. (2000)
- [144] [F. Ochsenbein, P. Bauer, J. Marcout] 143232000
- Paris et al. (2018)
- [146] [I. Paris, P. Petitjean, E. Aubourg, A. Myers, A. Streblyanska, B. Lyke, et al.] 613512018
- Pavlinsky et al. (2011)
- [148] [M. Pavlinsky, V. Akimov, V. Levin, I. Lapshov, A. Tkachenko, N. Semena, et al.] 814752011
- Pettini et al. (2003)
- [150] [M.Pettini, P. Madau, M. Bolte J. Prochaska, S. Ellison, X. Fan] 5946952003
- Pons et al. (2020)
- [152] [E. Pons, R. McMahon, M. Banerji and S. Reed] 49138842020
- Potanin et al. (2020)
- [154] [S. Potanin, A. Belinski, A. Dodin, S. Zheltoukhov, V. Lander, K. Postnov, et al.] 4612020
- Predehl et al. (2020)
- [156] [P. Predehl, R. Andritschke1, V. Arefiev, V. Babyshkin, O. Batanov, W. Becker, et al.] 64712021
- Reed et al. (2017)
- [158] [S. Reed, R. McMahon, P. Martini, M. Banerji, M. Auger, P. Hewett, S. Koposov, et al.] 46847022017
- Reed et al. (2019)
- [160] [S. Reed, M. Banerji, G. Becker; P. Hewett, P. Martini, R. McMahon, E. Pons, et al.] 48718742019
- Robitaille et al. (2013)
- [162] [T. Robitaille, E. Tollerud, P. Greenfield, M. Droettboom, E. Bray, T. Aldcroft, et al.] 558A332013
- Rodrigo et al. (2012)
- [164] [C. Rodrigo, E. Solano, A. Bayo] IVOA Working Draft 15 october 2012 10.5479/ADS/bib/2012ivoa.rept.1015R
- Rodrigo et al. (2020)
- [166] [C. Rodrigo, E. Solano, A. Bayo] XIV.0 Scientific Meeting (virtual) of the Spanish Astronomical Society, 2020 id.182 https://www.sea-astronomia.es/reunion-cientifica-2020
- Romani et al. (2004)
- [168] [R. Romani, D. Sowards-Emmerd, L. Greenhill, P. Michelson] 61092004
- Rosen et al. (2016)
- [170] [S. Rosen, N. Webb, M. Watson, J, et al.] 590A12016
- Ross & Cross (2020)
- [172] [N. Ross & N. Cross] 4947892020
- Salvestrini et al. (2019)
- [174] [F. Salvestrini, G. Risaliti, S. Bisogni, E. Lusso, C. Vignali] 6311202019
- Schlegel et al. (1998)
- [176] [D. Schlegel, D. Finkbeiner, M. Davis]5005251998
- Shang et al. (2011)
- [178] [Z. Shang, M. Brotherton, B. Wills, D. Wills, S. Cales, D. Dale, R. Green, et al.]19622011
- Sunyaev et al. (2021)
- [180] [R.Sunyaev et al.] in preparation
- Tananbaum et al. (1979)
- [182] [H. Tananbaum, Y. Avni, G. Branduardi, M. Elvis, G. Fabbiano, E. Feigelson, R. Giacconi et al.] 23491979
- Trümper (1982)
- [184] [J. Trümper] 22411982
- Vanden Berk et al. (2001)
- [186] [D. Vanden Berk, G. Richards, A. Bauer, M. Strauss, D. Schneider, T. Heckman] 1225492001
- Venemans et al. (2015)
- [188] [B. Venemans, E. Bañados, R. Decarli, E. Farina, F. Walter, K. Chambers, et al.] 801112015
- Vito et al. (2019)
- [190] [F. Vito, W. Brandt, F. Bauer, F. Calura, R. Gilli, B. Luo, et al.] 6301182019
- Wang et al. (2016)
- [192] [F. Wang, X. Wu, X. Fan, J. Yang, W. Yi, F. Bian, et al.] 819242016
- Wang et al. (2021)
- [194] [F. Wang, X. Fan, J. Yang, C. Mazzucchelli, X. Wu, J. Li, E. Banados, et al.] 908532021
- Webb et al. (2020)
- [196] [N. Webb, M. Coriat, I. Traulsen, J. Ballet, C. Motch, F. Carrera, et al.] 6411362020
- Willott et al. (2007)
- [198] [C. Willott, P. Delorme, A. Omont, J. Bergeron, X. Delfosse, T. Forveille, et al.] 13424352007
- Willott et al. (2010)
- [200] [C. Willott, P. Delorme, C. Reyle, L. Albert, J. Bergeron, D. Crampton, et al.] 1399062010
- Wolf et al. (2021)
- [202] [J. Wolf, K. Nandra, M. Salvato, T. Liu, J. Buchner, M. Brusa, et al.] 64752021
- Wright et al. (2010)
- [204] [E. Wright, P. Eisenhardt, A. Mainzer, M. Ressler, R. Cutri, T. Jarrett, et al.] 14018682010
- Wu et al. (2015)
- [206] [X. Wu, F. Wang, X. Fan, W. Yi, W. Zuo, F. Bian, et al.] 5185122015
- Zhu et al. (2020)
- [208] [S. Zhu, W. Brandt, B. Luo, J. Wu, Y. Xue, G. Yang] 4962452020
| Telescope/Survey | Passband | Flux or magnitude | Reference | in rest frame (Hz) | , erg s-1 |
| Radio range: | |||||
| TGSS | 150 MHz | 25 mJy | 1 | ||
| NVSS | 1.4 GHz | mJy | 2 | ||
| VLASS | 2.99 GHz | mJy | 3 | ||
| Infrared range: | |||||
| WISE/PS1 | 4 | ||||
| WISE/DESI LIS | W2Vega,forced | 5 | |||
| W1Vega,forced | |||||
| Optical range: | |||||
| PS1 | 6 | ||||
| DESI LIS | , | 4 | |||
| , | |||||
| , | |||||
| X-ray range: | |||||
| SRG/eROSITA | 0.5–2 keV () | erg cm-2 s-1 | 4 | ||
| Derived values: | |||||
| (2500 Å–2 keV) | |||||
| erg s-1 | |||||
| (4400 Å) | erg s-1 | ||||
| (2500 Å) | erg s-1 | ||||
| (2 keV) | erg s-1 | ||||
| (bolometric) | (1.5–2) erg s-1 | ||||
| Source | RA | DEC | REF() | REF() | REF() | ||||
|---|---|---|---|---|---|---|---|---|---|
| deg | deg | erg/s/cm2 | erg/s | ||||||
| SDSS J00026+2550 | 5.800 | 0589 | 5.820 | 0.39 | 10 | 45.23 | 10 | ||
| SDSS J000552.33-000655.6 | 5.855 | DR16Q | 5.850 | 0.25 | 10,1 | 45.18 | 10 | ||
| SDSS J002526.84-014532.5 | 5.060 | DR16Q | 5.070 | 1.41 | 6 | 45.62 | 6 | ||
| CFHQS J0050+3445 | 6.250 | 2051 | 6.253 | 0.145 | 5 | 44.91 | 5 | ||
| SDSS J010013.02+280225.8 | 6.301 | ULTRA | 6.326 | 0.771 | 5,10,2 | 45.83 | 5 | ||
| HRQC J011544.78+001514.9 | 5.100 | 1245 | 5.100 | 0.154 | 2 | 44.68 | 2 | ||
| SDSS J013127.34-032100.1 | 5.196 | DR16Q | 5.180 | 13.18 | 3 | 46.17 | 3 | ||
| ATLAS J025.6821-33.4627 | 6.310 | VAHIZ | 6.338 | 0.198 | 5,10,3 | 45.08 | 5 | ||
| SDSS J022112.62-034252.2 | 5.011 | DR16Q | 5.020 | 0.628 | 2 | 45.27 | 2 | ||
| VDESJ0224-4711 | 6.500 | VDES | 6.500 | 0.508 | 13,11,2 | 45.47 | 13 | ||
| PSO J036.5078+03.0498 | 6.527 | PSO | 6.541 | 0.161 | 2,11 | 44.93 | 2 | ||
| SDSS J023137.64-072854.4 | 5.423 | DR16Q | 5.370 | 1.925* | 14,2,1* | 45.85 | 14 | ||
| PSO J030947.49+271757.31 | 6.100 | BMCS | 3.4 | 15 | 45.64 | 15 | |||
| SDSS J074154.72+252029.6 | 5.194 | 1244 | 5.194 | 2.818 | 2,1 | 45.96 | 2 | ||
| SDSS J074749.18+115352.4 | 5.260 | WISEHI | 5.260 | 3.49 | 6 | 46.09 | 6 | ||
| SDSS J075618.13+410408.6 | 5.060 | DR16Q | 5.060 | 0.64* | 14,1* | 45.34 | 14 | ||
| SDSS J08367+0054 | 5.803 | 1457 | 5.810 | 9.9 | 9,10,14,1 | 45.67 | 9 | ||
| SDSS J084035.09+562419.9 | 5.850 | 0590 | 5.844 | 0.09 | 10,1 | 44.60 | 10 | ||
| SDSS J084229.43+121850.5 | 6.055 | OVRLAP | 6.076 | 0.075 | 5 | 44.64 | 5 | ||
| Q J0906+6930 | 5.470 | 1557 | 5.470 | 4.127 | 1,3 | 46.17 | 1 | ||
| COSM J095908.1+022707 | 5.070 | 1221 | 5.070 | 0.117 | 1 | 44.56 | 1 | ||
| COSM J100051.6+023457 | 5.300 | 1221 | 5.300 | 0.114 | 4 | 44.59 | 4 | ||
| SDSS J102623.62+254259.4 | 5.250 | DR16Q | 5.250 | 3.599 | 1,3 | 46.08 | 1 | ||
| SDSS J10304+0524 | 6.305 | 1144 | 6.308 | 0.176 | 5,10,14,1,2 | 44.98 | 5 | ||
| PSO J159.2257-02.5438 | 6.380 | PS1 | 6.381 | 0.411 | 13,2 | 45.41 | 13 | ||
| SDSS J10445-0125 | 5.745 | 0695 | 5.785 | 0.31 | 10,2 | 45.00 | 10 | ||
| SDSS J10487+4637 | 6.287 | DR14Q | 6.228 | 0.077 | 5,10 | 44.63 | 5 | ||
| SDSS J105036.46+580424.6 | 5.155 | DR16Q | 5.155 | 0.398 | 1 | 45.10 | 1 | ||
| SDSS J105322.98+580412.1 | 5.265 | DR16Q | 5.265 | 0.917 | 1 | 45.49 | 1 | ||
| ULAS J112001.48+064124.3 | 7.085 | 1318 | 7.084 | 0.068 | 5,11,10,14,1,2 | 44.82 | 5 | ||
| SDSS J114657.79+403708.6 | 4.980 | DR16Q | 5.009 | 5.167 | 3 | 45.73 | 3 | ||
| RD J1148+5253 | 5.700 | 1139 | 5.700 | 0.02 | 10 | 44.00 | 10 | ||
| SDSS J114816.64+525150.3 | 6.440 | DR16Q | 6.419 | 0.196 | 5,10,14 | 44.99 | 5 | ||
| SDSS J120441.73-002149.6 | 5.090 | DR16Q | 5.090 | 0.40* | 14,1* | 45.11 | 14 | ||
| B01.174 | 5.186 | 0127 | 5.186 | 0.027 | 1 | 43.94 | 1 | ||
| 3XMM J125329.4+305539 | 5.080 | KHOR1 | 5.080 | 0.104 | 2 | 44.51 | 2 | ||
| SDSSp J130608.26+035626.3 | 5.990 | 0144 | 6.034 | 0.322 | 5,10,14,1 | 45.19 | 5 | ||
| SDSS J13358+3533 | 5.930 | 0590 | 5.901 | 0.04 | 10 | 44.30 | 10 | ||
| ULAS J134208.10+092838.6 | 7.540 | HIZ7.5 | 7.540 | 0.173 | 5,11 | 45.17 | 5 | ||
| SDSS J14111+1217 | 5.930 | 0589 | 5.904 | 0.35 | 10,14,1 | 45.15 | 10 | ||
| CFHQS J1429+5447 | 6.210 | 2051 | 6.183 | 10.8 | 8 | 46.48 | 8 | ||
| CFHQS J15096-1749 | 6.120 | 2049 | 6.122 | 0.142 | 5 | 44.89 | 5 | ||
| SDSS J16029+4228 | 6.070 | 0589 | 6.090 | 0.689 | 5,10,14,1 | 45.60 | 5 | ||
| SDSS J16235+3112 | 6.220 | 0589 | 6.260 | 0.089 | 5,10,1 | 44.48 | 5 | ||
| SDSS J16305+4012 | 6.050 | 0588 | 6.065 | 0.204 | 5,10,14,1,2 | 45.00 | 5 | ||
| CFHQS J16413+3755 | 6.040 | 2049 | 6.047 | 0.636 | 5 | 45.59 | 5 | ||
| SRGE J170245.3+130104 | 5.466 | KHOR21 | 10.3 | 7 | 46.56 | 7 | |||
| PSO J308.0416-21.2339 | 6.240 | PS1 | 6.234 | 0.43* | 12,2* | 45.36 | 12 | ||
| PSO J323.1382+12.2986 | 6.588 | PS1MAZ | 6.588 | 0.522 | 11 | 45.50 | 11 | ||
| SDSS J220226.77+150952.3 | 5.070 | WISEHI | 5.070 | 0.50 | 6 | 45.15 | 6 | ||
| SDSS J221644.01+001348.1 | 5.010 | DR16Q | 5.010 | 0.23* | 14,1*,2 | 45.00 | 14 | ||
| PSO J338.2298+29.5089 | 6.658 | PSO | 6.666 | 0.141 | 5,11 | 45.76 | 5 |
Note. Source — name of the quasar, RA, DEC — Right Ascention and Declination (J2000) of the optical companion, — spectroscopic redshift, REF() — bibliographic reference to the measurement (see Table LABEL:tab:oref Table LABEL:tab:oref below), – spectroscopic redshift from the Ross & Cross (2020) catalog, – X-ray flux (symbol ”*” denotes that the flux value is taken from a subsidiary reference catalog). REF() — bibliographic reference to the value (the range of the measured is due to the corresponding X-ray survey, see ”The X-ray Survey”, ”SRGE J170245.3+130104— the brightest X-ray quasar at ” sections and Table LABEL:tab:xref), — X-ray luminosity in the 2–10 keV range in the quasar rest frame. The luminosity calculation was performed only for objects with REF() . Spectroscopic values were used in the luminosity calculation, -correction was calculated for the power X-ray spectrum with photon index without taking into account Galactic/extragalactic absorption. For other sources (REF()) the values and are given from original articles (see relevant references).
| REF(), REF() | Reference | X-ray range, keV |
|---|---|---|
| 1 | Evans et al. (2020) | 0.5-2 |
| 2 | Webb et al. (2020) | 0.5-2 |
| 3 | Evans et al. (2020b) | 0.3-10 |
| 4 | Civano et al. (2016) | 0.5-2 |
| 5 | Vito et al. (2019) | 0.5-2 |
| 6 | Li et al. (2021) | 0.5-2 |
| 7 | This article | 0.5-2 |
| 8 | Medvedev et al. (2021) | 0.2-10 |
| 9 | Wolf et al. (2021) | 0.5-2 |
| 10 | Nanni et al. (2017) | 0.5-2 |
| 11 | Wang et al. (2021) | 0.5-2 |
| 12 | Connor et al. (2019) | 0.5-2 |
| 13 | Pons et al. (2020) | 0.5-2 |
| 14 | Salvestrini et al. (2019) | — |
| 15 | Belladitta et al. (2020) | 0.3-10 |
| REF() | Reference |
|---|---|
| 127 | Barger et al. (2002) |
| 144 | Becker et al. (2001) |
| 588 | Fan et al. (2003) |
| 589 | Fan et al. (2004) |
| 590 | Fan et al. (2006) |
| 695 | Goodrich et al. (2001) |
| 1139 | Mahabal et al. (2005) |
| 1144 | Maiolino et al. (2004) |
| 1221 | Masters et al. (2012) |
| 1244 | McGreer et al. (2009) |
| 1245 | McGreer et al. (2013) |
| 1318 | Mortlock et al. (2011) |
| 1457 | Pettini et al. (2003) |
| 1557 | Romani et al. (2004) |
| 2049 | Willott et al. (2007) |
| 2051 | Willott et al. (2010) |
| BMCS | Belladitta et al. (2020) |
| DR14Q | Paris et al. (2018) |
| DR16Q | Lyke et al. (2020) |
| HIZ7.5 | Bañados et al. (2018b) |
| KHOR1 | Khorunzhev et al. (2017) |
| KHOR21 | This article |
| OVRLAP | Jiang et al. (2015) |
| PS1 | Bañados et al. (2016) |
| PS1MAZ | Mazzucchelli et al. (2017) |
| PSO | Venemans et al. (2015) |
| ULTRA | Wu et al. (2015) |
| VAHIZ | Carnall et al. (2015) |
| VDES | Reed et al. (2017) |
| WISEHI | Wang et al. (2016) |