Ice Core Science Meets Computer Vision: Challenges and Perspectives
Abstract
Polar ice cores play a central role in studies of the earth’s climate system through natural archives. A pressing issue is the analysis of the oldest, highly thinned ice core sections, where the identification of paleoclimate signals is particularly challenging. For this, state-of-the-art imaging by laser-ablation inductively-coupled plasma mass spectrometry (LA-ICP-MS) has the potential to be revolutionary due to its combination of micron-scale 2D chemical information with visual features. However, the quantitative study of record preservation in chemical images raises new questions that call for the expertise of the computer vision community. To illustrate this new inter-disciplinary frontier, we describe a selected set of key questions. One critical task is to assess the paleoclimate significance of single line profiles along the main core axis, which we show is a scale-dependent problem for which advanced image analysis methods are critical. Another important issue is the evaluation of post-depositional layer changes, for which the chemical images provide rich information. Accordingly, the time is ripe to begin an intensified exchange among the two scientific communities of computer vision and ice core science. The collaborative building of a new framework for investigating high-resolution chemical images with automated image analysis techniques will also benefit the already wide-spread application of LA-ICP-MS chemical imaging in the geosciences.
Keywords:
ice core analysis, chemical imaging, laser ablation inductively-coupled plasma mass spectrometry, image analysis, scale spaces, co-localization, grain boundaries
I Introduction
Ice cores drilled on the polar ice sheets are among the most important climate archives, delivering valuable insights into the complexity of our climate system (Fischer et al.,, 2021). With the deposition of snow, additional properties of the atmospheric composition (aerosols, stable water isotopes, etc.) are archived. When snow is transformed to ice, air bubbles are enclosed, providing actual snapshots of the atmosphere of the past and constituting a stand-alone feature of this natural archive. As a result, there exists a chemical and structural stratification of polar ice, which make up the paleoclimatic record. The layering encoding this record is subject to changes with time and depth, as it is not independent from its conserving matrix. In fact, the interaction between the paleoclimatic record and its preserving ice matrix extends from km-scale ice flow over millennia, down to the microscopic scale of interactions between impurities and ice crystals (Faria et al.,, 2010).
As a polycrystal, glacier ice generally consists of a large number of individual crystals (grains), as well as associated microscopic features such as grain boundaries and triple junctions at their intersection. The microscopic localization of impurities with respect to the configuration of grains and their boundaries can crucially affect not only macroscopic deformational properties, but also the paleoclimate records: For instance, diffusion and segregation of soluble impurities into grain boundaries may alter or even destroy the sequence of paleoclimate signals (Rempel et al.,, 2001; Barnes and Wolff,, 2004; Ng,, 2020). Therefore, a quantitative study of the ice stratigraphy at the microscale, in particular the 2D distribution of chemical impurities, is crucial to understand how climate signals have been conserved or transformed, within the flowing ice over tens to hundreds of millennia. This is of particular relevance for the retrieval of novel climate records from the deepest, oldest and thinnest layers, the primary target of the upcoming ambitious “Oldest ice” ice core drillings in Antarctica, which is a grand challenge in the ice core sciences (Brook et al.,, 2006; Fischer et al.,, 2013).
Ice core stratigraphy can be assessed through a variety of methods. The most common approach is direct visual inspection, combined with microstructural analysis of selected ice sections via optical microscopy. Such datasets have revealed new insights into the complexity of the underlying physical processes, challenging established glaciological concepts (Kipfstuhl et al.,, 2009; Faria et al.,, 2014). Initial contact points with automated image analysis have now been developed. Early studies used coaxial reflected light and the birefringed properties of ice in visual images to automatically detect grain boundaries via image segmentation (Arnaud et al.,, 1998; Gay and Weiss,, 1999). For datasets from directed bright-field illumination, a machine learning approach was developed to obtain automatic, reliable classification of ice crystal features (Binder et al.,, 2013). At the microscale, a digital form of optical microscopy was combined with automated image analysis to quantify the collective grain as well as bubble structure (Kipfstuhl et al.,, 2009; Ueltzhöffer et al.,, 2010; Bendel et al.,, 2013). Morcillo et al., (2020) recently employed digital image analysis for a macroscopic counterpart of dark-field microscopy to investigate the optical stratigraphy of an Antarctic ice core.
To fully assess the preservation of the climatic signals represented by the vertical distribution of impurity concentration in ice cores, jointly evaluating the chemical information with visual analysis is key. However, all techniques based on the chemical analysis of ice core meltwater lack the ability to directly assess lateral spatial relations among impurities within the ice, and face fundamental limitations in depth resolution (e.g. Breton et al.,, 2012). To analyze samples in the frozen ice state, scanning electron microscopy/energy dispersive X-ray spectrometry (e.g. Barnes et al.,, 2003; Baker and Cullen,, 2003; Iizuka et al.,, 2009) as well as micro-Raman spectroscopy (e.g. Eichler et al.,, 2019) have been successfully used to determine the location of impurities within the ice matrix and to analyze the chemical composition of individual particles, typically based on spot-like measurements. To evaluate the chemical micro-stratigraphy and its implications for the interpretation of coarser scale meltwater signals calls for continuous 2D information. However, a standard technique in 2D chemical imaging has not yet been established for ice cores.
A highly promising candidate in this regard is laser ablation inductively-coupled plasma mass spectrometry (LA-ICP-MS). LA-ICP-MS uses a laser to ablate a few tenths of micro-liters of ice from the surface, which are subsequently analyzed for various elemental impurity species with a mass spectrometer (Müller et al.,, 2011; Sneed et al.,, 2015; Della Lunga et al.,, 2017; Spaulding et al.,, 2017). Very recently, the application of LA-ICP-MS for 2D chemical imaging in ice cores has been refined and greatly improved (Bohleber et al., 2020a, ). Here high-resolution artifact-free 2D images from state-of-the-art imaging methods (e.g. Wang et al.,, 2013; van Elteren et al.,, 2019) provide an unprecedented density of information; several million laser shots (correlating with chemical measurements) are fired over just a few square mm. A camera co-aligned with the laser then captures visual images of the ice sample surface. By this means, LA-ICP-MS combines chemical and visual information of the ice core microstratigraphy.
The introduction of a new technology establishes the need for better understanding the potential and limitations of these novel high-resolution 2D chemical images of ice cores. As we see new frontiers of multidisciplinary research emerging in this framework, the employment of computer vision methods might be a game-changer for fully exploiting the complexity of the chemical images. In the same fashion as computer vision has lead to advances in medical image analysis, neuroscience, bio-medicine, robotics, object recognition and a host of other areas, the time is ripe for it to revolutionize ice core science. To accelerate this, in this article we begin an inter-disciplinary dialogue. We describe a selected set of key problems in the analysis of chemical images of ice cores as examples of future inter-disciplinary research questions, that can only be successfully tackled in close collaboration with the computer vision community.
II Making chemical images of ice cores
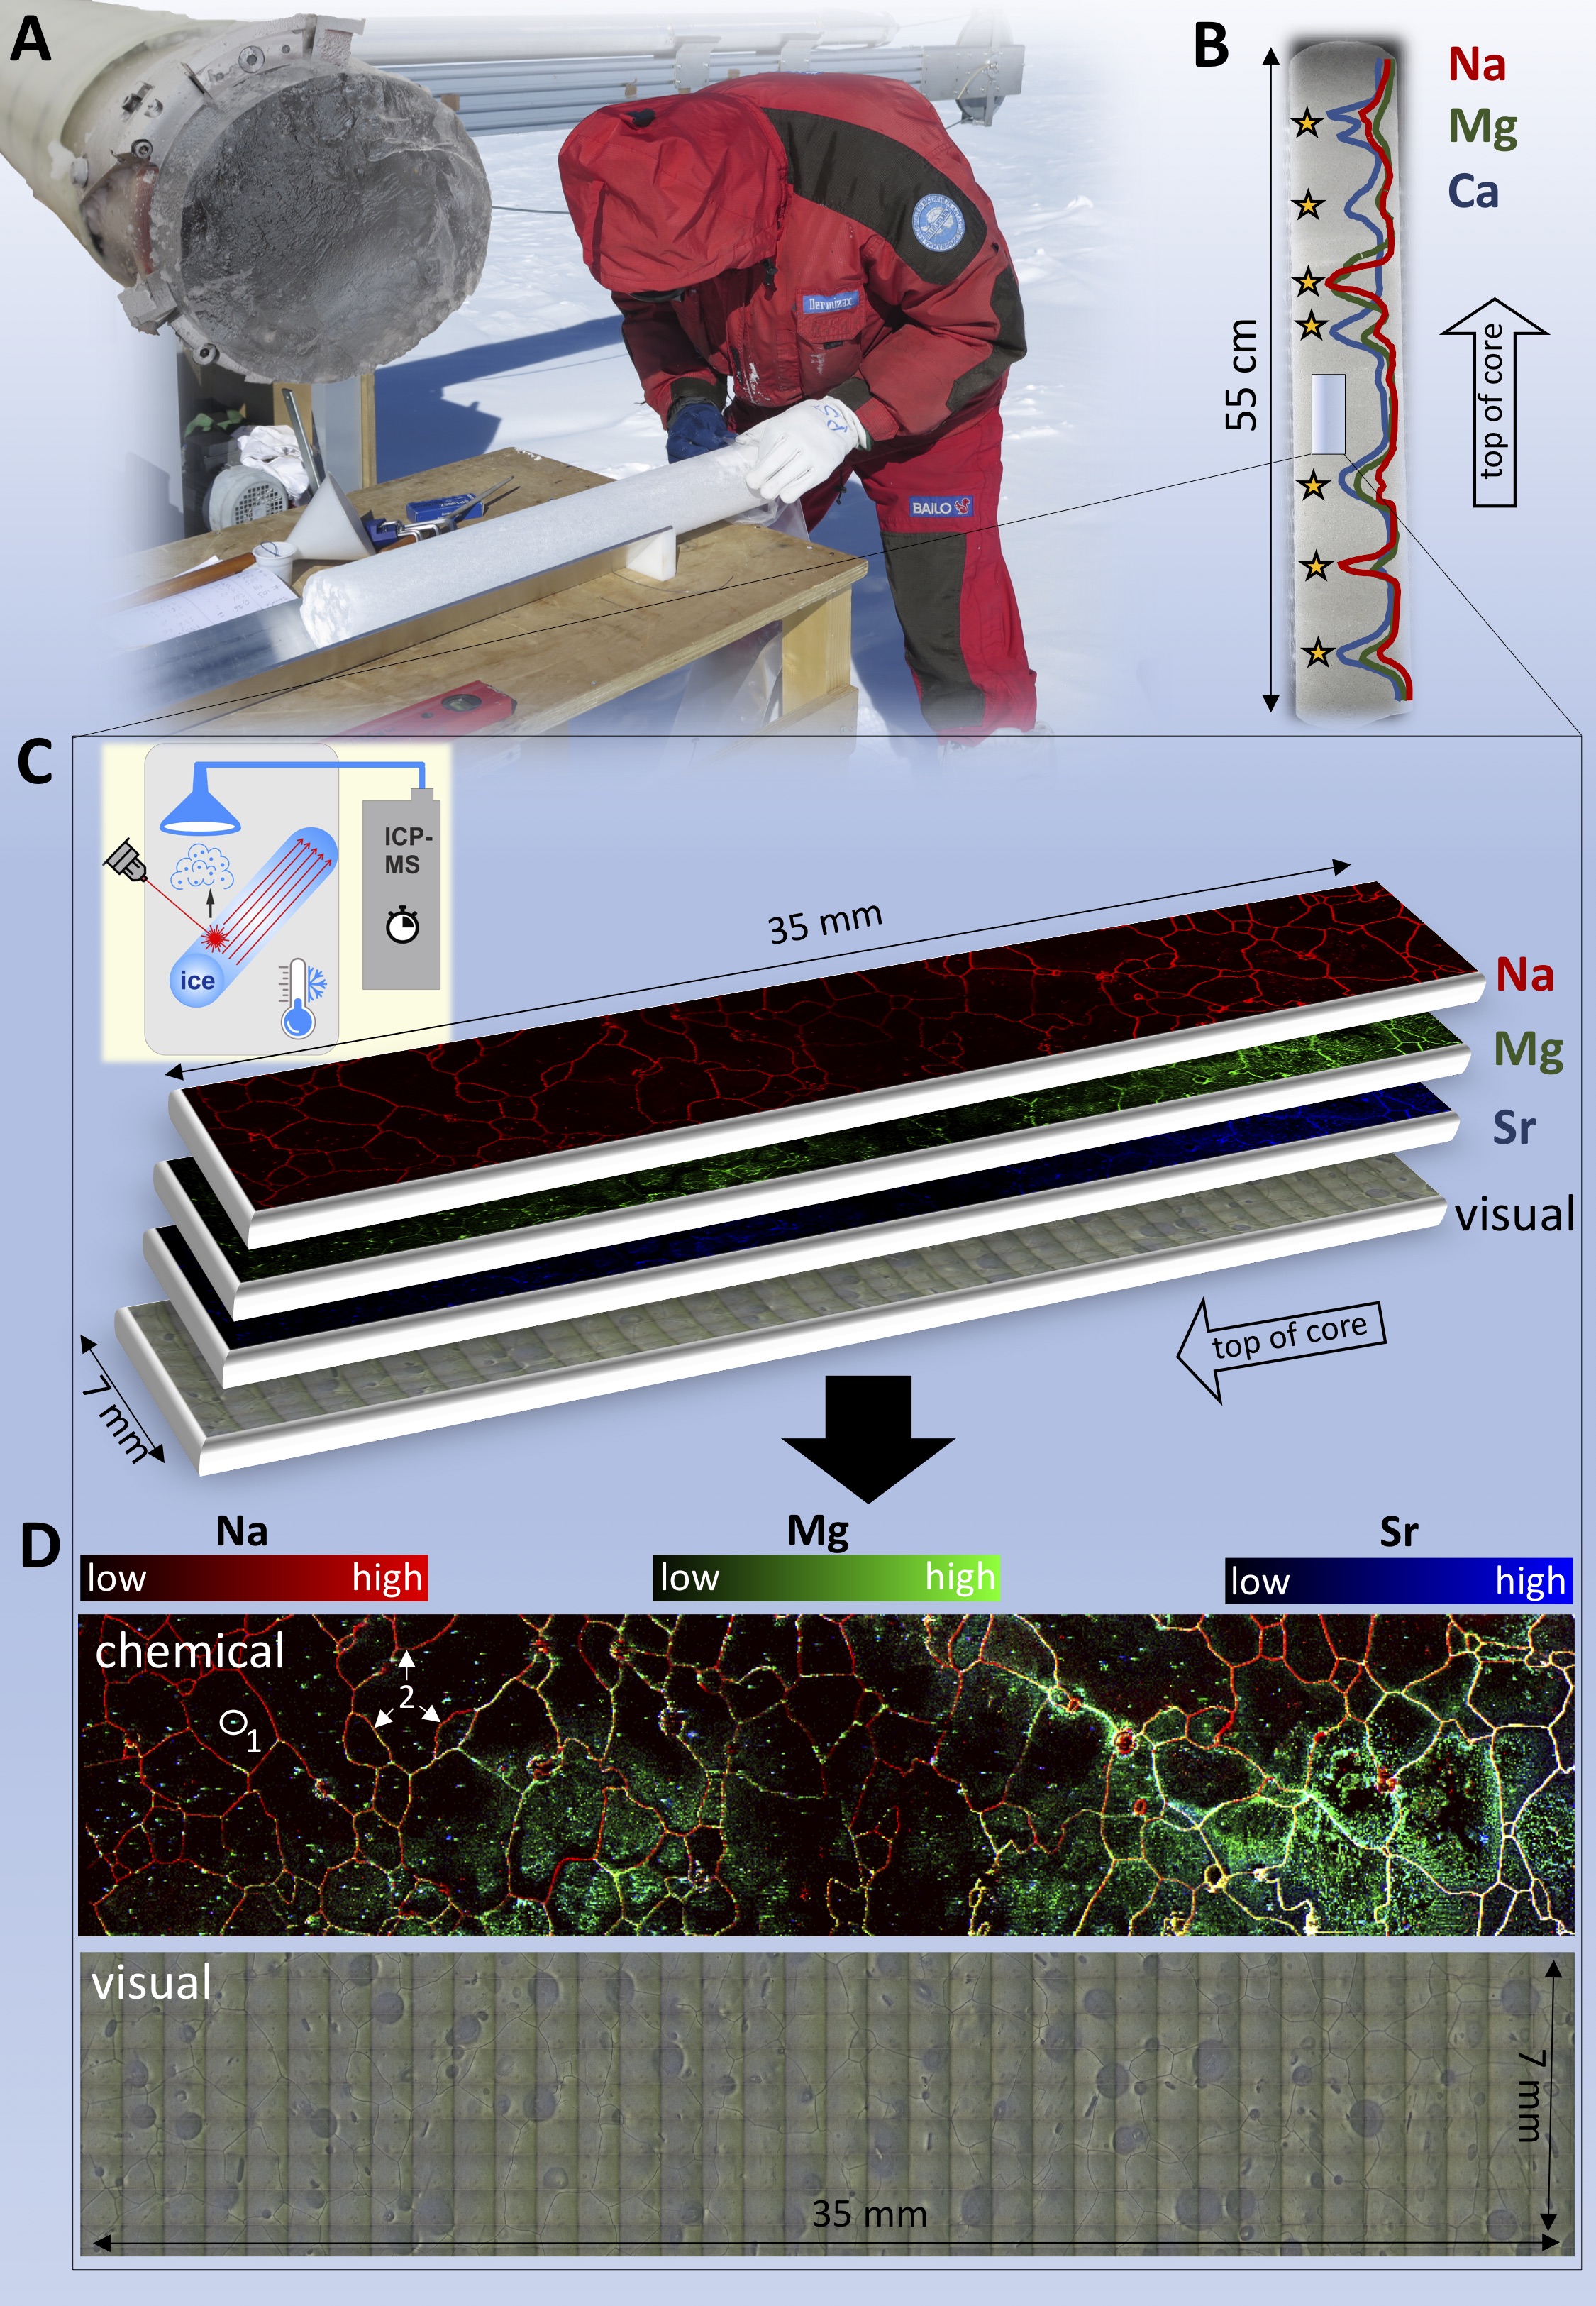
Impurity images are acquired as a pattern of lines, without overlap in the direction perpendicular to that of the scan, and without any further spatial interpolation. Each pixel in an ice core chemical image has a size of 35 µm x 35 µm (Figure 1). For each chemical element a numerical matrix contains rows and columns, according to the physical size of the image: an image of 7 mm x 35 mm in size has 200 rows and 1000 columns. The numerical entries in this matrix refer to either the recorded intensity (e.g. counts per second) or, if a calibration is applied, the concentration (e.g. in parts per million). Due to the careful synchronization, the individual pixels of the different chemical channels can be considered to be almost perfectly spatially aligned. In contrast, the mosaic of visual images obtained from the laser camera is not a-priori aligned with the chemical images. A sample dataset (including the datasets from Figure 1) has been made publicly available (see data availability below). Details on the imaging technique are described elsewhere (Bohleber et al., 2020a, ).
The visual images are generally characterized by air bubbles (dark blobs), grain boundaries (dark lines) and occasional sub-grain boundaries (thin dark lines). In the chemical images, the individual impurity channels generally differ, e.g. through a variable degree of impurity localization at grain boundaries, depending on the depth sections and respective climatic period. The LA-ICP-MS image shown in Figure 1 has been obtained from the EPICA Dome C deep Antarctic ice core, on a sample from a glacial period of about 27.8 thousand years ago. Additional images are presented elsewhere (Bohleber et al., 2020b, ). From a conceptual point of view, Figure 1 is a representative example of the following general image characteristics: i) Small bright spots of a few ten microns occurring within grains as single spots or in small clusters. “Clouds” of such spots are also observed. ii) High intensities reflected in co-localization with the grain boundary network, especially for the Na images. In a typical 7 mm x 35 mm image, tens of grains to a few hundred grains can be distinguished visually. iii) Overall intensity gradients on the mm-scale, showing sections with darker versus brighter intensities.
III Key questions and a role for computer vision
The future technological evolution of LA-ICP-MS ice core analysis promises to increase image size by at least one order of magnitude or more, enabled by large cryocells (Sneed et al.,, 2015) and faster scan speeds (Šala et al.,, 2020). However, in order to keep pace with this expected technological breakthrough an equal advance in data reduction and interpretation is called for. Below we discuss three crucial questions related to signal identification and record preservation, where the application of computer vision methods could lead to breakthroughs.
Question 1: Can scale-space theory assist in extracting paleoclimatic signals?
Previous investigations focused on establishing a meaningful interpretation of the novel LA-ICP-MS signals through a validation against existing meltwater analysis. It was shown that the coarse-scale variability seen in 1D single line profiles of LA-ICP-MS, measured along the main core axis, is consistent with the full resolution signals from meltwater analysis (Della Lunga et al.,, 2017; Spaulding et al.,, 2017). The coarse-scale variability had to be inferred by applying substantial (e.g. Gaussian) smoothing to 1D single line profiles. In this fashion annual layers could be identified (i.e. the chemical contrast between summer and winter snow layers) which were thinned beyond the cm-resolution capabilities of meltwater analysis (Bohleber et al.,, 2018). However, smoothing with a Gaussian simply discards much of the high-resolution signal, and crucial information is potentially lost.
Initial evidence has already suggested a relationship between the fine-scale signal components (e.g. peaks in 1D line profiles) and the grain boundaries (Della Lunga et al.,, 2014; Kerch et al.,, 2015; Beers et al.,, 2020). The new 2D imaging technique has fully revealed the influence of ice crystal features and has demonstrated that, if an impurity species is mostly localized at the grain boundaries (such as Na), it is in turn the grain boundary network that determines the fine-scale signal components in single line profiles (Bohleber et al., 2020a, ). Accordingly, there should exist a hypothetical “sweet spot” in measurement scale, at which the stratigraphic record (e.g. annual layers) is captured at the highest possible resolution, while the imprint of crystal-related features such as grain boundaries is still avoided.
However, the physical scales of stratigraphic layering and ice crystal features are neither constant in depth nor universal among all cores: the stratigraphic layering will become increasingly compressed due to deformation by ice flow. The size of ice grains also varies between glacial and interglacial periods, and can become increasingly large in deep ice due to several processes. Eventually sub-mm (annual) layer thickness can be expected in ice, showing grain diameters exceeding several cm. This means that the localization of impurities at grain boundaries can ultimately erase the original layer sequence. In this case the crystal size becomes an upper limit to the resolution at which the related paleoclimate signals may be interpreted. Accordingly, to separate the imprint of ice crystal features from the stratigraphic layering may not be achievable in all instances, especially once the stratigraphic signal gets corrupted by layer folding, impurity segregation to grain boundaries and migration along the ice vein network.
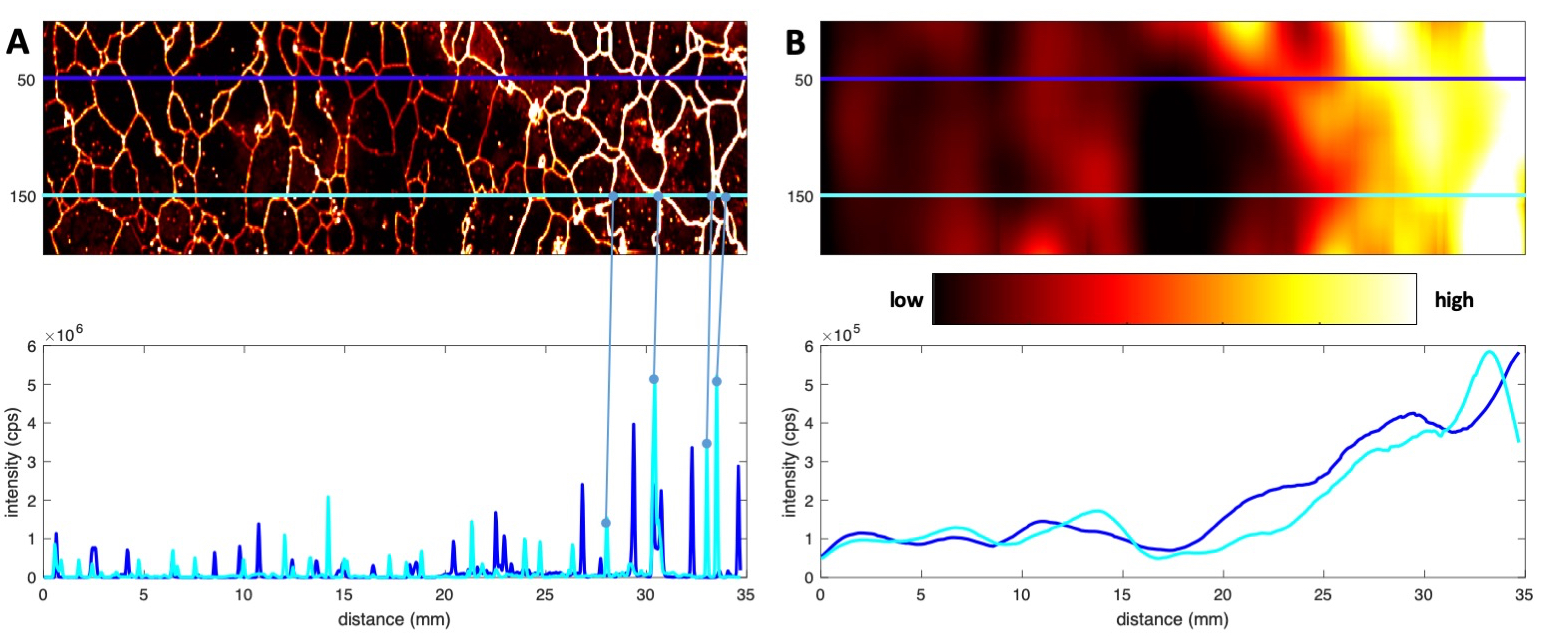
As a starting point to tackle this question, undisturbed ice core sections typically feature a nearly level layer sequence (Svensson et al.,, 2005). In this case, signals related to the stratigraphic layering should not be a primary function of the lateral position of the line profile on the ice core surface (Sneed et al.,, 2015; Della Lunga et al.,, 2017). However, due to the presence of the grain boundary imprint, this does not hold at the high resolution scale, as shown in Figure 2. On the other hand, for the example of the Na image of Figure 1, the grain boundary imprint becomes increasingly blurred until, at a scale of around 1 mm (e.g. the standard deviation of the Gaussian kernel), only the overall intensity gradients of the image remain present. This suggests that the overall intensity gradient is connected to the stratigraphic layering, warranting further investigation. Small-scale folding would corrupt the above criterion, with regard to the lateral signal coherence. An answer cannot come from 1D line profiles alone, but rather requires an analysis of the 2D images.
Evidently, this question has a deep connection to the scale of the image features. Hence, much may be gained from treating this question with scale-space techniques, a well-established field in computer vision (Witkin,, 1983; Koenderink,, 1984; Lindberg,, 1994; Florack et al.,, 1994, 1996; ter Haar Romeny,, 2003; Duits et al.,, 2004; Koenderink,, 2021) for which modern approaches leveraging deep learning are now emerging (Bekkers et al.,, 2018; Romero et al.,, 2020). The expected output from scale-dependent image characterization should allow one to optimize the experimental design to reliably detect the stratigraphic layer signal at the highest possible resolution. This can mean determining the physical resolution of analysis, such as the laser spot size, and determining the number of and lateral spacing between the parallel lines needed - ideally including a criterion for the detection of small-scale folding.
Question 2: What do image features reveal about the ice core record?
Detecting, counting and classifying grain boundaries, triple junctions and spot-type image features along the chemical image dimensions can offer new and improved way of extracting chemical information. For instance, marine and terrestrial sources of insoluble particles have been distinguished based on a classification according to the multi-elemental composition (Oyabu et al.,, 2020). For the chemical images such a classification is a complex task that needs to be performed automatically, or it will be intractable with growing image size. Thus, this is another area where expertise from computer vision will be instrumental in overcoming the present limitations.
The chemical images also offer new options for the investigation of post-depositional chemical reactions. As a concrete example in this regard, meltwater analysis of a deep Antarctic ice core revealed that sharp sulfate spikes showed an “anomalous” chemical composition, which was explained by the post-depositional formation of soluble particles of magnesium sulfate salts in grain boundaries (Traversi et al.,, 2009). The latter process would imply the co-localization of Mg and Ca in grain boundaries. Chemical images can provide new insights about whether the co-occurrence of impurities in meltwater analysis is in fact a result of their co-localization at grain boundaries. Since the chemical images will, for the foreseeable future, only cover a small representative section of a typical sample melted for analysis (e.g. approximately 1 m long, cross-section typically 3 cm × 3 cm (Röthlisberger et al.,, 2000)) a meaningful way of extrapolation and upscaling is needed when attempting a direct comparison to meltwater techniques. In this context, macroscopic variables derived from the images can be compared more easily to those of other datasets. Examples of such variables are grain size and shape as well as the spatial density and chemical signature of insoluble particles (related to spot-type features). This can be compared, e.g. to visual datasets, volume particle concentration derived from macroscopic meltwater analysis and to the glacio-chemical characterization of other techniques.
Using image features (Zhou et al.,, 2016) in concert with tools including co-localization analysis, image segmentation (Kass et al.,, 1988; Malladi et al.,, 1995; Chan and Vese,, 2001; Long et al.,, 2015; Ronneberger et al.,, 2015) clustering (Shi and Malik,, 2000; Ng et al.,, 2002; Pavan and Pelillo,, 2007) and object detection (Ren et al.,, 2015) can provide a foundation for performing such analysis in a quantitative manner. For instance, to assess the layer integrity, an algorithm must determine i) the degree of localization of an impurity species at the grain boundaries and weigh ii) the average size of the grains against iii) the thickness of the stratigraphic layering of interest. The latter data (expected nominal thickness of annual layers etc.) can typically come from existing datasets from glaciological and ice core analyses.
Question 3: Can computer vision help to test existing theories of impurity diffusion?
Although this third problem may not be solvable based on the images thus far available, it is of central relevance to ongoing and future efforts to retrieve paleoclimate information from deep ice. Diffusion of impurities along ice veins (triple junctions) due to concentration gradients of soluble species or chemical competition leads to the broadening of peak-like signals (Barnes and Wolff,, 2004). There is also the case of “anomalous diffusion” which can lead to peak displacement along the main core axis (Rempel et al.,, 2001). In a recent theoretical advance it has been shown that diffusive impurity transport along ice veins will lead to an effect much like low-pass filtering on 1-D signals (Ng,, 2020).
Whether the diffusive becomes strong enough to affect the paleoclimate signals evidently depend on two factors: i) the relative degree of localization at triple junction (i.e. most of the impurities need to be located there) and ii) the connectedness of the ice vein network (vs. blockages or void areas). In principle, both of these factors can be constrained through the chemical images. The degree of connectedness of the ice vein network could be evaluated using a 3D approach. For this purpose, 2D images are stacked together, either in consecutive ablation or after removing a surface layer manually by scraping/polishing the surface (Van Malderen et al.,, 2017). The latter choice appears more realistic considering that the ice layer ablated by a single image has a thickness in the micron-range. This means that building a 3D model of the ice vein network may require some interpolation or statistical treatment of all detected triple junctions.
IV Outlook
Expertise in computer vision, pattern recognition and machine learning will be critical to exploit the full potential of the chemical imaging for addressing the key challenges in deep Antarctic ice. In the short term, the examples presented here already highlight valuable starting points. These concern automatically capturing statistical information and carrying out chemical classification, and predicting the scale at which the stratigraphic layering may be preserved. As the chemical images continue to grow in size, so will the urgency to address these issues. Regarding a vision for a prolonged long term partnership between ice core and computer science, it can be envisaged that, once initial algorithms have been developed, a next step could involve further automation, e.g. to train a machine learning algorithm to recognize instances of stratigraphic layer disturbances in the chemical images. This would result in a similar machine-based assistance as in state-of-the-art medical diagnostics. In this way, computer vision has the potential to lead to a permanent transformation in the manner that chemical stratigraphy in polar ice cores is investigated.
Conflict of Interest Statement
The authors declare that the research was conducted in the absence of any commercial or financial relationships that could be construed as a potential conflict of interest.
Author Contributions
All authors contributed to the discussion and the writing of the manuscript. PB, MR and CB established the ice core chemical imaging. MP conceived the original idea behind this manuscript.
Funding
PB gratefully acknowledges funding from the European Union’s Horizon 2020 research and innovation programme under the Marie Skłodowska-Curie grant agreement No. 790280. KS is grateful to the Natural Sciences and Engineering Research Council of Canada (NSERC) for research funding. This publication was generated in the frame of Beyond EPICA. The project has received funding from the European Union’s Horizon 2020 research and innovation programme under grant agreement No. 815384 (Oldest Ice Core). It is supported by national partners and funding agencies in Belgium, Denmark, France, Germany, Italy, Norway, Sweden, Switzerland, The Netherlands and the United Kingdom. Logistic support is mainly provided by PNRA and IPEV through the Concordia Station system. The opinions expressed and arguments employed herein do not necessarily reflect the official views of the European Union funding agency or other national funding bodies. This is Beyond EPICA publication number XX.
Acknowledgments
The authors thank Ciprian Stremtan and Alessandro Bonetto for their continued technical support.
Data Availability Statement
The underlying datasets presented in this study will be made available via a public data repository (Pangaea) after completion of the peer-review process.
References
- Arnaud et al., (1998) Arnaud, L., Gay, M., Barnola, J.-M., and Duval, P. (1998). Imaging of firn and bubbly ice in coaxial reflected light: a new technique for the characterization of these porous media. Journal of Glaciology, 44(147):326–332.
- Baker and Cullen, (2003) Baker, I. and Cullen, D. (2003). Sem/eds observations of impurities in polar ice: artifacts or not? Journal of Glaciology, 49(165):184–190.
- Barnes and Wolff, (2004) Barnes, P. R. and Wolff, E. W. (2004). Distribution of soluble impurities in cold glacial ice. Journal of Glaciology, 50(170):311–324.
- Barnes et al., (2003) Barnes, P. R., Wolff, E. W., Mallard, D. C., and Mader, H. M. (2003). Sem studies of the morphology and chemistry of polar ice. Microscopy research and technique, 62(1):62–69.
- Beers et al., (2020) Beers, T. M., Sneed, S. B., Mayewski, P. A., Kurbatov, A. V., and Handley, M. J. (2020). Triple junction and grain boundary influences on climate signals in polar ice. arXiv preprint arXiv:2005.14268.
- Bekkers et al., (2018) Bekkers, E. J., Lafarge, M. W., Veta, M., Eppenhof, K. A., Pluim, J. P., and Duits, R. (2018). Roto-translation covariant convolutional networks for medical image analysis. In International conference on medical image computing and computer-assisted intervention, pages 440–448. Springer.
- Bendel et al., (2013) Bendel, V., Ueltzhöffer, K. J., Freitag, J., Kipfstuhl, S., Kuhs, W. F., Garbe, C. S., and Faria, S. H. (2013). High-resolution variations in size, number and arrangement of air bubbles in the epica dml (antarctica) ice core. Journal of Glaciology, 59(217):972–980.
- Binder et al., (2013) Binder, T., Garbe, C. S., Wagenbach, D., Freitag, J., and Kipfstuhl, S. (2013). Extraction and parametrization of grain boundary networks in glacier ice, using a dedicated method of automatic image analysis. Journal of microscopy, 250(2):130–141.
- Bohleber et al., (2018) Bohleber, P., Erhardt, T., Spaulding, N., Hoffmann, H., Fischer, H., and Mayewski, P. (2018). Temperature and mineral dust variability recorded in two low-accumulation alpine ice cores over the last millennium. Climate of the Past, 14(1):21–37.
- (10) Bohleber, P., Roman, M., Šala, M., and Barbante, C. (2020a). Imaging the impurity distribution in glacier ice cores with la-icp-ms. Journal of Analytical Atomic Spectrometry, 35(10):2204–2212.
- (11) Bohleber, P., Roman, M., Šala, M., Delmonte, B., Stenni, B., and Barbante, C. (2020b). Two-dimensional impurity imaging in deep antarctic ice cores: Snapshots of three climatic periods and implications for high-resolution signal interpretation. The Cryosphere Discussions, pages 1–21.
- Breton et al., (2012) Breton, D. J., Koffman, B. G., Kurbatov, A. V., Kreutz, K. J., and Hamilton, G. S. (2012). Quantifying signal dispersion in a hybrid ice core melting system. Environmental science & technology, 46(21):11922–11928.
- Brook et al., (2006) Brook, E. J., Wolff, E., Dahl-Jensen, D., Fischer, H., Steig, E. J., et al. (2006). The future of ice coring: international partnerships in ice core sciences (ipics). PAGES news, 14(1):6–10.
- Chan and Vese, (2001) Chan, T. F. and Vese, L. A. (2001). Active contours without edges. IEEE Transactions on image processing, 10(2):266–277.
- Della Lunga et al., (2014) Della Lunga, D., Müller, W., Rasmussen, S. O., and Svensson, A. (2014). Location of cation impurities in ngrip deep ice revealed by cryo-cell uv-laser-ablation icpms. Journal of Glaciology, 60(223):970–988.
- Della Lunga et al., (2017) Della Lunga, D., Müller, W., Rasmussen, S. O., Svensson, A., and Vallelonga, P. (2017). Calibrated cryo-cell uv-la-icpms elemental concentrations from the ngrip ice core reveal abrupt, sub-annual variability in dust across the gi-21.2 interstadial period. The Cryosphere, 11(3):1297–1309.
- Duits et al., (2004) Duits, R., Florack, L., De Graaf, J., and ter Haar Romeny, B. (2004). On the axioms of scale space theory. Journal of Mathematical Imaging and Vision, 20(3):267–298.
- Eichler et al., (2019) Eichler, J., Weikusat, C., Wegner, A., Twarloh, B., Behrens, M., Fischer, H., Hörhold, M., Jansen, D., Kipfstuhl, S., Ruth, U., et al. (2019). Impurity analysis and microstructure along the climatic transition from mis 6 into 5e in the edml ice core using cryo-raman microscopy. Frontiers in Earth Science, 7:20.
- Faria et al., (2010) Faria, S. H., Freitag, J., and Kipfstuhl, S. (2010). Polar ice structure and the integrity of ice-core paleoclimate records. Quaternary Science Reviews, 29(1-2):338–351.
- Faria et al., (2014) Faria, S. H., Weikusat, I., and Azuma, N. (2014). The microstructure of polar ice. part i: Highlights from ice core research. Journal of Structural Geology, 61:2–20.
- Fischer et al., (2021) Fischer, H., Blunier, T., and Mulvaney, R. (2021). Ice cores: Archive of the climate system. In Glaciers and Ice Sheets in the Climate System, pages 279–325. Springer.
- Fischer et al., (2013) Fischer, H., Severinghaus, J., Brook, E., Wolff, E., and Albert, M. (2013). Where to find 1.5 million yr old ice for the ipics” oldest ice” ice core. Climate of the Past, 9:2489–2505.
- Florack et al., (1996) Florack, L., Romeny, B. T. H., Viergever, M., and Koenderink, J. (1996). The gaussian scale-space paradigm and the multiscale local jet. International Journal of Computer Vision, 18(1):61–75.
- Florack et al., (1994) Florack, L. M., ter Haar Romeny, B. M., Koenderink, J. J., and Viergever, M. A. (1994). Linear scale-space. Journal of Mathematical Imaging and Vision, 4(4):325–351.
- Gay and Weiss, (1999) Gay, M. and Weiss, J. (1999). Automatic reconstruction of polycrystalline ice microstructure from image analysis: application to the epica ice core at dome concordia, antarctica. Journal of Glaciology, 45(151):547–554.
- Iizuka et al., (2009) Iizuka, Y., Miyake, T., Hirabayashi, M., Suzuki, T., Matoba, S., Motoyama, H., Fujii, Y., and Hondoh, T. (2009). Constituent elements of insoluble and non-volatile particles during the last glacial maximum exhibited in the dome fuji (antarctica) ice core. Journal of Glaciology, 55(191):552–562.
- Kass et al., (1988) Kass, M., Witkin, A., and Terzopoulos, D. (1988). Snakes: Active contour models. International Journal of Computer Vision, 1(4):321–331.
- Kerch et al., (2015) Kerch, J., Spaulding, N., and Bohleber, P. (2015). Laser ablation icp-ms on kcc microstructure-pilot study.
- Kipfstuhl et al., (2009) Kipfstuhl, S., Faria, S. H., Azuma, N., Freitag, J., Hamann, I., Kaufmann, P., Miller, H., Weiler, K., and Wilhelms, F. (2009). Evidence of dynamic recrystallization in polar firn. Journal of Geophysical Research: Solid Earth, 114(B5).
- Koenderink, (2021) Koenderink, J. (2021). The structure of images: 1984–2021. Biological Cybernetics.
- Koenderink, (1984) Koenderink, J. J. (1984). The structure of images. Biological Cybernetics, 50:363–370.
- Lindberg, (1994) Lindberg, T. (1994). Scale-Space Theory in Computer Vision. Springer, Dordrecht.
- Long et al., (2015) Long, J., Shelhamer, E., and Darrell, T. (2015). Fully convolutional networks for semantic segmentation. In IEEE Conference on Computer Vision and Pattern Recognition, CVPR 2015, Boston, MA, USA, June 7-12, 2015, pages 3431–3440. IEEE Computer Society.
- Malladi et al., (1995) Malladi, R., Sethian, J. A., and Vemuri, B. C. (1995). Shape modeling with front propagation: A level set approach. IEEE transactions on pattern analysis and machine intelligence, 17(2):158–175.
- Morcillo et al., (2020) Morcillo, G., Faria, S. H., and Kipfstuhl, S. (2020). Unravelling antarctica’s past through the stratigraphy of a deep ice core: an image-analysis study of the epica-dml line-scan images. Quaternary International, 566:6–15.
- Müller et al., (2011) Müller, W., Shelley, J. M. G., and Rasmussen, S. O. (2011). Direct chemical analysis of frozen ice cores by uv-laser ablation icpms. Journal of Analytical Atomic Spectrometry, 26(12):2391–2395.
- Ng et al., (2002) Ng, A., Jordan, M., and Weiss, Y. (2002). On spectral clustering: Analysis and an algorithm. In Dietterich, T., Becker, S., and Ghahramani, Z., editors, Advances in Neural Information Processing Systems, volume 14, pages 849–856. MIT Press.
- Ng, (2020) Ng, F. S. (2020). Pervasive diffusion of climate signals recorded in ice-vein ionic impurities. The Cryosphere Discussions, pages 1–38.
- Oyabu et al., (2020) Oyabu, I., Iizuka, Y., Kawamura, K., Wolff, E., Severi, M., Ohgaito, R., Abe-Ouchi, A., and Hansson, M. (2020). Compositions of dust and sea salts in the dome c and dome fuji ice cores from last glacial maximum to early holocene based on ice-sublimation and single-particle measurements. Journal of Geophysical Research: Atmospheres, 125(4):e2019JD032208.
- Pavan and Pelillo, (2007) Pavan, M. and Pelillo, M. (2007). Dominant sets and pairwise clustering. IEEE Transactions on Pattern Analysis and Machine Intelligence, 29(1):167–172.
- Rempel et al., (2001) Rempel, A., Waddington, E., Wettlaufer, J., and Worster, M. (2001). Possible displacement of the climate signal in ancient ice by premelting and anomalous diffusion. Nature, 411(6837):568–571.
- Ren et al., (2015) Ren, S., He, K., Girshick, R., and Sun, J. (2015). Faster R-CNN: Towards real-time object detection with region proposal networks. In Cortes, C., Lawrence, N., Lee, D., Sugiyama, M., and Garnett, R., editors, Advances in Neural Information Processing Systems, volume 28. Curran Associates, Inc.
- Romero et al., (2020) Romero, D., Bekkers, E., Tomczak, J., and Hoogendoorn, M. (2020). Attentive group equivariant convolutional networks. In International Conference on Machine Learning, pages 8188–8199. PMLR.
- Ronneberger et al., (2015) Ronneberger, O., Fischer, P., and Brox, T. (2015). U-net: Convolutional networks for biomedical image segmentation. In Navab, N., Hornegger, J., Wells, W. M., and Frangi, A. F., editors, Medical Image Computing and Computer-Assisted Intervention – MICCAI 2015, pages 234–241, Cham. Springer International Publishing.
- Röthlisberger et al., (2000) Röthlisberger, R., Bigler, M., Hutterli, M., Sommer, S., Stauffer, B., Junghans, H. G., and Wagenbach, D. (2000). Technique for continuous high-resolution analysis of trace substances in firn and ice cores. Environmental Science & Technology, 34(2):338–342.
- Šala et al., (2020) Šala, M., Šelih, V. S., Stremtan, C. C., and van Elteren, J. T. (2020). Analytical performance of a high-repetition rate laser head (500 hz) for hr la-icp-qms imaging. Journal of Analytical Atomic Spectrometry.
- Shi and Malik, (2000) Shi, J. and Malik, J. (2000). Normalized cuts and image segmentation. IEEE Transactions on Pattern Analysis and Machine Intelligence, 22(8):888–905.
- Sneed et al., (2015) Sneed, S. B., Mayewski, P. A., Sayre, W., Handley, M. J., Kurbatov, A. V., Taylor, K. C., Bohleber, P., Wagenbach, D., Erhardt, T., and Spaulding, N. E. (2015). New la-icp-ms cryocell and calibration technique for sub-millimeter analysis of ice cores. Journal of glaciology, 61(226):233–242.
- Spaulding et al., (2017) Spaulding, N. E., Sneed, S. B., Handley, M. J., Bohleber, P., Kurbatov, A. V., Pearce, N. J., Erhardt, T., and Mayewski, P. A. (2017). A new multielement method for la-icp-ms data acquisition from glacier ice cores. Environmental science & technology, 51(22):13282–13287.
- Svensson et al., (2005) Svensson, A., Nielsen, S. W., Kipfstuhl, S., Johnsen, S. J., Steffensen, J. P., Bigler, M., Ruth, U., and Röthlisberger, R. (2005). Visual stratigraphy of the north greenland ice core project (northgrip) ice core during the last glacial period. Journal of Geophysical Research: Atmospheres, 110(D2).
- ter Haar Romeny, (2003) ter Haar Romeny, B. M. (2003). Front-end vision and multi-scale image analysis. Kluwer Academic Publ. Dordrecht.
- Traversi et al., (2009) Traversi, R., Becagli, S., Castellano, E., Marino, F., Rugi, F., Severi, M., Angelis, M. d., Fischer, H., Hansson, M., Stauffer, B., et al. (2009). Sulfate spikes in the deep layers of epica-dome c ice core: Evidence of glaciological artifacts. Environmental science & technology, 43(23):8737–8743.
- Ueltzhöffer et al., (2010) Ueltzhöffer, K. J., Bendel, V., Freitag, J., Kipfstuhl, S., Wagenbach, D., Faria, S. H., and Garbe, C. S. (2010). Distribution of air bubbles in the edml and edc (antarctica) ice cores, using a new method of automatic image analysis. Journal of Glaciology, 56(196):339–348.
- van Elteren et al., (2019) van Elteren, J. T., Šelih, V. S., and Šala, M. (2019). Insights into the selection of 2d la-icp-ms (multi) elemental mapping conditions. Journal of Analytical Atomic Spectrometry, 34(9):1919–1931.
- Van Malderen et al., (2017) Van Malderen, S. J., Laforce, B., Van Acker, T., Vincze, L., and Vanhaecke, F. (2017). Imaging the 3d trace metal and metalloid distribution in mature wheat and rye grains via laser ablation-icp-mass spectrometry and micro-x-ray fluorescence spectrometry. Journal of Analytical Atomic Spectrometry, 32(2):289–298.
- Wang et al., (2013) Wang, H. A., Grolimund, D., Giesen, C., Borca, C. N., Shaw-Stewart, J. R., Bodenmiller, B., and Günther, D. (2013). Fast chemical imaging at high spatial resolution by laser ablation inductively coupled plasma mass spectrometry. Analytical chemistry, 85(21):10107–10116.
- Witkin, (1983) Witkin, A. (1983). Scale-space filtering. In Proceedings of the Eighth International Joint Conference on Artificial Intelligence (IJCAI’83), volume 2, pages 1019–1022.
- Zhou et al., (2016) Zhou, B., Khosla, A., A., L., Oliva, A., and Torralba, A. (2016). Learning Deep Features for Discriminative Localization. CVPR.