Model LineUpper: Supporting Interactive Model Comparison at Multiple Levels for AutoML
Abstract.
Automated Machine Learning (AutoML) is a rapidly growing set of technologies that automate the model development pipeline by searching model space and generating candidate models. A critical, final step of AutoML is human selection of a final model from dozens of candidates. In current AutoML systems, selection is supported only by performance metrics. Prior work has shown that in practice, people evaluate ML models based on additional criteria, such as the way a model makes predictions. Comparison may happen at multiple levels, from types of errors, to feature importance, to how the model makes predictions of specific instances. We developed Model LineUpper to support interactive model comparison for AutoML by integrating multiple Explainable AI (XAI) and visualization techniques. We conducted a user study in which we both evaluated the system and used it as a technology probe to understand how users perform model comparison in an AutoML system. We discuss design implications for utilizing XAI techniques for model comparison and supporting the unique needs of data scientists in comparing AutoML models.
1. Introduction
Although Machine Learning (ML) technologies have permeated numerous domains, development cost and expertise barriers for building ML models remain high (Krensky et al., 2020; Mao et al., 2020). Automated Machine Learning (AutoML) technologies have reduced development costs by generating optimized ML models using novel model selection, feature engineering, and hyperparameter optimization algorithms (Zöller and Huber, 2019; Liu et al., 2020; Wang et al., 2021a). Recently, AutoML technologies have matured from development efforts at technology companies (Google, [n.d.]; H2O, [n.d.]; IBM, [n.d.]). A research field is also emerging on the study and development of tools that support user interactions with AutoML systems (Wang et al., [n.d.], 2019; Wang et al., 2021a). This work demonstrates the importance of retaining human agency in AutoML workflows (Lee et al., 2019; Wang et al., [n.d.]; Wang et al., 2020; Wang et al., 2021b). Users desire transparency features to understand how AutoML works (Weidele et al., 2020; Drozdal et al., 2020), as well as control features to make adjustments based on their prior knowledge (Wang et al., [n.d.]).
Existing tools for AutoML focus on procedural transparency (Wang et al., [n.d.]; Weidele et al., 2020; Drozdal et al., 2020), showing the process by which AutoML searches through algorithmic and optimization spaces. This approach aims to provide assurance that the search was thorough, and allows to adjust the search space configuration. But, it remains questionable whether AutoML users, especially less experienced data scientists (like data workers in (Hou and Wang, 2017)), could act on adjusting the AutoML process. Few systems provide algorithmic transparency, showing how AutoML-generated models work, such as how they weigh features and judge specific instances. Most AutoML systems use performance metrics as basis for model evaluation and ranking. However, research on model analytics and comparison of manually-built models has shown that none of the stakeholders are satisfied to only see performance metrics (Muller et al., 2019; Sun et al., [n.d.]; Zhang et al., [n.d.]; Wang et al., 2021a; Piorkowski et al., 2021). They are interested in details such as types of errors, how models perform on specific instances, and a detailed reasoning by which models make predictions.
These observations have motivated recent work to leverage visualization techniques from Explainable AI (XAI) to support model analytics and debugging (Hohman et al., [n.d.]; Kahng et al., 2017; Brooks et al., 2015; Strobelt et al., 2018; Krause et al., 2016). XAI techniques allow us to understand the inner-workings of an ML model. But, the amount of human effort required to scrutinize an ML model is high, and is exacerbated in the AutoML context in which dozens of models may be produced from a single experiment. Also, it is unclear how users of AutoML conduct model comparison, since some candidate models tend to be similar variants of one another with differences in optimization choices.
We introduce Model LineUpper, a visualization tool that provides transparency into candidate models generated by AutoML. Model LineUpper allows users to interactively compare AutoML models based on multiple aspects of their function and behavior. In a user study with 14 data scientists, we learned that Model LineUpper helped participants select models based on different criteria such as types of errors and alignment with domain knowledge. Our work highlights the need for algorithmic transparency, evaluates how XAI techniques can support this need, and sheds light on the unique design requirements of AutoML systems.
2. Model LineUpper
The design of Model LineUpper was informed by prior work on model comparison outside of AutoML context (Sun et al., [n.d.]; Wang et al., [n.d.]; Zhang et al., [n.d.]), as well as many discussions with expert AutoML users. Current AutoML systems (IBM, [n.d.]; H2O, [n.d.]) provide users with overall model performance metrics, but treat individual models as opaque boxes. Our design goal is to enable users to open the opaque boxes and engage in model comparison based on: 1) selected instances of interest or subsets of data; and 2) explanations of how models make predictions. Recent work has introduced instance-level investigation (Alsallakh et al., 2014; Amershi et al., 2015; Choo et al., 2010; Ren et al., [n.d.]) and XAI techniques (Hohman et al., [n.d.]; Brooks et al., 2015; Google PAIR, 2018) for model analytics tools, demonstrating their effectiveness in supporting debugging tasks for a single model, and engendering user trust and confidence in the final outcome. But, with one recent exception (Zhang et al., [n.d.]), these two capabilities have not been utilized for model comparison.
To support explainability and instance-level investigation, Model LineUpper consists of three views, seen in Figure 1: (a) metrics table, (b) feature importance comparison view, and (c) probability scatterplot matrix. In addition, there are legends for the plots and a control panel that allows users to select models to be displayed.
We use a loan risk modeling task to illustrate the functions of Model LineUpper and conduct the user study, while in practice the system works with other data and tasks. The models were generated by IBM’s AutoML system, and were trained with a subset of data published by the LendingClub Corporation (LendingClub, [n.d.]). Our data set has 47 features and 11,553 instances, each representing a loan application. The model’s task is to predict the grade of application (likelihood of repayment). We created a balanced binary label that indicates whether a loan was high grade (Grades A and B in the original dataset) or low grade (Grades C to G). As AutoML iteratively applies variations of optimization to different ML algorithms, Model LineUpper indicates the algorithm and optimization variants in the model name. For example, “LGBM_2: Hyperparameter Optimization” indicates a light gradient boosted model (LGBM) with type 2 optimization (hyperparameter optimization).
2.0.1. Metrics Table
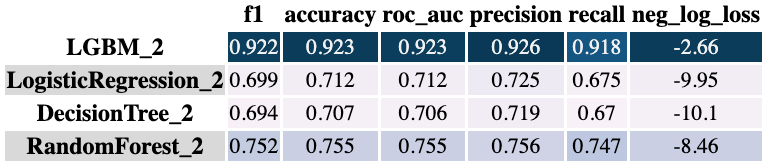
The metrics table (Figure 1(a)) supports comparing models by overall performance metrics. The set of metrics vary based on type of prediction task (e.g., classification vs. regression). For binary classification tasks, Model LineUpper computes common metrics such as F1, accuracy, ROC AUC, etc. Each row corresponds to one model that user has selected to compare. The cells are shaded based on the ranking of values within a column, which guides the comparison and suggests cells for further examination.
2.0.2. Feature Importance Comparison View
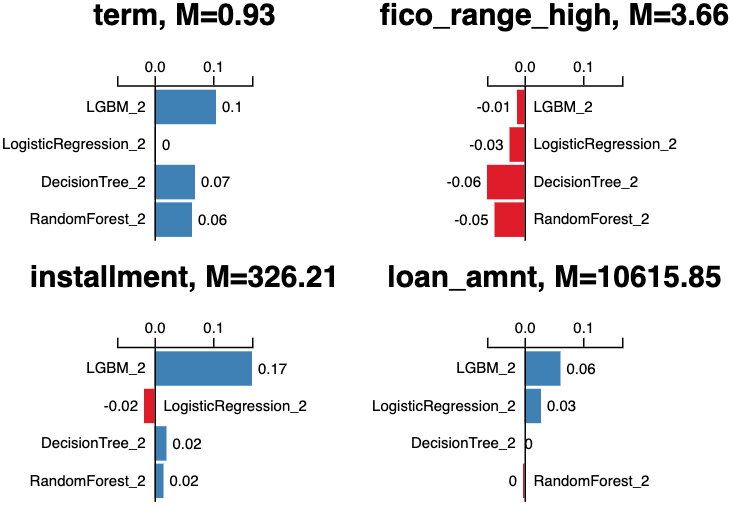
Feature importance (FI) is a popular XAI technique that explains a model by how much impact each feature has on its predictions (Štrumbelj and Kononenko, 2014; Ribeiro et al., 2016). FI can act as both global and local explanations: global FI shows how the model weighs different features in general, whereas local FI explains a model’s prediction for a specific instance based on how the model weighed that instance’s features. The FI comparison view (Figure 1(b)) can shift between showing global FI, when no instance is selected, and local FI, when user selects data points in the probability scatterplot matrix (Section 2.0.3). Global FI values are obtained via SciKit-Learn’s (Pedregosa et al., 2011) feature_importances_ when available, or in the case of regression models, taking the absolute value of feature weights. These values are then normalized to allow comparison across different algorithms. Local FI values are generated using the SHAP Python library (Lundberg and Lee, 2017), which produces sensitivity-analysis based explanations (Štrumbelj and Kononenko, 2014).
To support comparing FI across models, we visualize FI values of all models for a single feature in one panel and sort the panels by average global FI. When a group of points are selected, we plot average local FI value of them for each feature. We also show average feature value of the selected points in the title. In Figure 1(b), the selected points have an average installment of $326.21. The LGBM model considers their installment scores to be a positive indicator of a high-grade loan, whereas other models consider the scores to be somewhat neutral.
2.0.3. Probability Scatterplot Matrix
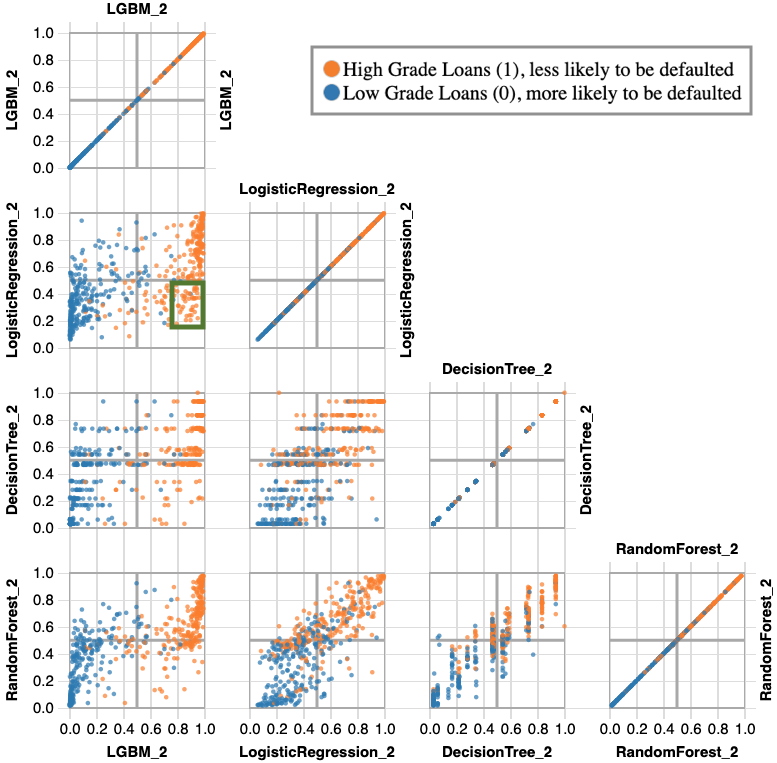
The matrix is inspired by Manifold (Zhang et al., [n.d.]), which supports comparison of model pairs and identifies instances of potential interest. In Figure 1(c), each single panel shows predicted probabilities of instances in the test data set for target class (high grade loans) by a model pair. Each dot represents a data instance, and its coordinates correspond to probability that the instance is predicted to be high grade by the two models. The quadrants and color coding present the true/false positives/negatives of the two models’ predictions. They show instances on which the two models agree (quadrants 1 and 3) or disagree (quadrants 2 and 4). A blue dot in quadrant 1 indicates a false positive error for both models, whereas a blue dot in quadrant 2 indicates a false positive error for just the model on the axis. The distribution pattern of the dots helps to compare the confidence of two models, as denser lines at the ends of an axis indicate a more confident model corresponding to the axis (LGBM model in Figure 1(c)).
The matrix serves as an entry point for instance-level investigation, which could be useful for users as they might not be as familiar with their data as when they manually create a model. Users can brush to select data points of interest. These data points would remain colored in all scatterplots, graying out all other data points. The FI comparison view is correspondingly updated to show local FI of the selected data points, providing further insight. Figure 1(b) shows FI of points inside the green rectangle of Figure 1(c). This region is in quadrant 4 and has many orange points. These points were correctly classified by LGBM_2 but incorrectly by LogisticRegression_2. Further examination of the local FI plots suggests that LogisticRegression_2 might have a tendency of making mistakes by under-weighing the installment and term features.
3. User Study
Our user study served two purposes: evaluate the design of Model LineUpper, and use it as a technology probe to understand how AutoML users engage in model comparison tasks. We designed a scenario-based contextual inquiry in which we asked participants to perform the role of a data scientist building an ML model to help loan officers evaluate loan applicants. Participants were presented with 16 models generated by IBM’s AutoML system (4 optimization variants applied to 4 algorithms). They were asked to use Model LineUpper to select the best model. To emphasize different comparison criteria, we gave multiple scenarios in which a stakeholder expressed different preferences and asked participants to reconsider their choice. The scenarios included: 1) an executive pointed out that they would prefer an interpretable model; 2) a loan officer commented that it is important that the model’s rationale aligns with what features it pays attention to; and 3) an executive emphasized importance of avoiding making loans to people who are likely to default (lower the false positive rate). We asked participants to think aloud as they conducted the comparison tasks and inquired about their thinking when appropriate.
We recruited 14 data scientists from different divisions within an international information technology company. 57.1% of them reported having 1-5 years of experience working as data scientists (28.6% over 5 years, 14.3% less than a year). All were experienced with visualization, and all but one had experience with explainability techniques.
To familiarize participants with Model LineUpper, we sent them a tutorial video before the interview. We began the study by asking participants to explore the interface for 5 minutes, then trained them further through a task of identifying the model with the highest accuracy and understanding how another model compares to it. We then gave them the three comparison scenarios in order. After finishing the scenarios, we interviewed participants for 10-15 minutes about their experience with Model LineUpper and their thoughts on it. Lastly, participants filled out a short survey of our tool, which included the System Usability Scale (Bangor et al., 2008). All interviews were conducted remotely over video conferencing and were recorded and automatically transcribed. We conducted qualitative coding on the interview transcripts while watching the videos to understand users’ activities.
4. Results
Participants gave high ratings to usability of Model LineUpper, of 5 on the SUS. They found global FI feature to be the most useful, , followed by scatterplot matrix, , and then the feature to select data points to see local FI, . Below, we first describe how participants used the features of Model LineUpper, then discuss emergent themes on unique design requirements for AutoML model comparison.
4.0.1. Feature Importance Comparison View
All participants investigated the global FI and used it to support their choices. For the second scenario to pick a model that is agreeable for loan officers, most participants narrowed down to a small subset of models, and then used global FI to break the tie by favoring models that heavily weighed features such as FICO score or number of trades in the past 2 years. Two participants used FI to verify that the model they intended to select did not exclude important features for the lending domain. Our current visual design compares FI values from all models for one feature. Participants suggested ways to make cross-feature comparison more intuitive, such as by highlighting a selected model’s FI values across all feature panels or allowing feature panels to be sorted by FI of a selected model. In some variants, AutoML applies feature transformation and indicates transformation in the name, such as log_ or _pca_. This convention caused some confusion and we noticed that some participants misunderstood situations when a model weighed the transformed feature. It may have been necessary to group related transformed features and provide more information on what AutoML did during optimization. Only a small number of participants explored local FI information. One participant brushed to select data points on which the best candidate made wrong predictions in order to examine why. Some commented that they “didn’t feel the complexity of the task is high enough to use this,” since they might not have cared why a model made wrong predictions.
4.0.2. Probability Scatterplot Matrix
Participants welcomed the idea of having all models compared in one visual display and being able to slice the data by brushing. Most participants quickly grasped that the scatterplots could help them compare confidences of models and different types of errors amongst them. Some used it to verify that the model they intended to choose was more confident in its predictions by examining distribution of dots. For scenario of lowering false positives, participants used scatterplots to reason about different types of errors. One participant paid attention to the diagonal of the last-column plots (where the and axes are for the same model) and looked for a “clean upper right corner.” However, the coordinate system was initially confusing for some participants, akin to the finding in Zhang et al. ([n.d.]) that training is needed for users to understand these plots and what the dot distribution patterns mean. Interpretation of plots is more challenging in the AutoML context, since different ML algorithms with distinct distributions are being compared (some decision tree and random forest models have discrete probabilities, while others have continuous probabilities). Models with discrete probabilities also created visual clutter on the plots. Several participants suggested to show the number of points in each quadrant or brushing selection. Some wished to see raw data when selecting individual points on the plots, or select instances from a data table and highlight them in the plots. These comments suggest that AutoML users are interested in zooming in on specific instances. Since they may not be as familiar with the data when using AutoML compared to hand-crafting a model, a visual display of the instance space could help them identify instances of interest.
4.0.3. Design Recommendations
From our qualitative analysis, we identify four areas of user needs around model comparison that should be supported specifically for AutoML.
Enable multi-criteria comparison with multiple levels of model details. Our study demonstrates that the optimal choice in an AutoML search space could be determined by many criteria, which challenges the current practice of AutoML recommending the “best” model based solely on performance metrics. While our study intentionally introduced criteria regarding types of errors, interpretability, and model reasoning aligning with domain knowledge, participants incorporated additional criteria such as confidence and reasons for errors. Two participants also commented that computational budget may also be an important criterion. We asked participants if they had experience with model comparison in their own work (not limited to AutoML), and majority confirmed so and commented that it is often done by examining performance only because turn-around time for programmatically-manipulating the data and generating comparative plots is steep. Given the importance of model comparison tasks in AutoML, it is necessary to provide various comparative measures in an interactive and speedy manner. When given a large number of models generated by AutoML, participants used a variety of comparative reasoning strategies: narrowing-down choices, breaking a close tie, reasoning about trade-offs amongst criteria, and verifying a choice to strengthen confidence.
Support understanding data. One user need repeatedly mentioned in interviews is to better understand the data: types of features, their range and distribution, and example data instances. While a lack of knowledge about data is an artifact of the study setup, it could also represent the reality for AutoML users, as they are no longer required to spend time understanding the data. Data scientists frequently utilize model transparency features as lenses to understand their data (Drozdal et al., 2020; Hohman et al., [n.d.]). In AutoML, tools such as Model LineUpper could be the primary place for users to get in touch with their data and retain a sense of agency in the modeling task.
Enable comparison across algorithms and optimization methods. The set of models generated by AutoML have an innate hierarchical structure as AutoML iteratively applies optimization variants to different ML algorithms. Participants had a tendency of focusing on comparing one selected variation across different algorithms, but also showed interest in understanding how an optimization variant changed a model’s behavior. Visualizations that group models by their base algorithm and by optimization variant could allow users to understand the impact of optimization at a glance. However, making comparisons between models that use distinct ML algorithms could impose nuanced design requirements that an AutoML tool should carefully consider in order to be generalizable.
Combine algorithmic and procedural transparency. Participants showed intertwined needs between understanding how AutoML generated models work, and how they were generated, such as which optimization methods were applied and which parameter values were used. This procedural information is necessary for users to make sense of hierarchical structure of models to perform comparative analysis like understanding the meaning of a transformed feature and different rationales between model variants. When seeing a sub-optimal FI value of a preferred model, a participant expressed interest in “tweaking how AutoML does feature engineering,” suggesting a holistic understanding of algorithmic and procedural operations could facilitate better user control of AutoML.
5. Conclusion
To support model comparison for AutoML in which users may apply diverse context-specific criteria, Model LineUpper utilizes linked visualizations of data instances and feature importance. Our study highlights the need to help AutoML users understand detailed behaviors of machine-created models, and shows users’ complex reasoning strategies and nuanced requirements resulting from the unique structure and building process of AutoML models. Future work should explore supporting a more structured model comparison workflow to help users navigate these complexities.
Acknowledgements.
This work was supported by the Rensselaer-IBM AI Research Collaboration (http://airc.rpi.edu), part of the IBM AI Horizons Network (http://ibm.biz/AIHorizons).References
- (1)
- Alsallakh et al. (2014) Bilal Alsallakh, Allan Hanbury, Helwig Hauser, Silvia Miksch, and Andreas Rauber. 2014. Visual Methods for Analyzing Probabilistic Classification Data. IEEE Transactions on Visualization and Computer Graphics 20, 12 (Dec. 2014), 1703–1712. https://doi.org/10/f6qj3c
- Amershi et al. (2015) Saleema Amershi, Max Chickering, Steven M. Drucker, Bongshin Lee, Patrice Simard, and Jina Suh. 2015. ModelTracker: Redesigning Performance Analysis Tools for Machine Learning. In Proceedings of the 33rd Annual ACM Conference on Human Factors in Computing Systems (CHI ’15). Association for Computing Machinery, New York, NY, USA, 337–346. https://doi.org/10/ggscn5
- Bangor et al. (2008) Aaron Bangor, Philip T Kortum, and James T Miller. 2008. An empirical evaluation of the system usability scale. Intl. Journal of Human–Computer Interaction 24, 6 (2008), 574–594.
- Brooks et al. (2015) Michael Brooks, Saleema Amershi, Bongshin Lee, Steven M. Drucker, Ashish Kapoor, and Patrice Simard. 2015. FeatureInsight: Visual Support for Error-Driven Feature Ideation in Text Classification. In 2015 IEEE Conference on Visual Analytics Science and Technology (VAST). IEEE, Chicago, IL, USA, 105–112. https://doi.org/10/ggscqd
- Choo et al. (2010) Jaegul Choo, Hanseung Lee, Jaeyeon Kihm, and Haesun Park. 2010. iVisClassifier: An Interactive Visual Analytics System for Classification Based on Supervised Dimension Reduction. In 2010 IEEE Symposium on Visual Analytics Science and Technology. 27–34. https://doi.org/10/c6gcb3
- Drozdal et al. (2020) Jaimie Drozdal, Justin Weisz, et al. 2020. Exploring Information Needs for Establishing Trust in Automated Data Science Systems. In IUI’20. ACM, in press.
- Google ([n.d.]) Google. [n.d.]. Cloud AutoML. Retrieved 3-April-2019 from https://cloud.google.com/automl/
- Google PAIR (2018) Google PAIR. 2018. What-If Tool. https://pair-code.github.io/what-if-tool/.
- H2O ([n.d.]) H2O. [n.d.]. H2O. Retrieved 3-April-2019 from https://h2o.ai
- Hohman et al. ([n.d.]) Fred Hohman, Andrew Head, Rich Caruana, Robert DeLine, and Steven M. Drucker. [n.d.]. Gamut: A Design Probe to Understand How Data Scientists Understand Machine Learning Models. In Proceedings of the 2019 CHI Conference on Human Factors in Computing Systems - CHI ’19 (Glasgow, Scotland Uk, 2019). ACM Press, 1–13. https://doi.org/10/ggcn2m
- Hou and Wang (2017) Youyang Hou and Dakuo Wang. 2017. Hacking with NPOs: collaborative analytics and broker roles in civic data hackathons. Proceedings of the ACM on Human-Computer Interaction 1, CSCW (2017), 53.
- IBM ([n.d.]) IBM. [n.d.]. AutoAI. Retrieved 06-Oct-2019 from https://www.ibm.com/cloud/watson-studio/autoai
- Kahng et al. (2017) Minsuk Kahng, Pierre Y Andrews, Aditya Kalro, and Duen Horng Polo Chau. 2017. Activis: Visual exploration of industry-scale deep neural network models. IEEE transactions on visualization and computer graphics 24, 1 (2017), 88–97.
- Krause et al. (2016) Josua Krause, Adam Perer, and Kenney Ng. 2016. Interacting with predictions: Visual inspection of black-box machine learning models. In Proceedings of the 2016 CHI Conference on Human Factors in Computing Systems. 5686–5697.
- Krensky et al. (2020) Peter Krensky, Pieter den Harner, Erick Brethenoux, Jim Hare, Svetlana Sicular, and Shubhangi Vashisth. 2020. Magic Quadrant for data science and machine-learning platforms. Gartner, Inc (2020).
- Lee et al. (2019) Doris Jung-Lin Lee, Stephen Macke, Doris Xin, Angela Lee, Silu Huang, and Aditya Parameswaran. 2019. A Human-in-the-loop Perspective on AutoML: Milestones and the Road Ahead. Data Engineering (2019), 58.
- LendingClub ([n.d.]) LendingClub. [n.d.]. LendingClub Statistics. https://www.lendingclub.com/info/statistics.action
- Liu et al. (2020) Sijia Liu, Parikshit Ram, Deepak Vijaykeerthy, Djallel Bouneffouf, Gregory Bramble, Horst Samulowitz, Dakuo Wang, Andrew Conn, and Alexander G Gray. 2020. An ADMM Based Framework for AutoML Pipeline Configuration.. In AAAI. 4892–4899.
- Lundberg and Lee (2017) Scott M Lundberg and Su-In Lee. 2017. A Unified Approach to Interpreting Model Predictions. In Advances in Neural Information Processing Systems 30, I. Guyon, U. V. Luxburg, S. Bengio, H. Wallach, R. Fergus, S. Vishwanathan, and R. Garnett (Eds.). Curran Associates, Inc., 4765–4774.
- Mao et al. (2020) Yaoli Mao, Dakuo Wang, Michael Muller, Kush Varshney, Ioana Baldini, Casey Dugan, and Aleksandra Mojsilovic. 2020. How Data Scientists Work Together With Domain Experts in Scientific Collaborations. In Proceedings of the 2020 ACM conference on GROUP. ACM.
- Muller et al. (2019) Michael Muller, Ingrid Lange, Dakuo Wang, David Piorkowski, Jason Tsay, Q. Vera Liao, Casey Dugan, and Thomas Erickson. 2019. How Data Science Workers Work with Data: Discovery, Capture, Curation, Design, Creation. In Proceedings of the 2019 CHI Conference on Human Factors in Computing Systems (Glasgow, UK) (CHI ’19). ACM, New York, NY, USA, Forthcoming.
- Pedregosa et al. (2011) F. Pedregosa, G. Varoquaux, A. Gramfort, V. Michel, B. Thirion, O. Grisel, M. Blondel, P. Prettenhofer, R. Weiss, V. Dubourg, J. Vanderplas, A. Passos, D. Cournapeau, M. Brucher, M. Perrot, and E. Duchesnay. 2011. Scikit-Learn: Machine Learning in Python. Journal of Machine Learning Research 12 (2011), 2825–2830.
- Piorkowski et al. (2021) David Piorkowski, Soya Park, April Yi Wang, Dakuo Wang, Michael Muller, and Felix Portnoy. 2021. How AI Developers Overcome Communication Challenges in a Multidisciplinary Team: A Case Study. In Proceedings of the CSCW 2021.
- Ren et al. ([n.d.]) Donghao Ren, Saleema Amershi, Bongshin Lee, Jina Suh, and Jason D. Williams. [n.d.]. Squares: Supporting Interactive Performance Analysis for Multiclass Classifiers. 23, 1 ([n. d.]), 61–70. https://doi.org/10/f9zx4t
- Ribeiro et al. (2016) Marco Tulio Ribeiro, Sameer Singh, and Carlos Guestrin. 2016. ”Why Should I Trust You?”: Explaining the Predictions of Any Classifier. In Proceedings of the 22Nd ACM SIGKDD International Conference on Knowledge Discovery and Data Mining (KDD ’16). ACM, New York, NY, USA, 1135–1144. https://doi.org/10/gfgrbd
- Strobelt et al. (2018) Hendrik Strobelt, Sebastian Gehrmann, Hanspeter Pfister, and Alexander M. Rush. 2018. LSTMVis: A Tool for Visual Analysis of Hidden State Dynamics in Recurrent Neural Networks. IEEE Transactions on Visualization and Computer Graphics 24, 1 (Jan. 2018), 667–676. https://doi.org/10/gcp7b5
- Štrumbelj and Kononenko (2014) Erik Štrumbelj and Igor Kononenko. 2014. Explaining Prediction Models and Individual Predictions with Feature Contributions. Knowledge and Information Systems 41, 3 (Dec. 2014), 647–665. https://doi.org/10.1007/s10115-013-0679-x
- Sun et al. ([n.d.]) Dong Sun, Zezheng Feng, Yuanzhe Chen, Yong Wang, Jia Zeng, Mingxuan Yuan, Ting-Chuen Pong, and Huamin Qu. [n.d.]. DFSeer: A Visual Analytics Approach to Facilitate Model Selection for Demand Forecasting. In Proceedings of the 2020 CHI Conference on Human Factors in Computing Systems (Honolulu, HI, USA, 2020-04-21) (CHI ’20). Association for Computing Machinery, 1–13. https://doi.org/10.1145/3313831.3376866
- Wang et al. (2021a) Dakuo Wang, Josh Andres, Justin Weisz, Erick Oduor, and Casey Dugan. 2021a. AutoDS: Towards Human-Centered Automation of Data Science. In Proceedings of the CHI 2021.
- Wang et al. (2021b) Dakuo Wang, Q. Vera Liao, Yunfeng Zhang, Udayan Khurana, Horst Samulowitz, Soya Park, Michael Muller, and Lisa Amini. 2021b. How Much Automation Does a Data Scientist Want?. In pre-print.
- Wang et al. (2020) Dakuo Wang, Parikshit Ram, Daniel Karl I Weidele, Sijia Liu, Michael Muller, Justin D Weisz, Abel Valente, Arunima Chaudhary, Dustin Torres, Horst Samulowitz, et al. 2020. AutoAI: Automating the End-to-End AI Lifecycle with Humans-in-the-Loop. In Proceedings of the 25th International Conference on Intelligent User Interfaces Companion. 77–78.
- Wang et al. (2019) Dakuo Wang, Justin D. Weisz, Michael Muller, Parikshit Ram, Werner Geyer, Casey Dugan, Yla Tausczik, Horst Samulowitz, and Alexander Gray. 2019. Human-AI Collaboration in Data Science: Exploring Data Scientists’ Perceptions of Automated AI. To appear in Computer Supported Cooperative Work (CSCW) (2019).
- Wang et al. ([n.d.]) Qianwen Wang, Yao Ming, Zhihua Jin, Qiaomu Shen, Dongyu Liu, Micah J. Smith, Kalyan Veeramachaneni, and Huamin Qu. [n.d.]. ATMSeer: Increasing Transparency and Controllability in Automated Machine Learning. In Proceedings of the 2019 CHI Conference on Human Factors in Computing Systems (Glasgow, Scotland Uk, 2019-05-02) (CHI ’19). Association for Computing Machinery, 1–12. https://doi.org/10/ggcn2s
- Weidele et al. (2020) Daniel Weidele, Justin Weisz, Erick Oduor, Michael Muller, Josh Andres, Alexander Gray, and Dakuo Wang. 2020. AutoAIViz: Opening the Blackbox of Automated Artificial Intelligence with Conditional Parallel Coordinates. In IUI’20. ACM, in press.
- Zhang et al. ([n.d.]) Jiawei Zhang, Yang Wang, Piero Molino, Lezhi Li, and David S. Ebert. [n.d.]. Manifold: A Model-Agnostic Framework for Interpretation and Diagnosis of Machine Learning Models. 25, 1 ([n. d.]), 364–373. https://doi.org/10/ggsr89 arXiv:1808.00196
- Zöller and Huber (2019) Marc-André Zöller and Marco F Huber. 2019. Survey on Automated Machine Learning. arXiv preprint arXiv:1904.12054 (2019).