Keck Cosmic Web Imager Observations of He II Emission in I Zw 18
Abstract
With a metallicity of 12+Log(O/H) , I Zw 18 is a canonical low metallicity blue compact dwarf (BCD) galaxy. A growing number of BCDs, including I Zw 18, have been found to host strong, narrow-lined, nebular He II (4686) emission with enhanced intensities compared to H (e.g. He II()/H ). We present new observations of I Zw 18 using the Keck Cosmic Web Imager. These observations reveal two nebular He II emission regions (or He III regions) northwest and southeast of the He III region in the galaxy’s main body investigated in previous studies. All regions exhibit He II()/H greater than . The two newly resolved He III regions lie along an axis which intercepts the position of I Zw 18’s Ultra-luminous X-ray (ULX) source. We explore whether the ULX could power the two He III regions via shock activity and/or beamed X-ray emission. We find no evidence of shocks from the gas kinematics. If the ULX powers the two regions, the X-ray emission would need to be beamed. Another potential explanation is that a class of early-type Nitrogen-rich Wolf-Rayet stars with low winds could power the two He III regions, in which case the alignment with the ULX would be coincidental.
1 Introduction
Narrow-lined, nebular He II() emission (He II emission) is observed in an increasing number of Blue Compact Dwarf (BCD) galaxies. Emission from He II arises from the recombination of doubly-ionized Helium, which requires energetic photons 54 eV. Although there have been several studies into the origin of He II emission (Garnett et al., 1991; Izotov & Thuan, 1998; Cerviño et al., 2002; Thuan & Izotov, 2005; Kehrig et al., 2011; Shirazi & Brinchmann, 2012; Kehrig et al., 2015, 2018; Schaerer et al., 2019; Senchyna et al., 2020) the source(s) of the required ionizing flux remains uncertain.
Of the BCDs that exhibit He II emission, I Zw 18 is of unique interest as it is relatively nearby ( Mpc; Aloisi et al., 2007), corresponding to a distance modulus of 31.3 Mag, and has one of the lowest metallicities, 12+Log(O/H) (Rickards Vaught et al. in prep, Searle & Sargent, 1972; Izotov & Thuan, 1999; Kehrig et al., 2016, and references therein). He II emission in I Zw 18 has a history of being observed via single-slit spectroscopy (Bergeron, 1977; Garnett et al., 1991; Izotov et al., 1997; Izotov & Thuan, 1998; Vílchez & Iglesias-Páramo, 1998) which has the disadvantage of sparse spatial sampling. Recently, integral field spectroscopy (IFS) of I Zw 18 has spatially resolved the extent of He II emission near the NW stellar cluster (Kehrig et al., 2015).
I Zw 18 also hosts an X-ray Binary (XRB), near this He III region. The first reported X-ray luminosity, , of this XRB, via Chandra imaging (Bomans & Weis, 2002), was erg s-1 in the keV band (Thuan & Izotov, 2005). Kehrig et al. (2015) modeled the XRB contribution to the He II luminosity, , and found that the predicted is weaker then their observed value. However, deeper XMM-Newton imaging and analysis of the XRB by Kaaret & Feng (2013) report a keV band luminosity, 1040 ergs s-1, with a harder spectrum than observed with Chandra. With ergs s-1 this XRB is considered an Ultra-luminous X-ray (ULX) source (Pakull et al., 2006; Kaaret & Feng, 2013). Although the best fit to the XMM-Newton spectrum, assuming sub-Eddington accretion, suggests a black hole with mass (Kaaret & Feng, 2013), recent work suggests that a significant fraction of ULXs are instead stellar-mass binary systems undergoing super-Eddington accretion (King & Lasota, 2020, and references therein). Recently, infrared observations and photoionization modeling by Lebouteiller et al. (2017) suggest that I Zw 18’s neutral gas heating can be explained by this single XRB, if the yr time averaged is 4 1040 ergs s-1.
In our deeper, higher angular and velocity resolution Keck Cosmic Web Imager (KCWI) observations, we detect two additional He III regions in I Zw 18. These regions are NW and SE of the emission reported by Kehrig et al. (2015), and lie along an axis that intercepts the position of I Zw 18’s ULX. The alignment may be coincidental or may suggest that the ULX powers these two regions. We describe our observations and data reduction in Section 2. Our emission line fitting is detailed in Section 2.3. Section 3 outlines how we determine the position of the ULX source. We present our results in Section 4. We discuss possible ionizing sources of the two newly resolved He III regions in Section 5. We conclude this letter in Section 6.
2 Observations and Data Analysis
2.1 Archival Data
Several archival datasets are used in the course of analyzing our KCWI observations. We downloaded archival Hubble Space Telescope111Based on observations made with the NASA/ESA Hubble Space Telescope, and obtained from the Hubble Legacy Archive, which is a collaboration between the Space Telescope Science Institute (STScI/NASA), the Space Telescope European Coordinating Facility (ST-ECF/ESA) and the Canadian Astronomy Data Centre (CADC/NRC/CSA). (HST) images in the F439W and F814W filters (Program ID: 5434, 10586) as well as r-band Sloan Digital Sky Survey (SDSS, Abazajian et al., 2003) images of I Zw 18 (Fields: 157, 158, 238, and 239). To compare with the ULX in I Zw 18, we also downloaded Chandra X-ray imaging of the galaxy (Bomans & Weis, 2002).
2.2 KCWI Observations and Data Reduction
The IFS data were taken in clear conditions on December 25th, 2017 using KCWI installed on the 10-meter Keck II Telescope. We used the small slicer and BL grating centered at 4550 Å with a usable spectral range of 3700-5500 Å. The spectral resolution, R3600 corresponds to a full-width-half-max (FWHM) Å at 4550Å. The slice width is 0.35″. Each pointing covers a field of view (FoV) 8.5″ perpendicular and 20.4″ parallel to the slicer. Using images of the standard star Feige 34, taken in the same conditions, we measured the FWHM of the point spread function to be .
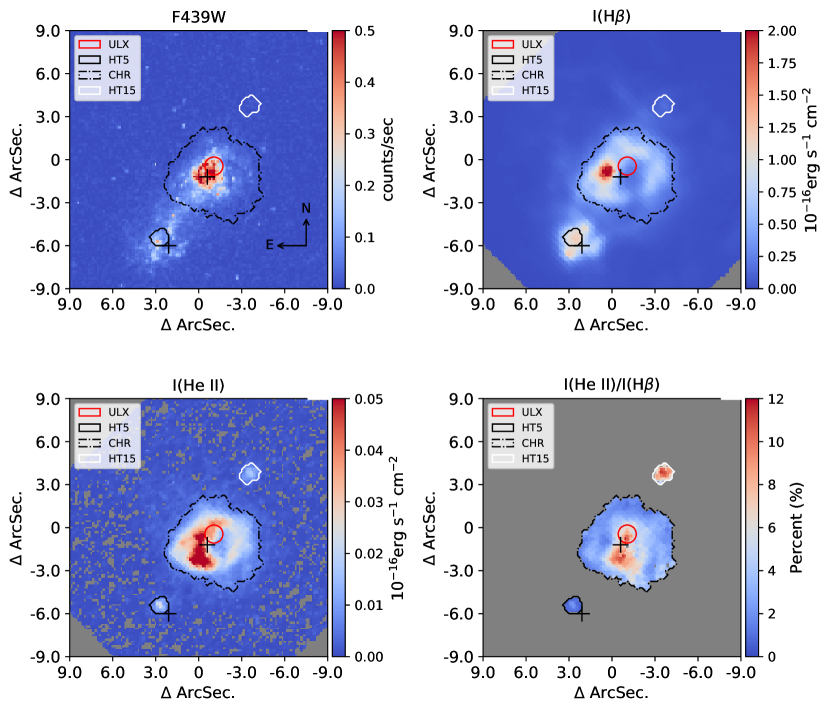
The main body of I Zw 18 comprises two stellar clusters (IZW18-NW and IZW18-SE, Skillman & Kennicutt, 1993), shown in Figure 1, and is not covered by a single instrumental FoV. To cover the galaxy, we observed I Zw 18 with 4 pointings. The exposure per image was 1200s. To remove the background sky spectrum in each pointing, we integrated for 600s on an “off” galaxy position between science exposures. We chose the nearest in time sky spectrum to scale and subtract from each science frame. The data were reduced and flux calibrated with the standard star Feige 34 using Version 1.2.1 of the KCWI Data Extraction Reduction Pipeline222https://github.com/Keck-DataReductionPipelines/KcwiDRP (Morrissey et al., 2018). The reduced cubes are astrometrically aligned to the HST F814W image, and then placed on a common grid, with pixel size 0.15″ 0.15″, using the astronomical mosaic image engine Montage333http://montage.ipac.caltech.edu in combination with custom Python scripts. A description of these steps will be presented in Rickards Vaught et al. (in prep).
2.3 Emission Line Fitting
Two-dimensional emission line maps were created using LZIFU (Ho et al., 2016). LZIFU simultaneously fits a single (or multi) component Gaussian model to multiple emission lines in a spectrum. The stellar contribution is fit using an implementation of the penalized pixel fitting routine (pPFX, Cappellari & Emsellem, 2004). To determine if the observed He II emission line has distinct kinematics, we perform separate LZIFU fits specifically for He II and H alone. These resulting maps are shown in Figures 1 and 2.
3 Astrometry of the ULX Source
To establish how the ULX in I Zw 18 impacts the strength of He II emission it is necessary to determine the location of the ULX. To achieve this, we follow the X-ray source detection procedure in Thuan et al. (2004)444We run the CIAO, v4.12, wavelet algorithm WAVDETECT on a 0.5-10 keV image, with a probability threshold set to .. Next, we overlay the Chandra source region file on top of r-band SDSS images. We chose to match to SDSS imaging rather than HST images because the SDSS imaging covers a larger portion of the Chandra FoV. We are to able determine the positional offsets between the optical/X-ray positions using 5 X-Ray sources matched to SDSS optical counterparts with RMS scatter of . Because the astrometry of our KCWI data is anchored to the F814W HST image, we then compute off-sets using a multitude of bright sources in both our SDSS and F814W image. The resulting RMS scatter of the offsets is . The position of the ULX in the KCWI image is found after applying the above offsets directly to the Chandra position of the ULX. The final co-ordinates, (9h34m1.97s, +55d34m28.33s), place the ULX near IZW18-NW, consistent with the position reported in Thuan et al. (2004), with RMS scatter . The position of the ULX source as it compares to H and He II emission555The position of the ULX shown in Kehrig et al. (2021) agree, within the positional uncertainties, with this work. is shown in Figure 1.
4 Results
4.1 3 He III Regions
Our KCWI observations detect three He III regions. First, northwest of IZW18-NW, and coincident with the H II region HT15 (Hunter & Thronson, 1995) is the He III region which we designate as HT15. Next, coincident with IZW18-SE is a second He III region. This region, whose He II emission has been reported in Skillman & Kennicutt (1993) and Izotov et al. (1997), appears to sit close to (or on) the identified H II region HT5 (Hunter & Thronson, 1995); as such we designate this He III region as HT5. The last of the three we define as the Central He III Region (CHR) as it is coincident with the ionized gas around IZW18-NW and in-between HT5 and HT15. CHR corresponds to the region previously mapped in Kehrig et al. (2015). Our observed He II emission map is shown in Figure 1 with the He III regions highlighted.
At a distance of 18.2 Mpc and assuming negligible reddening by dust (for more details on the very low dust attenuation in I Zw 18, see Rickards Vaught et al. in prep; Cannon et al. 2002; Fisher et al. 2014) the total measured within the contours, shown in Figure 1, in the CHR is ergs s-1. for the regions HT5 and HT15 are ( and ergs s-1. We also report here the luminosity in H, . For CHR is ergs s-1. for HT5 and HT15 are and ergs s-1 respectively. The uncertainties in the reported luminosities are dominated by an estimated calibration error of 15%. HT5 and HT15 are separated by a distance of pc and are co-linear with an axis that runs through the position of the ULX. Because of our high resolution, 0.7″ or pc at 18.2 Mpc, we are able to resolve the morphology of the He II emitting gas in the CHR of I Zw 18. The He II and H emission trace a horseshoe-like shell with major/minor diameters of and pc, respectively. Nearly coincident with the ULX is an apparent cavity, likely created by stellar feedback (Stasińska & Schaerer, 1999; Péquignot, 2008), with projected radius, pc. The He II emission is preferentially extended 250 pc away from the ULX towards the SE.
To date, there has only been one published IFS analysis of the He II emission in I Zw 18. Kehrig et al. (2015) spatially resolved the He II emission of the CHR and measured a total He II luminosity of (; a value that is within the uncertainty reported in this work. Kehrig et al. (2015) do not report any He II emission near the location of HT5 and HT15. The absence of these regions in their data is expected given their sensitivity.
4.2 The He II()/H Ratio
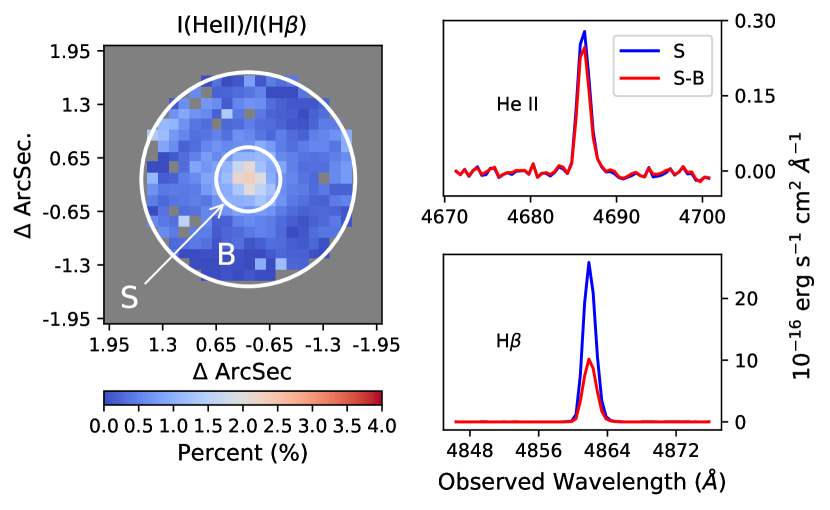
The He II()/H intensity ratio is sensitive to shape of the Lyman continuum spectrum shortwards of 228 Å, ionization parameter (Garnett et al., 1991; Guseva et al., 2000; Schaerer et al., 2019; Barrow, 2020; Stasińska & Schaerer, 1999) and/or the shock velocity (Allen et al., 2008). We create a He II()/H map by dividing maps of He II and H in regions where S/N in both lines. This map, shown in Figure 1, reveals He II()/H as high as 12% in the CHR and HT15, indicative of a high ionization parameter/harder ionizing spectrum object and/or shocks near the ULX and in HT15. The He II emission along the eastern edge of the shell, and the emission co-spatial with the ULX, exhibits the largest He II()/H enhancement. Compared to HT15 and the CHR, HT5 exhibits a low peak He II()/H value of . Because HT5 is located within IZW18-SE, there may be excess H emission from gas ionized by stellar sources contributing to the spectrum of HT5. To remove the effects of such an ionized gas component we subtract the median local spectrum in an annulus between 0.5-1″ surrounding HT5. The results of this subtraction are shown in Figure 3; the spectrum of HT5 with the local spectrum removed is revealed to have He II()/H closer to 4.5%.
4.3 Undetected Stellar Continuum in HT15
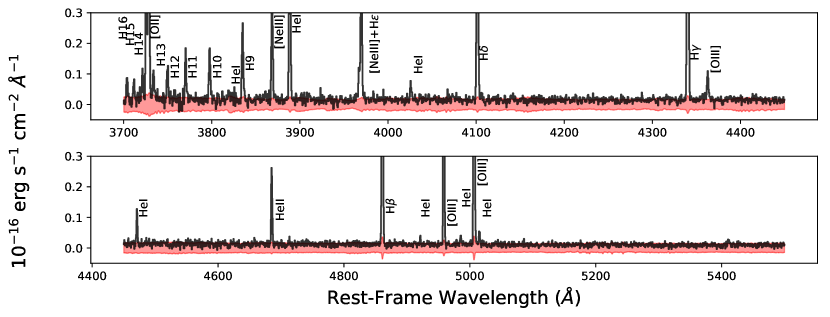
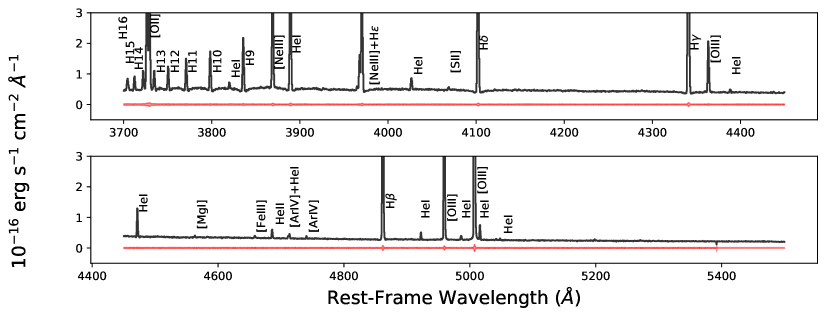
Of the three regions, HT15 has a non-detected stellar continuum in our observations. This can be seen in Figure 4, where we plot the integrated spectrum of HT15 measured using a arcsec2 aperture covering HT15. After adding in quadrature the 1- error spectrum for each pixel, we find that the continuum flux across all wavelengths is within the integrated 1- errors. If a stellar contribution to the continuum were present, it is undetected below a representative erg s-1 cm-2 Å-1, where is the median 1- error across all wavelengths. This flux corresponds to a limiting apparent magnitude of . This result is similar to those of Hunter & Thronson (1995) and Hunt et al. (2003), whose H and NIR observations of HT15 also lack a measurable stellar component, but instead, only show emission lines from ionized gas. Furthermore, the Hubble Source Catalog (Whitmore et al., 2016) classification of object, 766559, at the position of HT15 suggests an extended object, rather than a point source according to photometry in the filters: F450W, F555W, F702W, F814W.
4.4 Kinematics of the He II gas
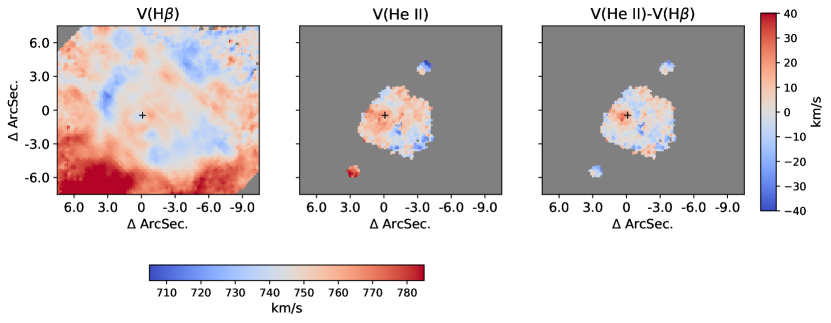
To test whether or not the kinematics of He II gas are distinct from that of H, as might be expected if He II emission is the result of shocks while H is largely from photoionization, we perform single line LZIFU fits. The results/comparisons of the velocity fits are shown in Figure 2. We find that the difference between the He II and H velocities in the HT15/ HT5 regions is negligible, signifying that dynamics of the He II-emitting gas around HT15 and HT5 have velocities similar to those traced by H. We measure a velocity difference of km s-1 near the position of peak H emission, however this may be associated with a supernova remnant or young stellar cluster (Östlin & Mouhcine, 2005).
5 Discussion
We use our measurements of the spatial distribution of He II emission in I Zw 18 to discuss possible origins of the high ionization state gas in the two newly resolved He III regions. This includes Wolf-Rayet stars and ULX generated phenomena. In the ULX case, the alignment of the two He III regions with the ULX source leads us to explore the possibility that HT15 and HT5 are observable effects from jet/outflow generated shocks or beamed X-ray emission originating from the ULX. But first, we discuss if Wolf-Rayet stars are consistent with the properties of the He II emission in HT15 and HT5.
5.1 Wolf-Rayet Stars
Although the spectra of HT5 and HT15 lack broad-lined, stellar He II emission, a signature of WR stars (Crowther & Hadfield, 2006), we are unable to eliminate these objects as the source of He II emission. The absence of broad-lined, stellar He II emission in our data would be consistent with a population of nitrogen rich WR (WN) stars, as modeling of WN atmospheres in Crowther & Hadfield (2006) has demonstrated that WN winds are reduced at sub Large and Small Magellanic Clouds (LMC/SMC) metallicities. Reduced winds diminish the production of broad-lined He II emission, and could explain the absence of this feature in these regions while still potentially powering nebular He II emission.
He III regions have been observed around WN stars Brey2 and AB7 in the LMC and SMC respectively (Nazé et al., 2003a, b). In Nazé et al. (2003a) the He III region around Brey2 has a He II luminosity, erg s-1. For the AB7 He III region, is 10 greater than Brey2 (Nazé et al., 2003b). Both objects exhibit regions with He II()/H greater than 10%. Compared to our HT15 and HT5 budget, Brey2-like stars could account for the He II luminosities in HT15 and HT5 while, to order of magnitude, a single AB7-like star could solely power He II emission in both HT15 and HT5. Applying the distance modulus to the absolute magnitude, , for WN stars (Crowther & Hadfield, 2006) these populations wouldn’t appear brighter than . Compared to these He+ ionizing WN2-4 sub-types, brighter WN5-10 stars are too cool and are unable to doubly ionize Helium. WN stars are viable candidates for the production of He II emission in HT15 and HT5.
5.2 Jet or Beamed X-ray powered He II emission in I Zw 18
Supposing that the alignment of HT15 and HT5 with the ULX arises from a physical link, then jet/outflow generated shocks or beamed X-rays originating from the ULX would be needed to explain the alignment and emission.
Various collisional and radiative processes generated behind shock fronts have been modeled by Allen et al. (2008). This modeling shows that shock speeds between km s-1 can produce He II()/H ratios consistent with those observed for HT15 and HT5. Because shock-sensitive lines such as [O I](), [N II](), [S II]() and [Ne V]() lie outside our spectral range, we are unable to compare to those with shock velocity estimates inferred from He II()/H. Kehrig et al. (2016) report measurements of these lines, excluding [Ne V], for the CHR. The observed line ratios are found to be inconsistent with shock ionization. We note that shock templates at I Zw 18-like metallicities are uncertain as shock models only exist for metallicities SMC. Moreover, the difference between the He II and H derived velocities, as shown in Figure 2, does not show evidence of km s-1 jet/outflow generated shocks at the locations of HT15 and HT5. The absence of such velocities does not necessarily discount the possibility of jet/outflow activity if the motion were primarily in the plane of the sky. Low spatial resolution radio observations of I Zw 18 by Hunt et al. (2005) show an extended synchotron halo + lobe structure in the radio continuum which they take as evidence of a wind-blown super-bubble accompanied by bi-polar outflows. However, the direction of these outflows is perpendicular to the axis connecting HT15 and HT5.
Next, we test whether isotropic X-ray emission from the ULX could be sufficient to power the He II emission, or if beaming would be needed. The X-ray flux, using erg s-1, at a distance of, pc, is erg s-1 pc2. The power passing through a surface area of , where is the radial size of HT15/HT5 with the value ″ or 30 pc, is erg s-1.
As observed in a number of cases and reproduced by photoionization modeling calculations, X-ray ionized nebulae around ULXs appear to exhibit He II emission to total X-ray luminosity ratios of (Pakull & Angebault, 1986; Pakull & Mirioni, 2002; Kaaret et al., 2004; Kaaret & Corbel, 2009; Moon et al., 2011). Assuming this same fraction of power goes into producing He II emission in HT5 and HT15, the power for He II emission is ergs s-1. When compared to the observed for HT15/HT5 the He II production budget is short by orders of magnitude. Even using , which one gets assuming the ULX is responsible for all of the He II emission in the CHR, the power available to produce He II emission is short by two orders of magnitude. This shows that if the X-ray emission from the ULX powers these two He III regions, the emission needs to be beamed rather than isotropic.
6 Conclusion
We presented KCWI observations of I Zw 18. Our observations revealed the presence of two He III regions, HT15 and HT5, in addition to the He III region mapped by Kehrig et al. (2015). Enhanced He II()/H ratios between 4% and up to 12% are measured in HT5 and HT15. Region HT15, which shows some of highest He II()/H values, has an undetected stellar population (). We compared the observed He II luminosity in HT15 and HT5 to He III regions surrounding LMC/SMC WN stars and find that similar objects are sufficient to produce the He II luminosity and He II()/H enhancement of HT15 and HT5 as well as the absence of broad-lined, spectral He II features, whilst remaining below our detection limit.
Based on the alignment of the two He III regions and the ULX, we explored a scenario in which jet/outflow activity or beamed X-ray emission originating from the ULX powers the observed He II emission in HT15 and HT5. Due to our spectral coverage and the lack of shock models appropriate for the galaxy’s metallicity, we cannot put a strong constraint on whether shocks could be powering He II emission. We assessed the velocity structure of the ionized gas and found no kinematic anomalies driven by jet/outflow activity. Assuming that HT15 and HT5 are illuminated by isotropic X-ray emission, we found that the ULX would not produce sufficient X-ray flux to generate the observed He II emission. If the X-ray emission from the ULX powers these sources, it would require beaming. We will present further analysis of the metallicity and temperature structure of I Zw 18 in an upcoming publication.
References
- Abazajian et al. (2003) Abazajian, K., Adelman-McCarthy, J. K., Agüeros, M. A., et al. 2003, AJ, 126, 2081, doi: 10.1086/378165
- Allen et al. (2008) Allen, M. G., Groves, B. A., Dopita, M. A., Sutherland, R. S., & Kewley, L. J. 2008, ApJS, 178, 20, doi: 10.1086/589652
- Aloisi et al. (2007) Aloisi, A., Clementini, G., Tosi, M., et al. 2007, ApJ, 667, L151, doi: 10.1086/522368
- Barrow (2020) Barrow, K. S. S. 2020, MNRAS, 491, 4509, doi: 10.1093/mnras/stz3290
- Bergeron (1977) Bergeron, J. 1977, ApJ, 211, 62, doi: 10.1086/154903
- Bomans & Weis (2002) Bomans, D. J., & Weis, K. 2002, in Astronomical Society of the Pacific Conference Series, Vol. 262, The High Energy Universe at Sharp Focus: Chandra Science, ed. E. M. Schlegel & S. D. Vrtilek, 141
- Cannon et al. (2002) Cannon, J. M., Skillman, E. D., Garnett, D. R., & Dufour, R. J. 2002, ApJ, 565, 931, doi: 10.1086/324691
- Cappellari & Emsellem (2004) Cappellari, M., & Emsellem, E. 2004, PASP, 116, 138, doi: 10.1086/381875
- Cerviño et al. (2002) Cerviño, M., Mas-Hesse, J. M., & Kunth, D. 2002, A&A, 392, 19, doi: 10.1051/0004-6361:20020785
- Crowther & Hadfield (2006) Crowther, P. A., & Hadfield, L. J. 2006, A&A, 449, 711, doi: 10.1051/0004-6361:20054298
- Fisher et al. (2014) Fisher, D. B., Bolatto, A. D., Herrera-Camus, R., et al. 2014, Nature, 505, 186, doi: 10.1038/nature12765
- Garnett et al. (1991) Garnett, D. R., Kennicutt, Robert C., J., Chu, Y.-H., & Skillman, E. D. 1991, ApJ, 373, 458, doi: 10.1086/170065
- Guseva et al. (2000) Guseva, N. G., Izotov, Y. I., & Thuan, T. X. 2000, ApJ, 531, 776, doi: 10.1086/308489
- Ho et al. (2016) Ho, I. T., Medling, A. M., Groves, B., et al. 2016, Ap&SS, 361, 280, doi: 10.1007/s10509-016-2865-2
- Hunt et al. (2005) Hunt, L. K., Dyer, K. K., & Thuan, T. X. 2005, A&A, 436, 837, doi: 10.1051/0004-6361:20052915
- Hunt et al. (2003) Hunt, L. K., Thuan, T. X., & Izotov, Y. I. 2003, ApJ, 588, 281, doi: 10.1086/368352
- Hunter & Thronson (1995) Hunter, D. A., & Thronson, Harley A., J. 1995, ApJ, 452, 238, doi: 10.1086/176295
- Izotov et al. (1997) Izotov, Y. I., Foltz, C. B., Green, R. F., Guseva, N. G., & Thuan, T. X. 1997, ApJ, 487, L37, doi: 10.1086/310872
- Izotov & Thuan (1998) Izotov, Y. I., & Thuan, T. X. 1998, ApJ, 497, 227, doi: 10.1086/305440
- Izotov & Thuan (1999) —. 1999, ApJ, 511, 639, doi: 10.1086/306708
- Kaaret & Corbel (2009) Kaaret, P., & Corbel, S. 2009, ApJ, 697, 950, doi: 10.1088/0004-637X/697/1/950
- Kaaret & Feng (2013) Kaaret, P., & Feng, H. 2013, ApJ, 770, 20, doi: 10.1088/0004-637X/770/1/20
- Kaaret et al. (2004) Kaaret, P., Ward, M. J., & Zezas, A. 2004, MNRAS, 351, L83, doi: 10.1111/j.1365-2966.2004.08020.x
- Kehrig et al. (2021) Kehrig, C., Guerrero, M. A., Vílchez, J. M., & Ramos-Larios, G. 2021, The Astrophysical Journal, 908, L54, doi: 10.3847/2041-8213/abe41b
- Kehrig et al. (2018) Kehrig, C., Vílchez, J. M., Guerrero, M. A., et al. 2018, MNRAS, 480, 1081, doi: 10.1093/mnras/sty1920
- Kehrig et al. (2015) Kehrig, C., Vílchez, J. M., Pérez-Montero, E., et al. 2015, ApJ, 801, L28, doi: 10.1088/2041-8205/801/2/L28
- Kehrig et al. (2011) Kehrig, C., Oey, M. S., Crowther, P. A., et al. 2011, A&A, 526, A128, doi: 10.1051/0004-6361/201015493
- Kehrig et al. (2016) Kehrig, C., Vílchez, J. M., Pérez-Montero, E., et al. 2016, MNRAS, 459, 2992, doi: 10.1093/mnras/stw806
- King & Lasota (2020) King, A., & Lasota, J.-P. 2020, MNRAS, 494, 3611, doi: 10.1093/mnras/staa930
- Lebouteiller et al. (2017) Lebouteiller, V., Péquignot, D., Cormier, D., et al. 2017, A&A, 602, A45, doi: 10.1051/0004-6361/201629675
- Moon et al. (2011) Moon, D.-S., Harrison, F. A., Cenko, S. B., & Shariff, J. A. 2011, ApJ, 731, L32, doi: 10.1088/2041-8205/731/2/L32
- Morrissey et al. (2018) Morrissey, P., Matuszewski, M., Martin, D. C., et al. 2018, ApJ, 864, 93, doi: 10.3847/1538-4357/aad597
- Nazé et al. (2003a) Nazé, Y., Rauw, G., Manfroid, J., Chu, Y. H., & Vreux, J. M. 2003a, A&A, 401, L13, doi: 10.1051/0004-6361:20030260
- Nazé et al. (2003b) —. 2003b, A&A, 408, 171, doi: 10.1051/0004-6361:20030847
- Östlin & Mouhcine (2005) Östlin, G., & Mouhcine, M. 2005, A&A, 433, 797, doi: 10.1051/0004-6361:20041172
- Pakull & Angebault (1986) Pakull, M. W., & Angebault, L. P. 1986, Nature, 322, 511, doi: 10.1038/322511a0
- Pakull et al. (2006) Pakull, M. W., Grisé, F., & Motch, C. 2006, in IAU Symposium, Vol. 230, Populations of High Energy Sources in Galaxies, ed. E. J. A. Meurs & G. Fabbiano, 293–297, doi: 10.1017/S1743921306008489
- Pakull & Mirioni (2002) Pakull, M. W., & Mirioni, L. 2002, arXiv e-prints, astro. https://arxiv.org/abs/astro-ph/0202488
- Péquignot (2008) Péquignot, D. 2008, A&A, 478, 371, doi: 10.1051/0004-6361:20078344
- Schaerer et al. (2019) Schaerer, D., Fragos, T., & Izotov, Y. I. 2019, A&A, 622, L10, doi: 10.1051/0004-6361/201935005
- Searle & Sargent (1972) Searle, L., & Sargent, W. L. W. 1972, ApJ, 173, 25, doi: 10.1086/151398
- Senchyna et al. (2020) Senchyna, P., Stark, D. P., Mirocha, J., et al. 2020, MNRAS, 494, 941, doi: 10.1093/mnras/staa586
- Shirazi & Brinchmann (2012) Shirazi, M., & Brinchmann, J. 2012, MNRAS, 421, 1043, doi: 10.1111/j.1365-2966.2012.20439.x
- Skillman & Kennicutt (1993) Skillman, E. D., & Kennicutt, Robert C., J. 1993, ApJ, 411, 655, doi: 10.1086/172868
- Stasińska & Schaerer (1999) Stasińska, G., & Schaerer, D. 1999, A&A, 351, 72. https://arxiv.org/abs/astro-ph/9909203
- Thuan et al. (2004) Thuan, T. X., Bauer, F. E., Papaderos, P., & Izotov, Y. I. 2004, ApJ, 606, 213, doi: 10.1086/382949
- Thuan & Izotov (2005) Thuan, T. X., & Izotov, Y. I. 2005, ApJS, 161, 240, doi: 10.1086/491657
- Vílchez & Iglesias-Páramo (1998) Vílchez, J. M., & Iglesias-Páramo, J. 1998, ApJ, 508, 248, doi: 10.1086/306374
- Whitmore et al. (2016) Whitmore, B. C., Allam, S. S., Budavári, T., et al. 2016, AJ, 151, 134, doi: 10.3847/0004-6256/151/6/134