First-order kinetics bottleneck during photoinduced ultrafast insulator-metal transition in 3D orbitally-driven Peierls insulator CuIr2S4
Abstract
The spinel-structure CuIr2S4 compound displays a rather unusual orbitally-driven three-dimensional Peierls-like insulator-metal transition. The low- symmetry-broken insulating state is especially interesting due to the existence of a metastable irradiation-induced disordered weakly conducting state. Here we study intense femtosecond optical pulse irradiation effects by means of the all-optical ultrafast multi-pulse time-resolved spectroscopy. We show that the structural coherence of the low- broken symmetry state is strongly suppressed on a sub-picosecond timescale above a threshold excitation fluence resulting in a structurally inhomogeneous transient state which persists for several-tens of picoseconds before reverting to the low- disordered weakly conducting state. The electronic order shows a transient gap filling at a significantly lower fluence threshold. The data suggest that the photoinduced-transition dynamics to the high- metallic phase is governed by first-order-transition nucleation kinetics that prevents the complete ultrafast structural transition even when the absorbed energy significantly exceeds the equilibrium enthalpy difference to the high- metallic phase. In contrast, the dynamically-decoupled electronic order is transiently suppressed on a sub-picosecond timescale rather independently due to a photoinduced Mott transition.
Keywords: ultrafast metal-insulator transition, ultrafast optical spectroscopy, transient reflectivity, coherent phonons, CuIr2S4, spinel
I Introduction
Kinetics of first order phase transitions are important both from the point of view of applications as well as fundamental science. For example, the control of kinetics during the transformation of various forms of steel (Papon et al., 2002) is used to tailor its microstructural and mechanical properties. An example of interesting fundamental physics related to first order phase transition kinetics is inflation of the early universe, where a supercooled metastable system might been transformed via droplet nucleation into the Higgs-field broken-symmetry state (Linde, 1982).
In solids, ultrafast first-order insulator-metal (IM) phase transitions could be instrumental for ultrafast sensor and nonvolatile memory applications. Their ultrafast kinetics therefore attracted a great deal of attention (Becker et al., 1994; Fiebig et al., 2000; Cavalleri et al., 2001; Perfetti et al., 2006; Baum et al., 2007; Wall et al., 2012; De Jong et al., 2013; Fukazawa et al., 2013; Stojchevska et al., 2014; Morrison et al., 2014; Wegkamp et al., 2014; Abreu et al., 2015; O’Callahan et al., 2015; Haupt et al., 2016; Zhang et al., 2016; Lantz et al., 2017; Jager et al., 2017; Laulhé et al., 2017; Singer et al., 2018; Ligges et al., 2018; Ronchi et al., 2019; Wall et al., 2018; Otto et al., 2019; Vidas et al., 2020) with strong focus on VO2 (Becker et al., 1994; Cavalleri et al., 2001; Baum et al., 2007; Wall et al., 2012; Wegkamp et al., 2014; Morrison et al., 2014; O’Callahan et al., 2015; Jager et al., 2017; Wall et al., 2018; Otto et al., 2019; Vidas et al., 2020), V2O3 (Abreu et al., 2015; Lantz et al., 2017; Singer et al., 2018; Ronchi et al., 2019) and 1T-TaS2 (Perfetti et al., 2006; Stojchevska et al., 2014; Haupt et al., 2016; Laulhé et al., 2017; Ligges et al., 2018). There are however still open questions how the inherent first-order meta-stability manifests itself when phases with concurrent electronic and lattice orders are driven across the first-order phase boundary on ultrafast time scales.
In VO2, for example, the change of the low- electronic-order-induced monoclinic lattice potential is believed to be rather abrupt (Baum et al., 2007; Wall et al., 2012; Jager et al., 2017; Wall et al., 2018) with a sub-picosecond V-V dimerization suppression suggesting that the high- metallic rutile phase symmetry is restored on a -fs timescale. This is contrasted by recent observation of an additional transient metastable monoclinic metallic phase in a significant fraction of the polycrystaline sample grains (Otto et al., 2019). While the presence of the metastable monoclinic metallic phase is still rather controversial (Vidas et al., 2020) the electronic and lattice orders might be transiently decoupled with the emergence of the metallic rutile lattice structure somehow inhibited.
In V2O3 the inherent first-order meta stability plays a determining role with the nucleation and growth kinetics of the metallic nanodroplets governing the dynamics across the first-order IM phase transition (Abreu et al., 2015; Ronchi et al., 2019). The importance of the nucleation and growth kinetics was noted also in a first-order ultrafast charge-density-wave phase transformation in -TaS2 (Haupt et al., 2016; Laulhé et al., 2017).
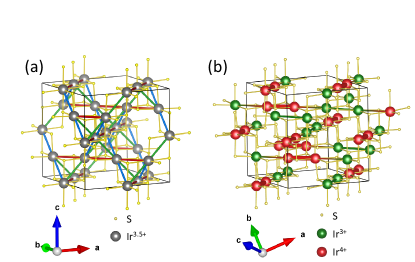
An interesting opportunity for studying the ultrafast first-order IM phase transition (Nagata et al., 1994) kinetics is offered in the spinel-structure CuIr2S4 compound that shows a rather unusual orbitally-driven (Khomskii and Mizokawa, 2005) three-dimensional Peierls-like IM transition. Upon cooling, the metallic cubic (MC) phase (Figure 1 (a)) undergoes a first order transition to a triclinic (Ishibashi et al., 2001; Radaelli et al., 2002) insulating phase (Figure 1 (b)) at 233 K. The triclinic insulating phase is characterized by Ir3+:Ir4+ charge disproportionation accompanied with Peierls-like dimerization of Ir4+-ion pairs along a set of cubic and Ir-ion rows alternating along the corresponding direction.
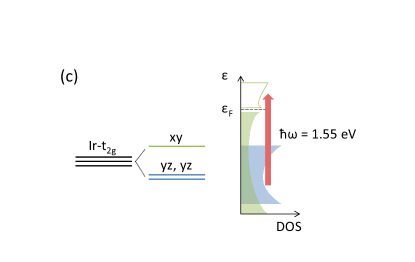
The transition can be understood in terms of quasi-1D Ir-t2g-orbitals derived hybridized bands that are split due to the band Jahn-Teller effect into two narrower fully occupied - and -derived bands and a broader 3/4 occupied -derived band that simultaneously becomes gaped due to the Peierls tetramerization (see Fig 1 (c)) (Khomskii and Mizokawa, 2005). The Ir- orbitals appear broad enough that the correlation effects do not play a major role in the transition (Sasaki et al., 2004; Khomskii and Mizokawa, 2005; Sarkar et al., 2009) contrary to V2O3 and VO2.
The CuIr2S4 is interesting also due to the low temperature X-ray- and visible-light-induced metastable disordered weakly conducting (DWC) phase (Ishibashi et al., 2002; Furubayashi et al., 2003; Takubo et al., 2005; Kiryukhin et al., 2006; Takubo et al., 2008; Božin et al., 2011). The presence of short-range incommensurate structural correlations observed (Kiryukhin et al., 2006) in the DWC phase suggests presence of competing instabilities that appear after suppression of the insulating phase. The formation of the DWC phase was studied mostly with weak continuous excitations. Competing instabilities, however, might lead to formation of even more conducting metastable state under strongly nonequilibrium conditions as in the case of 1-TaS2, where a strong ultrafast excitation leads to a metastable hidden (H) metallic phase (Stojchevska et al., 2014). In order to search for a possible hidden metallic state, different from the DWC phase, and to study kinetics during ultrafast first-order IM phase transition in CuIr2S4 we therefore performed a systematic femtosecond multi-pulse all-optical investigation of the single-crystal transient reflectivity relaxation dynamics in CuIr2S4 as a function of excitation fluence.
The low- quasi-equilibrium transient reflectivity in CuIr2S4 is dominated by the low-frequency broken-symmetry-induced coherent-phonons response that discontinuously vanishes across the equilibrium IM transition. (Naseska et al., 2020) The coherent response can therefore be used as a time-resolved probe for the broken-lattice-symmetry dynamics in the strongly excited low- phases. (Yusupov et al., 2010; Wall et al., 2012) This can be done by means of our advanced multi-pulse method (Yusupov et al., 2010), where we use a strong driving laser pulse to initiate a photoinduced transition and probe the subsequent evolution by means of a weaker pump- (P) probe (Pr) pulses sequence.
II Methods
Sample growth and characterization
Single crystals of CuIr2S4 were grown from Bi solution and characterized as described in Ref. (Naseska et al., 2020). Here we present ultrafast optical data from two cleaved crystals designated S1 and S2. The orientation of the S1 cleaved surface was determined from electron back scatter diffraction Kikuchi patterns to be close to the plane while the orientation of the S2 cleaved surface was inferred from the Raman selection rules to be close to the plane. (Naseska et al., 2020)
Multi-pulse transient reflectivity measurements
The multi-pulse transient reflectivity measurements. (Yusupov et al., 2010; Naseska et al., 2018) were performed using 50-fs linearly polarized laser pulses at 800 nm wavelength and the kHz repetition rate. In addition to the pump (P) and probe (Pr) pulses at eV we used another intense driving (D) pulse (also at eV) with a variable delay with respect to the pump (P) pulse (see Figure 2).

The multi-pulse transient reflectivity was measured by monitoring the intensity of the Pr beam. The direct contribution of the unchopped D beam to the total transient reflectivity, , was rejected by means of a lock-in synchronized to the chopper that modulated the intensity of the P beam only. Due to the chopping scheme the measured quantity in the multi-pulse experiments is the difference between the transient reflectivity in the presence of P and D pulses, , and the transient reflectivity in the presence of the D pulse only, :
| (1) |
where , and correspond to the Pr, P and D pulse arrival times, respectively. In the limit of vanishing D pulse fluence reduces to the standard two-pulse transient reflectivity .
The P/D and Pr beam diameters were in the ranges of 40-70 and 18-30 m, respectively. The probe fluence was 0 J/cm2. For the multi-pulse measurements the fluence of the P pulse, J/cm2, was kept in the linear response region. The polarizations of the P and D beams were perpendicular to the probe beam polarization with a random orientation with respect to the crystal axes.
III Results
The DWC phase emergence depends on the absorbed dose (Furubayashi et al., 2003; Koshimizu et al., 2009), but the threshold dose was determined only for the case of high-energy ion irradiation(Koshimizu et al., 2009). Since the exact optical DWC-phase-creation conditions are not known we measured also the low- DC photoconductivity (see Supplemental Material (SM) (Naseska et al., 2021)) and found, as suggested previously,(Naseska et al., 2020) that even at the lowest feasible excitation fluences, 100 J/cm2, the threshold dose is exceeded on a timescale faster than a single transient reflectivity scan acquisition time of 100 s. The pristine insulating triclinic phase is therefore inaccessible in the pump-probe experiments at low and the previously reported(Naseska et al., 2020) equilibrium low- transient reflectivity refers to the DWC phase. Despite the absence of a long range Ir4+-dimer order in the DWC phase(Kiryukhin et al., 2006) the previously characterized coherent oscillations (CO) due to the displacive excitation of coherent phonons(Zeiger et al., 1992; Naseska et al., 2020, 2021) (DECP) show well defined peaks with the low- dephasing times exceeding ps.

In Figure 3 (a) we show the pump fluence, , dependence of the standard two-pulse transient reflectivity, , at K. The CO scale almost linearly with increasing up to mJ/cm2. With increasing the CO appear suppressed in the -normalized scans and the signal becomes dominated by the sub-ps relaxation component. The detailed DECP-model(Naseska et al., 2020, 2021) component analysis (see. Figure 4) reveals that the sub-ps exponential component (SEC) amplitude, , departs from the low- linear dependence and starts to increase more steeply above mJ/cm2 already (see inset to Figure 4 (e)). Concurrently, the amplitudes of the three weaker, high-frequency modes, designated O3, O4 and O5, show an onset of saturation while the amplitudes of the two stronger, low-frequency modes, O1 and O2, show an increased slope. Above mJ/cm2 the amplitudes of all modes drop and vanish at the highest . The SEC does not show any anomalies around , but shows saturation of and the relaxation time, , above mJ/cm2.

The high- transient reflectivity shows an initial fast, ps, relaxation followed by slower -dependent dynamics (see Figure 3 (c)). The slow dynamics sets in above mJ and consists of a plateau emerging into a broad dip at ps at the highest followed by relaxation extending to a ns timescale.
The high- slow dynamics was investigated further by means of the multi-pulse experiments. The multi-pulse transient reflectivity, , well above is shown in Figure 5 for different D-P delays, . At short , the multi-pulse transient reflectivity resembles the 2-pulse transient reflectivity of the low- state around , but, with much strongly damped CO. After ps the CO start to gradually reemerge also on longer P-Pr delays, . The multipulse transients are completely different from the high- MC phase transients indicating that the highly excited transient state cannot be associated with the high- MC phase.
The DECP fit component analysis shown in Figure 6 indicates that the initial amplitudes of the strongest two modes (see Figure 6 (c)) do not appear suppressed even immediately after the D pulse while the damping factors (see Figure 6 (b)) exceed the equilibrium value (Naseska et al., 2020) of THz by up to two orders of magnitude recovering by an order of magnitude on a ps timescale. Just before the arrival of the subsequent D pulse, after 5 s, the damping is reduced close to the equilibrium-state value, together with exponential components parameters (Figure 6 (e) and (f)). The low- state is therefore completely recovered after each D pulse, albeit, at a higher than the cryostat base temperature due to the heat buildup. The behavior is similar also at an increased mJ/cm2 with slower recovery. (Naseska et al., 2021)
The suppression of the CO is delayed with respect to the D pulse for ps (see inset to Figure 5) and does not depend on the small changes of the delay (Naseska et al., 2021). The delay is consistent with the duration of the initial sub-picosecond transient observed for the high- transient reflectivity in Figure 3 (a).
No irreversibility of the transient reflectivity was observed after exposing the sample to long trains of pump pulses at the highest as shown in Figure 3b. To check for any heat build up effects single D-pulse experiments were also performed. No long-lived changes of the ultrafast transient reflectivity were found.(Naseska et al., 2021)

IV Discussion
The onset of the nonlinearities with increasing , at mJ/cm2, is mostly expressed in the SEC that can be associated with the electronic degrees of freedom only. The SEC total duration (including the risetime) of fs significantly exceeds the time resolution of the setup ( fs) so the nonlinearity cannot be associated with the pump optical-transition nonlinearity, but is associated with the low-energy electronic degrees of freedom.
Focusing on the lattice degrees of freedom, which show strong nonlinearity on the larger fluence scale above , we first estimate the transient heating taking the -dependent frequencies of the strongest two coherent modes,(Naseska et al., 2020) O1 and O2 at 1.86 THz and 2.34 THz, respectively, as proxies for the lattice temperature. The obtained effective temperatures (see Figure 4 (d)) reach at a fluence that is close to . This indicates that the symmetry-breaking lattice distortion is significantly affected only after the lattice degrees of freedom are heated close to . This is consistent with the absorbed energy at that is comparable to the equilibrium enthalpy difference(Naseska et al., 2021) between the high- MC phase at and the low- phase at K. Here the initial state at s (see Figure 6 (d)) is also estimated from the coherent mode frequencies.
The suppression of the CO with increasing above mJ/cm2 is not abrupt as in the equilibrium case. This can be attributed to the finite-optical-penetration-depth induced excitation inhomogeneity. The thickens of a thin surface layer, within which the absorbed energy threshold is exceeded, reaches the optical penetration depth thickness only at the external fluence of mJ/cm2, consistent with the fluence where the CO are completely suppressed (see Figure 4 (c)). The excitation inhomogeneity results in a rather large error bar of , of the order of mJ/cm2, but does not hinder a clear separation between and .
The electronic ordering is therefore affected at lower excitation densities than the lattice order. The drop of from the equilibrium value of a few picoseconds to fs indicates that the gap-induced relaxation bottleneck (Naseska et al., 2020) is transiently suppressed above already. The estimated photoexcited carriers density at is of the order(Naseska et al., 2021) of cm-3 resulting in the plasma frequency of eV that is larger than the insulating gap(Wang et al., 2004) of eV. The bottleneck suppression can therefore be attributed to a sub-picosecond transient washout of the gap due to the (screening-induced) Mott transition that lasts at least few hundred fs. On this timescale a significant amount of the photoexcited carrier energy can be incoherently damped to phonons since the inelastic electron-phonon scattering time can be as fast as fs(Lundstrom, 2000). However, the low frequency phonons corresponding to Ir-ions displacements (Naseska et al., 2020) that set the lattice order parameter dynamics appear coherent until the gap is restored. According to Ref. [Khomskii and Mizokawa, 2005] the equilibrium IM transition is a combination of orbital ordering and Peierls charge density wave transition. The Ir-t2g-orbitals derived bands are split (band Jahn-Teller effect) into two fully occupied - and -derived bands and a broader 3/4 occupied -derived band that simultaneously becomes gaped due to the Peierls tetramerization (see Fig 1 (c)). While the photoexcited Mott transition transiently suppresses the -derived band charge density wave, the band Jahn-Teller effect remains effective stabilizing the broken symmetry lattice deformation until the gap is restored. A similar decoupling of the electronic and lattice orders on a short timescale has been previously observed in TiSe2. (Porer et al., 2014)

Turning to the highly excited transient state (HETS), the multi-pulse experiments clearly confirm that even at mJ/cm2 the excited volume does not switch into the high- MC state despite the large absorbed energy. In the most excited part of the volume, near the surface, the absorbed energy exceeds the equilibrium enthalpy difference between the high- MC state just above and the initial low- state by more than two times. The presence of the strongly damped broken-symmetry (Naseska et al., 2020) CO with the unsuppressed initial amplitude (see Figure 6 (c)) indicates that the local lattice symmetry remains broken in most of the excited volume, albeit with strong dephasing due to fluctuations and/or increased disorder.
The broken symmetry state could be stabilized by the pressure exerted by the surrounding unexcited bulk low- phase. Application of pressure is known to stabilize the triclinic insulating phase (Oomi et al., 1995), which has % larger density (Furubayashi et al., 1994) than the MC phase. Taking the compressibility(Garg et al., 2007), GPa-1, one obtains the pressure of GPa leading to an increase(Oomi et al., 1995) of to K.
In addition to the increase, the pump optical penetration depth could increase due to the optical-transition bleaching at high- resulting in saturation of the absorbed energy density.(Naseska et al., 2018) Such saturation cannot be entirely excluded and the maximum experimental indeed does not appear to significantly exceed (Figures 4 (d) and 6 (d)). We should note, however, that at the high excitation does not directly correspond to the most excited volume region since the CO are inhomogeneously suppressed so is somewhat weighted towards the less-excited volume region.
While the above effects can contribute to stabilization of the broken symmetry state, they cannot account for the observed large CO dephasing. Extrapolating the equilibrium (Naseska et al., 2020) to the estimated(Naseska et al., 2021) maximum possible transient K we obtain and for the O1 and O2 mode, respectively, which are at least times smaller than the observed below ps (Figure 6 (b)). The picosecond transient state therefore cannot be characterized as an ordinary super-heated equilibrium pressure-stabilized low- phase.
According to the classical kinetic theory of first order phase transitions (Lifshitz et al., 1995) the formation of a stable phase from a metastable one proceeds through formation of macroscopic droplets that, due to the surface energy terms, grow deterministically only if their size exceeds a critical size, . The nucleation of the droplets with is a stochastic process driven either by fluctuations or tunneling, the later being proposed for the broken-symmetry-state droplet formation in the supercooled early universe (Linde, 1982). In the present case thermal fluctuations are likely large enough that the tunneling should not play any role.
The observed HETS could, therefore, be tentatively understood in this context where the fluctuating droplets of the high- MC phase introduce strong dynamical disorder into the triclinic phase matrix, but fail to reach the critical size or their growth is too slow to reach the MC phase before the heat diffusion spreads the absorbed energy across a larger volume, recovering the stability of the triclinic phase. Since there was no observable variation of the pump scattering with in the multipulse experiments the droplets are presumably much smaller than the pump wavelength of 800 nm and are most likely size-limited by the characteristic low--phase twin lamella thickness (Sun et al., 2001) of nm.
Increasing the excitation fluence beyond mJ/cm2 the standard 2-pulse (see Fig. 3 (c)) shows evolution of a broad dip between and ps. The dip might signify an onset of MC-phase droplets growth. Unfortunately, this excitation region was not investigated in multipulse experiments in order to avoid sample cracking111Observed in earlier experiments upon high laser induced average thermal load. due to the high D-beam average thermal load222The average thermal load in the multipulse experiments is doubled with respect to the standard 2-pulse experiments since D-beam is unchopped.. Further experiments with lower repetition laser source are therefore necessary to reach a more definitive conclusion regarding the behavior beyond mJ/cm2.
The HETS is expected to be quite metallic and different from the DWC state since the sub-picosecond component behavior indicates the suppression of the gap at lower already. However, the evidence is indirect so more direct experimental evidence from time-resolved low-energy probes is necessary to clearly establish the degree of metallicity.
Since the HETS state appears after strong ultrafast excitation on a sub-picosecond timescale, in a manner similar to the metastable metallic H phase (Stojchevska et al., 2014; Ravnik, 2019) in 1-TaS2, it is necessary to compare the phenomena. 1-TaS2 is, unlike CuIr2S4, a layered compound with the equilibrium phase diagram that is significantly more complicated than the phase diagram of CuIr2S4. In particular, the low- insulating commensurate (C) polaron ordered phase is separated from the symmetric high- metallic phase ( K) by intermediate incommensurate polaron ordered phases that are quite conducting.
The H phase is created after the C phase exposure to a single ultrafast optical pulse above a critical fluence, mJ/cm2.(Stojchevska et al., 2014) On the long timescales the H phase appears as a disordered texture of the frozen C-phase polaron domains(Gerasimenko et al., 2019a). An additional metastable amorphous (A) polaron glass phase has also been observed recently that is created at higher excitation fluences than the H phase, mJ/cm2.(Gerasimenko et al., 2019b)
The spatial textures of the H and A phases and their evolution on the ultrafast timescales have not been yet determined and the microscopic pathway from the C to either H or A phase is still unclear. Since different C-phase domains in the H phase have different phase shifts relative to the underlying atomic lattice(Gerasimenko et al., 2019a) a global reconfiguration of the polaron lattice must take place during the transition already above . This implies that the C polaron lattice “melts” into some transient state before condensing into the H (A) phase. This transient state could be, similarly to the present case on the picoseconds timescales, composed from droplets of a “melted” phase that are embedded into the C phase. The droplet phase could correspond to either some incommensurate phase, polaron liquid or even the high- metallic phase without polarons.
The CO in 1-TaS2 are not so strongly suppressed during the creation of the H phase and become suppressed only for (Ravnik et al., 2018, 2020) The H phase creation conditions in 1-TaS2 are therefore more similar to the excitation above in CuIr2S4, where the lattice remains below , while the fluences above , where also the lattice transiently exceeds , correspond better to the A-phase creation conditions in 1-TaS2. Owing to the similar penetration depths of nm and nm in 1-TaS2(Gerasimenko et al., 2019b) and CuIr2S4(Naseska et al., 2021), respectively, and the similar equilibrium transition temperatures it is not surprising that and are rather similar.
Contrary to 1-TaS2 in CuIr2S4 the same DWC state forms on the long timescales irrespective of the excitation fluence and the excitation type. It was shown(Kiryukhin et al., 2006; Božin et al., 2011) that in the DWC state the long range low- order is replaced by a short range ( nm) incommensurate modulation with preserved local Ir4+ dimerization. The DWC state is, therefore, structurally more comparable to the A phase than the H phase of 1-TaS2. However, the electronic gap in the DWC state is not suppressed(Takubo et al., 2008) like in the A state of 1-TaS2(Gerasimenko et al., 2019b) and the resistivity is larger, cm, than in the A state of 1-TaS2 with in the m range(Gerasimenko et al., 2019b). The DWC and A state (as well as H state) are therefore quite different. This could be connected to the absence of strong correlations and weak neighboring Ir-ion chain coupling in CuIr2S4 making the electronic gap less sensitive to the disorder-induced doping.
Comparing CuIr2S4 with VO2 and V2O3 we observe similarities, but also differences. All three compounds show transient intermediate states with suppressed gaps (Morrison et al., 2014; Wegkamp et al., 2014; Lantz et al., 2017; Singer et al., 2018) that are structurally distinct from the high- metallic phases suggesting a transient decoupling of the structural and electronic orders. The decoupling in both oxides has been attributed to the correlation effects (Wegkamp et al., 2014; Lantz et al., 2017). In our case, however, the effect can be attributed to a photoinduced Mott transition.
The timescales of the structural transitions are quite different. In VO2 the transition is abrupt (Jager et al., 2017; Wall et al., 2018; Otto et al., 2019) while V2O3 (Singer et al., 2018; Ronchi et al., 2019) and CuIr2S4 show first-order kinetics bottlenecks which slow down the transition. In this context it is worth noting that the lattice volume change at the equilibrium IM transition is the smallest, 0.1 % in VO2 (Marezio et al., 1970) in comparison to -1.3 % in V2O3 (Rozier et al., 2002) and 0.7 % in CuIr2S4 (Furubayashi et al., 1994), suggesting a smaller inter-phase-boundary energy cost enabling easier nucleation of the high- metallic phase droplets.
V Conclusions
We showed that in the strongly nonequilibrium regime upon a femtosecond photoexcitation the low-temperature ultrafast structural dynamics in CuIr2S4 is dominated by the first-order-transition nucleation kinetics that prevents the complete ultrafast photoinduced structural transition into the high- phase at unexpectedly large excitation densities. Concurrently, the dynamically-decoupled electronic order is suppressed rather independently on a sub-picosecond timescale at much weaker excitation density. While the electronic order suppression likely results in a transient metallization of the highly nonequilibrium broken lattice-symmetry state no evidence was found that femtosecond excitation would lead to a long lived metastable state more conducting than the slowly formed disordered weakly conducting phase.
Acknowledgments
The authors acknowledge the financial support of Slovenian Research Agency (research core funding No-P1-0040 and young researcher funding No. 50504) for financial support. We would also like to thank V. Nasretdinova and E. Goreshnik for the help at the sample characterization, M. Aničin and A. Bavec for help at transient reflectivity measurements and E. Bozin for fruitful discussions.
References
- Papon et al. (2002) P. Papon, J. Leblond, and P. H. Meijer, Physics of Phase Transitions (Springer, 2002).
- Linde (1982) A. D. Linde, Physics Letters B 108, 389 (1982).
- Becker et al. (1994) M. F. Becker, A. B. Buckman, R. M. Walser, T. Lépine, P. Georges, and A. Brun, Applied Physics Letters 65, 1507 (1994).
- Fiebig et al. (2000) M. Fiebig, K. Miyano, Y. Tomioka, and Y. Tokura, Journal of luminescence 87, 82 (2000).
- Cavalleri et al. (2001) A. Cavalleri, C. Tóth, C. W. Siders, J. Squier, F. Ráksi, P. Forget, and J. Kieffer, Physical review letters 87, 237401 (2001).
- Perfetti et al. (2006) L. Perfetti, P. Loukakos, M. Lisowski, U. Bovensiepen, H. Berger, S. Biermann, P. Cornaglia, A. Georges, and M. Wolf, Physical review letters 97, 067402 (2006).
- Baum et al. (2007) P. Baum, D.-S. Yang, and A. H. Zewail, Science 318, 788 (2007), https://science.sciencemag.org/content/318/5851/788.full.pdf .
- Wall et al. (2012) S. Wall, D. Wegkamp, L. Foglia, K. Appavoo, J. Nag, R. Haglund, J. Stähler, and M. Wolf, Nature communications 3, 1 (2012).
- De Jong et al. (2013) S. De Jong, R. Kukreja, C. Trabant, N. Pontius, C. Chang, T. Kachel, M. Beye, F. Sorgenfrei, C. Back, B. Bräuer, et al., Nature materials 12, 882 (2013).
- Fukazawa et al. (2013) N. Fukazawa, T. Tanaka, T. Ishikawa, Y. Okimoto, S.-y. Koshihara, T. Yamamoto, M. Tamura, R. Kato, and K. Onda, The Journal of Physical Chemistry C 117, 13187 (2013).
- Stojchevska et al. (2014) L. Stojchevska, I. Vaskivskyi, T. Mertelj, P. Kusar, D. Svetin, S. Brazovskii, and D. Mihailovic, Science 344, 177 (2014).
- Morrison et al. (2014) V. R. Morrison, R. P. Chatelain, K. L. Tiwari, A. Hendaoui, A. Bruhács, M. Chaker, and B. J. Siwick, Science 346, 445 (2014).
- Wegkamp et al. (2014) D. Wegkamp, M. Herzog, L. Xian, M. Gatti, P. Cudazzo, C. L. McGahan, R. E. Marvel, R. F. Haglund Jr, A. Rubio, M. Wolf, et al., Physical review letters 113, 216401 (2014).
- Abreu et al. (2015) E. Abreu, S. Wang, J. G. Ramírez, M. Liu, J. Zhang, K. Geng, I. K. Schuller, and R. D. Averitt, Physical Review B 92, 085130 (2015).
- O’Callahan et al. (2015) B. T. O’Callahan, A. C. Jones, J. H. Park, D. H. Cobden, J. M. Atkin, and M. B. Raschke, Nature communications 6, 1 (2015).
- Haupt et al. (2016) K. Haupt, M. Eichberger, N. Erasmus, A. Rohwer, J. Demsar, K. Rossnagel, and H. Schwoerer, Physical review letters 116, 016402 (2016).
- Zhang et al. (2016) J. Zhang, X. Tan, M. Liu, S. W. Teitelbaum, K. W. Post, F. Jin, K. A. Nelson, D. Basov, W. Wu, and R. D. Averitt, Nature materials 15, 956 (2016).
- Lantz et al. (2017) G. Lantz, B. Mansart, D. Grieger, D. Boschetto, N. Nilforoushan, E. Papalazarou, N. Moisan, L. Perfetti, V. L. Jacques, D. Le Bolloc’h, et al., Nature communications 8, 1 (2017).
- Jager et al. (2017) M. F. Jager, C. Ott, P. M. Kraus, C. J. Kaplan, W. Pouse, R. E. Marvel, R. F. Haglund, D. M. Neumark, and S. R. Leone, Proceedings of the National Academy of Sciences 114, 9558 (2017).
- Laulhé et al. (2017) C. Laulhé, T. Huber, G. Lantz, A. Ferrer, S. O. Mariager, S. Grübel, J. Rittmann, J. A. Johnson, V. Esposito, A. Lübcke, et al., Physical review letters 118, 247401 (2017).
- Singer et al. (2018) A. Singer, J. G. Ramirez, I. Valmianski, D. Cela, N. Hua, R. Kukreja, J. Wingert, O. Kovalchuk, J. M. Glownia, M. Sikorski, et al., Physical review letters 120, 207601 (2018).
- Ligges et al. (2018) M. Ligges, I. Avigo, D. Golež, H. Strand, Y. Beyazit, K. Hanff, F. Diekmann, L. Stojchevska, M. Kalläne, P. Zhou, et al., Physical review letters 120, 166401 (2018).
- Ronchi et al. (2019) A. Ronchi, P. Homm, M. Menghini, P. Franceschini, F. Maccherozzi, F. Banfi, G. Ferrini, F. Cilento, F. Parmigiani, S. Dhesi, et al., Physical Review B 100, 075111 (2019).
- Wall et al. (2018) S. Wall, S. Yang, L. Vidas, M. Chollet, J. M. Glownia, M. Kozina, T. Katayama, T. Henighan, M. Jiang, T. A. Miller, D. A. Reis, L. A. Boatner, O. Delaire, and M. Trigo, Science 362, 572 (2018), https://science.sciencemag.org/content/362/6414/572.full.pdf .
- Otto et al. (2019) M. R. Otto, L. P. René de Cotret, D. A. Valverde-Chavez, K. L. Tiwari, N. Émond, M. Chaker, D. G. Cooke, and B. J. Siwick, Proceedings of the National Academy of Sciences 116, 450 (2019), https://www.pnas.org/content/116/2/450.full.pdf .
- Vidas et al. (2020) L. Vidas, D. Schick, E. Martínez, D. Perez-Salinas, A. Ramos-Álvarez, S. Cichy, S. Batlle-Porro, A. S. Johnson, K. A. Hallman, R. F. Haglund Jr, et al., Physical Review X 10, 031047 (2020).
- Momma and Izumi (2011) K. Momma and F. Izumi, Journal of applied crystallography 44, 1272 (2011).
- Khomskii and Mizokawa (2005) D. Khomskii and T. Mizokawa, Physical review letters 94, 156402 (2005).
- Sarkar et al. (2009) S. Sarkar, M. De Raychaudhury, and T. Saha-Dasgupta, Physical Review B 79, 113104 (2009).
- Nagata et al. (1994) S. Nagata, T. Hagino, Y. Seki, and T. Bitoh, Physica B: Condensed Matter 194, 1077 (1994).
- Ishibashi et al. (2001) H. Ishibashi, T. Sakai, and K. Nakahigashi, Journal of magnetism and magnetic materials 226, 233 (2001).
- Radaelli et al. (2002) P. G. Radaelli, Y. Horibe, M. J. Gutmann, H. Ishibashi, C. Chen, R. M. Ibberson, Y. Koyama, Y.-S. Hor, V. Kiryukhin, and S.-W. Cheong, Nature 416, 155 (2002).
- Sasaki et al. (2004) T. Sasaki, M. Arai, T. Furubayashi, and T. Matsumoto, Journal of the Physical Society of Japan 73, 1875 (2004).
- Ishibashi et al. (2002) H. Ishibashi, T. Koo, Y. S. Hor, A. Borissov, P. G. Radaelli, Y. Horibe, S. Cheong, and V. Kiryukhin, Physical Review B 66, 144424 (2002).
- Furubayashi et al. (2003) T. Furubayashi, H. Suzuki, T. Matsumoto, and S. Nagata, Solid state communications 126, 617 (2003).
- Takubo et al. (2005) K. Takubo, S. Hirata, J.-Y. Son, J. Quilty, T. Mizokawa, N. Matsumoto, and S. Nagata, Physical review letters 95, 246401 (2005).
- Kiryukhin et al. (2006) V. Kiryukhin, Y. Horibe, Y. S. Hor, H. Noh, S. Cheong, and C. Chen, Physical review letters 97, 225503 (2006).
- Takubo et al. (2008) K. Takubo, T. Mizokawa, N. Matsumoto, and S. Nagata, Physical Review B 78, 245117 (2008).
- Božin et al. (2011) E. Božin, A. S. Masadeh, Y. S. Hor, J. Mitchell, and S. Billinge, Physical review letters 106, 045501 (2011).
- Naseska et al. (2020) M. Naseska, P. Sutar, D. Vengust, S. Tsuchiya, M. Čeh, D. Mihailovic, and T. Mertelj, Physical Review B 101, 165134 (2020).
- Yusupov et al. (2010) R. Yusupov, T. Mertelj, V. V. Kabanov, S. Brazovskii, P. Kusar, J.-H. Chu, I. R. Fisher, and D. Mihailovic, Nature Physics 6, 681 (2010).
- Naseska et al. (2018) M. Naseska, A. Pogrebna, G. Cao, Z. Xu, D. Mihailovic, and T. Mertelj, Physical Review B 98, 035148 (2018).
- Madan et al. (2017) I. Madan, V. Baranov, Y. Toda, M. Oda, T. Kurosawa, V. Kabanov, T. Mertelj, and D. Mihailovic, Physical Review B 96, 184522 (2017).
- Koshimizu et al. (2009) M. Koshimizu, H. Tsukahara, and K. Asai, Nuclear Instruments and Methods in Physics Research Section B: Beam Interactions with Materials and Atoms 267, 1125 (2009).
- Naseska et al. (2021) M. Naseska, P. Sutar, D. Vengust, D. Svetin, Y. Vaskivskyi, I. Vaskivskyi, D. Mihailovic, and T. Mertelj, (2021), supplemental Material.
- Zeiger et al. (1992) H. Zeiger, J. Vidal, T. Cheng, E. Ippen, G. Dresselhaus, and M. Dresselhaus, Physical Review B 45, 768 (1992).
- Wang et al. (2004) N. Wang, G. Cao, P. Zheng, G. Li, Z. Fang, T. Xiang, H. Kitazawa, and T. Matsumoto, Physical Review B 69, 153104 (2004).
- Lundstrom (2000) M. Lundstrom, “Carrier scattering,” in Fundamentals of Carrier Transport (Cambridge University Press, 2000) pp. 54–118, 2nd ed.
- Porer et al. (2014) M. Porer, U. Leierseder, J.-M. Ménard, H. Dachraoui, L. Mouchliadis, I. Perakis, U. Heinzmann, J. Demsar, K. Rossnagel, and R. Huber, Nature materials 13, 857 (2014).
- Oomi et al. (1995) G. Oomi, T. Kagayama, I. Yoshida, T. Hagino, and S. Nagata, Journal of magnetism and magnetic materials 140, 157 (1995).
- Furubayashi et al. (1994) T. Furubayashi, T. Matsumoto, T. Hagino, and S. Nagata, Journal of the Physical Society of Japan 63, 3333 (1994).
- Garg et al. (2007) A. B. Garg, V. Vijayakumar, B. K. Godwal, A. Choudhury, and H. D. Hochheimer, Solid state communications 142, 369 (2007).
- Lifshitz et al. (1995) E. Lifshitz, L. Pitaevskii, J. Sykes, and R. Franklin, Physical Kinetics: Volume 10, Course of theoretical physics (Elsevier Science, 1995).
- Sun et al. (2001) W. Sun, T. Kimoto, T. Furubayashi, T. Matsumoto, S. Ikeda, and S. Nagata, Journal of the Physical Society of Japan 70, 2817 (2001).
- Note (1) Observed in earlier experiments upon high laser induced average thermal load.
- Note (2) The average thermal load in the multipulse experiments is doubled with respect to the standard 2-pulse experiments since D-beam is unchopped.
- Ravnik (2019) J. Ravnik, Studies of ultrafast processes in correlated materials using scanning tunnelling microscope, Ph.D. thesis, Univerza v Ljubljani, Fakulteta za matematiko in fiziko (2019).
- Gerasimenko et al. (2019a) Y. A. Gerasimenko, P. Karpov, I. Vaskivskyi, S. Brazovskii, and D. Mihailovic, npj Quantum Materials 4, 1 (2019a).
- Gerasimenko et al. (2019b) Y. A. Gerasimenko, I. Vaskivskyi, M. Litskevich, J. Ravnik, J. Vodeb, M. Diego, V. Kabanov, and D. Mihailovic, Nature materials 18, 1078 (2019b).
- Ravnik et al. (2018) J. Ravnik, I. Vaskivskyi, T. Mertelj, and D. Mihailovic, Physical Review B 97, 075304 (2018).
- Ravnik et al. (2020) J. Ravnik, M. Diego, Y. Gerasimenko, Y. Vaskivskyi, I. Vaskivskyi, T. Mertelj, J. Vodeb, and D. Mihailovic, arXiv preprint arXiv:2011.00930 (2020).
- Marezio et al. (1970) M. Marezio, P. Dernier, D. McWhan, and J. Remeika, Materials Research Bulletin 5, 1015 (1970).
- Rozier et al. (2002) P. Rozier, A. Ratuszna, and J. Galy, Zeitschrift für anorganische und allgemeine Chemie 628, 1236 (2002).