A transit timing variation observed for the long-period extremely low density exoplanet HIP 41378 f
1Dept. of Physics, University of Warwick, Gibbet Hill Road, Coventry CV4 7AL, UK
2Centre for Exoplanets and Habitability, University of Warwick, Gibbet Hill Road, Coventry CV4 7AL, UK
3Aix Marseille Univ, CNRS, CNES, LAM, Marseille, France
4INAF - Osservatorio Astronomico di Padova, Vicolo dell’Osservatorio 5, I-35122 Padova, Italy
5Astrobiology Research Unit, Université de Liège, Allée du 6 Août 19C, B-4000 Liège, Belgium
6Department of Earth, Atmospheric and Planetary Science, Massachusetts Institute of Technology, 77 Massachusetts Avenue, Cambridge, MA 02139, USA
7School of Physics and Astronomy, University of Leicester, Leicester, LE1 7RH, UK
8Departamento de Astronomía, Universidad de Chile, Casilla 36-D, Santiago, Chile
9National Astronomical Research Institute of Thailand, 260 Moo 4, Donkaew, Mae Rim, Chiang Mai, 50180, Thailand
10Space Sciences, Technologies and Astrophysics Research (STAR) Institute, Université de Liège, 19C Allèe du 6 Août, 4000 Liège, Belgium
11Observatoire Astronomique de l’Université de Genève, Chemin Pegasi 51, Versoix, Switzerland
12University of Bern, Center for Space and Habitability, Gesellschaftsstrasse 6, 3012 Bern, Switzerland
13Institute of Planetary Research, German Aerospace Center, Rutherfordstrasse 2, 12489 Berlin, Germany
14Department of Earth and Planetary Science, Graduate School of Science, The University of Tokyo, 7-3-1 Hongo, Bunkyo-ku, Tokyo 113-0033, Japan
15Instituto de Astrofísica de Canarias (IAC), 38205 La Laguna, Tenerife, Spain
16Department of Astronomy and Tsinghua Centre for Astrophysics, Tsinghua University, Beijing 100084, China
17Perth Exoplanet Survey Telescope (PEST)
18Department of Physics, and Kavli Institute for Astrophysics and Space Research, Massachusetts Institute of Technology, Cambridge, MA 02139, USA
19Department of Earth and Planetary Sciences, University of California, Santa Cruz, CA 95064, USA
20Centro de Astrofísica y Tecnologías Afines (CATA), Casilla 36-D, Santiago, Chile
21Department of Astronomy and Astrophysics, University of California, Santa Cruz, CA 95064, USA
22Instituto de Astronomía, Universidad Católica del Norte, Angamos 0610, 1270709, Antofagasta, Chile
23Astrophysics Group, Cavendish Laboratory, J.J. Thomson Avenue, Cambridge CB3 0HE, UK
24Komaba Institute for Science, The University of Tokyo, 3-8-1 Komaba, Meguro, Tokyo 153-8902, Japan
25JST, PRESTO, 3-8-1 Komaba, Meguro, Tokyo 153-8902, Japan
26Astrobiology Center, 2-21-1 Osawa, Mitaka, Tokyo 181-8588, Japan
27Phillips Academy Observatory, Phillips Academy, Andover MA USA
28Departamento de Astrofísica, Universidad de La Laguna (ULL), 38206, La Laguna, Tenerife, Spain
29Astrobiology Research Unit, Université de Liège, 19C Allèe du 6 Août, 4000 Liège, Belgium
30School of Physics & Astronomy, University of Birmingham, Edgbaston, Birmingham B15 2TT, United Kingdom
31Hazelwood Observatory
Abstract
HIP 41378 f is a temperate R⊕ planet with period of days and an extremely low density of g cm-3. It transits the bright star HIP 41378 (V=), making it an exciting target for atmospheric characterization including transmission spectroscopy. HIP 41378 was monitored photometrically between the dates of 2019 November 19 and November 28. We detected a transit of HIP 41378 f with NGTS, just the third transit ever detected for this planet, which confirms the orbital period. This is also the first ground-based detection of a transit of HIP 41378 f. Additional ground-based photometry was also obtained and used to constrain the time of the transit. The transit was measured to occur hours earlier than predicted. We use an analytic transit timing variation (TTV) model to show the observed TTV can be explained by interactions between HIP 41378 e and HIP 41378 f. Using our TTV model, we predict the epochs of future transits of HIP 41378 f, with derived transit centres of = (May 2021) and = (Nov 2022).
keywords:
techniques: photometric – planets and satellites: gaseous planets – planets and satellites: detection – planets and satellites: individual: HIP 41378 f – stars: individual: HIP 413781 Introduction
The bright (V=) F-type star HIP 41378 is known to host five transiting planets (Vanderburg et al., 2016), based on photometric data taken during campaign C5 of the K2 mission (Howell et al., 2014). The outer most planet known in the system, HIP 41378 f only transited once during these observations. A second transit of HIP 41378 f was observed during K2 campaign C18 and showed it to have a maximum possible orbital period of days (Becker et al., 2019). Extensive spectroscopic monitoring with HARPS by Santerne et al. (2019) revealed the true period of HIP 41378 f to be days - half the possible maximum.
With a mass of Mp M⊕ and a radius of Rp R⊕, the low density of HIP 41378 f, combined with its cool temperature, makes it a particularly interesting target for atmospheric characterization. Using the system parameters from Santerne et al. (2019) we calculate a Transmission Spectroscopy Metric (TSM) for HIP 41378 f of 343 (Kempton et al., 2018), which shows HIP 41378 f to be very well suited to transmission spectroscopy follow-up. For these observations, a precise orbital ephemeris is needed. Despite the high quality K2 data, with only two recorded transits there was previously no information regarding any transit timing variations (TTVs) of HIP 41378 f. In a multi-planet system, a planet with a long orbital period such as HIP 41378 f may experience large transit timing variations (TTVs) (eg. Agol et al., 2005; Kawahara & Masuda, 2019). Since HIP 41378 f resides in near 2:1 and 3:2 mean motion resonances with planet e and d respectively, we may expect TTVs on the order of hours to days.
Ground-based photometric observations of the HIP 41378 system are needed to measure any TTVs to place additional constraints on the masses and orbital periods of planets in the HIP 41378 system. Monitoring the TTVs also has the potential to reveal other exoplanets in the system, and additionally will help predict future transit events for atmospheric characterisation. However, for a star with a magnitude of V= the field-of-view of most ground-based photometric facilities will often not include enough comparison stars of a similar brightness (Collins et al., 2018). In fact, for HIP 41378, the nearest star with a GAIA G magnitude difference of less than 0.5 mag is 17 arcmin away (Gaia Collaboration et al., 2018).
2 Photometric Observations
2.1 NGTS
The Next Generation Transit Survey (NGTS; Wheatley et al., 2018) is a photometric facility situated at ESO’s Paranal Observatory in Chile. It consists of twelve fully-robotic telescopes with 20 cm diameter apertures and wide fields-of-view of 8 square degrees. The dominant photometric noise sources in NGTS bright star light curves have been shown to be Gaussian and uncorrelated between the individual telescopes (Bryant et al., 2020). Combined with the wide field-of-view, this allows NGTS to use simultaneous observations with multiple telescopes to achieve high precision light curves of bright stars (Smith et al., 2020; Bryant et al., 2020).
HIP 41378 was observed with NGTS on the nights UT 2019 Nov 19, 24 and 25. On all nights, HIP 41378 was monitored using eleven NGTS telescopes, each using the custom NGTS filter (520-890 nm) and an exposure time of 10 seconds. Across all nights, a total of 23841 images were taken. The target was above an altitude of 30∘ for all the observations, and the observing conditions were good.
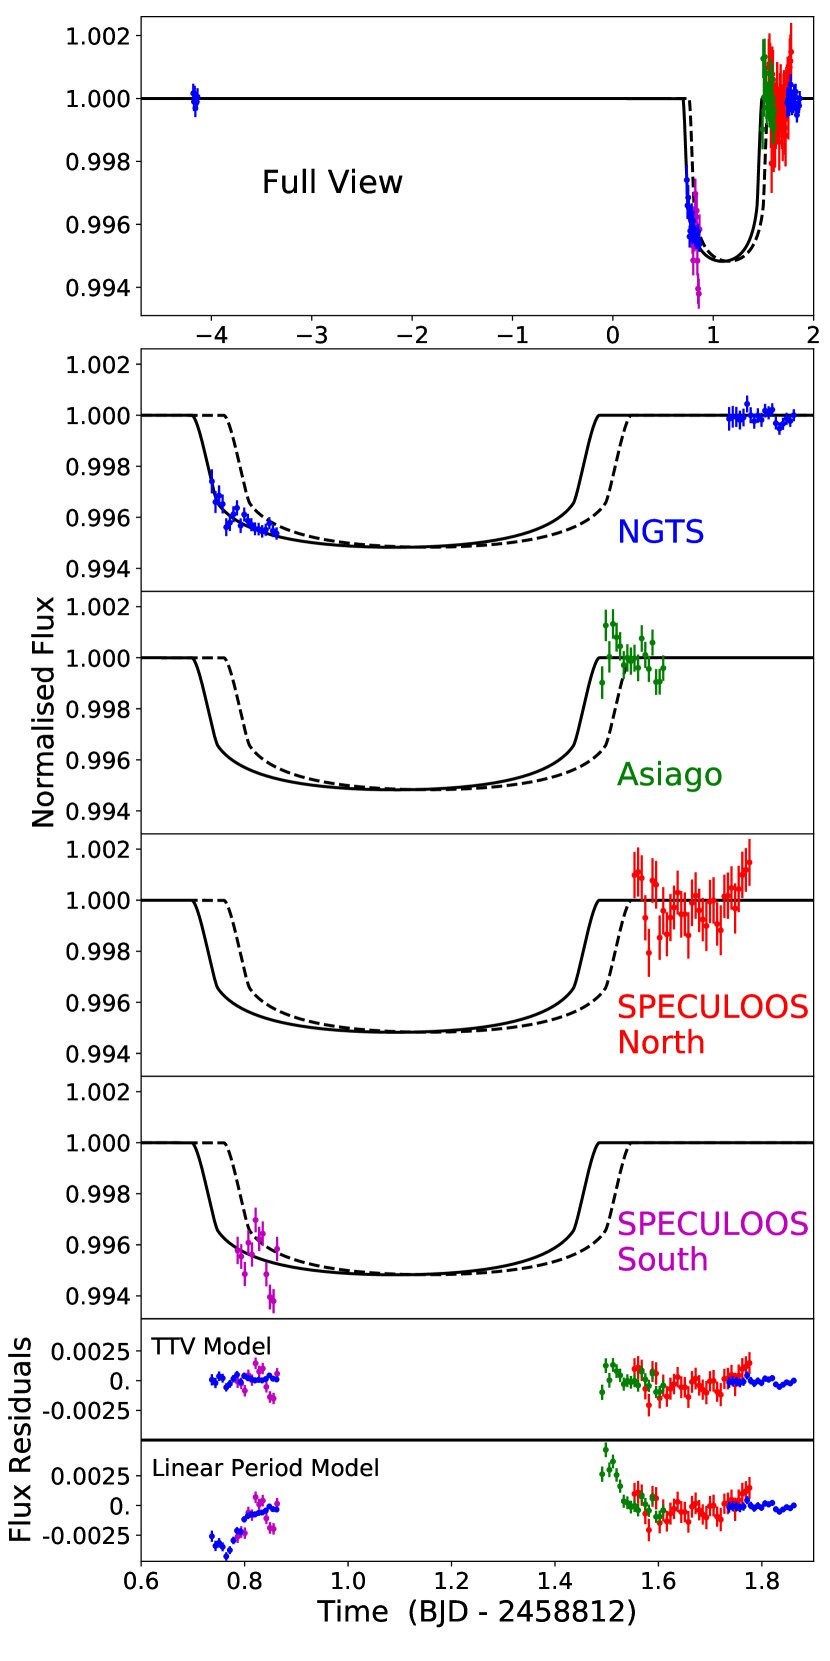
The NGTS data were reduced using a custom aperture photometry pipeline, which utilises the SEP Python library (Bertin & Arnouts, 1996; Barbary, 2016). The pipeline uses the GAIA DR2 catalogue (Gaia Collaboration et al., 2016; Gaia Collaboration et al., 2018) to automatically identify comparison stars that are similar in magnitude, colour and CCD position to HIP 41378 (for more details see Bryant et al., 2020). Comparison stars which a shown to display variability or high levels of photometric scatter are excluded from the reduction. The NGTS photometry is plotted in Figure 1.
2.2 SPECULOOS
HIP 41378 was observed by SPECULOOS (Search for habitable Planets EClipsing ULtra-cOOl Stars; Burdanov et al., 2018; Gillon, 2018; Delrez et al., 2018; Sebastian et al., 2021). It was observed from the SPECULOOS Southern Observatory (SSO) at Paranal, Chile on UT 2019 Nov 24 and from the SPECULOOS Northern Observatory (SNO) at the Teide Observatory on Tenerife, Spain on UT 2019 Nov 25. The SSO observations consists of 342 images obtained using the filter, an exposure time of 12 seconds, and a defocus of 300 steps to avoid saturation. SNO obtained 254 images using also the filter, with an exposure time of 12 seconds and a defocus of 300 steps. For each night of observation, the automatic SSO Pipeline (Murray et al., 2020) was used to reduce images and extract precise photometry. The SSO Pipeline is built upon the casutools software (Irwin et al., 2004) and performs automated differential photometry to mitigate ground-based systematics, including a correction for time-varying telluric water vapour. The SNO and SSO data are plotted in Figure 1.
2.3 Asiago Telescope
HIP 41378 was observed on the night UT 2019 Nov 25 using the 67/92-cm Schmidt telescope based at the Asiago Observatory in northern Italy, operated by the Italian National Institute of Astrophysics (INAF). A total of 301 images were obtained through the Sloan filter under a good sky quality, using a constant exposure time of 30 seconds and defocusing the camera to minimize pixel-to-pixel systematic errors. The light curve was extracted by using a custom version of the STARSKY code, a pipeline to perform high-precision differential photometry originally developed for the TASTE project (Nascimbeni et al., 2011). The unbinned RMS is 2.0 mmag, the scatter being much larger at the beginning of the series due to the much higher airmass (1.97 for the first frame). All the time stamps were converted to the BJD-TDB system (Eastman et al., 2010). The Asiago data, binned over a 10-min time scale (rms: 825 ppm) are plotted in Figure 1 (green points). The Asiago data are plotted in Figure 1.
2.4 Photometric Transit Detection
The NGTS data shows a clear flux decrease which is consistent to the predicted transit depth and near to the predicted transit time. This flux decrease is clearly seen in the top two panels of Figure 1. We note that the NGTS photometry is of sufficient precision that an ingress occurring at the time predicted from the K2 and HARPS data would be robustly detected. The SSO and Asiago data are consistent with the change in transit time seen by NGTS, ruling out an on-time ingress and egress respectively. The SNO data rule out a late transit. With photometric coverage on three separate nights surrounding the transit event, we are confident that the flux offset seen in the NGTS data is a real signal. However the relative flux offsets between the data from the different facilities, including the offset of the SSO data, were fit independently as free parameters during the modelling detailed in Section 3. The combination of these four datasets gives us confidence that the transit occurred earlier than the prediction from the linear orbital ephemeris derived from the K2 and HARPS data (Santerne et al., 2019). This is the third transit of this planet to be detected and the first from the ground, with the other two being detected from data obtained by the K2 mission. The detection of this transit confirms the day period predicted for this planet from K2 and HARPS data (Santerne et al., 2019).
2.5 Additional Ground Based Photometry
Additional photometry for HIP 41378 was also obtained with various other ground-based facilities: PEST, LCO (CTIO), PROMPT-8 (CTIO), MUSCAT2 at Teide Observatory, Lick Observatory, Hazelwood Observatory, and Phillip’s Academy Observatory. Unfortunately, due to poor observing conditions or a lack of suitable comparison stars, none of the data from these facilities had a photometric precision better than a threshold of 2 ppt-per-10 mins. As such we do not include these datasets in our analysis.
3 Analysis
We jointly modelled the photometry from NGTS, ASIAGO, SSO and SNO in order to determine the time of transit centre for the November 2019 transit, . Note we use the notation to refer to the time of transit centre for transit epoch . The first transit of HIP 41378 f in K2 C5 is taken to occur at . We generated a transit light curve template based on the parameters from Vanderburg et al. (2016), and using the period derived by Santerne et al. (2019). We performed an MCMC sampling process to model the ground-based photometric data. The free parameters used in the modelling were , the limb darkening coefficients, the detrending coefficients for the NGTS data, and relative flux offset factors for the other datasets. Note that each NGTS single-telescope lightcurve was detrended against airmass independently from the other telescopes, and a single linear trend with time is applied to the entire NGTS multi-telescope light curve. We used a quadratic limb darkening profile, constraining the coefficients based on theoretically derived limb-darkening coefficients for the NGTS filter. The r’ filter used for the SSO observations has a large amount of overlap with the wavelength range of the NGTS filter, and so the limb-darkening coefficients derived for the NGTS filter provide a good approximation for the SSO data. The precision of the SSO data also means that including an additional set of limb-darkening coefficients for the SSO data does not have an effect on the derived value of . Therefore, we use the theoretical values of and , which were computed from the Claret & Bloemen (2011) tables, as Gaussian priors for the model for all datasets.
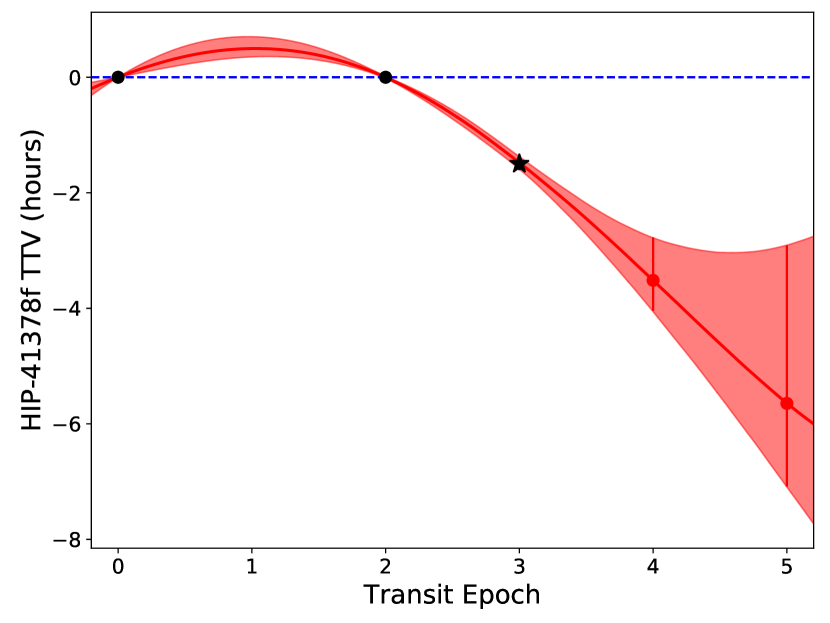
The sampling was performed using the Ensemble Sampler from emcee (Foreman-Mackey et al., 2013). We ran 70 chains for 10000 steps, following a burn-in phase of 2500 steps. The number of effective samples for each parameter ranged from 600000 to 800000, with the number of effective samples for was 698539.39784769. From this analysis, we obtained a transit time of = , which is hours earlier than predicted. The best fit model from this analysis is shown in Fig. 1 and the derived transit time variation is shown in Fig. 2.
4 TTV Analysis
Due to its anomalously low density, HIP 41378 f is an attractive target for atmospheric characterisation studies. As such, knowing the precise ephemerides for future transits is of high importance. Therefore, we use analytical TTV formulae from Lithwick et al. (2012) to predict the times of the upcoming transits of HIP 41378 f, in particular the next two transits in May 2021 and Nov 2022.
Of the planets already known in the system, the TTV signal of HIP 41378 f will be most affected by HIP 41378 d and HIP 41378 e. These two planets have masses of M⊕ and M⊕ (Santerne et al., 2019), and reside near to 2:1 and 3:2 mean motion resonances with HIP 41378 f, respectively. The amplitude of the TTVs of HIP 41378 f as a result of its interactions with HIP 41378 d and HIP 41378 e will depend strongly on and respectively. The interactions with HIP 41378 e are likely to dominate the TTV signal of HIP 41378 f since (Santerne et al., 2019) and thus we consider solely the TTVs due to interactions between HIP 41378 f & e for the rest of this analysis. We note that neither HIP 41378 d nor HIP 41378 e were robustly detected by Santerne et al. (2019) in HARPS radial velocity measurements, and so they are only able to place loose constraints on the masses and periods of these planets. The constraints on the period of HIP 41378 e are derived from a combination of transit analyses and asteroseismic stellar constraints (Santerne et al., 2019; Lund et al., 2019). Future monitoring of the TTVs of HIP 41378 f will allow us to place tighter independent constraints on the masses and periods of HIP 41378 d and HIP 41378 e.
We use the Lithwick et al. (2012) analytic formulae for TTV signals for planets in a near mean motion resonance to obtain the following equations for the amplitude, , and super-period, , for the TTV signal of HIP 41378 f as a result of its interactions with HIP 41378 e. These are
| (1) |
| (2) |
where is the mean linear orbital period of HIP 41378 f, and are the masses of HIP 41378 e and HIP 41378, and are the orbital eccentricities of HIP 41378 e and HIP 41378 f respectively, and and are coefficients given in Table 3 of Lithwick et al. (2012). The parameter is the normalized distance to resonance
| (3) |
where days is the mean linear orbital period of HIP 41378 e, . Using the planetary parameters given in Tab.1 of Santerne et al. (2019), we calculate values of days, and days. We note that the expected TTV signal from HIP 41378 e alone is enough to account for the TTVs observed in Section 2. Additional planets in the system are not required to explain the observations (nor do the observations rule them out).
With just three transit times, we cannot use TTV modelling to place any constraints on the masses and orbital eccentricities of the planets in the HIP 41378 system. Neither can we robustly refine the period of HIP 41378 e. However, we can combine the analytical TTV signals derived in Lithwick et al. (2012) with our knowledge of HIP 41378 f and e to predict the times of the next transits of HIP 41378 f. We do this using an MCMC sampling method, again using emcee Ensemble Sampler. The TTV model we use for this sampling is of the form
| (4) |
where is the time of transit centre of the transit, is a reference epoch and is the the transit epoch, such that is the mean linear ephemeris of HIP 41378 f, and is the phase shift of the TTV signal. The free parameters in this sampling are , , , , , and . For the following parameters: , , and we impose Gaussian priors using the posterior values from Santerne et al. (2019). In this way, we explore the parameter space of TTV signals which can explain the transit times we observe for HIP 41378 f and are also physically plausible. For the sampling, we run 40 walkers each for 200000 steps as a burn-in, and then a following 50000 steps to explore the parameter space. The resultant predicted TTV signal from this sampling is given in Fig. 2. The median values of the resultant probability distributions for and , as well as the 68%, 95%, and 99% confidence intervals, are provided in Table 1.
| (BJD TDB - 2450000) | (BJD TDB - 2450000) | |
|---|---|---|
| Median | 9355.087 | 9897.078 |
| 68% | 9355.064 - 9355.118 | 9897.018 - 9897.192 |
| 95% | 9355.032 - 9355.156 | 9896.910 - 9897.293 |
| 99% | 9355.020 - 9355.205 | 9896.884 - 9897.455 |
5 Conclusions
We detected a transit of HIP 41378 f on 2019 November 24 and 25, the first ever ground-based transit detection for this planet, primarily with data obtained using NGTS. As this is just the third ever transit of HIP 41378 f detected, we confirm the day orbital period of this planet. This long orbital period makes HIP 41378 f the longest period planet to have a transit detected from the ground. The long transit duration (19 hours) makes detecting transits of HIP 41378 f challenging and makes photometric efforts with increased longitudinal coverage useful for recovering such transits. On the other hand, the fact that many of the observations taken for this particular effort were not able to be used to constrain the transit parameters highlights the value of photometric facilities like NGTS, when it comes to obtaining high precision photometry of bright stars like HIP 41378.
We found the transit to arrive hours earlier than predicted from a linear extrapolation of the K2 transits (Vanderburg et al., 2016; Becker et al., 2019) and extensive spectroscopic monitoring (Santerne et al., 2019). Using analytic formulae for TTV signals from Lithwick et al. (2012), we have shown that the TTV observed for HIP 41378 f can be explained solely through the interaction between HIP 41378 e and HIP 41378 f. Therefore, the presence of additional planets in the HIP 41378 system is not required to explain our observations. However our observations do not rule out the presence of additional planets. We predict that the next transit of HIP 41378 f will be centred on BJD with a 99% confidence interval of hours (2021 May 20), and the following transit will occur around BJD with a 99% confidence interval of hours (2022 Nov 13).
Both and depend strongly on the ratio of . As is well constrained by the available transits of HIP 41378 f, this results in the amplitude and period of the predicted TTV signal depending strongly on the orbital period of HIP 41378 e. The current large uncertainty on combined with the shallow transit depth of just 1.5 mmag mean that detecting another transit of HIP 41378 e, especially with ground-based facilities, will be tough. However, doing so would greatly refine the predictions of the TTV signal of HIP 41378 f. Additionally, detecting the upcoming transits of HIP 41378 f will allow us to greatly refine the ephemeris of HIP 41378 e, due to the constraints that the improved measurements of and will place on . The next transit of HIP 41378 e is predicted to have a centre time of (UT 2021 May 21). HIP 41378 d is in near 4:3 mean-motion resonance with HIP 41378 e, and so based on our TTV models we expect HIP 41378 d to also experience large TTVs. Therefore, detecting transits of HIP 41378 d will further allow us to refine our TTV models and make better predictions for upcoming transits of HIP 41378 e. Using the sampling method from Section 4, we predict the next transit of HIP 41378 d to have a transit mid-point of (2021 June 27).
With 6 planets in the HIP 41378 system, many of which reside near to mean-motion resonances, there are likely to be lots of interactions between the planets. With only a small number of transit detections for each of the outer three planets, a full dynamical analysis of the system is beyond the scope of this work. However, this robust transit detection of HIP 41378 f by NGTS and the discovery of significant TTVs in the system demonstrates that with future photometric monitoring we will be able to characterise the amplitude and super-period of the TTV signal of HIP 41378 f. This monitoring will enable us to place independent constraints on the masses, orbital periods, and eccentricities of the planets in this remarkable system.
Acknowledgements
Based on data collected by the NGTS project, the SPECULOOS network, the Asiago Observatory, the Las Cumbres Observatory global telescope network, the MuSCAT2 instrument, the PEST Observatory, the Lick Observatory, the Hazelwood Observatory, the Phillip’s Academy Observatory, and the PROMPT-8 telescope at CTIO. For full acknowledgments for these facilities we refer the reader to the facility papers cited in this Letter.
MRK is supported by the NSF Graduate Research Fellowship, grant No. DGE 1339067. DJA acknowledges support from the STFC via an Ernest Rutherford Fellowship (ST/R00384X/1). MNG acknowledges support from MIT’s Kavli Institute as a Juan Carlos Torres Fellow. NN is partly supported by JSPS KAKENHI Grant Numbers JP17H04574, JP18H01265 and JP18H05439, and JST PRESTO Grant Number JPMJPR1775, and a University Research Support Grant from the National Astronomical Observatory of Japan (NAOJ). JSJ acknowledges support by FONDECYT grant 1201371, and partial support from CONICYT project Basal AFB-170002.
Data Availability
The NGTS, Asiago, SSO and SNO photometric data are available in the online supplementary material.
References
- Agol et al. (2005) Agol E., Steffen J., Sari R., Clarkson W., 2005, MNRAS, 359, 567
- Barbary (2016) Barbary K., 2016, Journal of Open Source Software, 1, 58
- Becker et al. (2019) Becker J. C., et al., 2019, AJ, 157, 19
- Bertin & Arnouts (1996) Bertin E., Arnouts S., 1996, A&AS, 117, 393
- Bryant et al. (2020) Bryant E. M., et al., 2020, MNRAS, 494, 5872
- Burdanov et al. (2018) Burdanov A., Delrez L., Gillon M., Jehin E., 2018, SPECULOOS Exoplanet Search and Its Prototype on TRAPPIST. p. 130, doi:10.1007/978-3-319-55333-7_130
- Claret & Bloemen (2011) Claret A., Bloemen S., 2011, A&A, 529, A75
- Collins et al. (2018) Collins K. A., et al., 2018, AJ, 156, 234
- Delrez et al. (2018) Delrez L., et al., 2018, in Proc. SPIE. p. 107001I (arXiv:1806.11205), doi:10.1117/12.2312475
- Eastman et al. (2010) Eastman J., Siverd R., Gaudi B. S., 2010, PASP, 122, 935
- Foreman-Mackey et al. (2013) Foreman-Mackey D., Hogg D. W., Lang D., Goodman J., 2013, PASP, 125, 306
- Gaia Collaboration et al. (2016) Gaia Collaboration et al., 2016, A&A, 595, A2
- Gaia Collaboration et al. (2018) Gaia Collaboration Brown A. G. A., Vallenari A., Prusti T., de Bruijne J. H. J., Babusiaux C., Bailer-Jones C. A. L., 2018, preprint, (arXiv:1804.09365)
- Gillon (2018) Gillon M., 2018, Nature Astronomy, 2, 344
- Howell et al. (2014) Howell S. B., et al., 2014, PASP, 126, 398
- Irwin et al. (2004) Irwin M. J., et al., 2004, in Optimizing Scientific Return for Astronomy through Information Technologies. SPIE, doi:10.1117/12.551449, https://doi.org/10.1117/12.551449
- Kawahara & Masuda (2019) Kawahara H., Masuda K., 2019, AJ, 157, 218
- Kempton et al. (2018) Kempton E. M. R., et al., 2018, PASP, 130, 114401
- Lithwick et al. (2012) Lithwick Y., Xie J., Wu Y., 2012, ApJ, 761, 122
- Lund et al. (2019) Lund M. N., et al., 2019, AJ, 158, 248
- Murray et al. (2020) Murray C. A., et al., 2020, MNRAS, 495, 2446
- Nascimbeni et al. (2011) Nascimbeni V., Piotto G., Bedin L. R., Damasso M., 2011, A&A, 527, A85
- Santerne et al. (2019) Santerne A., et al., 2019, arXiv e-prints, p. arXiv:1911.07355
- Sebastian et al. (2021) Sebastian D., et al., 2021, A&A, 645, A100
- Smith et al. (2020) Smith A. M. S., et al., 2020, arXiv e-prints, p. arXiv:2002.05591
- Vanderburg et al. (2016) Vanderburg A., et al., 2016, ApJ, 827, L10
- Wheatley et al. (2018) Wheatley P. J., et al., 2018, MNRAS, 475, 4476