The ALPINE-ALMA [CII] Survey: Kinematic Diversity & Rotation in Massive Star Forming Galaxies at
Abstract
While the kinematics of galaxies up to have been characterized in detail, only a handful of galaxies at high redshift () have been examined in such a way. The Atacama Large Millimeter/submillimeter Array (ALMA) Large Program to INvestigate [CII] at Early times (ALPINE) survey observed a statistically significant sample of 118 star-forming main sequence galaxies at in [CII]158m emission, increasing the number of such observations by nearly 10x. A preliminary qualitative classification of these sources revealed a diversity of kinematic types (i.e., rotators, mergers, and dispersion-dominated systems). In this work, we supplement the initial classification by applying quantitative analyses to the ALPINE data: a tilted ring model (TRM) fitting code (3DBarolo), a morphological classification (Gini-M20), and a set of disk identification criteria. Of the 75 [CII]-detected ALPINE galaxies, 29 are detected at sufficient significance and spatial resolution to allow for TRM fitting and the derivation of morphological and kinematic parameters. These 29 sources constitute a high-mass subset of the ALPINE sample (). We robustly classify 14 of these sources (six rotators, five mergers, and three dispersion-dominated systems); the remaining sources showing complex behaviour. By exploring the G-M20 of rest-frame FIR and [CII] data for the first time, we find that our kpc resolution data alone are insufficient to separate galaxy types. We compare the rotation curves and dynamical mass profiles of the six ALPINE rotators to the two previously detected unlensed main sequence rotators, finding high rotational velocities ( km s-1) and a diversity of rotation curve shapes.
keywords:
galaxies: evolution – galaxies: high-redshift – galaxies: kinematics and dynamics1 Introduction
The past century has seen a massive broadening of scope in the study of galaxy kinematics. Early works focused on spectral line emission from single nearby galaxies (e.g., Pease 1918; Burbidge et al. 1959), while current studies are able to probe the kinematics of many local objects (e.g., Garrido et al. 2002; Conselice et al. 2005; de Blok et al. 2008; Shapiro et al. 2008; Puech 2010; Gómez-López et al. 2019; Korsaga et al. 2019; den Brok et al. 2020) or single objects in much greater detail (e.g., Carignan et al. 2006; Chemin et al. 2009; Cramer et al. 2019; North et al. 2019; Braine et al. 2020). This detailed analysis has also been extended to galaxies at intermediate redshift (i.e., ; t Gyr) with integral field spectroscopy, mostly in the rest-frame optical and near-infrared (e.g., Förster Schreiber et al. 2006; Epinat et al. 2012; Burkert et al. 2016; Turner et al. 2017; Harrison et al. 2017; Molina et al. 2017; Swinbank et al. 2017; Wisnioski et al. 2019; Loiacono et al. 2019). These studies have revealed galaxies with a variety of kinematic types (i.e., rotators, mergers, dispersion-dominated sources), as well as inflows and outflows.
One major finding from studies up to is that most of these galaxies show evidence for significant dark matter halos. By combining KMOS and MUSE data for star-forming galaxies (SFGs) at , Tiley et al. (2019) find that galaxies in this epoch mainly feature flat or rising rotation curves at large radii. This is quite similar to the rotation curves of local galaxies, which show nearly constant or only slightly declining velocities at large radii (e.g., de Blok et al. 2008), indicating the additional gravitational force from an underlying dark matter halo (e.g., Rubin & Ford 1970).
While a multitude of galaxies at have been well characterized kinematically, it is only recently, with the advent of the Atacama Large Millimeter/submillimeter Array (ALMA) and the Jansky Very Large Array (JVLA), that we are able to characterize the kinematics of high redshift () galaxies, using rest-frame far-infrared (FIR) emission lines. This includes the clumpy nature of galaxies observed with ALMA in [CII] emission (e.g., Carniani et al. 2018), rotational model fitting of galaxies (e.g., De Breuck et al. 2014; Shao et al. 2017; Jones et al. 2017; Rizzo et al. 2020; Fraternali et al. 2021), and even evidence for ordered rotation of galaxies at (Smit et al. 2018; Bakx et al. 2020). However, the number of galaxies at that are kinematically characterizable (i.e., observed with great enough S/N and resolution) is still much less than at . These high-redshift galaxies represent some of the first galaxies to form in the Universe and sit on the ramp-up of star formation rate density (e.g., Madau & Dickinson 2014), so their morphological and kinematic (i.e., morpho-kinematic) state is crucial for informing theories of early galaxy formation evolution, as well as constraining ongoing cosmological simulations (e.g., Pallottini et al. 2017; Kohandel et al. 2019).
Addressing this lack of kinematically characterized galaxies at was one of the main driving goals of the ALMA Large Program to INvestigate CII at Early Times (ALPINE; Le Fèvre et al. 2020; Béthermin et al. 2020; Faisst et al. 2020). This survey observed 118 galaxies at in [CII] 158m and the surrounding rest-frame FIR emission, following the success of the pilot program (Capak et al., 2015) and increasing the number of such observations by an order of magnitude. Source selection was based on UV luminosity (L L*), pre-existing spectroscopic redshifts, and lack of type 1 AGN. ALPINE sources lie on the star forming main sequence (e.g., Noeske et al. 2007; Faisst et al. 2020) and are thus broadly representative of the underlying population of galaxies at these redshifts.
As the first large spectroscopic survey of star-forming galaxies, ALPINE probes a unique era of cosmic history, and provides the first measure of the morpho-kinematic diversity in the epoch. Using a custom line search algorithm, Béthermin et al. (2020) found that 75 of the 118 targets were detected in [CII] emitting emission. The morpho-kinematic diversity of this sample was then assessed by a team within the ALPINE collaboration (Le Fèvre et al., 2020) who examined the [CII] channel maps, integrated intensity (moment 0) maps, velocity fields (moment 1), position-velocity diagrams (PVDs) along the major and minor axes, integrated spectra, and ancillary photometry (Faisst et al., 2020) . Based on this information, each member independently classified each galaxy as rotating (class 1), merging (class 2), extended dispersion-dominated (class 3), compact dispersion-dominated (class 4), or too weak to characterize (class 5), and the class for each galaxy was agreed upon.
This initial qualitative classification was an invaluable first step towards characterization of the sample, and we may add further measures to contextualize and interpret these classes. This addition is crucial, as the [CII] observations of this sample are relatively limited. That is, the spatial resolution of this dataset is low, with at best only beams across each source. In addition, while these sources are “normal” for this redshift range (i.e., on the star-forming main sequence), the modest integration times (i.e., hour) result in limited sensitivity. These effects cause the true nature of the galaxy to be partially obfuscated by random noise peaks, and to be spatially smoothed.
However, by investigating the morpho-kinematics of each source using different methods, it is possible to refine their classification, adding evidence for their intrinsic behaviour. To this end, we conduct a quantitative analysis of the morpho-kinematics of the sample by fitting each galaxy with a tilted ring fitting code and applying well-tested local morpho-kinematic classification criteria.
While tilted ring models (TRM) fitting codes have mainly been implemented to derive the physical parameters of rotating disk galaxies at low- and high-redshift (e.g., Fan et al. 2019; Sharma et al. 2021), they may also be used to classify the morpho-kinematic class of galaxies. That is, if the galaxy is truly a rotating disk, then the models will be well fit and yield rotation curves, morphological parameters, and kinematic parameters. On the other hand, early stage mergers will be poorly fit (but see discussions of Simons et al. 2019). Dispersion-dominated galaxies will be well fit with a TRM, but since their intrinsic morphologies are not necessarily flat disks, the best-fit physical parameters may not be physical. So by fitting a TRM to each of the [CII] data cubes in ALPINE, we may add additional evidence to each kinematic classification.
In this work, we examine the 75 [CII]-detected galaxies in the ALPINE survey using tilted ring models and morpho-kinematic classification criteria, with the goals of studying the kinematic diversity of this unique sample, testing the applicability of low-redshift classification criteria to high-redshift observations, and characterizing the properties (e.g., rotation curves, morphological parameters, velocity dispersion) of rotation-dominated ALPINE galaxies. We begin by describing the ALPINE survey and the creation of the [CII] data cubes in Section 2. The 3DBarolo modelling procedure and results are then presented in Section 3. We test the applicability of two quantitative morpho-kinematic classifiers from low-redshift studies in Section 4. Following a discussion of these results in Section 5, we conclude in Section 6. We assume a standard concordance cosmology (,,h)=(0.7,0.3,0.7) throughout.
2 Observations & Data Cube Creation
The overview of the ALPINE survey is presented in Le Fèvre et al. (2020), while the observations, data reduction and the creation of the public catalog111Catalog and data products are available at https://cesam.lam.fr/a2c2s/data_release.php are detailed in Béthermin et al. (2020), and the multiwavelength photometry analysis of the ALPINE sources is described in Faisst et al. (2020). The [CII] m and the surrounding rest-frame FIR continuum emission of each source was observed with ALMA in cycles 5 and 6. Each observation was calibrated using the standard heuristic-based CASA (Common Astronomy Software Applications; McMullin et al. 2007) pipeline, and the results were inspected for quality. After some minor additional flagging, these data were used to create preliminary data cubes, which are now publicly available.
Each cube was continuum-subtracted in the uv-plane using the CASA task uvcontsub, resulting in a line-only, continuum-free data cube. Since the restoring beam of each observation was comparable (average of , Béthermin et al. 2020), each image was created using a uniform cell size of . The line cubes were constructed with channels of km s-1, or MHz. All cubes were cleaned down to (CASA tclean) and were created using natural weighting.
3 Tilted Ring Model Fitting
While there is a multitude of codes that extract the physical parameters and kinematic details of a galaxy from observational data, they may be divided into two broad classes: codes that fit models to the velocity field (e.g.; GIPSY rotcur, van der Hulst et al. 1992; NEMO rotcurshape, Teuben 1995; reswri, Schoenmakers 1999; ringfit, Simon et al. 2003; kinemetry, Krajnović et al. 2006; diskfit, Sellwood & Spekkens 2015) and codes that use the entire data cube (e.g.; tirific, Józsa et al. 2007; dysmal, Cresci et al. 2009; kinms, Davis et al. 2013; 3DBarolo, Di Teodoro & Fraternali 2015; galpak 3d, Bouché et al. 2015; blobby3d, Varidel et al. 2019).
We choose to apply the 3-D tilted ring model fitting code 3DBarolo to the [CII] emission of the ALPINE sample. This code has already been well-tested on data cubes with relatively low resolution and sensitivity (Di Teodoro & Fraternali 2015) and has been successfully applied to high-redshift () observations (e.g., Talia et al. 2018; Fan et al. 2019; Neeleman et al. 2020; Fraternali et al. 2021).
3.1 Signal Isolation
To fit our data with a tilted ring model, we must first mask the [CII] emission and exclude sources that are detected at too low resolution or sensitivity for kinematic modelling. First, the data cubes for each [CII]-detected ALPINE source were trimmed to only include the sideband (i.e., two spectral windows; SPWs) containing [CII] emission, and the rest frequency of each was set to that of [CII] at the redshift derived by Béthermin et al. (2020). In some cases, the spectral setup created a gap between the two SPWs, which we masked.
Next, the line emission in each continuum-subtracted cube was identified using the SEARCH algorithm in 3DBarolo, which is based on the code DUCHAMP (Whiting, 2012). After automatically determining the median noise level of each channel, this algorithm searches for pixels with intensities above a user-provided SNR (SNR). Here, SNR is defined as the value of a given pixel divided by the noise level of its channel. A three-dimensional (i.e., RA, DEC, velocity) search is then conducted around these peaks for emission above a second user-provided SNR (SNR), creating a three-dimensional mask of the signal in the cube. Decreasing SNRlower (e.g., to 2.0) results in the inclusion of more pixels for every source, but in many cases also encloses noise peaks that complicate kinematic characterization. On the other hand, SNRupper is simply used to find the bright pixels at the centre of each mask, so slightly varying this value (e.g., from ) has little effect for most our [CII]-detected sources (; Béthermin et al. 2020).
To avoid a contribution from non-target sources (i.e., noise peaks and serendipitous sources distant from the phase centre; see Loiacono et al. 2021 for analysis of this latter type of objects), we remove all sources that are beams from the centre from our signal mask. In addition, we exclude all unresolved sources by removing sources that feature a masked area (i.e., contour) smaller than the half-power area of the synthesized beam of the input [CII] data cube.
3.1.1 SEARCH Results
Of the 118 galaxies observed in ALPINE, Béthermin et al. (2020) found [CII] emission () in 75 at the expected frequency from the UV spectroscopy results (Faisst et al., 2020). By applying 3DBarolo SEARCH to the continuum subtracted cubes of these 75 [CII]-detected ALPINE galaxies, we identify emission in 40 galaxies, given the constraints outlined above.
The disparity in the number of detected galaxies is mainly due to the fact that the line search algorithm used by Béthermin et al. (2020) is more sensitive to low-level, broad emission than SEARCH. That is, the prior algorithm is able to search the cube using kernels of different velocity widths, while SEARCH searches for pixels above a single value and then merges them. Since our morpho-kinematic analysis will examine each spectral channel of the data cube (see Section 3.2), we require significant (i.e., ) emission in all spectral channels and thus must exclude broad, low-level emission.
An additional important difference is our criterion that the identified signal must have a contour that is larger than the half power contour of the restoring beam. This limit on compactness, which is not present in the Béthermin et al. (2020) search, is necessary to avoid fitting marginally- or un-resolved galaxies. It excludes all compact dispersion dominated sources (morpho-kinematic class 4 in Le Fèvre et al. 2020).
The five morpho-kinematic classes of Le Fèvre et al. (2020) contain 9, 31, 15, 8, and 12 galaxies (75 total) for classes 1 through 5, respectively. Of these sources, we recover 6, 21, 13, 0, and 0 galaxies, respectively (40 total). The total lack of compact or weak (class 4 or 5, respectively) galaxies is explained by the algorithm criteria noted above. However, we do recover of the sources originally classified into classes 1-3.
3.2 3DFIT Details
Once the [CII] signal from resolved sources has been isolated using 3DBarolo SEARCH, the main function of 3DBarolo (i.e., 3DFIT) is then used to fit a tilted ring model to the line emission. In general, tilted ring models assume that a galaxy may be approximated as a set of concentric rings, each with its own geometric and kinematic parameters (e.g., Rogstad et al. 1974). Three-dimensional model fitting considers some variables that are included in two-dimensional fits: inclination (i), position angle (PA), rotational velocity (), systemic redshift ( or vsys), and the spatial centroid (x0, y0). By expanding to the spectral dimension, we may also consider velocity dispersion (), radial brightness profile (), and scale height (). While this task is able to automatically predict many parameters and is well-tested for low-SNR and low-resolution observations, its performance is dependent on the initial parameter estimates and the overall model geometry, including the radius of the model and the width of each ring. Before we detail the fitting process, we will discuss the methods used to derive physically motivated estimates for each parameter.
3.2.1 Parameter Estimation
To begin, each cube is collapsed over all channels containing line emission (as identified by 3DBarolo SEARCH) using the CASA toolkit task im.moments. The resulting integrated intensity (i.e., moment 0) map is fit with a two-dimensional Gaussian using the CASA toolkit task im.fitcomponents, yielding a best-fit peak intensity, integrated flux density, beam-deconvolved FWHM of the major and minor axes, position angle, and central position. In addition, a velocity field (moment 1) and velocity dispersion (moment 2) map are created using the same task, including only pixels identified through the SEARCH algorithm.
To avoid under- or over-sampling the data, the ring geometry is determined in an automatic fashion. If the emission in the moment zero map is sufficiently resolved to allow CASA to fit a 2-D Gaussian and deconvolve the intrinsic emission from the synthesized beam, then we set the maximum model radius to (the deconvolved FWHM of the major axis of the 2-D Gaussian), based on the high-resolution kinematic analysis of Neeleman et al. (2020). If the source is not sufficiently resolved, we exclude it from further analysis.
The minimum radius of each ring is fixed to be the FWHM of the minor axis of the restoring beam divided by 2.5. This factor of 2.5 is comparable to other beam/ring width ratios (e.g.; 2.2, Shao et al. 2017; 2.5, Talia et al. 2018; Fan et al. 2019) and is chosen as a middle-ground between the number of pixels per beam FWHM () and the lower factors adopted by other studies of galaxy morpho-kinematics (e.g.; , Shelest & Lelli 2020; Mancera Piña et al. 2020; Salak et al. 2020; , de Blok et al. 2008). Note that while this high ratio may oversample the data in the case of 2-D (i.e., velocity field) modelling, our use of 3-D modelling reduces the effects of beam smearing, allowing us to sample spatial scales slightly smaller than the synthesized beam (e.g., Di Teodoro & Fraternali 2015).
The number of rings is then determined by dividing the maximum model radius by the minimum ring radius and rounding down to the closest integer. If this number is , then the width of each ring is set to the maximum model radius divided by the number of rings. We do not consider models containing only one ring.
While 3DBarolo allows the user to fit the central position of each ring at the same time as the inclination and position angle, we fix the central position of all model rings to the morphological central position, as found through a 2-D Gaussian fit to the moment zero map, in order to reduce the free parameters of the fit. Since we wish to test how well the data are fit by a rotating disk model, this is tantamount to assuming that the morphological and kinematic centres of the galaxy are coincident.
The initial guess for the velocity dispersion is based on the moment two map, and a thin disk is assumed ( pc at ). Each galaxy is given an initial systemic velocity estimate of with respect to the assumed redshift. The inclination is allowed to vary between , with an initial guess of . 3DBarolo provides an initial guess for the rotational velocity based on the data cube, while we estimate the position angle by examining the high-velocity channel maps.
3.2.2 Fitting Procedure
Using these initial morphological and kinematic estimates and a list of ring radii and widths, 3DBarolo first creates a model of the innermost ring by populating a physical volume with discrete clouds, such that all estimated parameters are recreated. This model is then converted into an observational cube (i.e., with axes of RA, Dec, velocity), convolved with the synthesized beam of the input data cube, normalized by setting the integrated flux per spaxel in the model and input data cubes equal, and compared to the input cube. Each parameter (i.e., rotational velocity, velocity dispersion, systemic velocity, inclination, and position angle) is varied, until the absolute residual (i.e., over all pixels) is minimized. When the residual is minimized, the fitting stops, and the next ring is analysed. After all rings have been fit, the best-fit spatial parameters (i, PA) and vsys across all rings are averaged and fixed. The fitting is then repeated for the remaining parameters (i.e., rotational velocity and velocity dispersion).
The final outputs of this process are morphological parameters from a 2-D Gaussian fit to the moment zero map (i.e., inclination, position angle, central position, radius), morpho-kinematic parameters from the 3DBarolo fit (i.e., inclination, position angle, velocity dispersion profile, rotation curve, systemic velocity/redshift), and a best-fit model data cube that may be directly compared to the data. For further discussion of this procedure, see Appendix A.
3.2.3 Tilted Ring Model Results
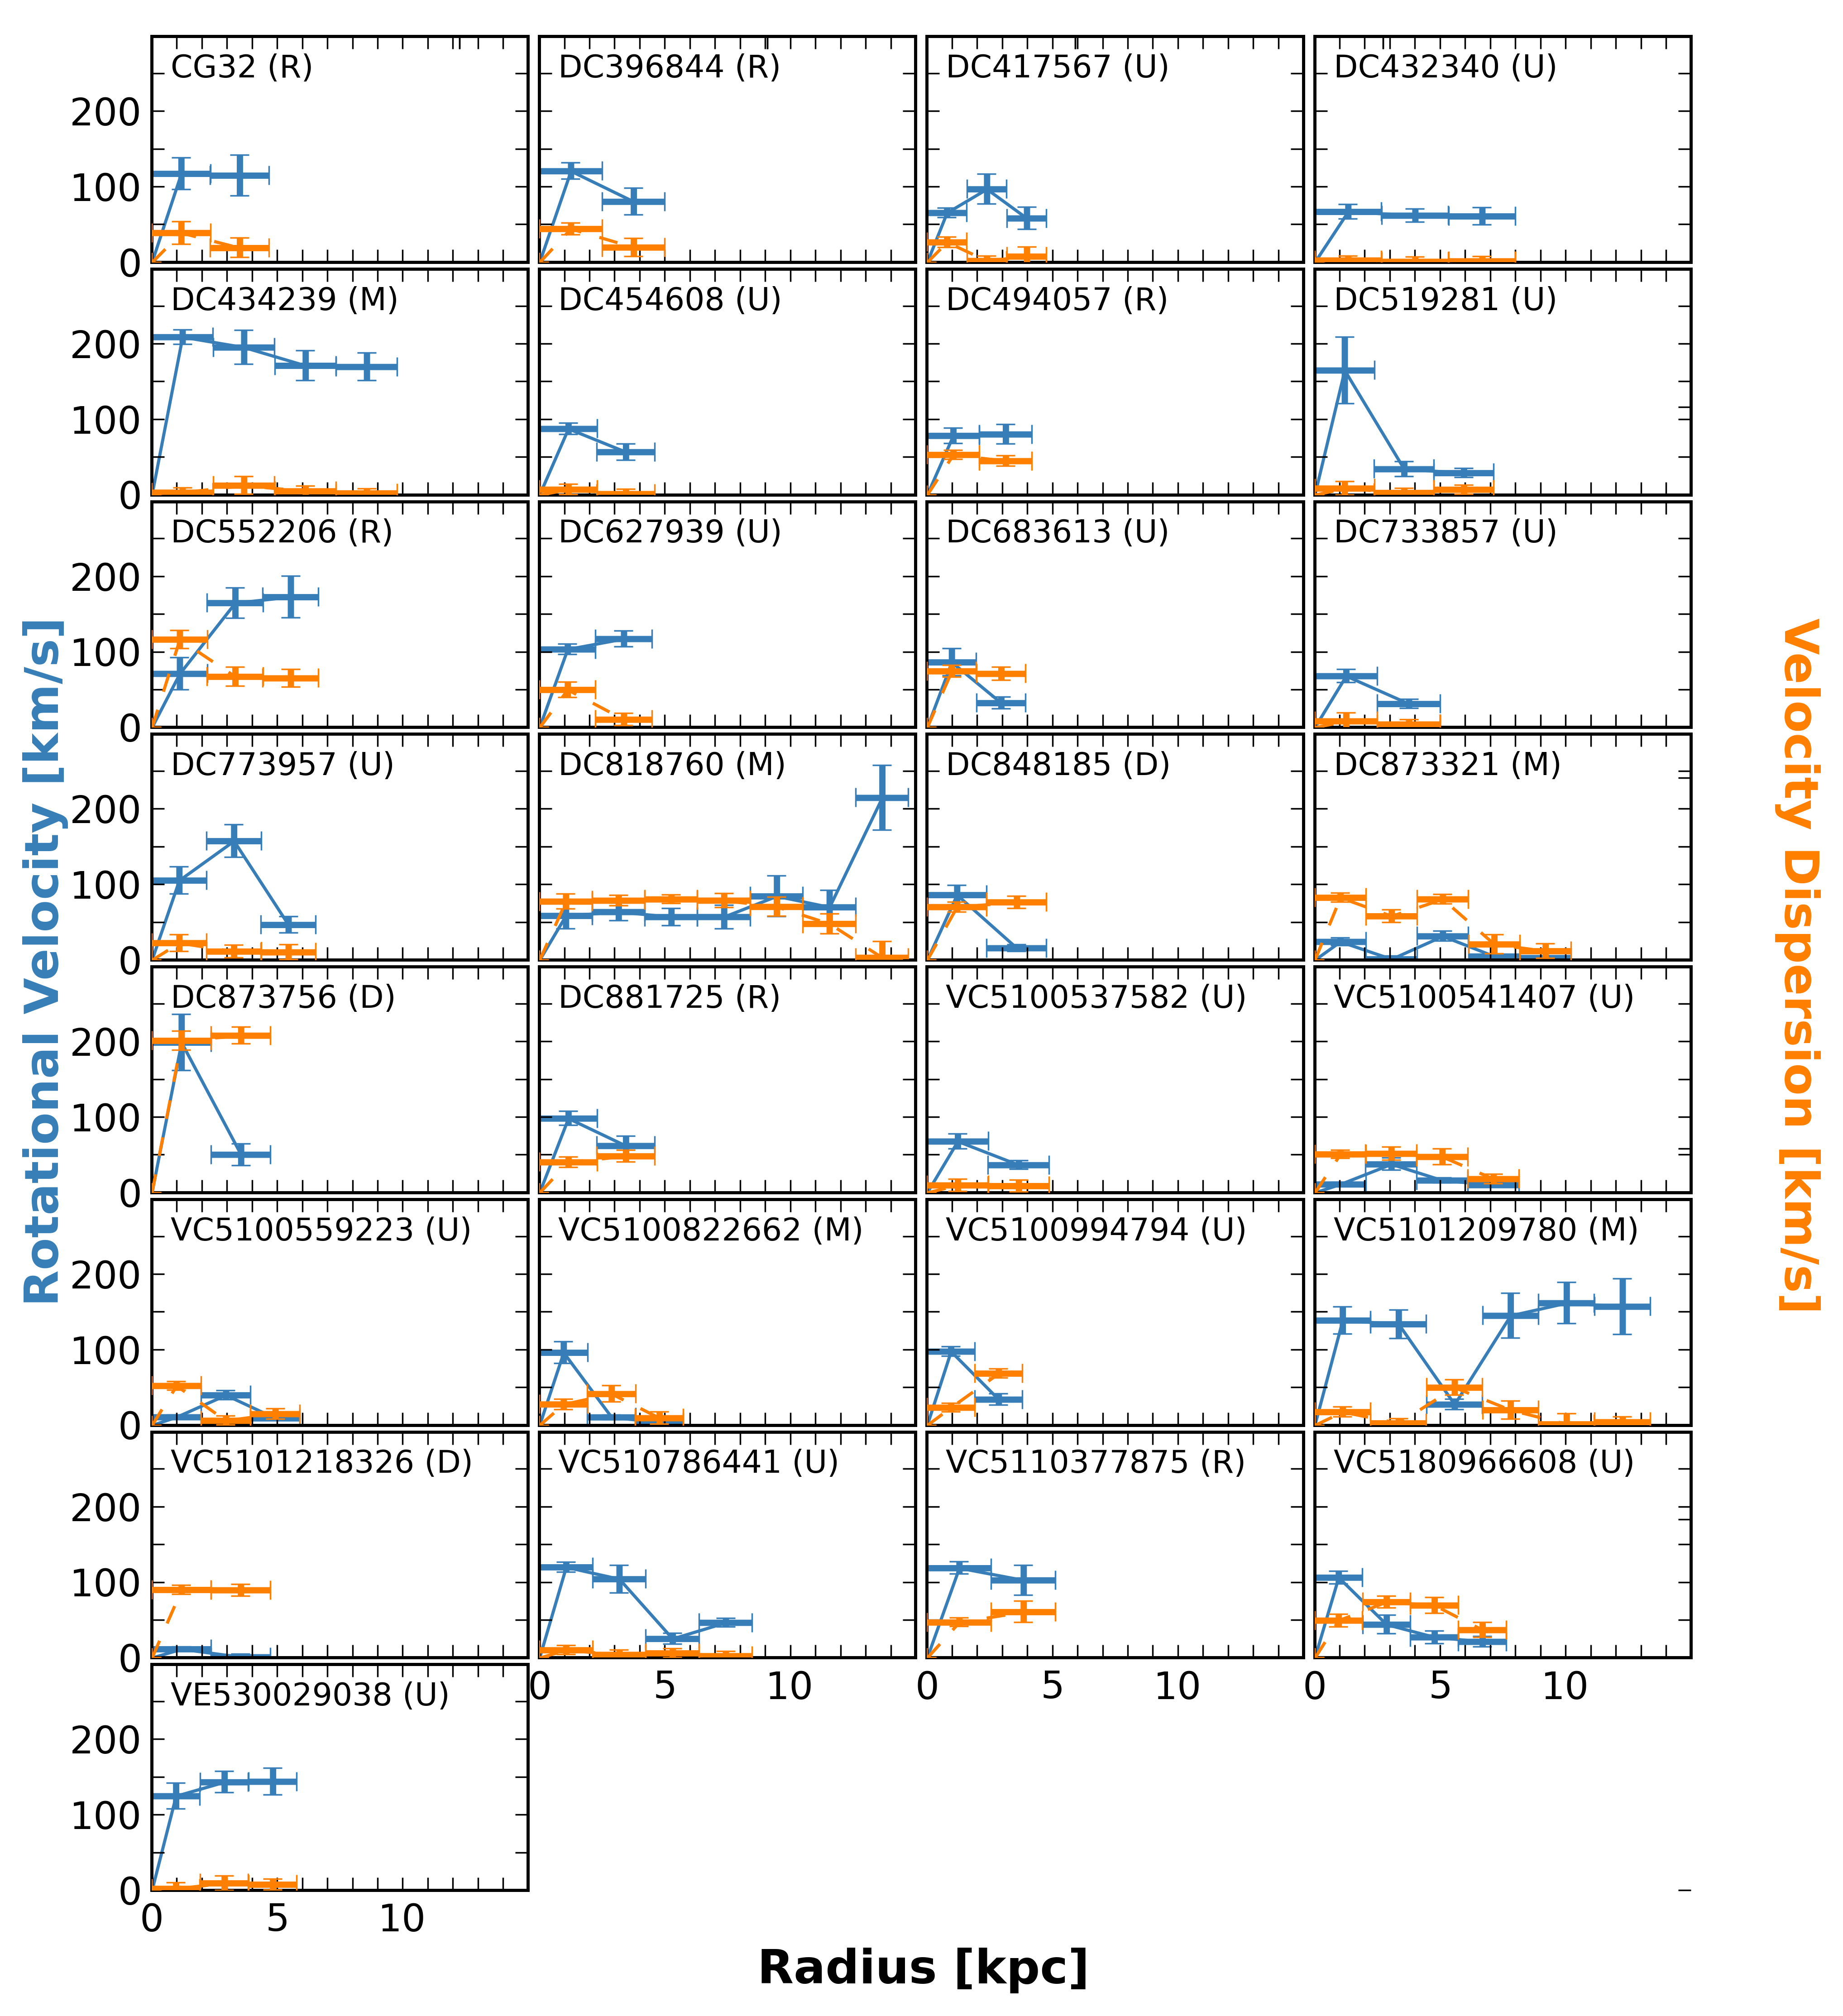
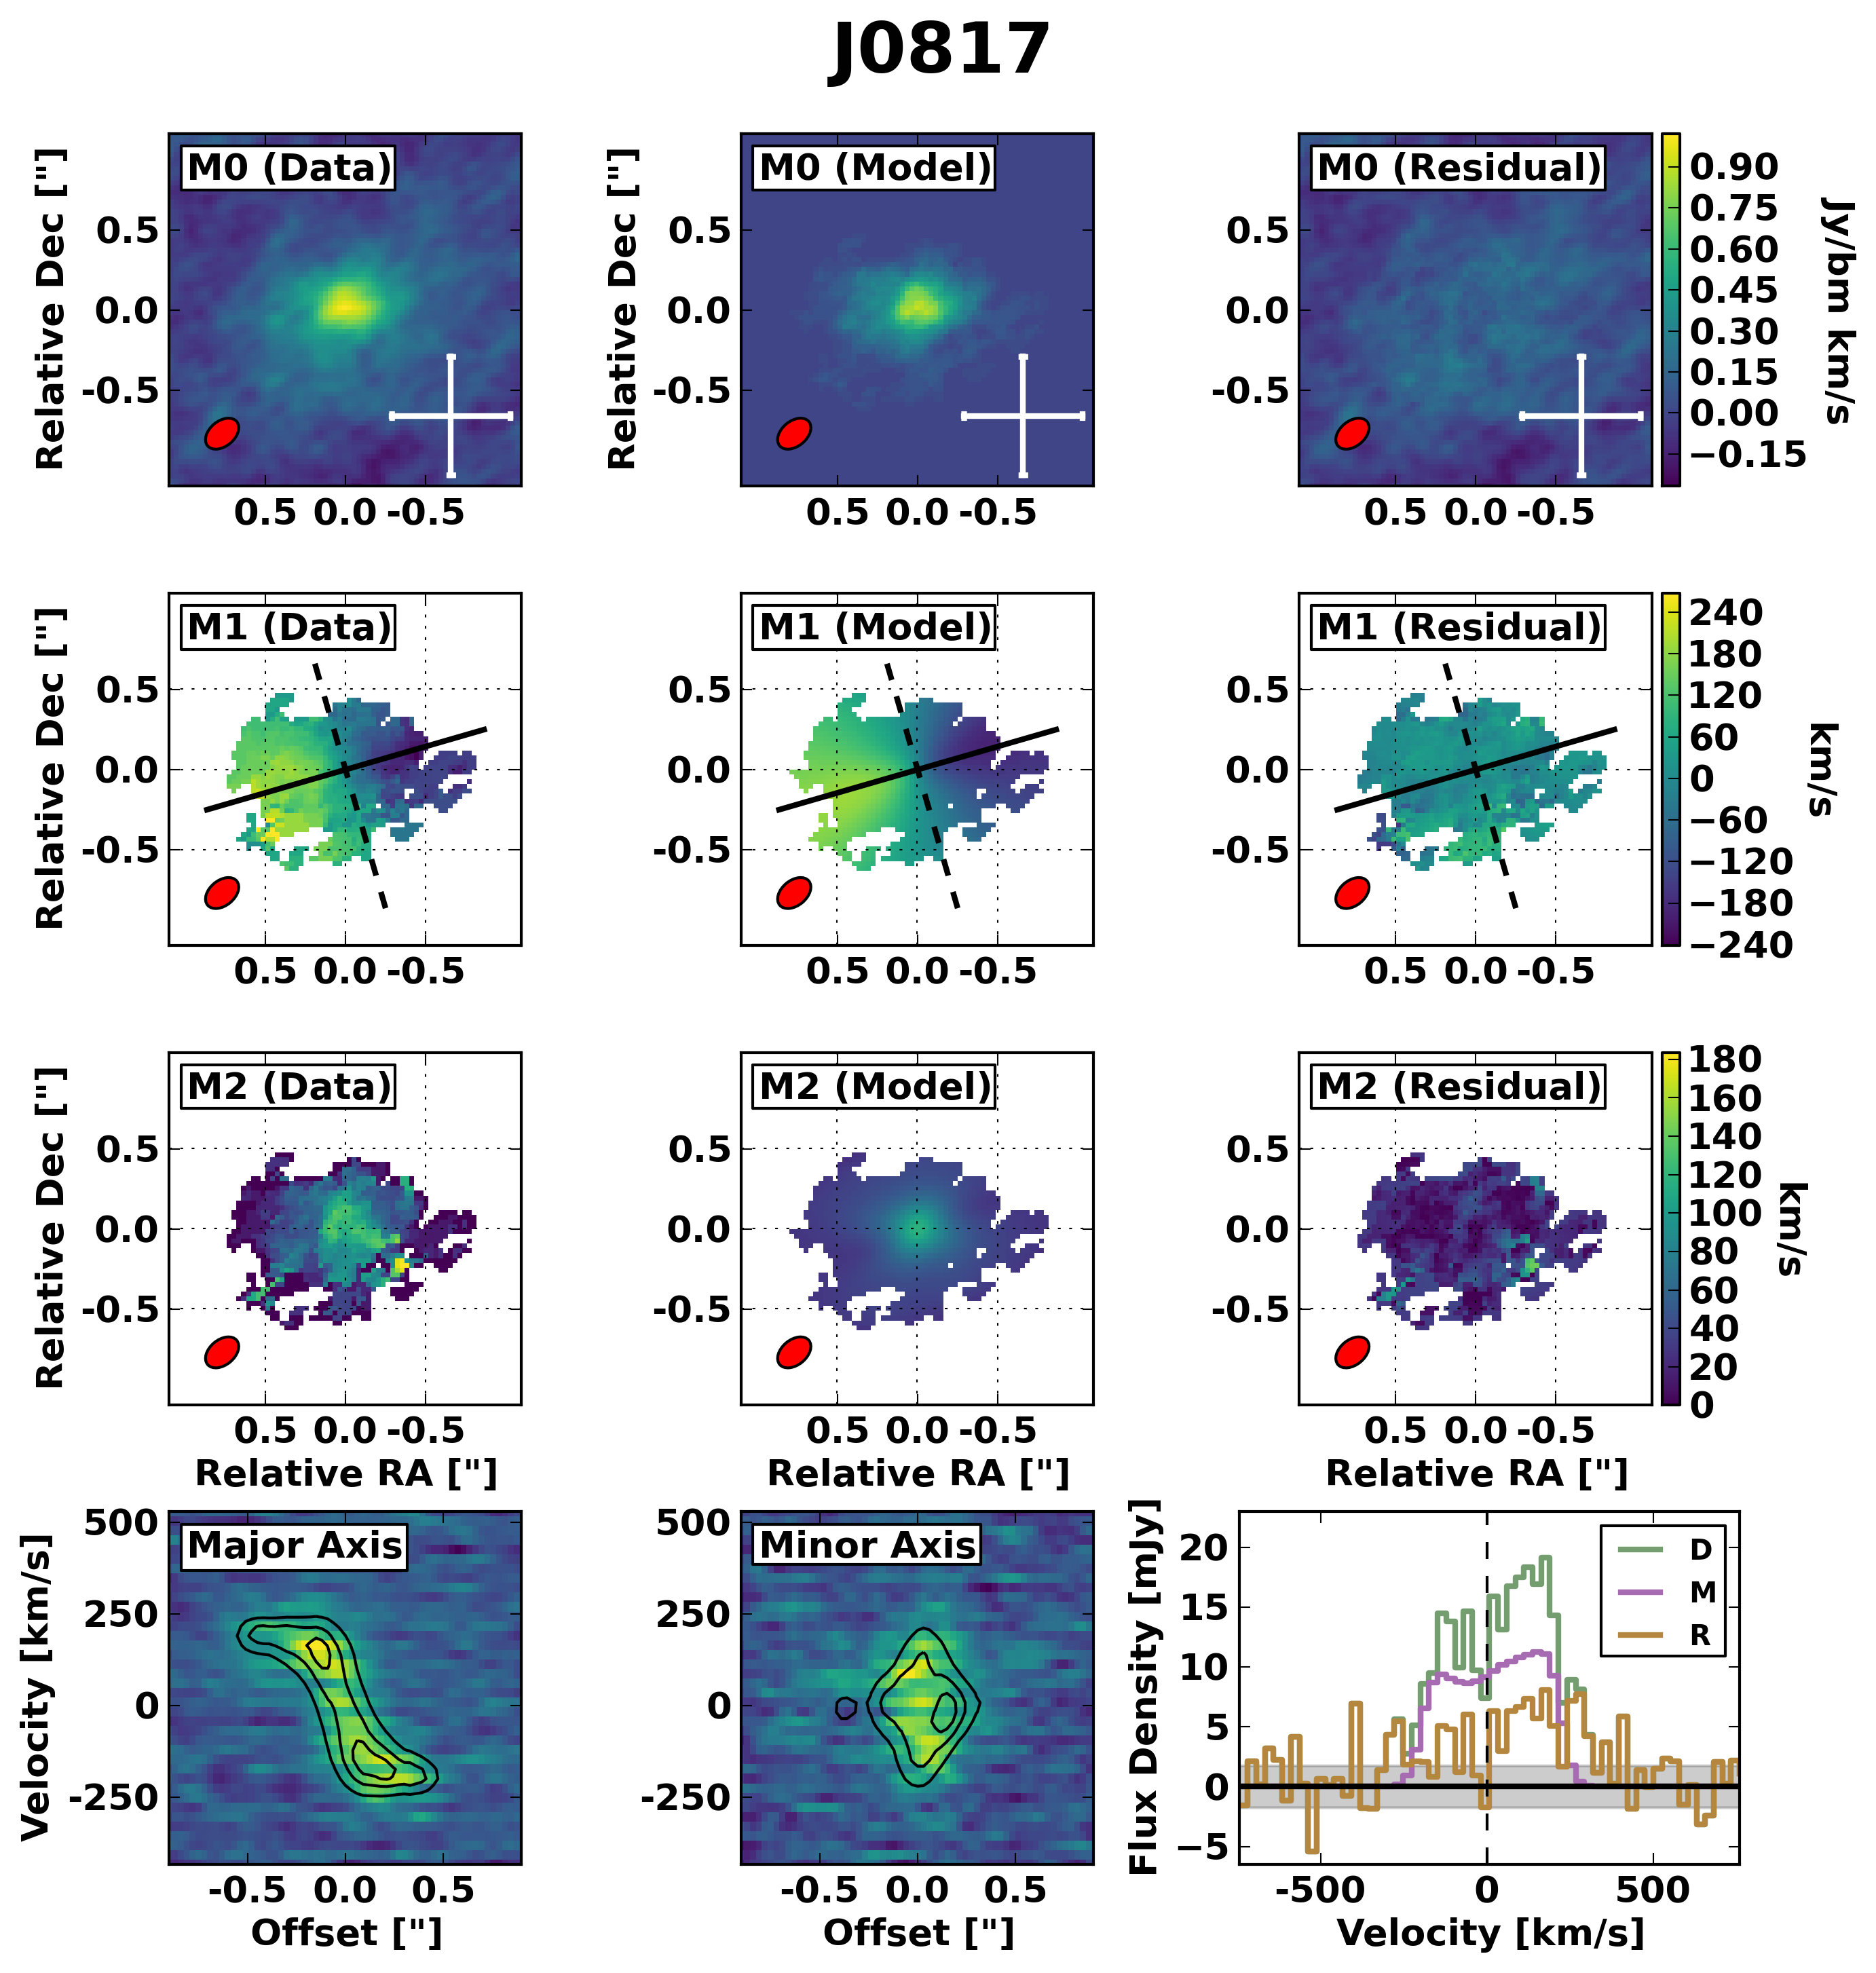
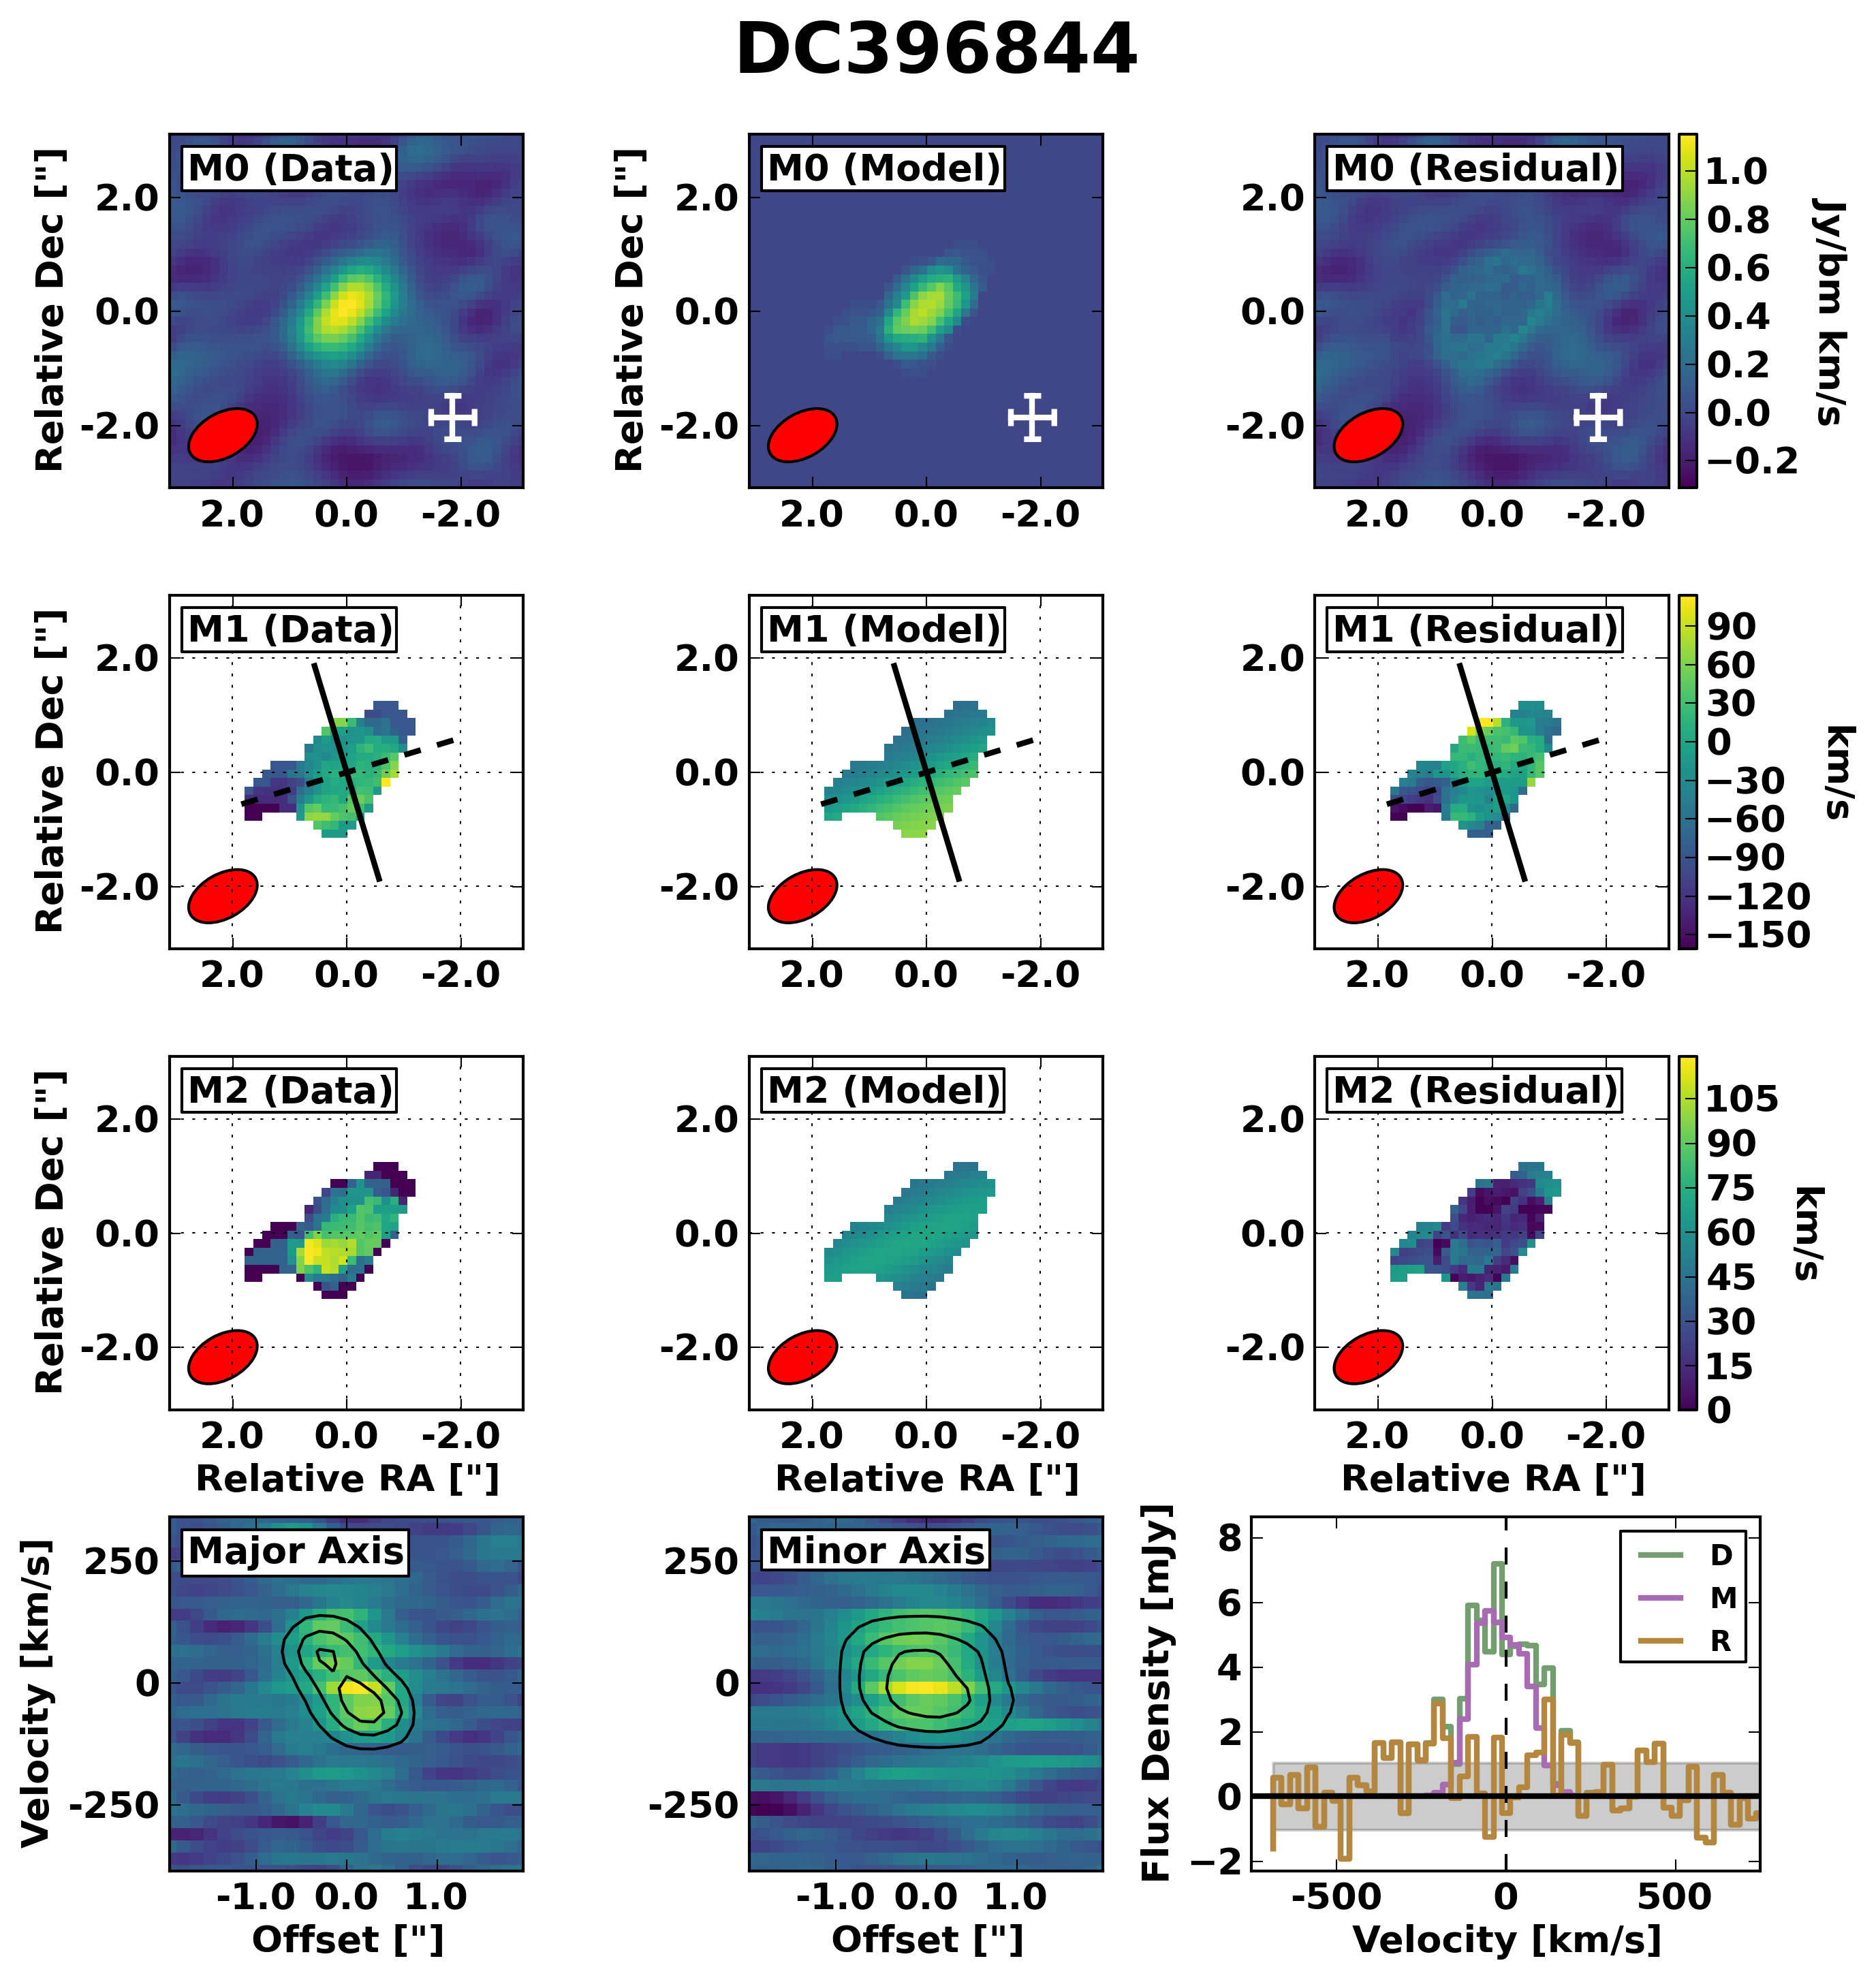
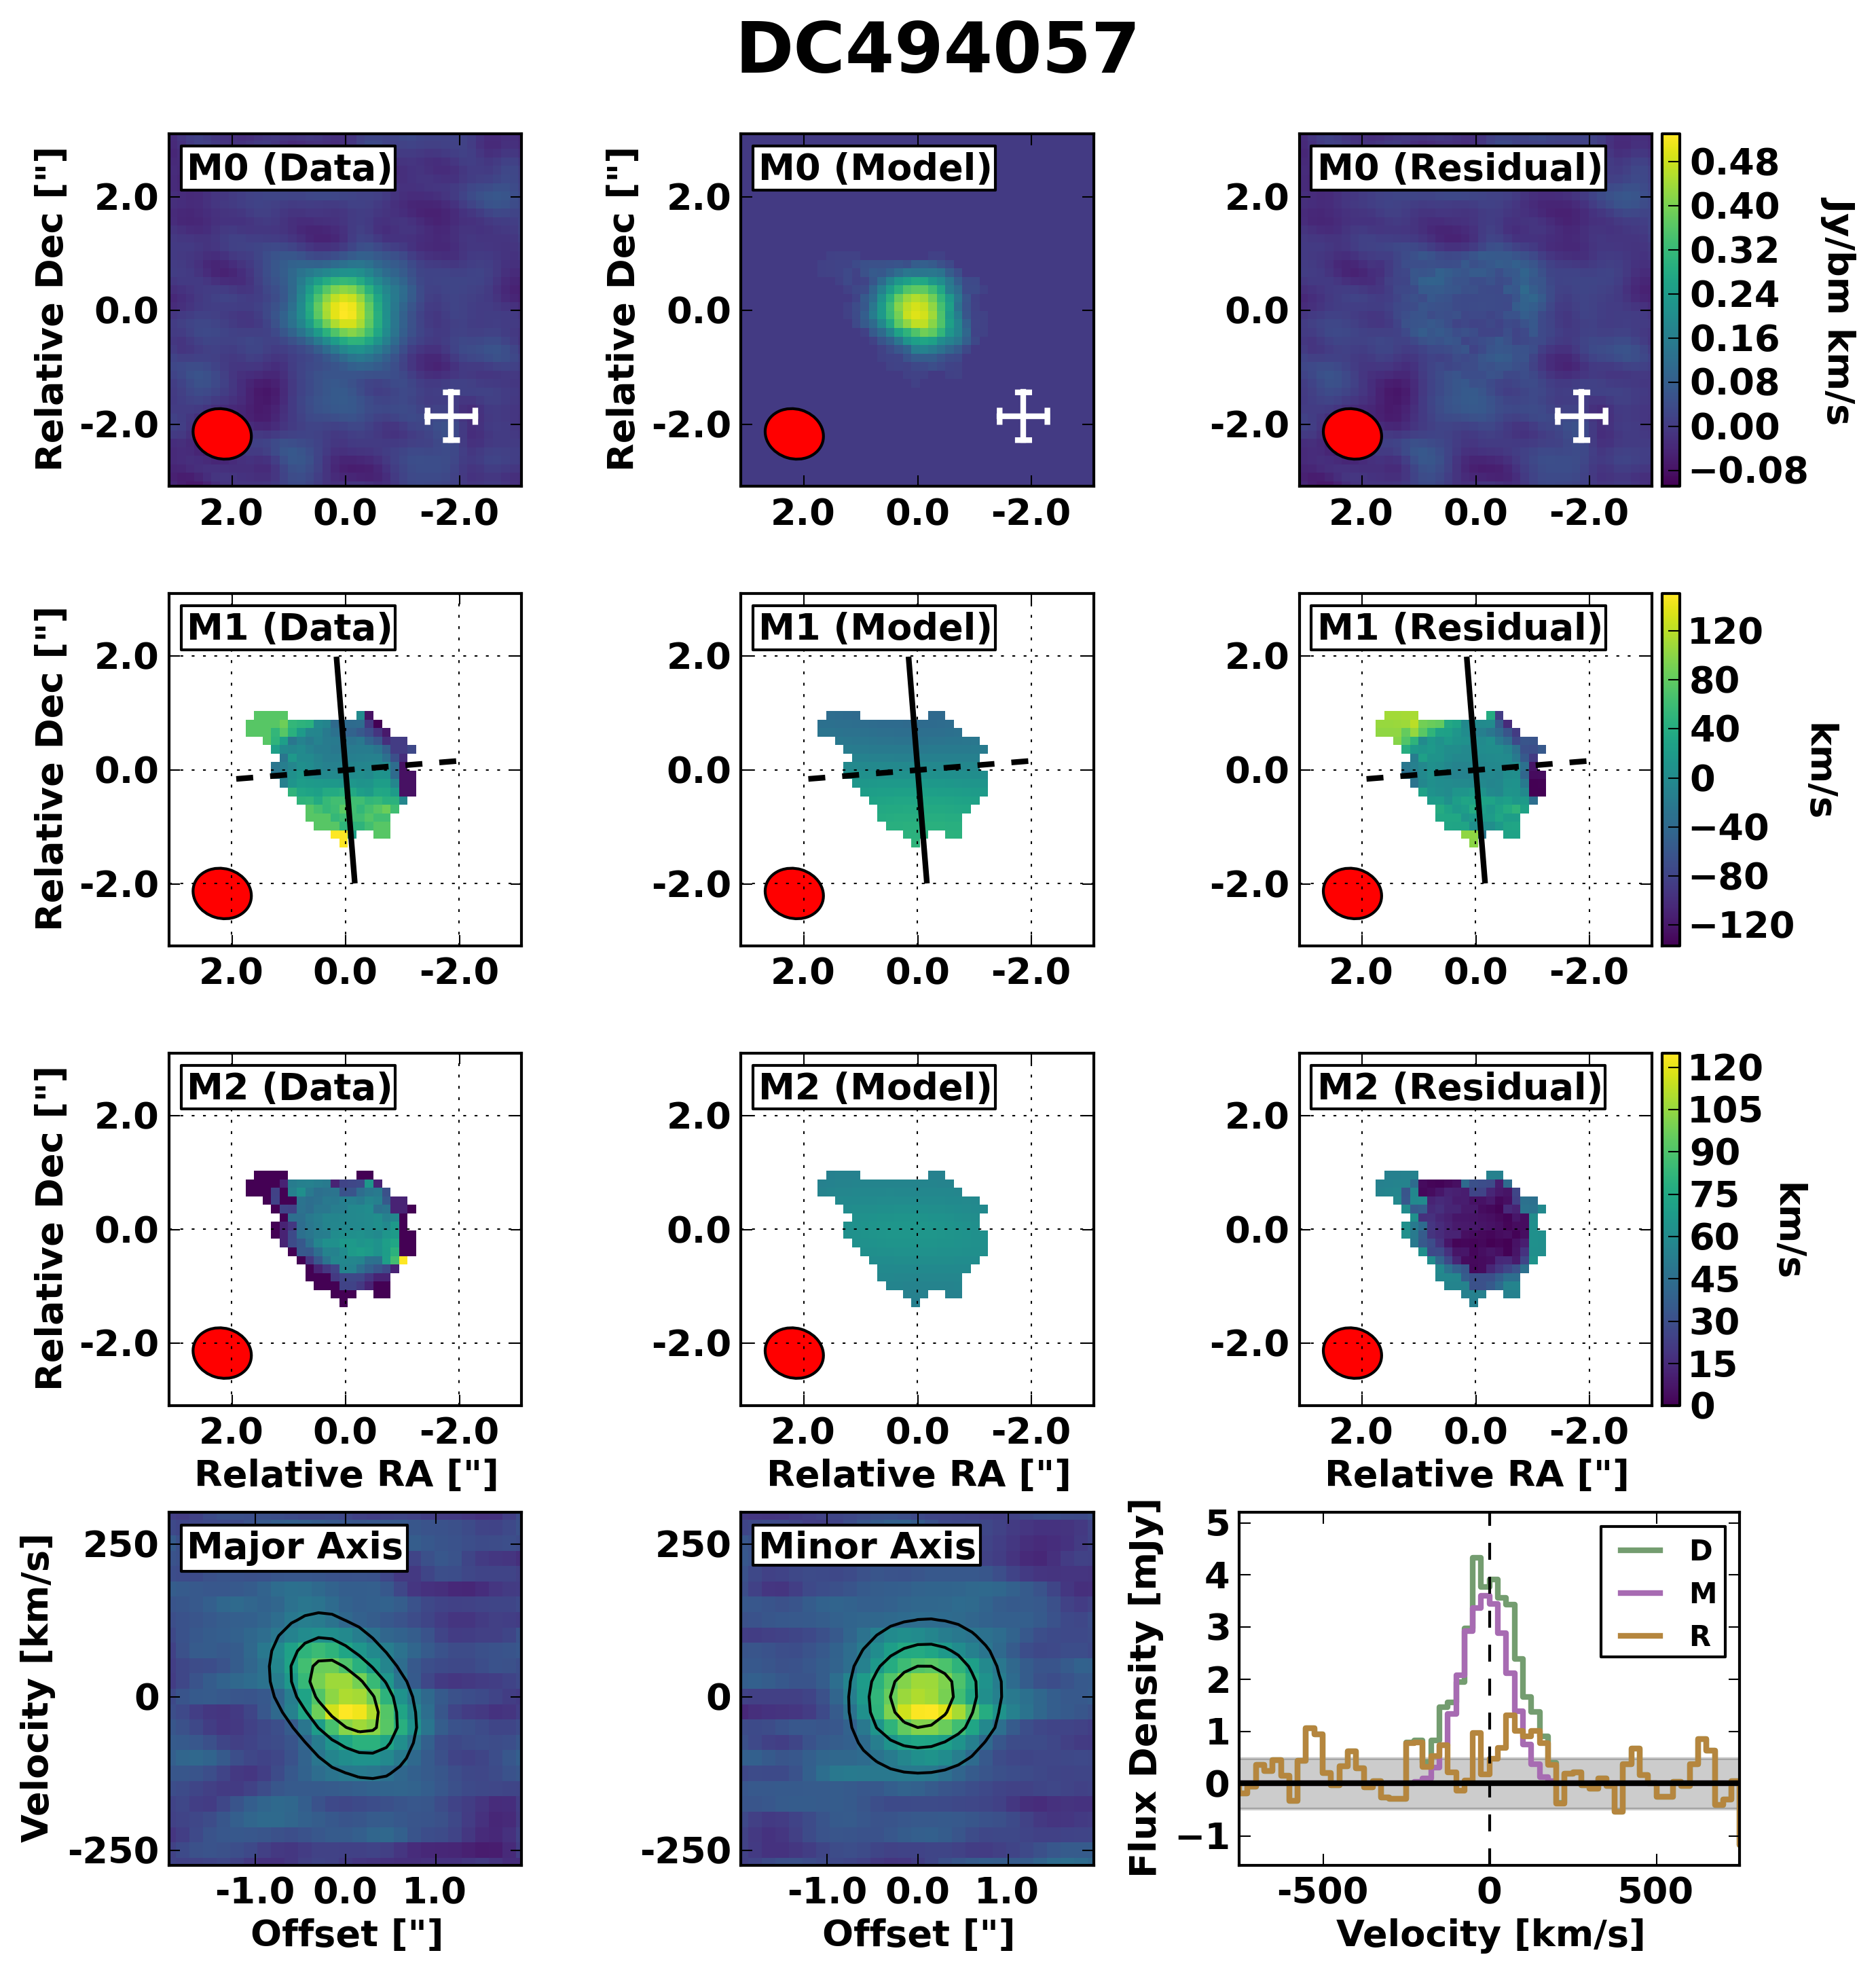
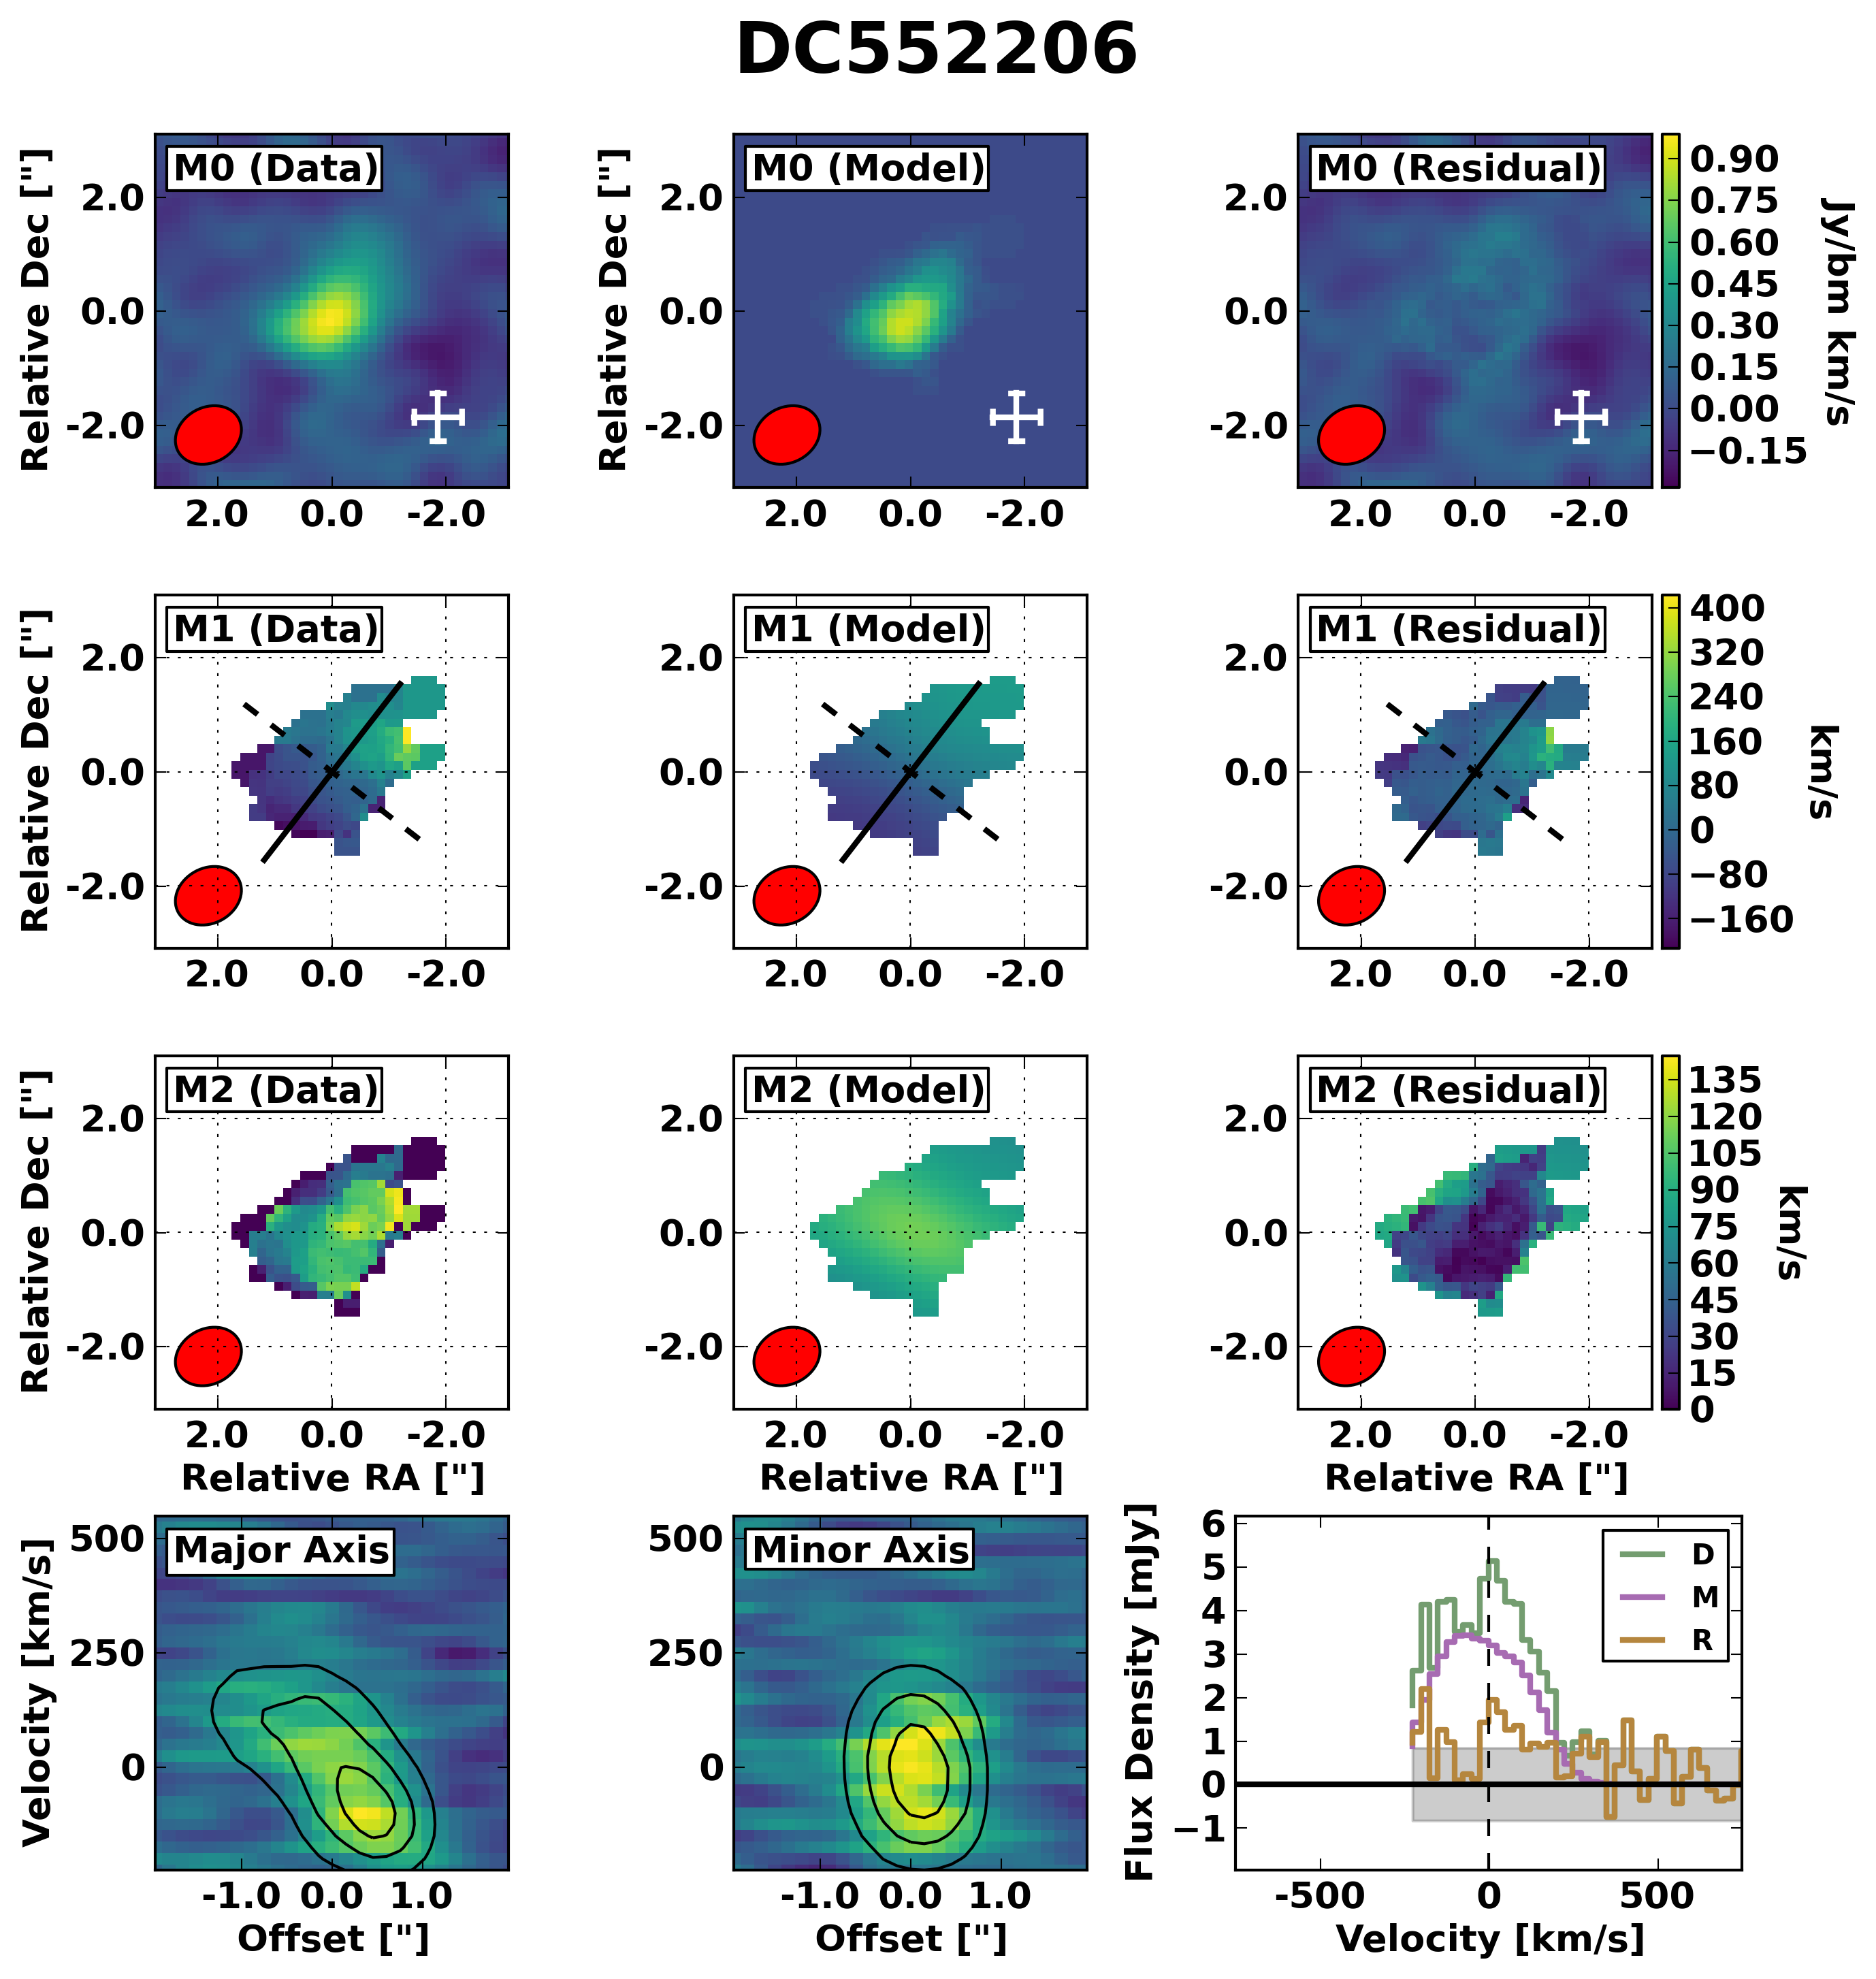
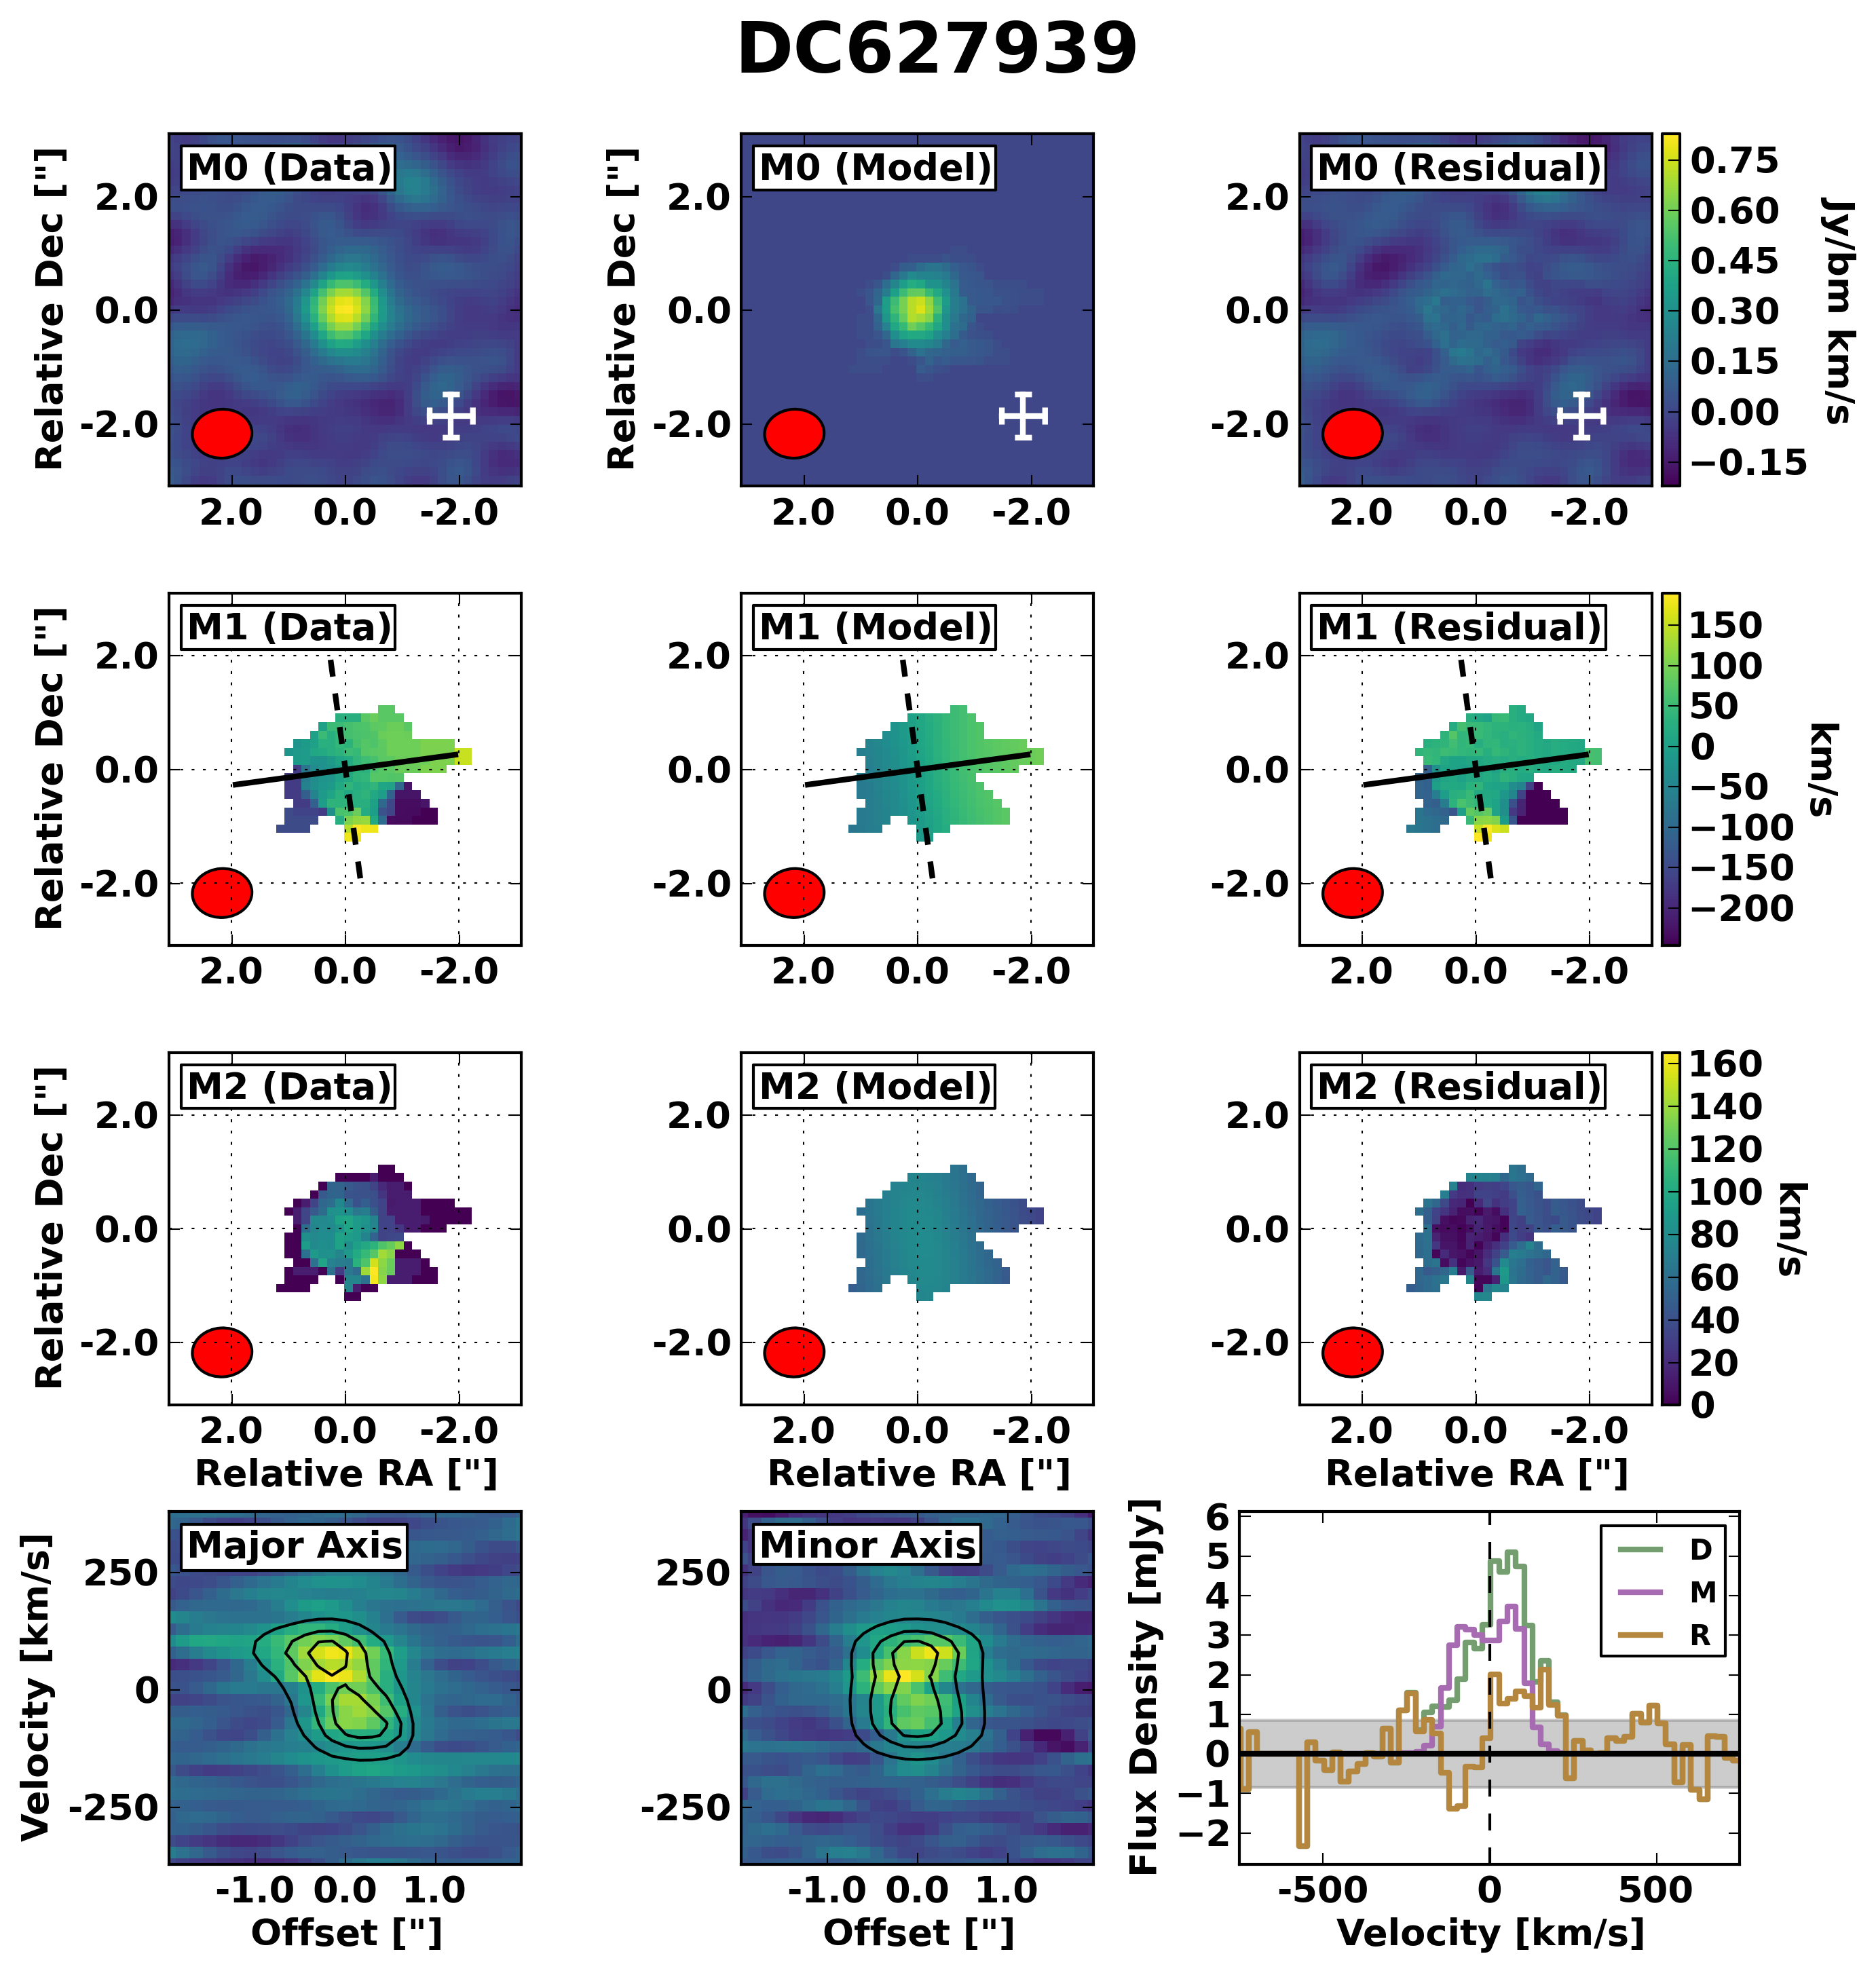
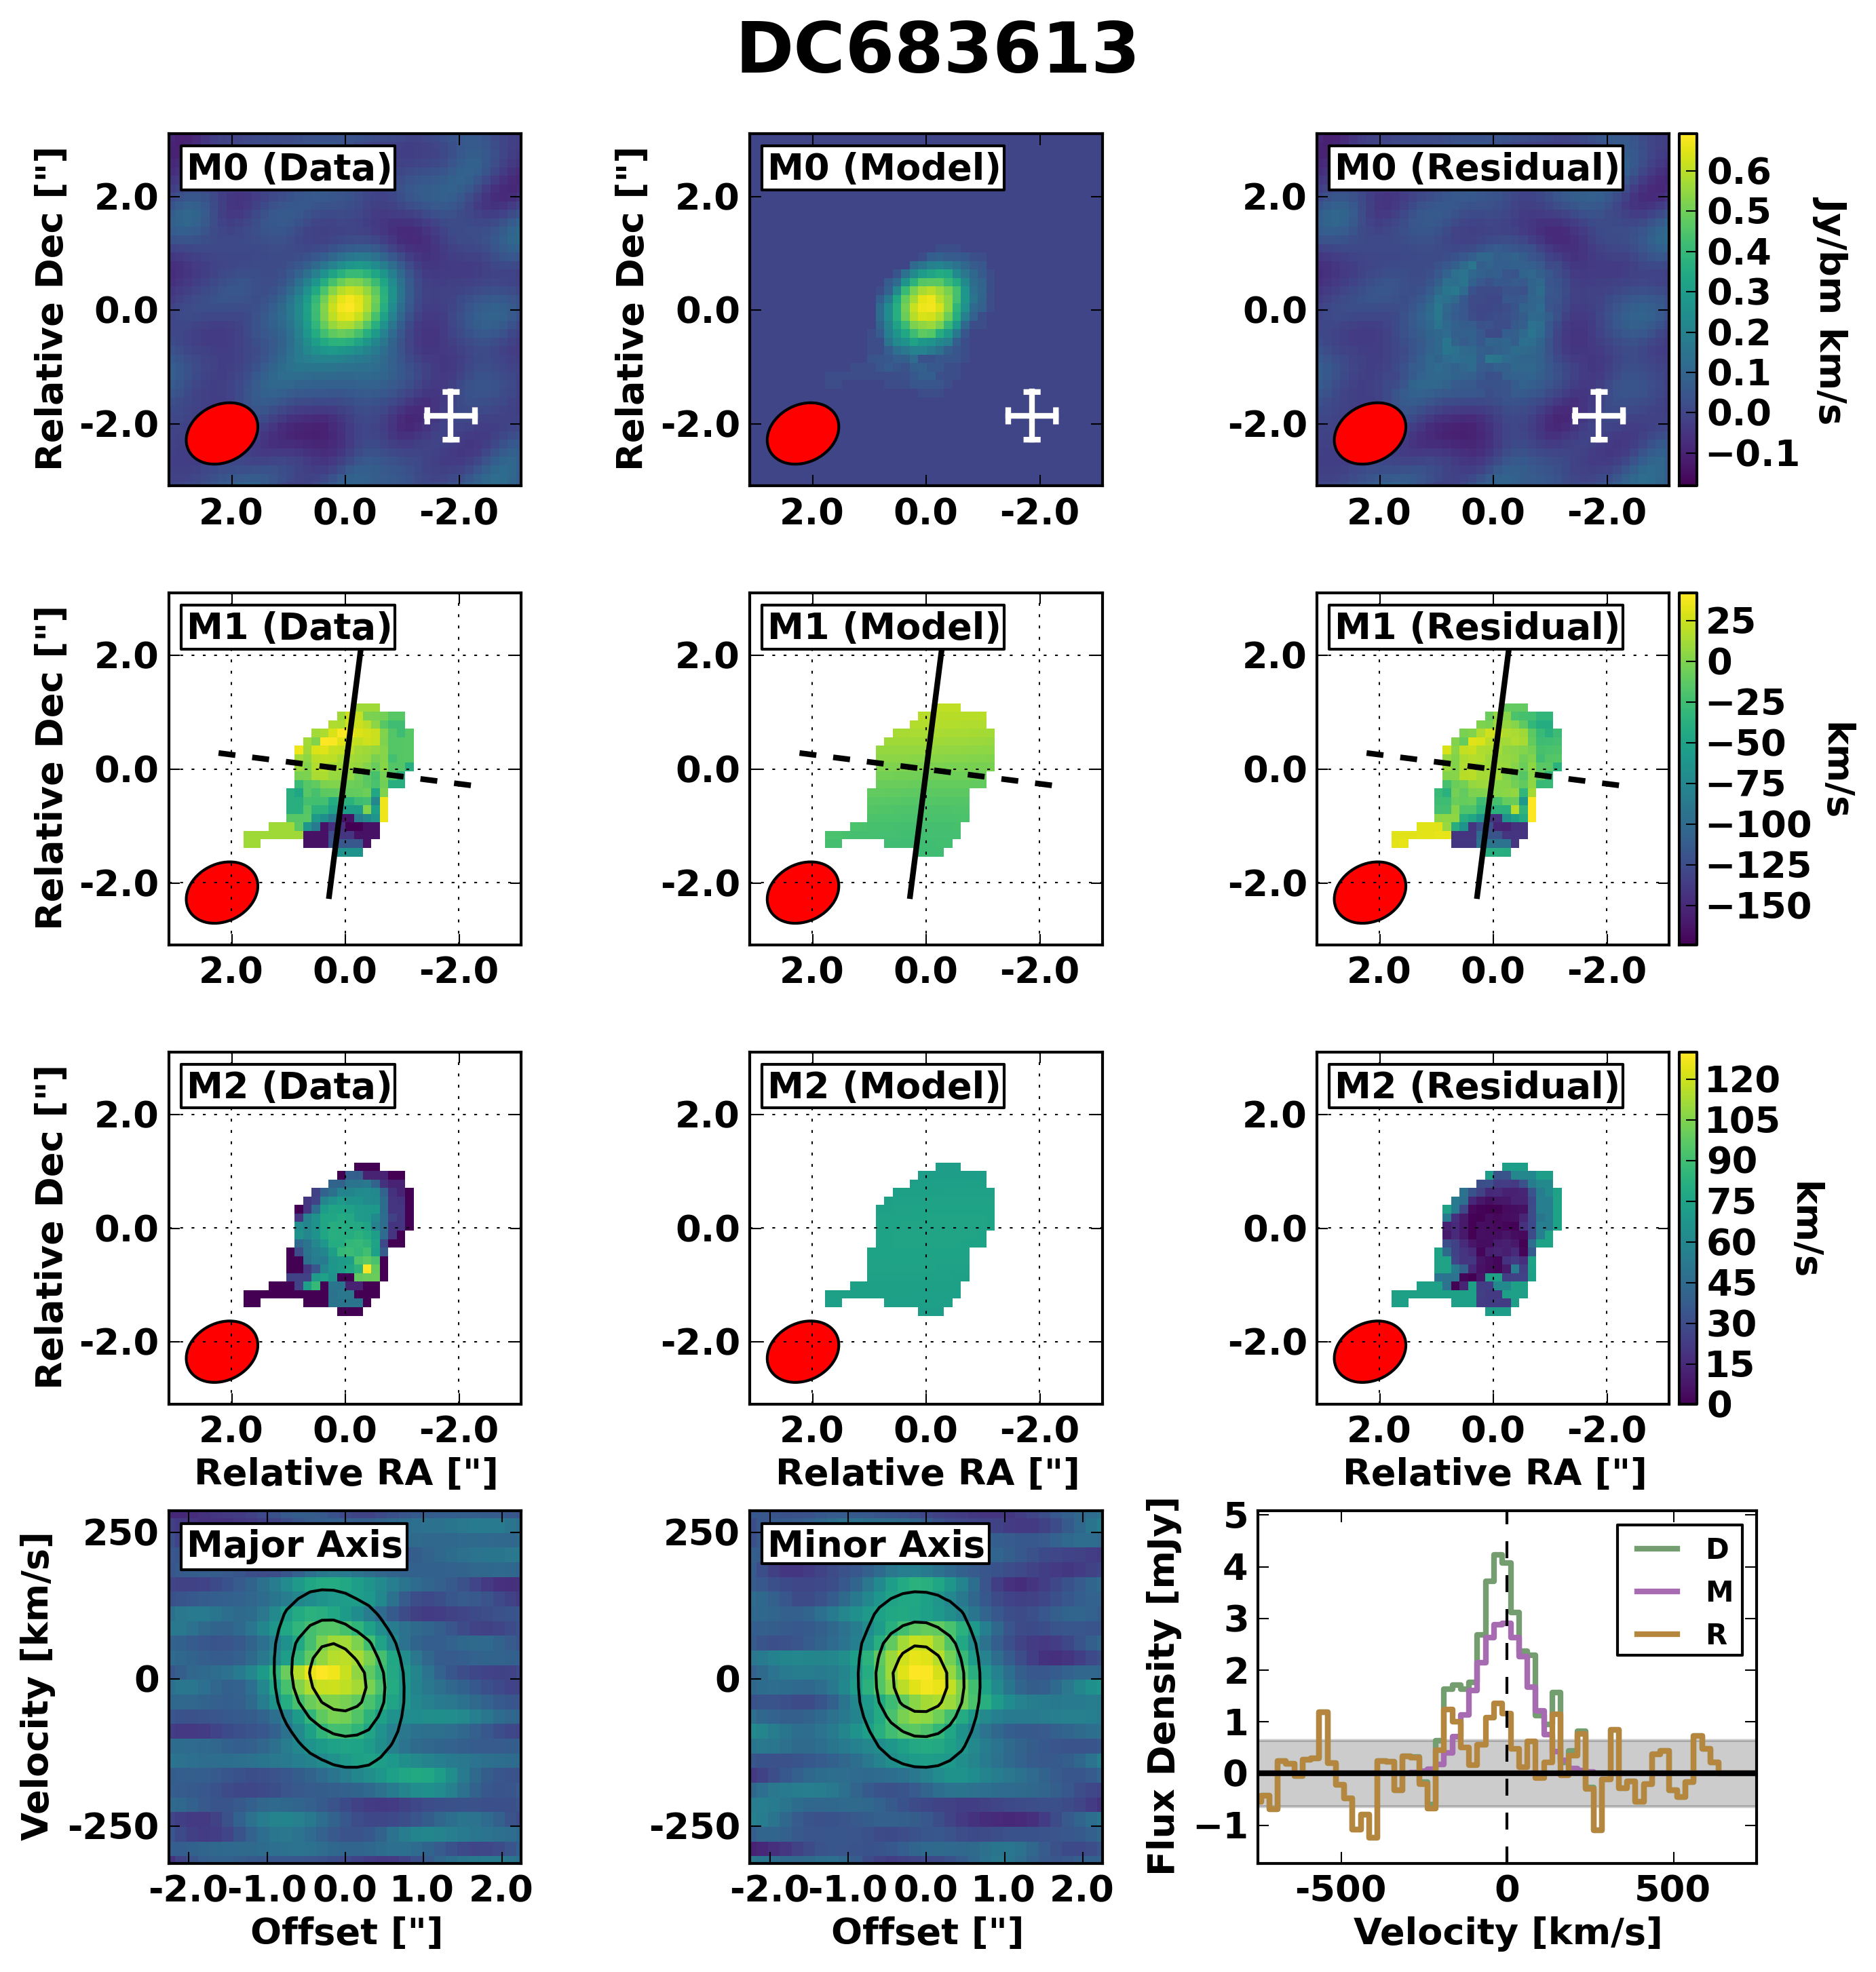
When 3DBarolo 3DFIT is run on the 40 recovered sources (see Section 3.1.1 for details of signal isolation), (six sources) are not successfully modelled due to being only marginally resolved (i.e., it was not possible to deconvolve the moment zero map from the synthesized beam), while another (five sources) are resolved but are excluded due to only featuring 1 ring. For the 29 galaxies that are successfully fit, we present comparisons of moment maps, PVDs, and spectra for the data and models in Figures 1 and 9 through 14, list the best-fit parameters in Table 1, and show the best-fit rotation curves and velocity dispersion profiles in Figure 2. Each source is also discussed in Appendix B.
| Name | W15 | KC1 | KC2 | |||||||||
| 1 | 2 | 3 | 4 | 5 | L20 | J21 | ||||||
| CG32 | 2 | ROT | ||||||||||
| DC396844 | 1 | ROT | ||||||||||
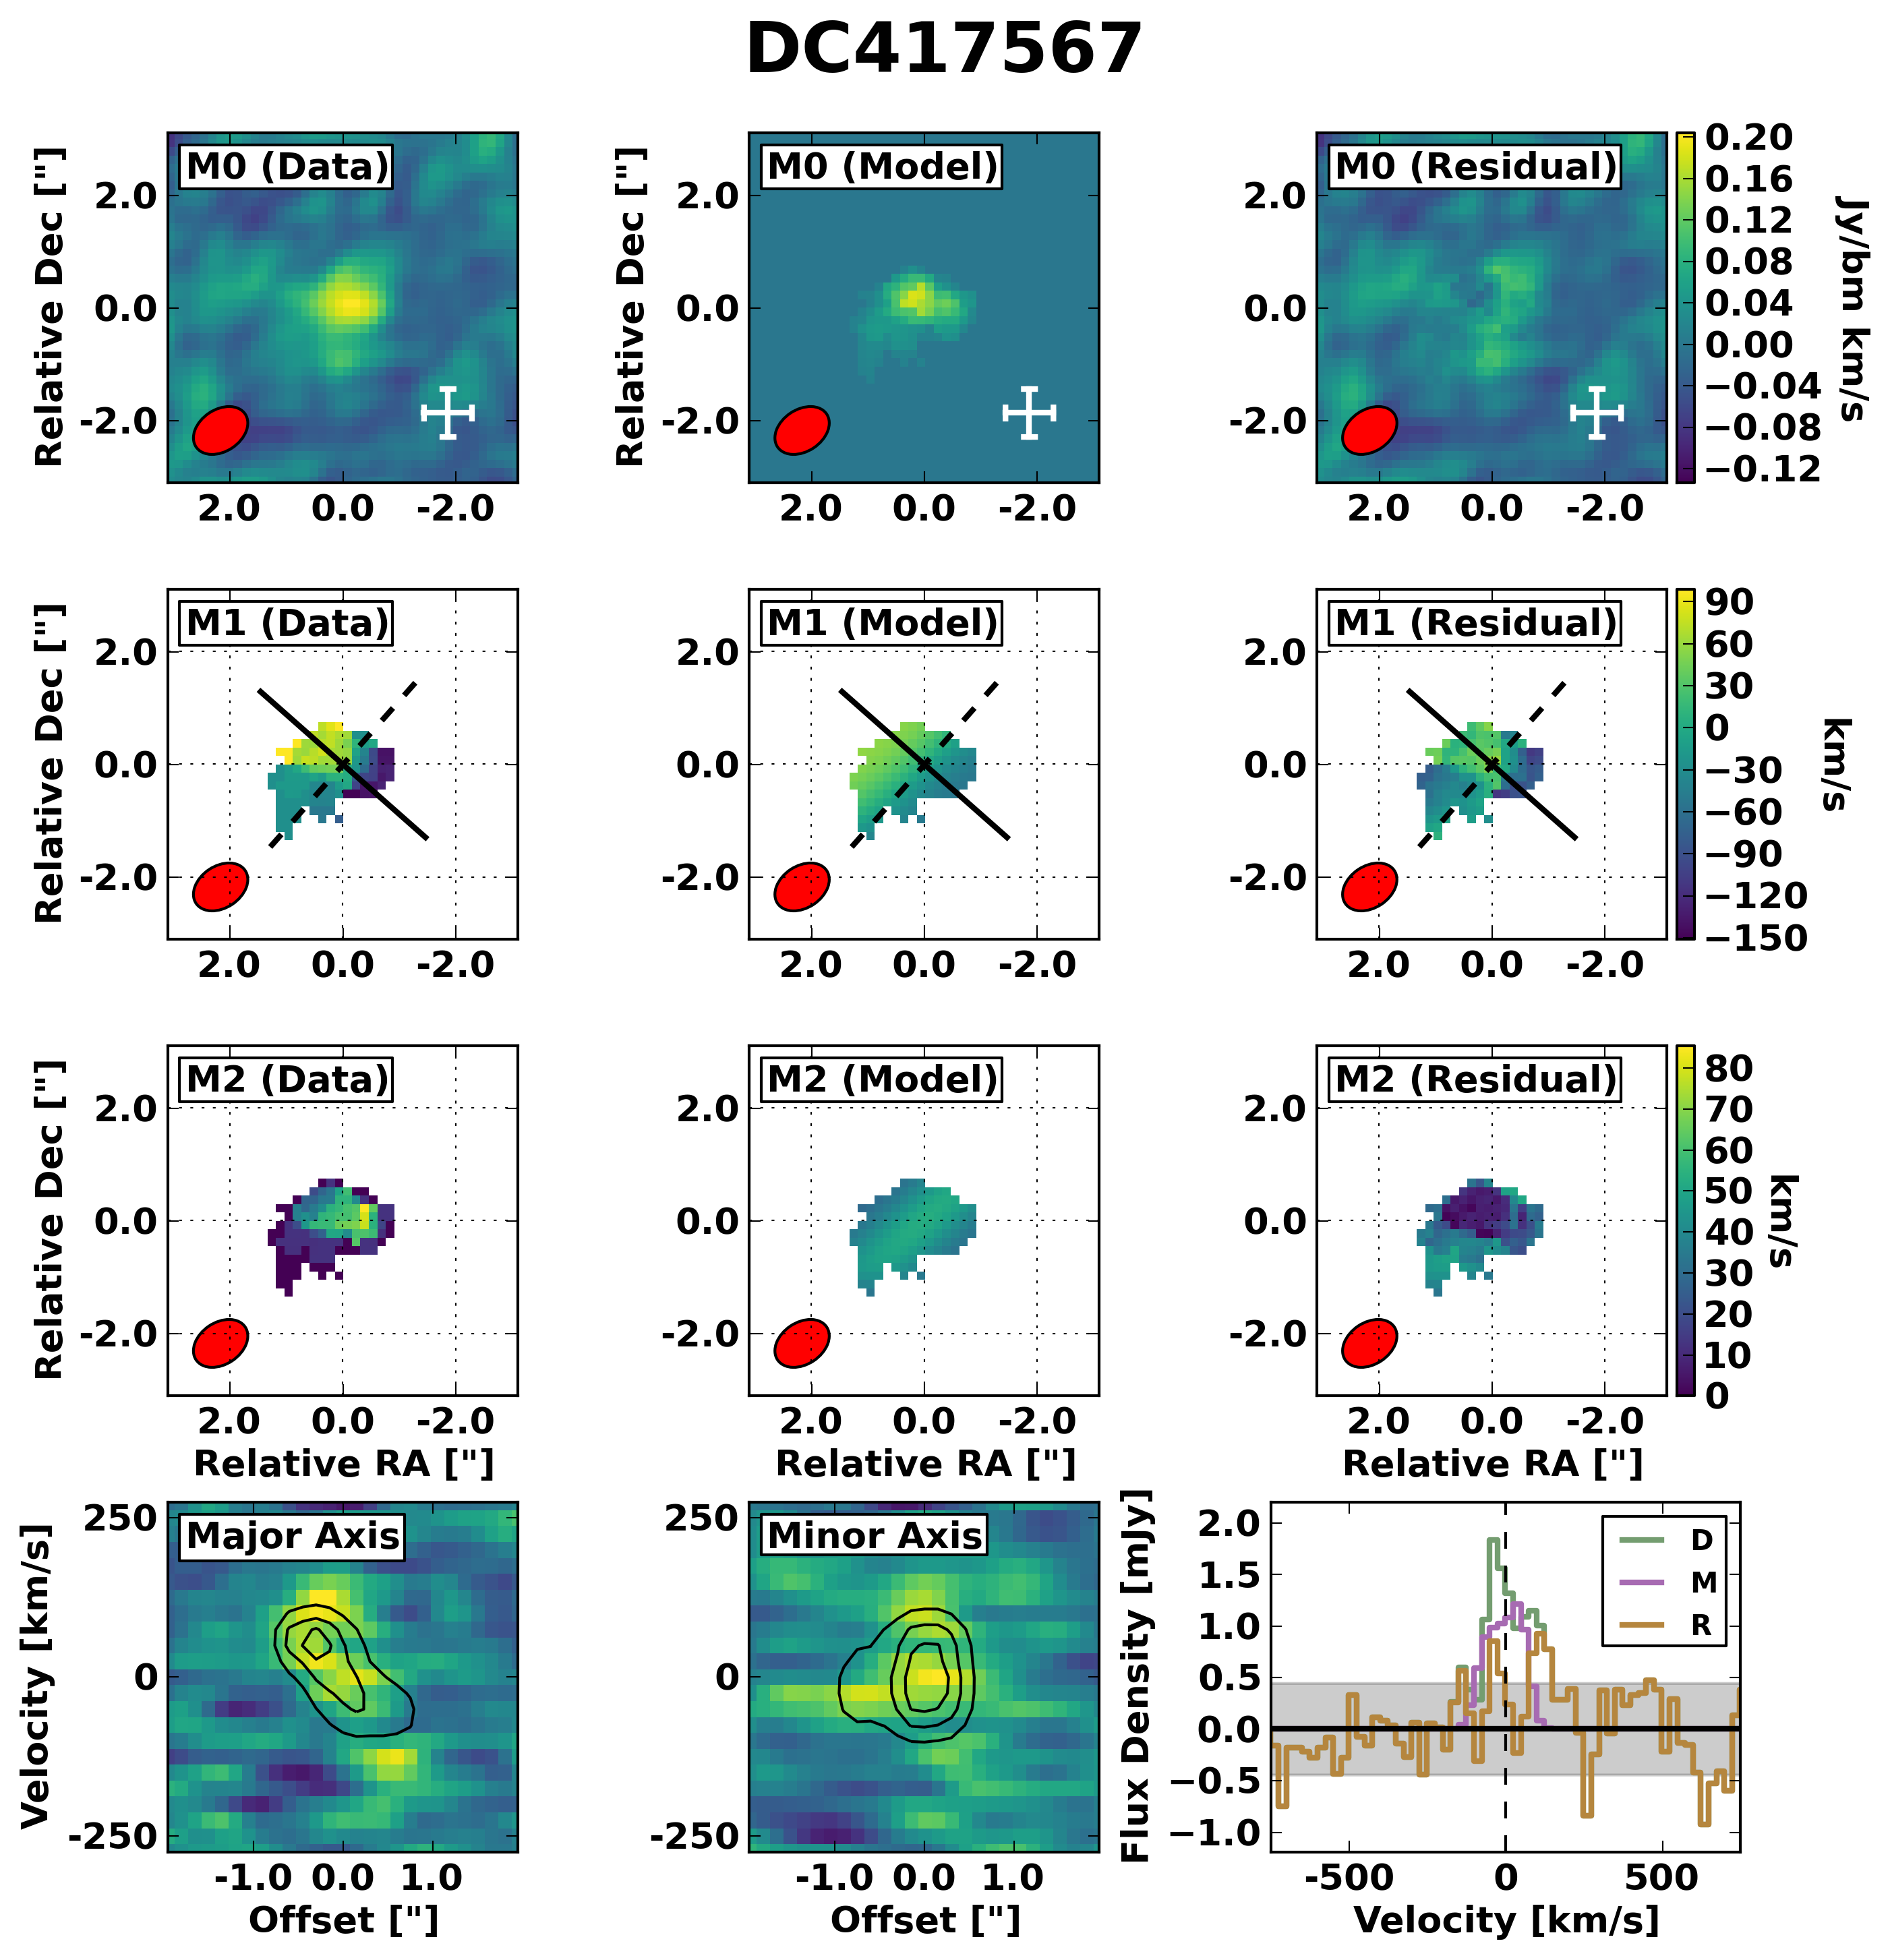
| DC417567 | 2 | UNC | ||||||||||
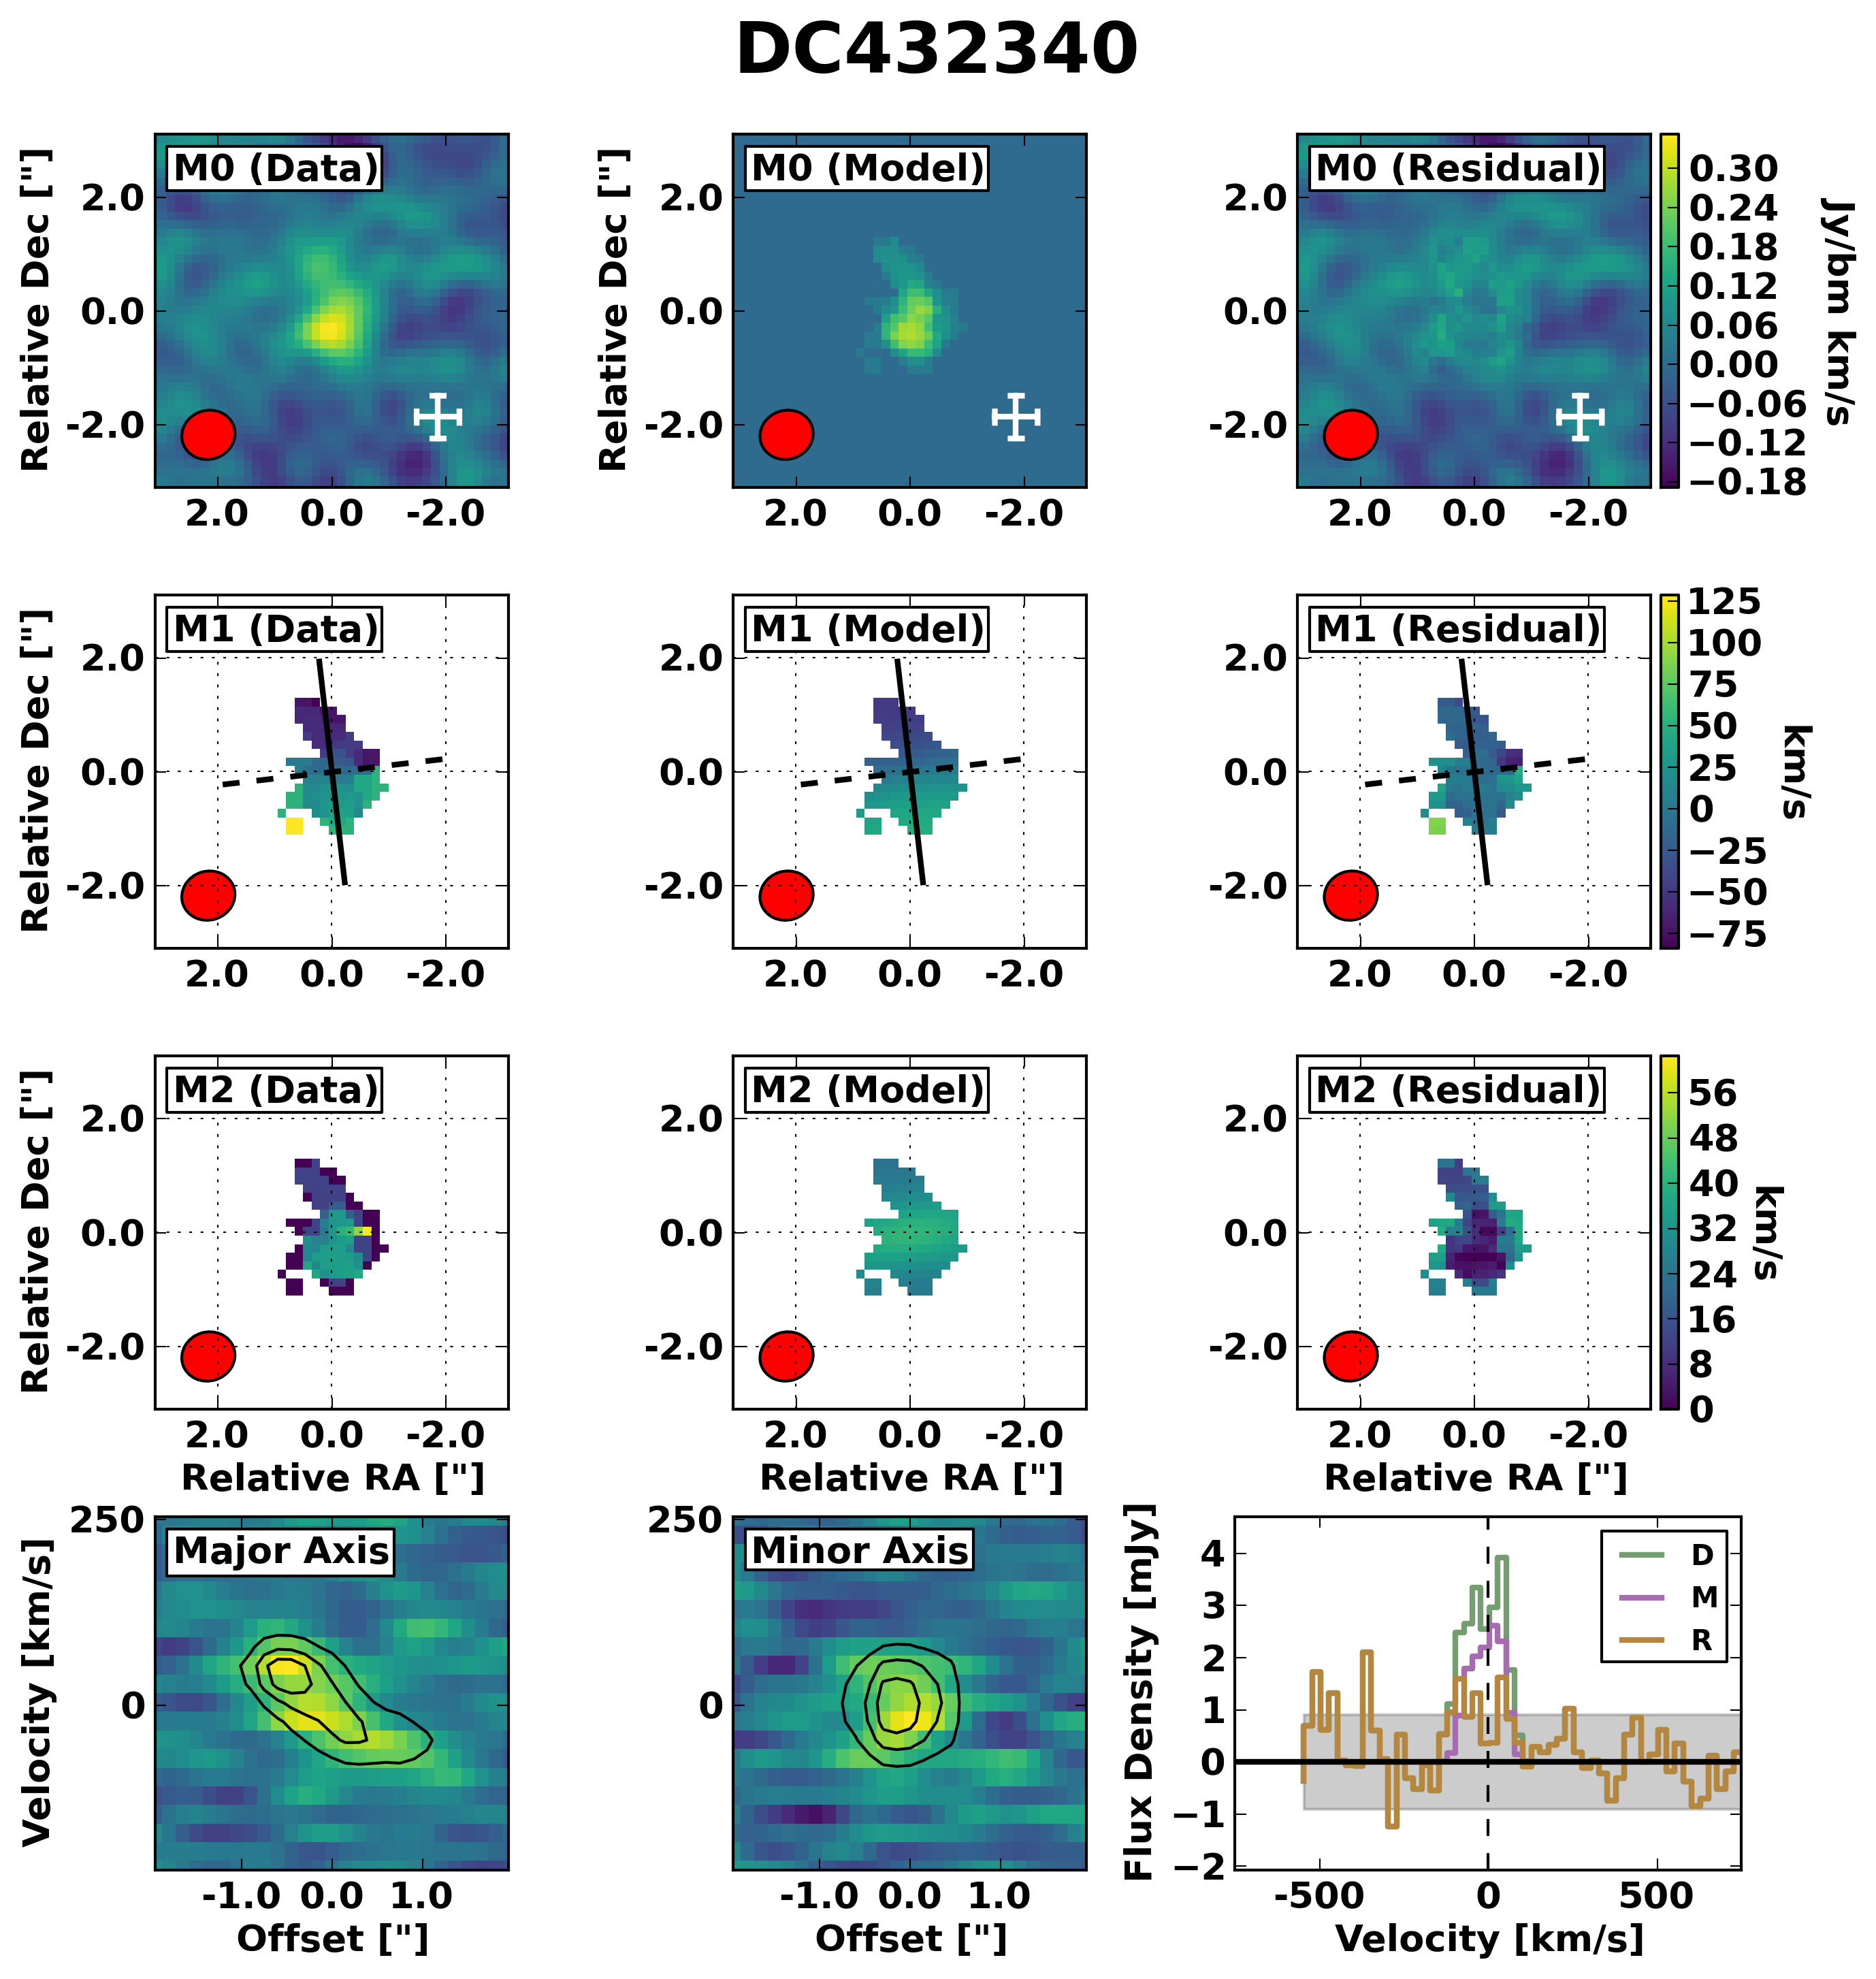
| DC432340 | 2 | UNC | ||||||||||
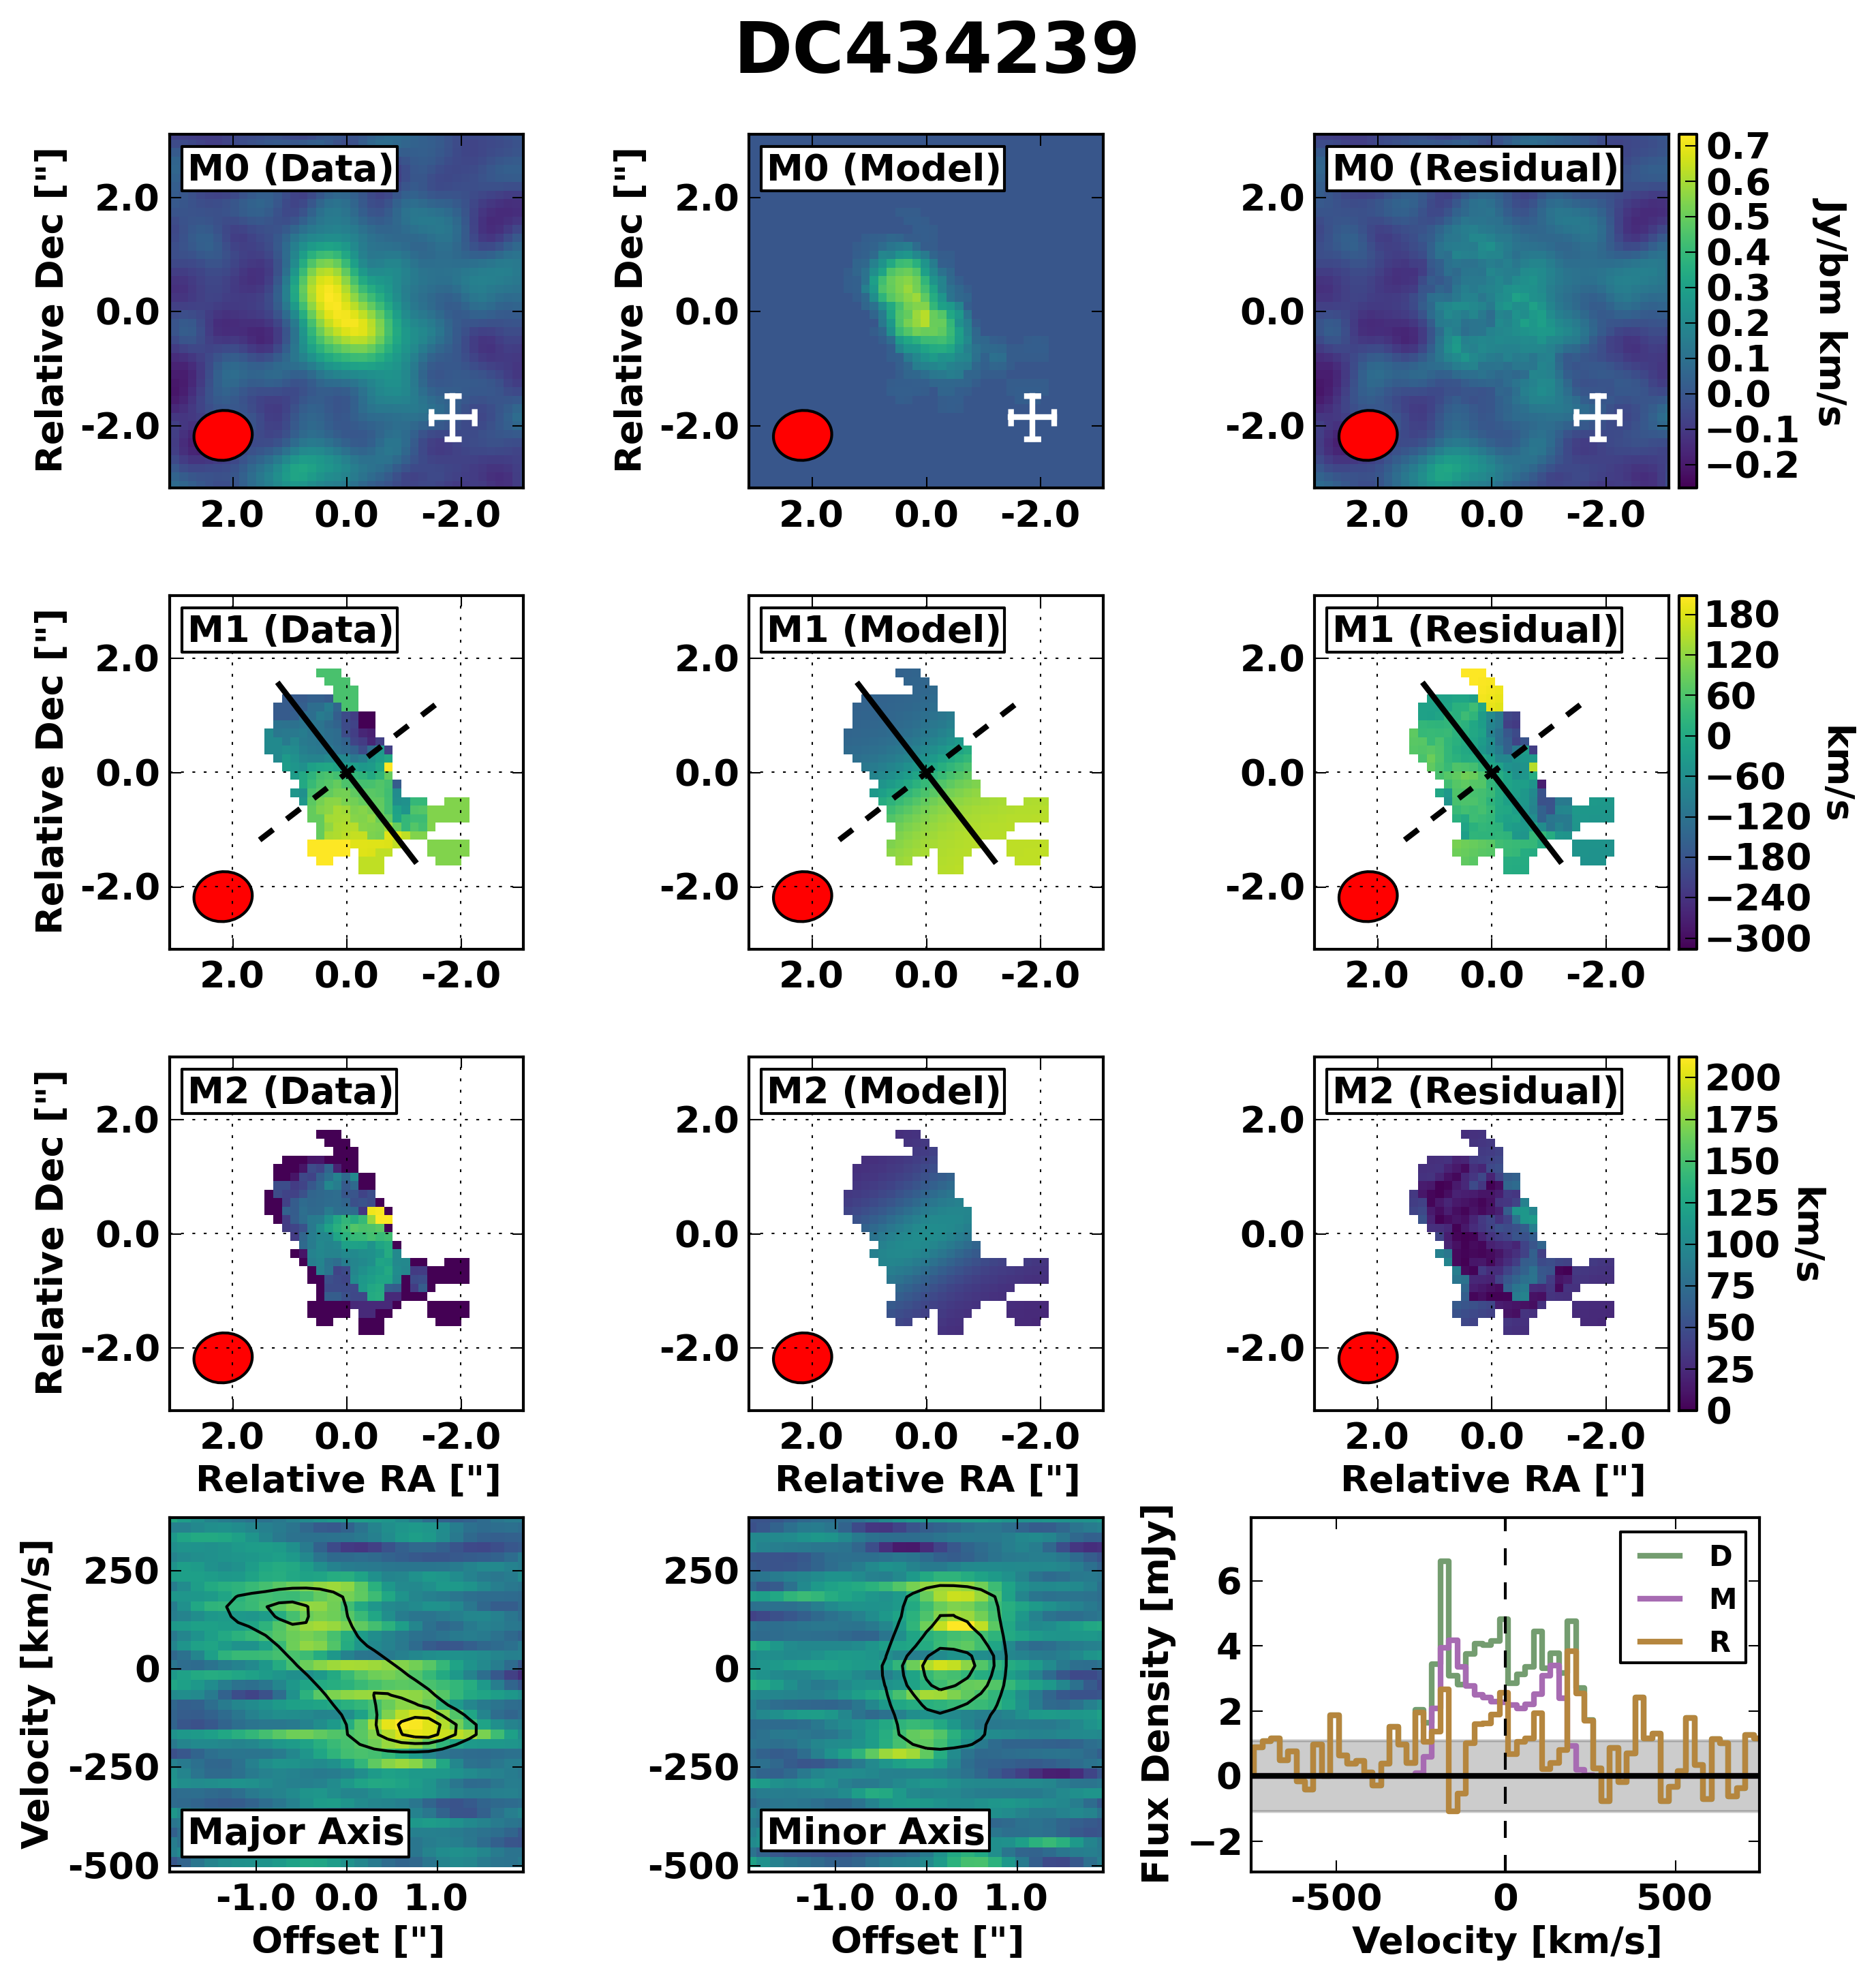
| DC434239 | 2 | MER | ||||||||||
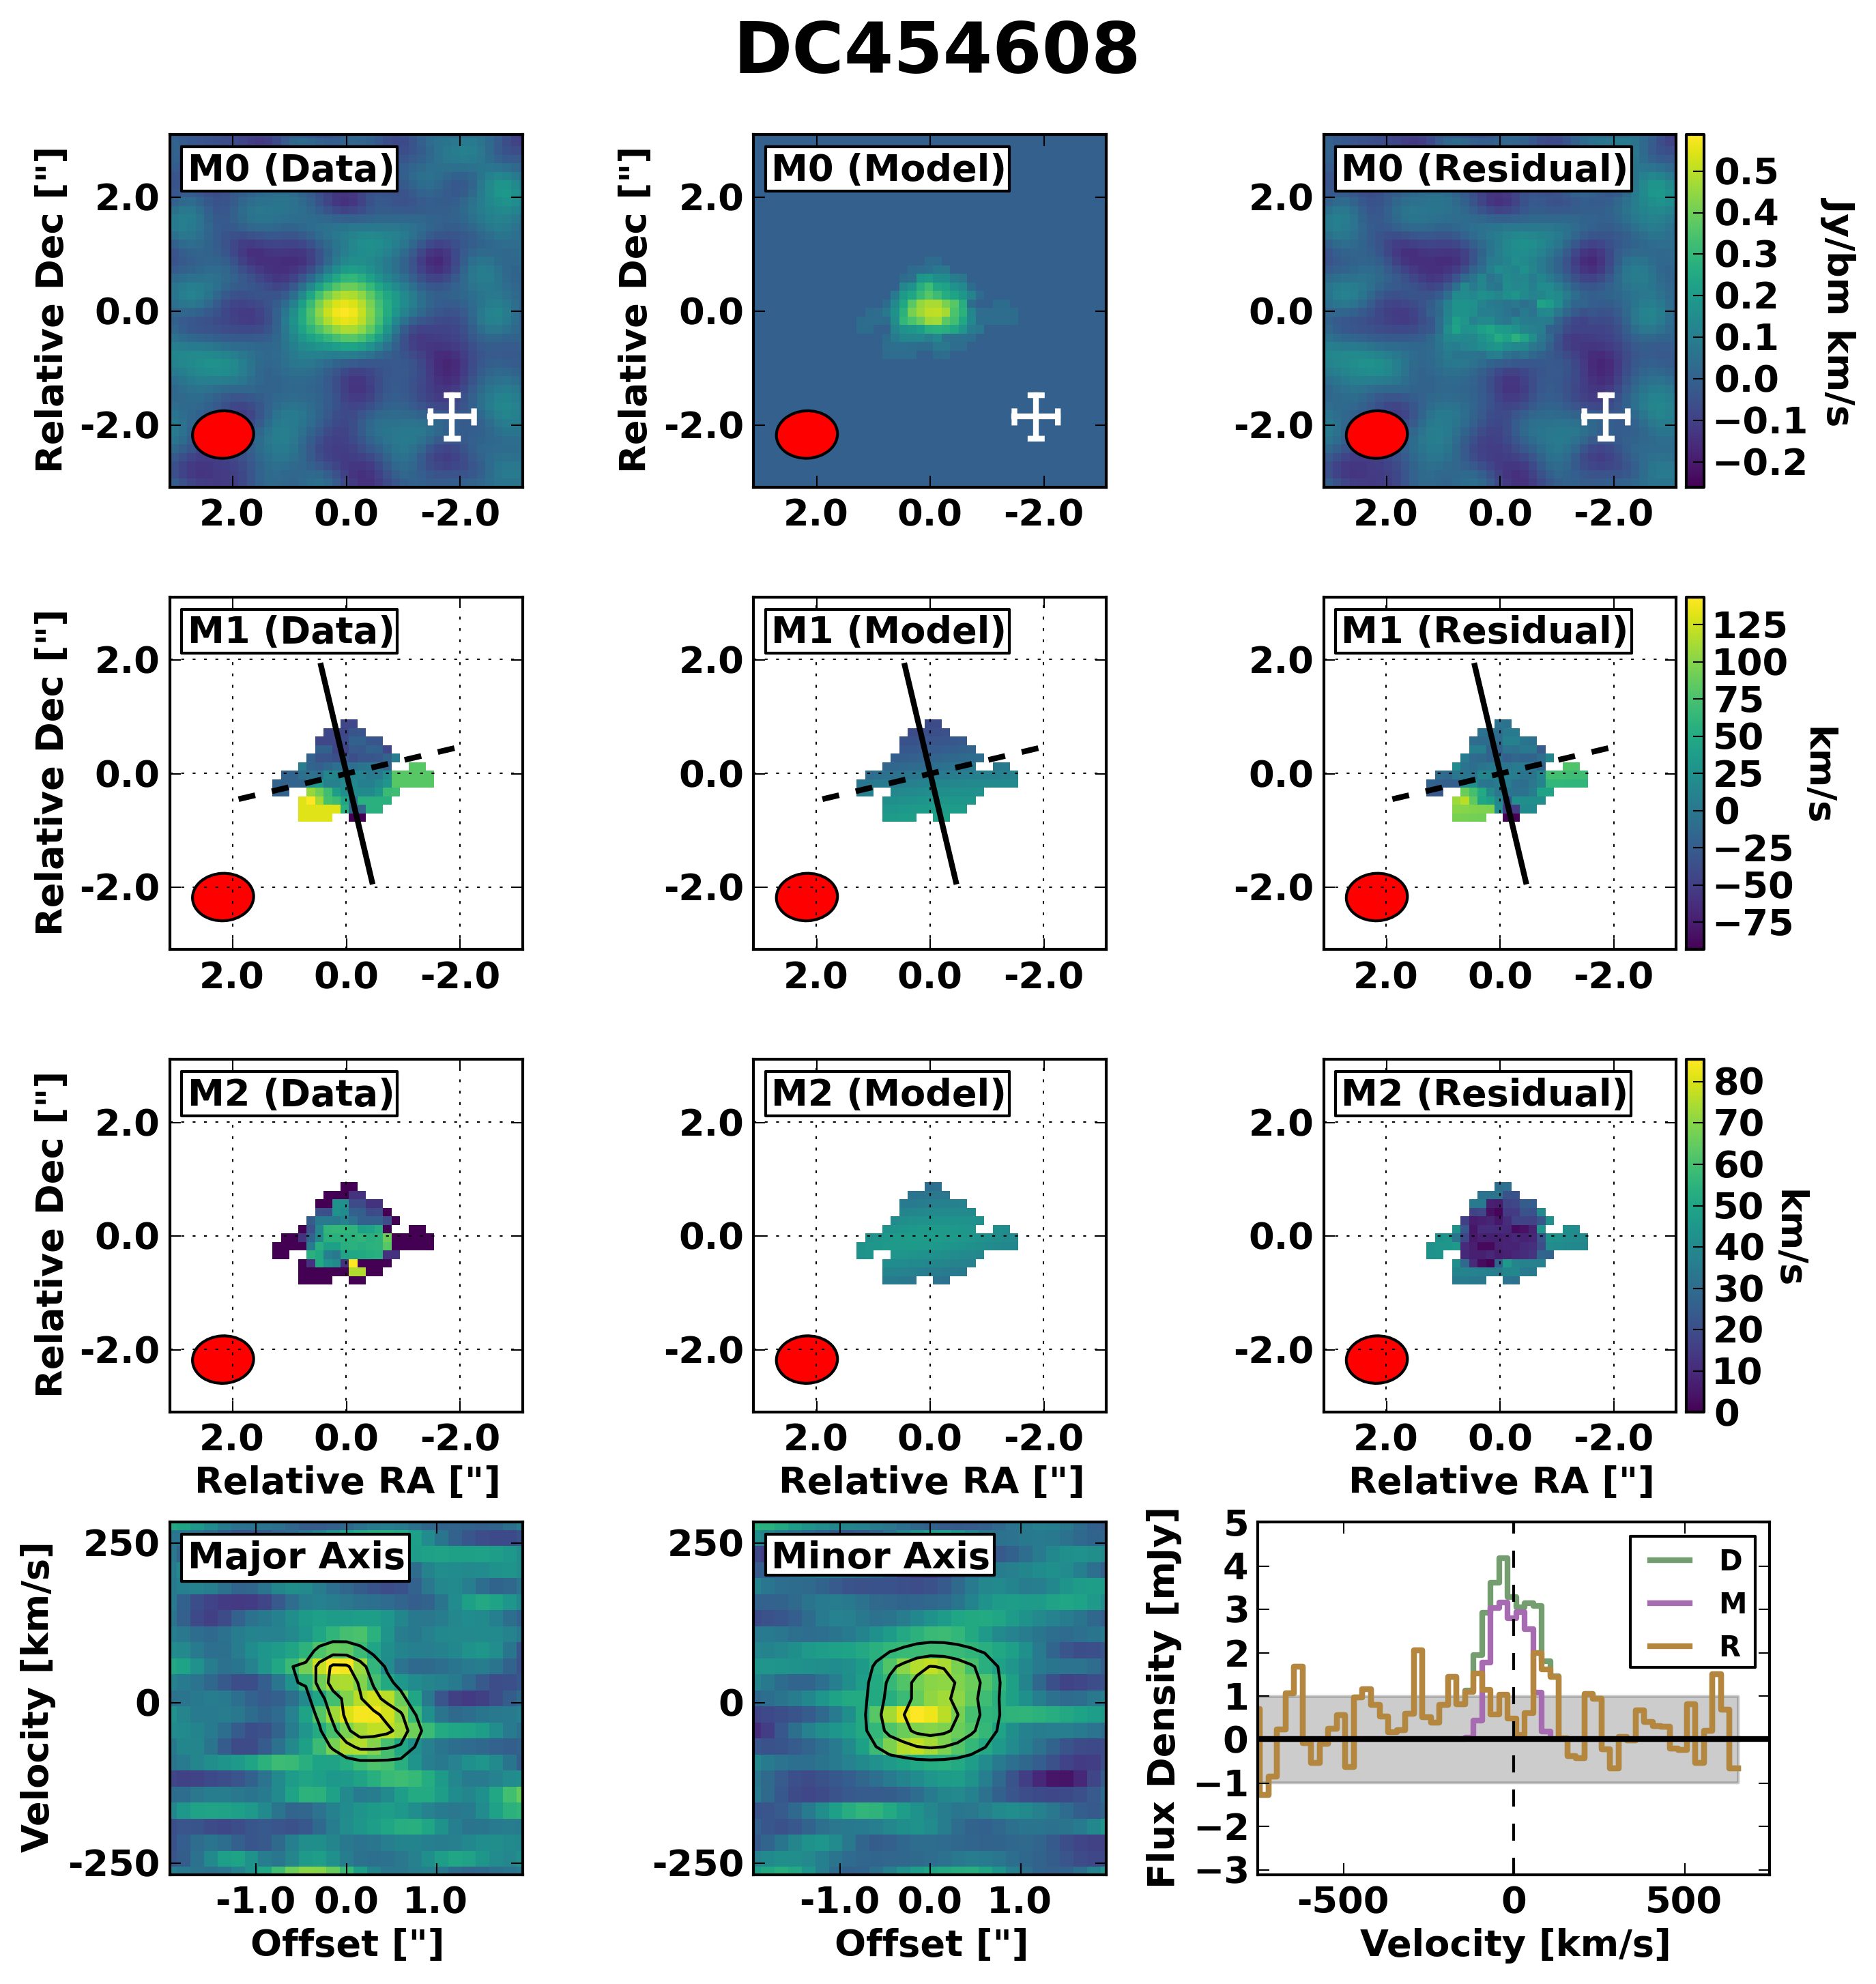
| DC454608 | 2 | UNC | ||||||||||
| DC494057 | 1 | ROT | ||||||||||
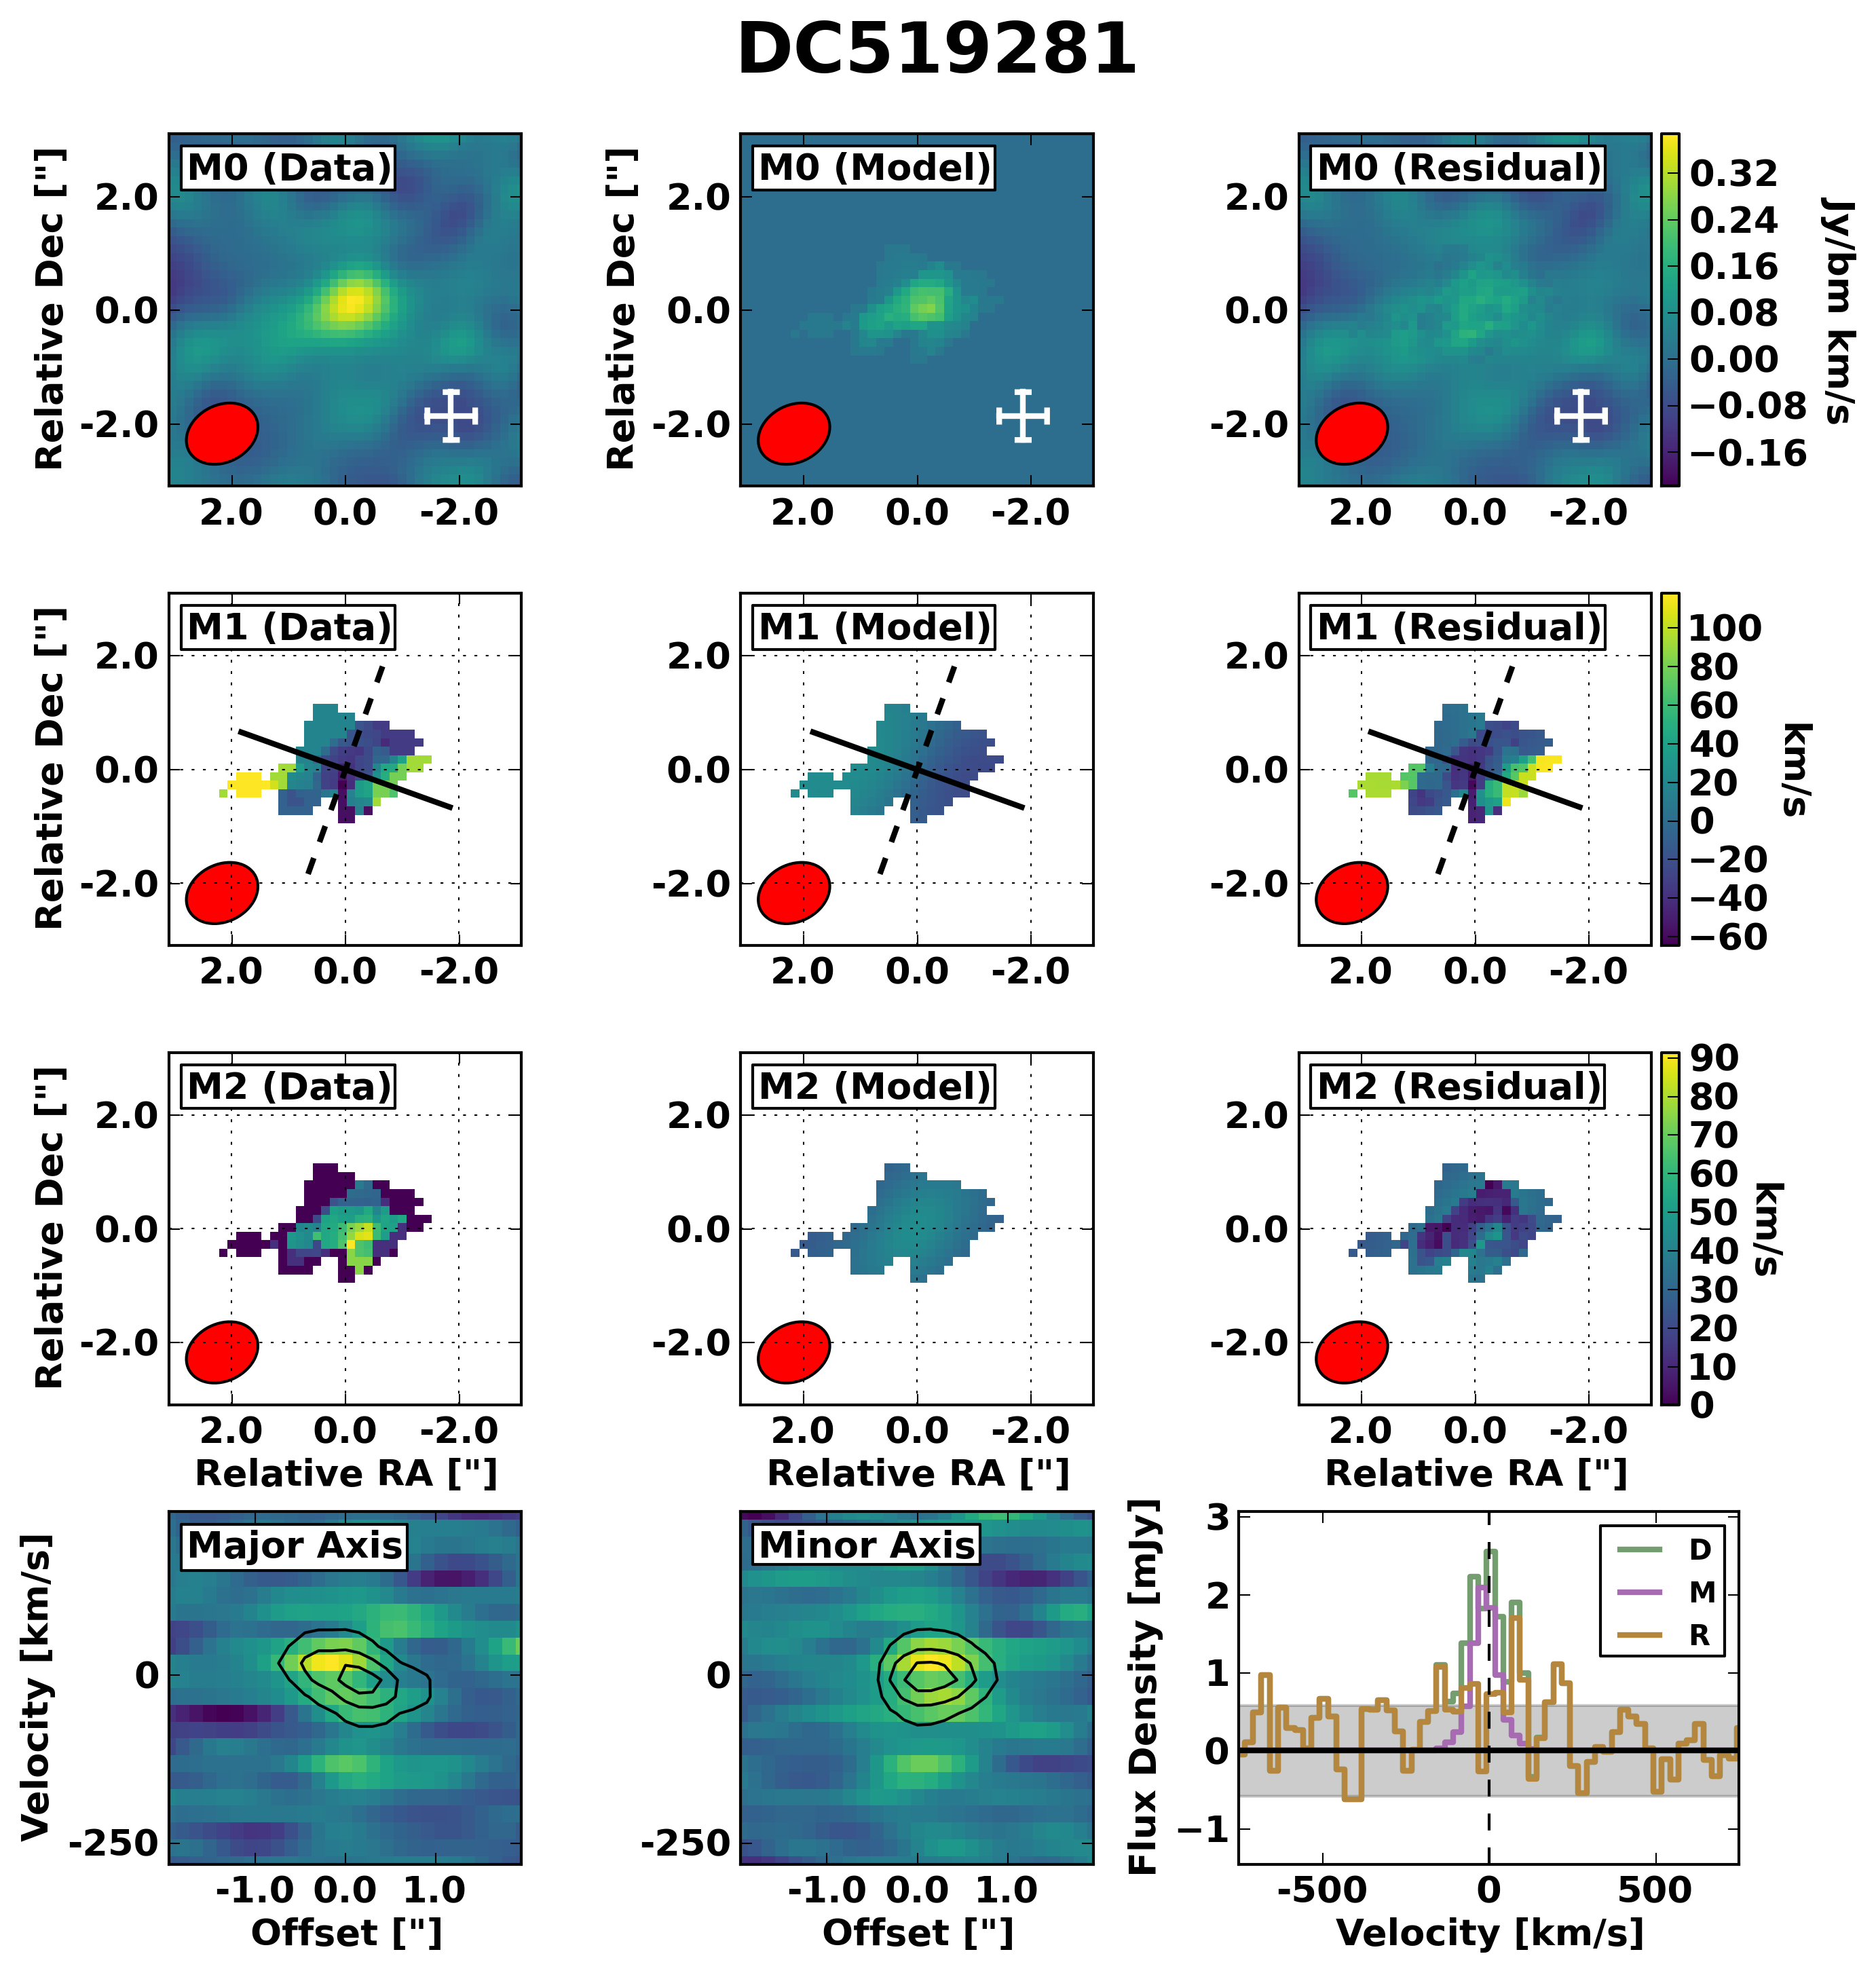
| DC519281 | 2 | UNC | ||||||||||
| DC552206 | 2 | ROT | ||||||||||
| DC627939 | 2 | UNC | ||||||||||
| DC683613 | 3 | UNC | ||||||||||
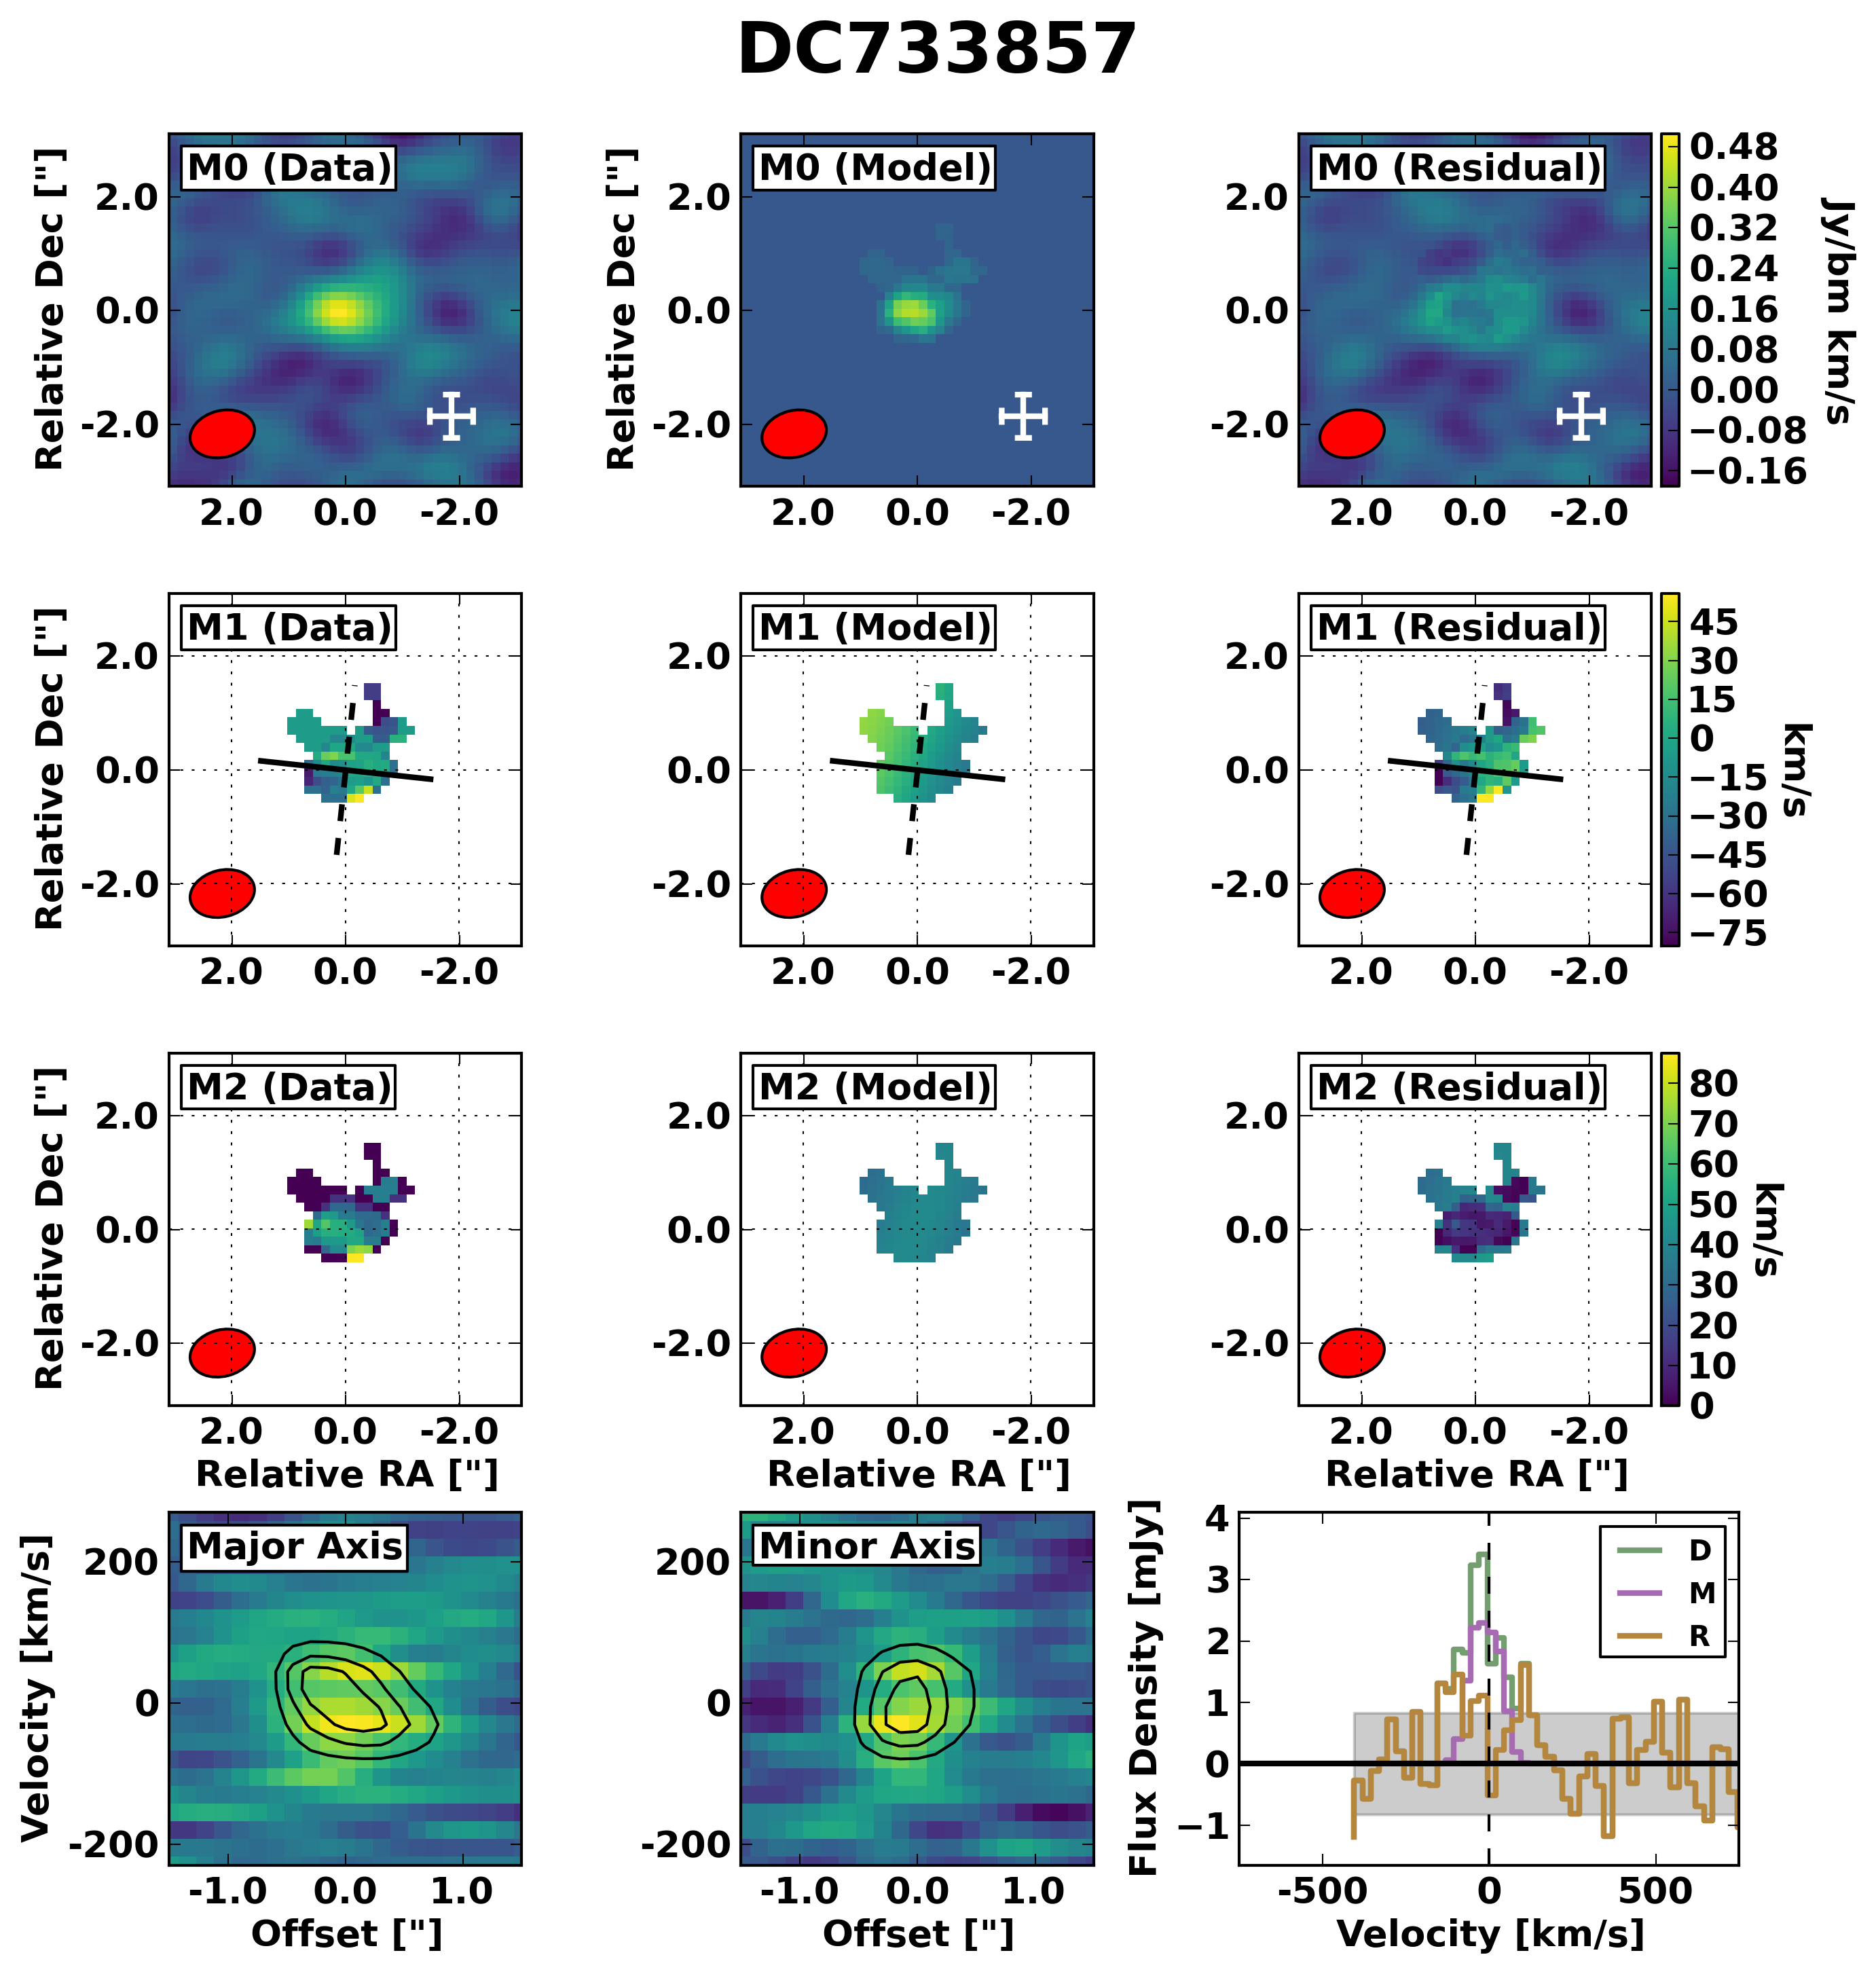
| DC733857 | 3 | UNC | ||||||||||
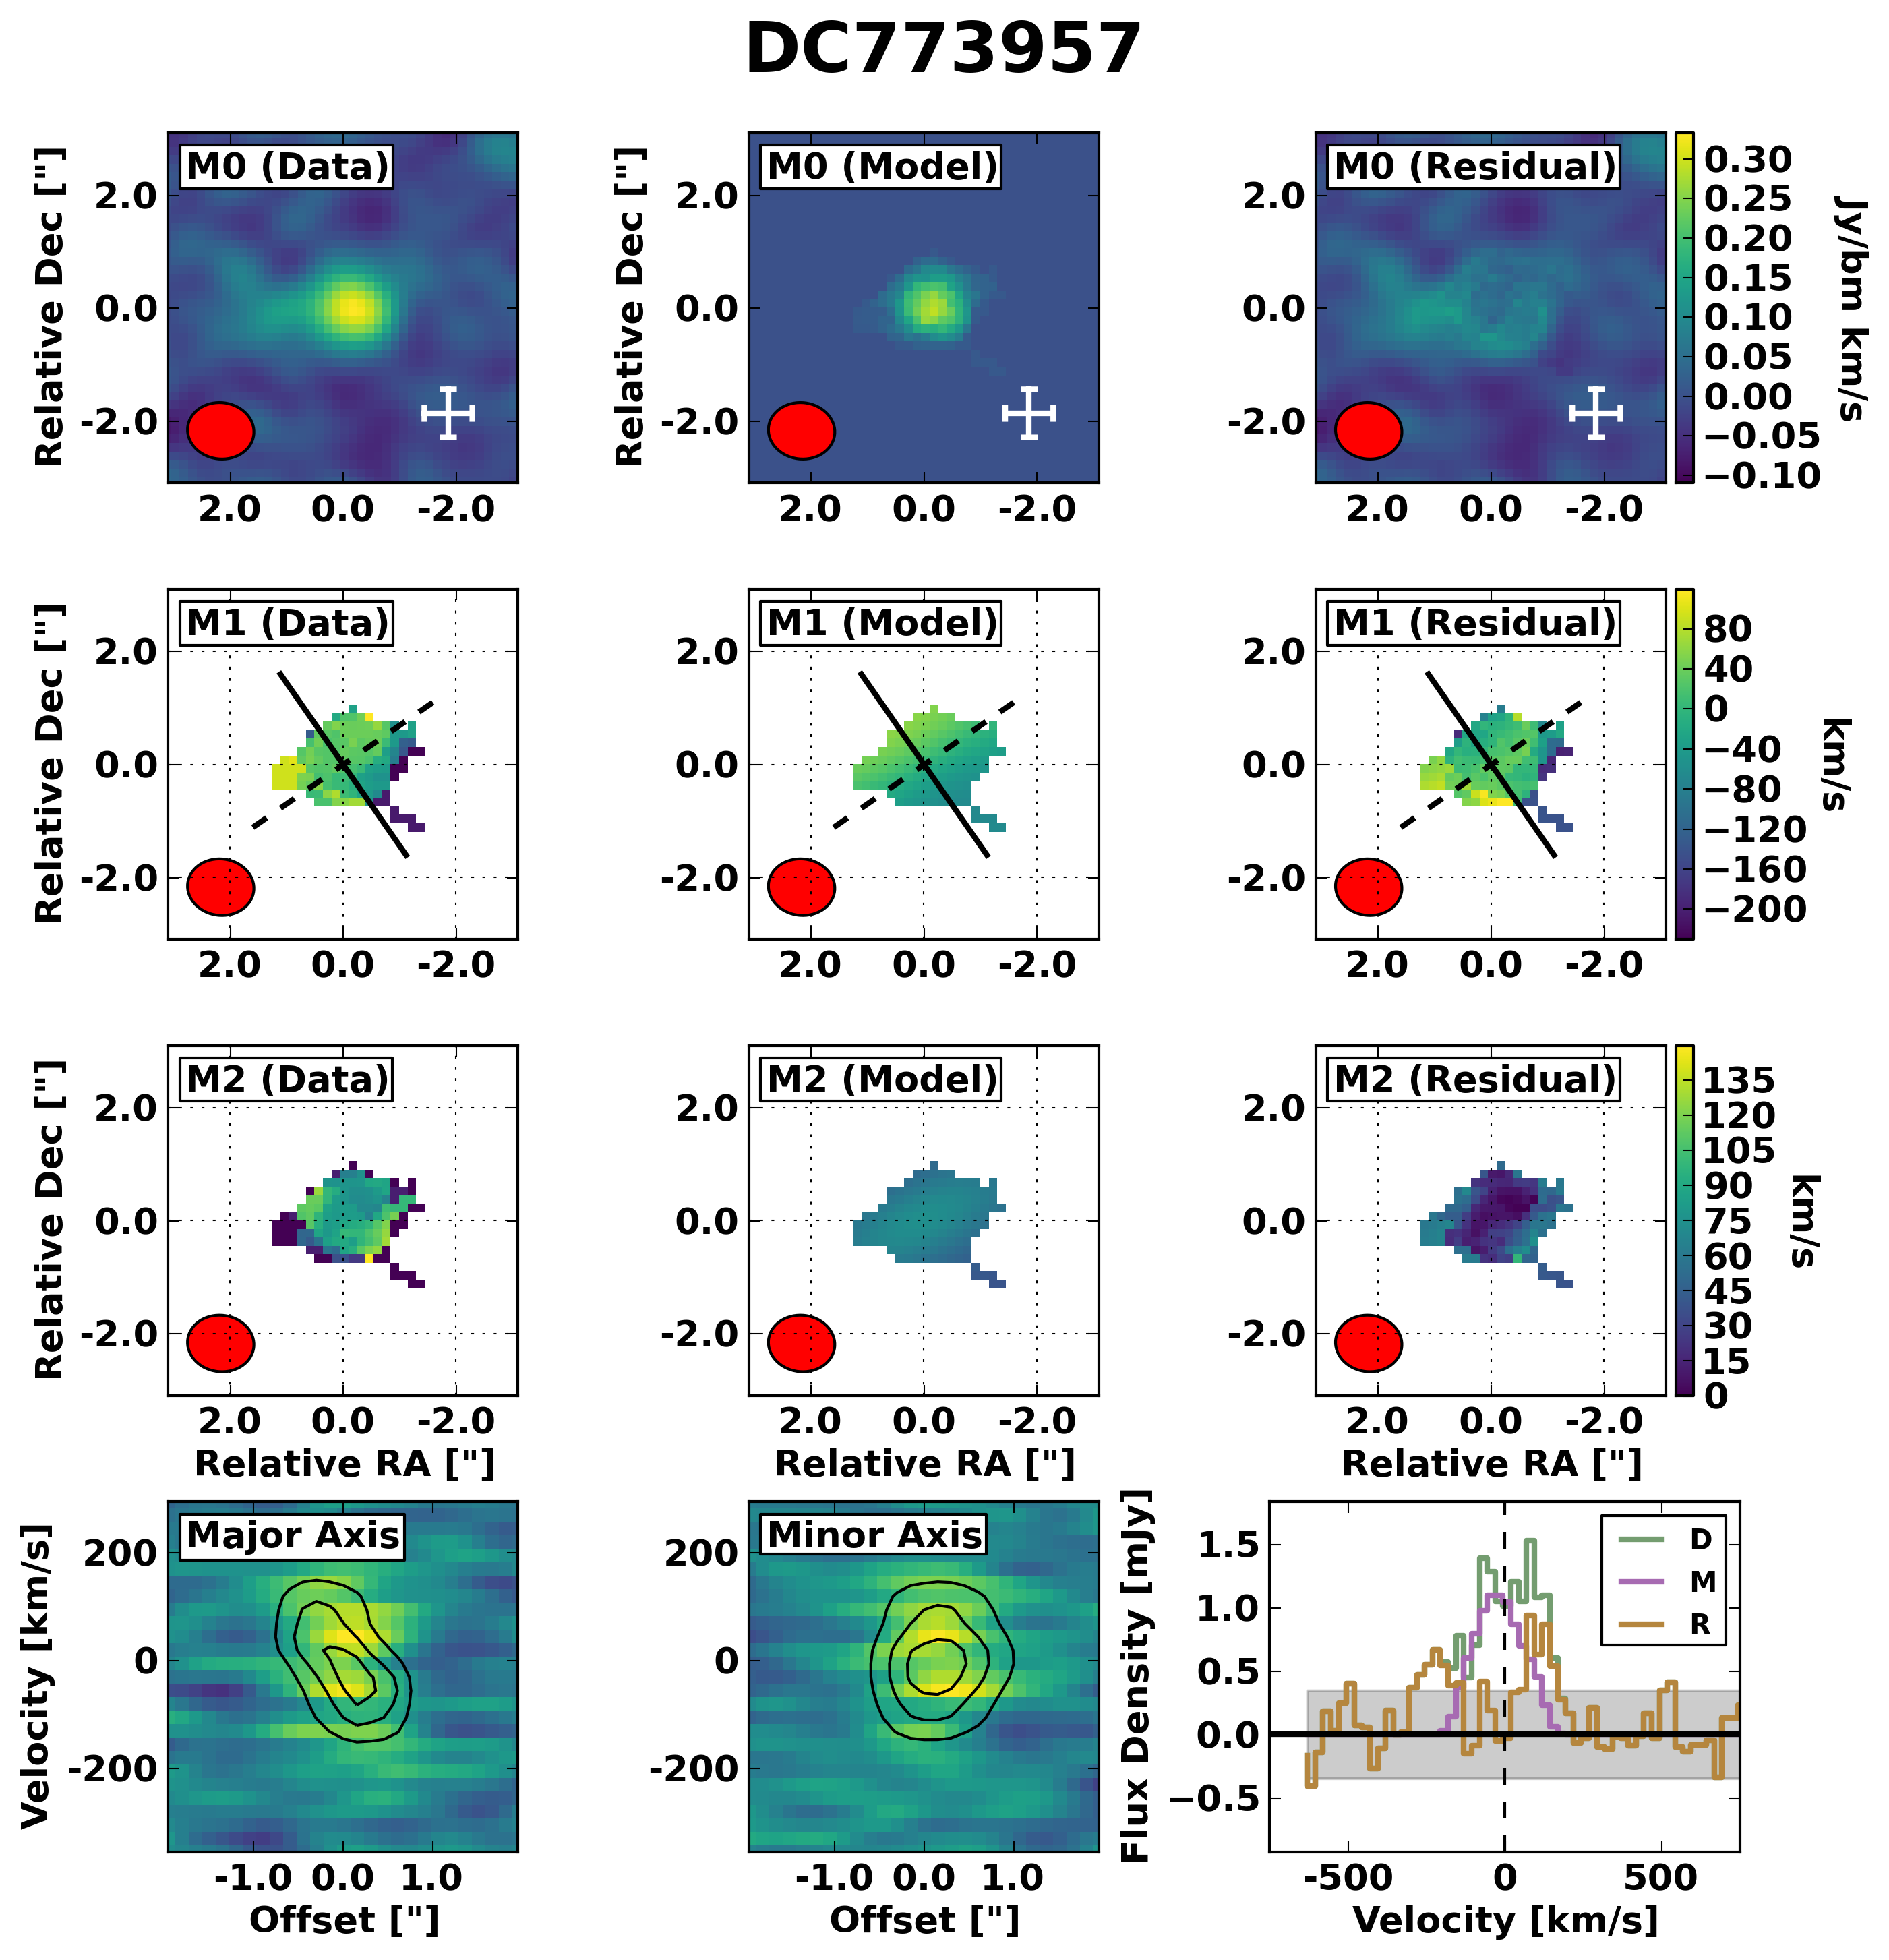
| DC773957 | 2 | UNC | ||||||||||
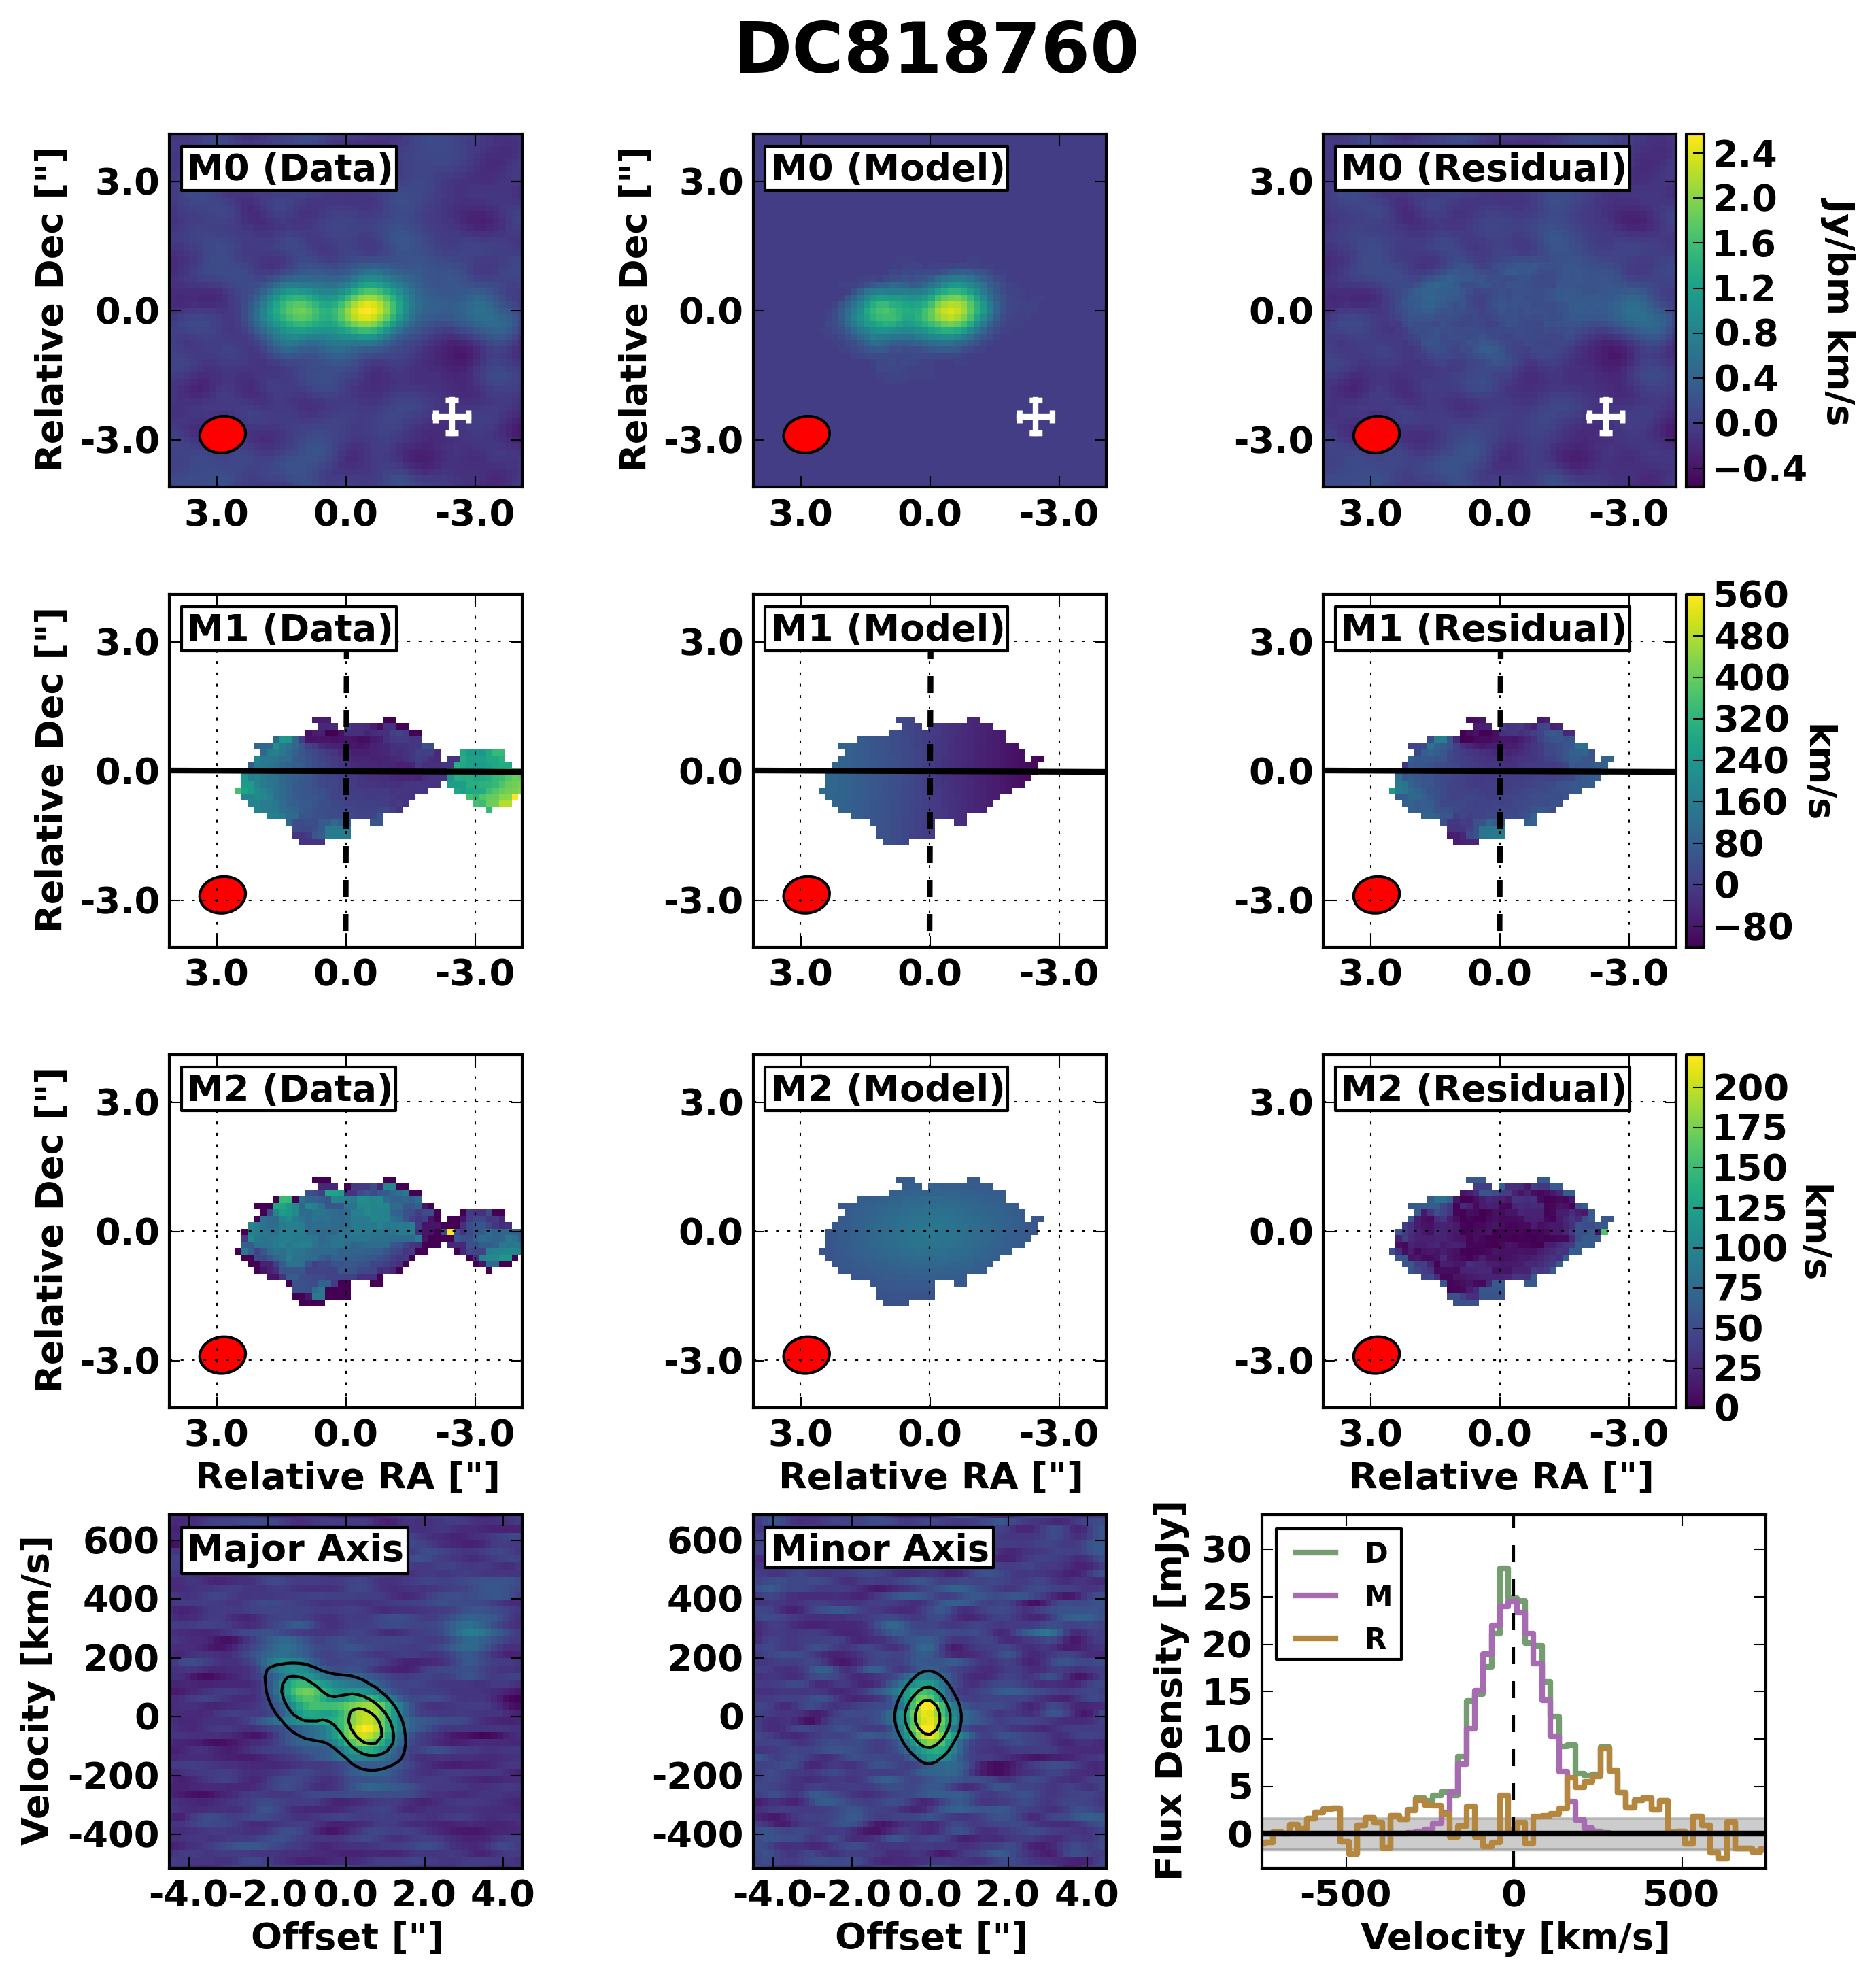
| DC818760 | 2 | MER | ||||||||||
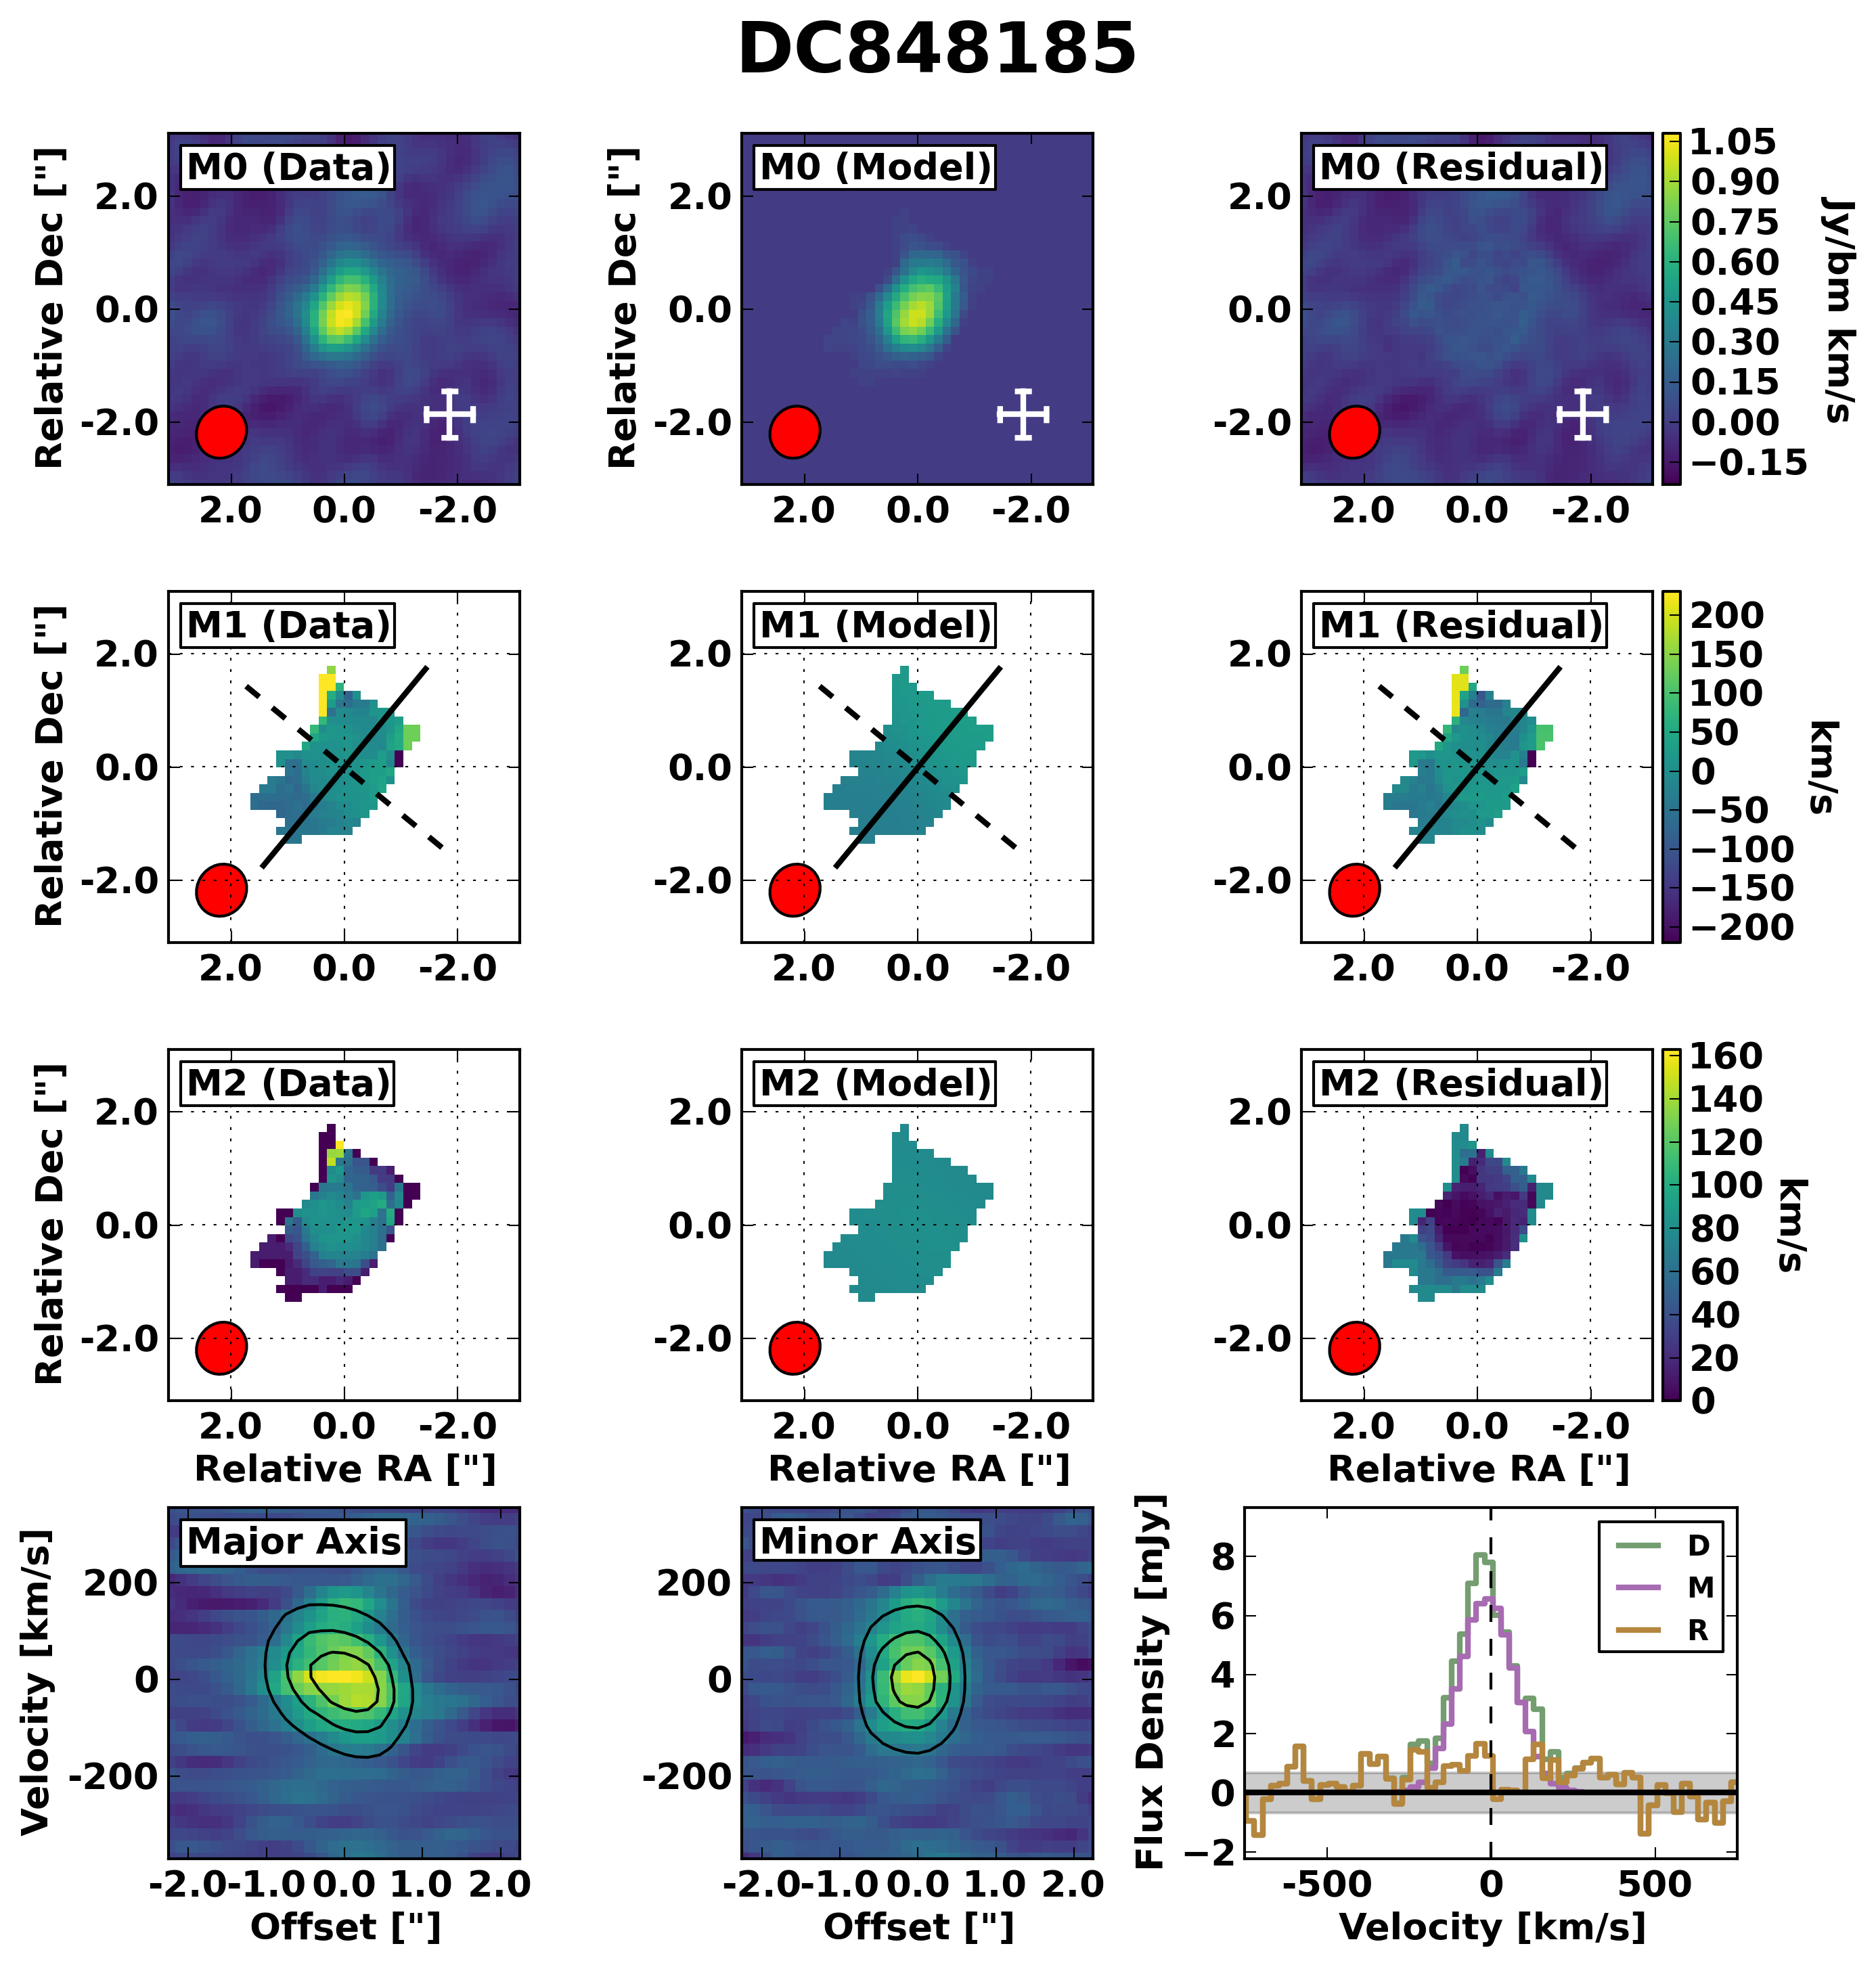
| DC848185 | 3 | DIS | ||||||||||
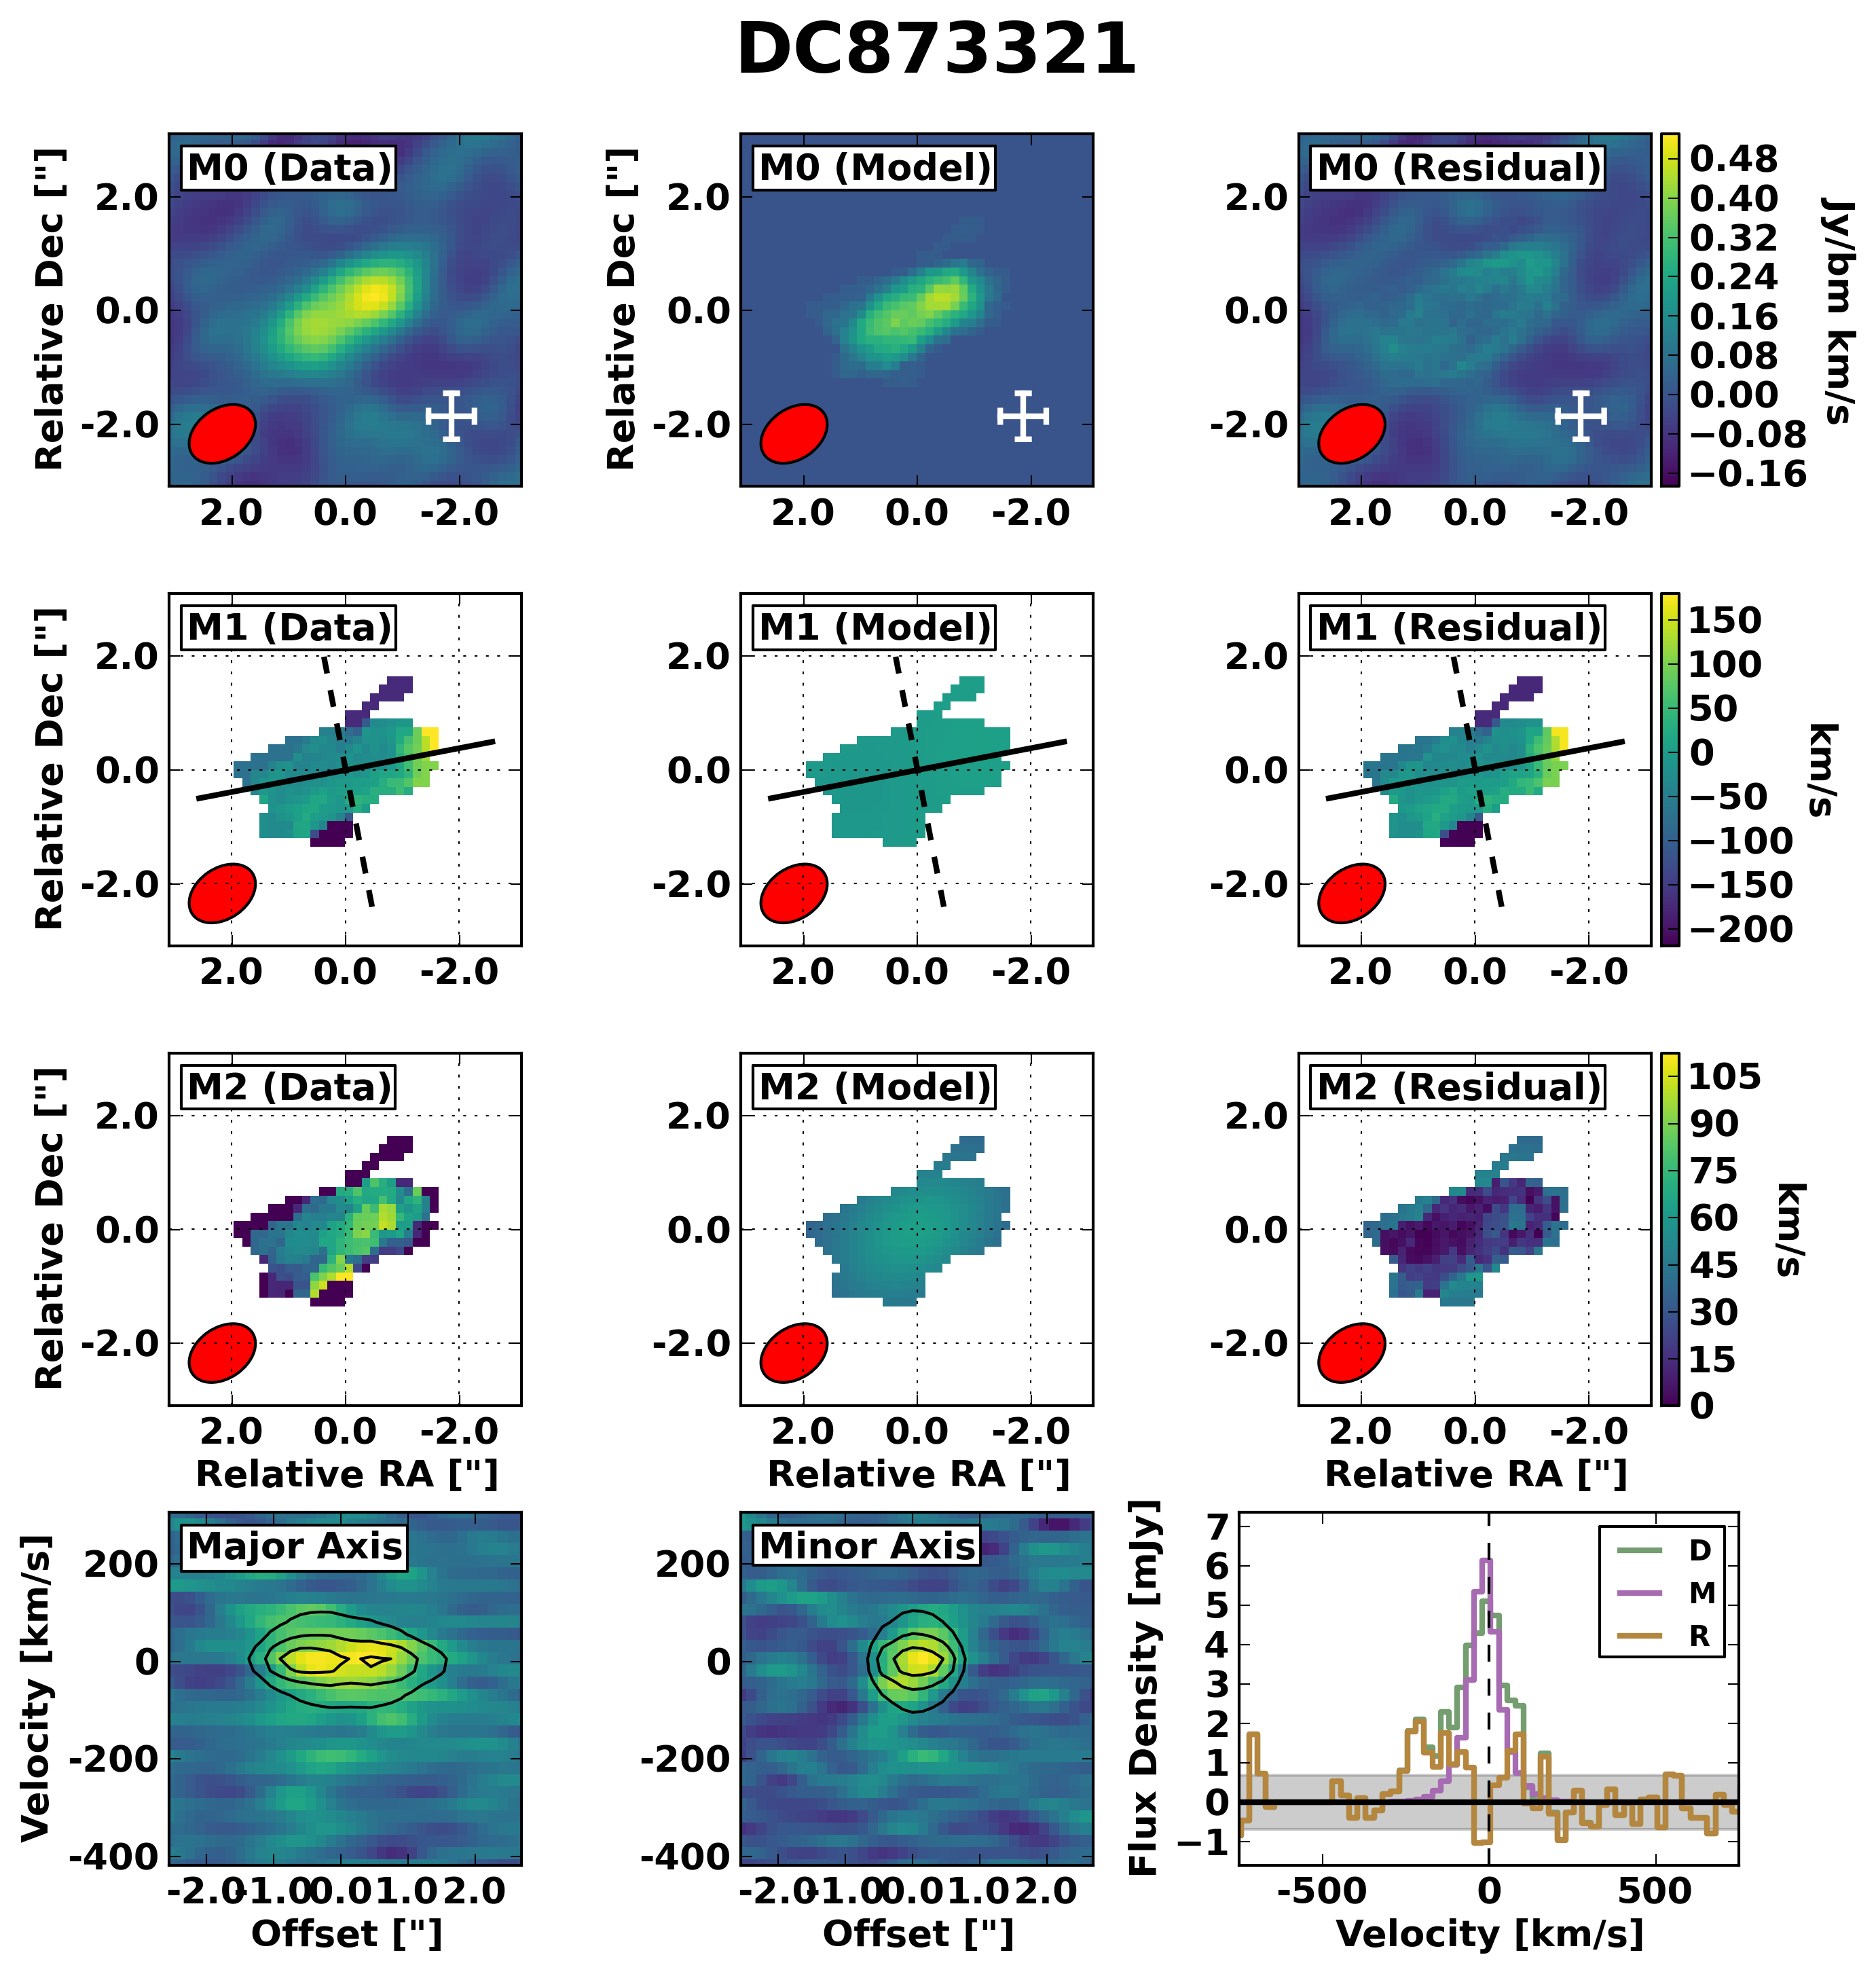
| DC873321 | 2 | MER | ||||||||||
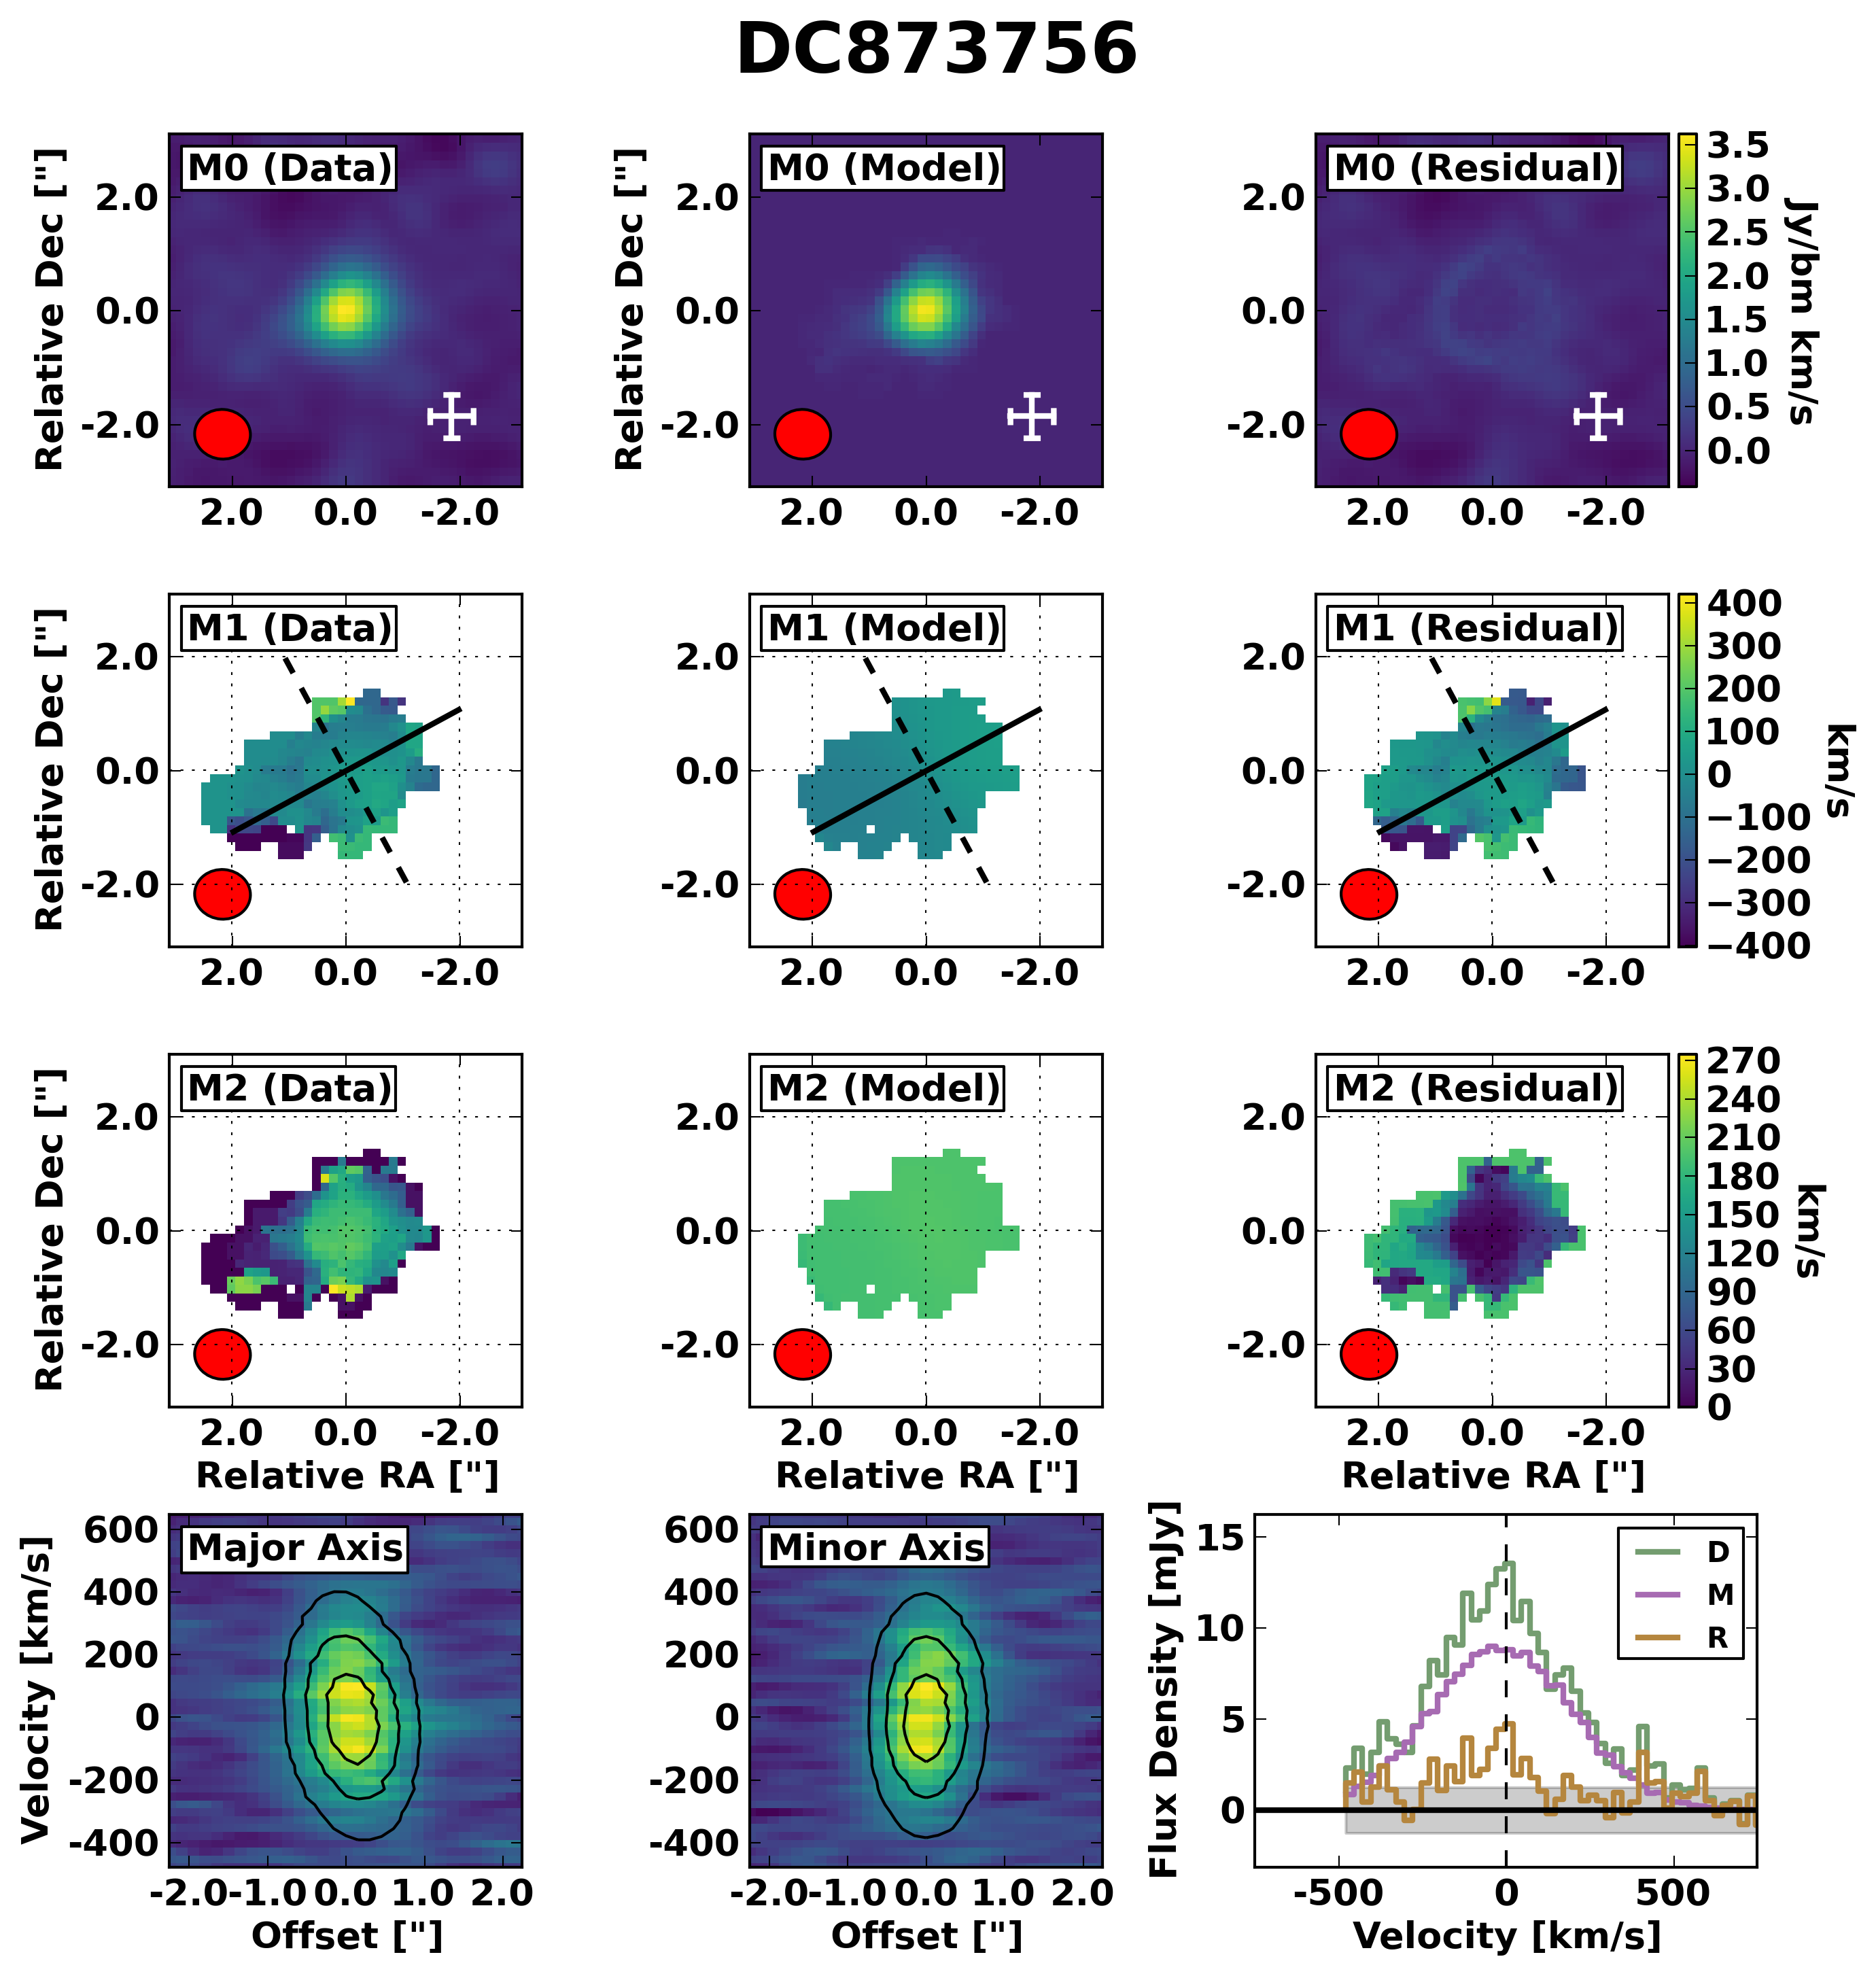
| DC873756 | 2 | DIS | ||||||||||
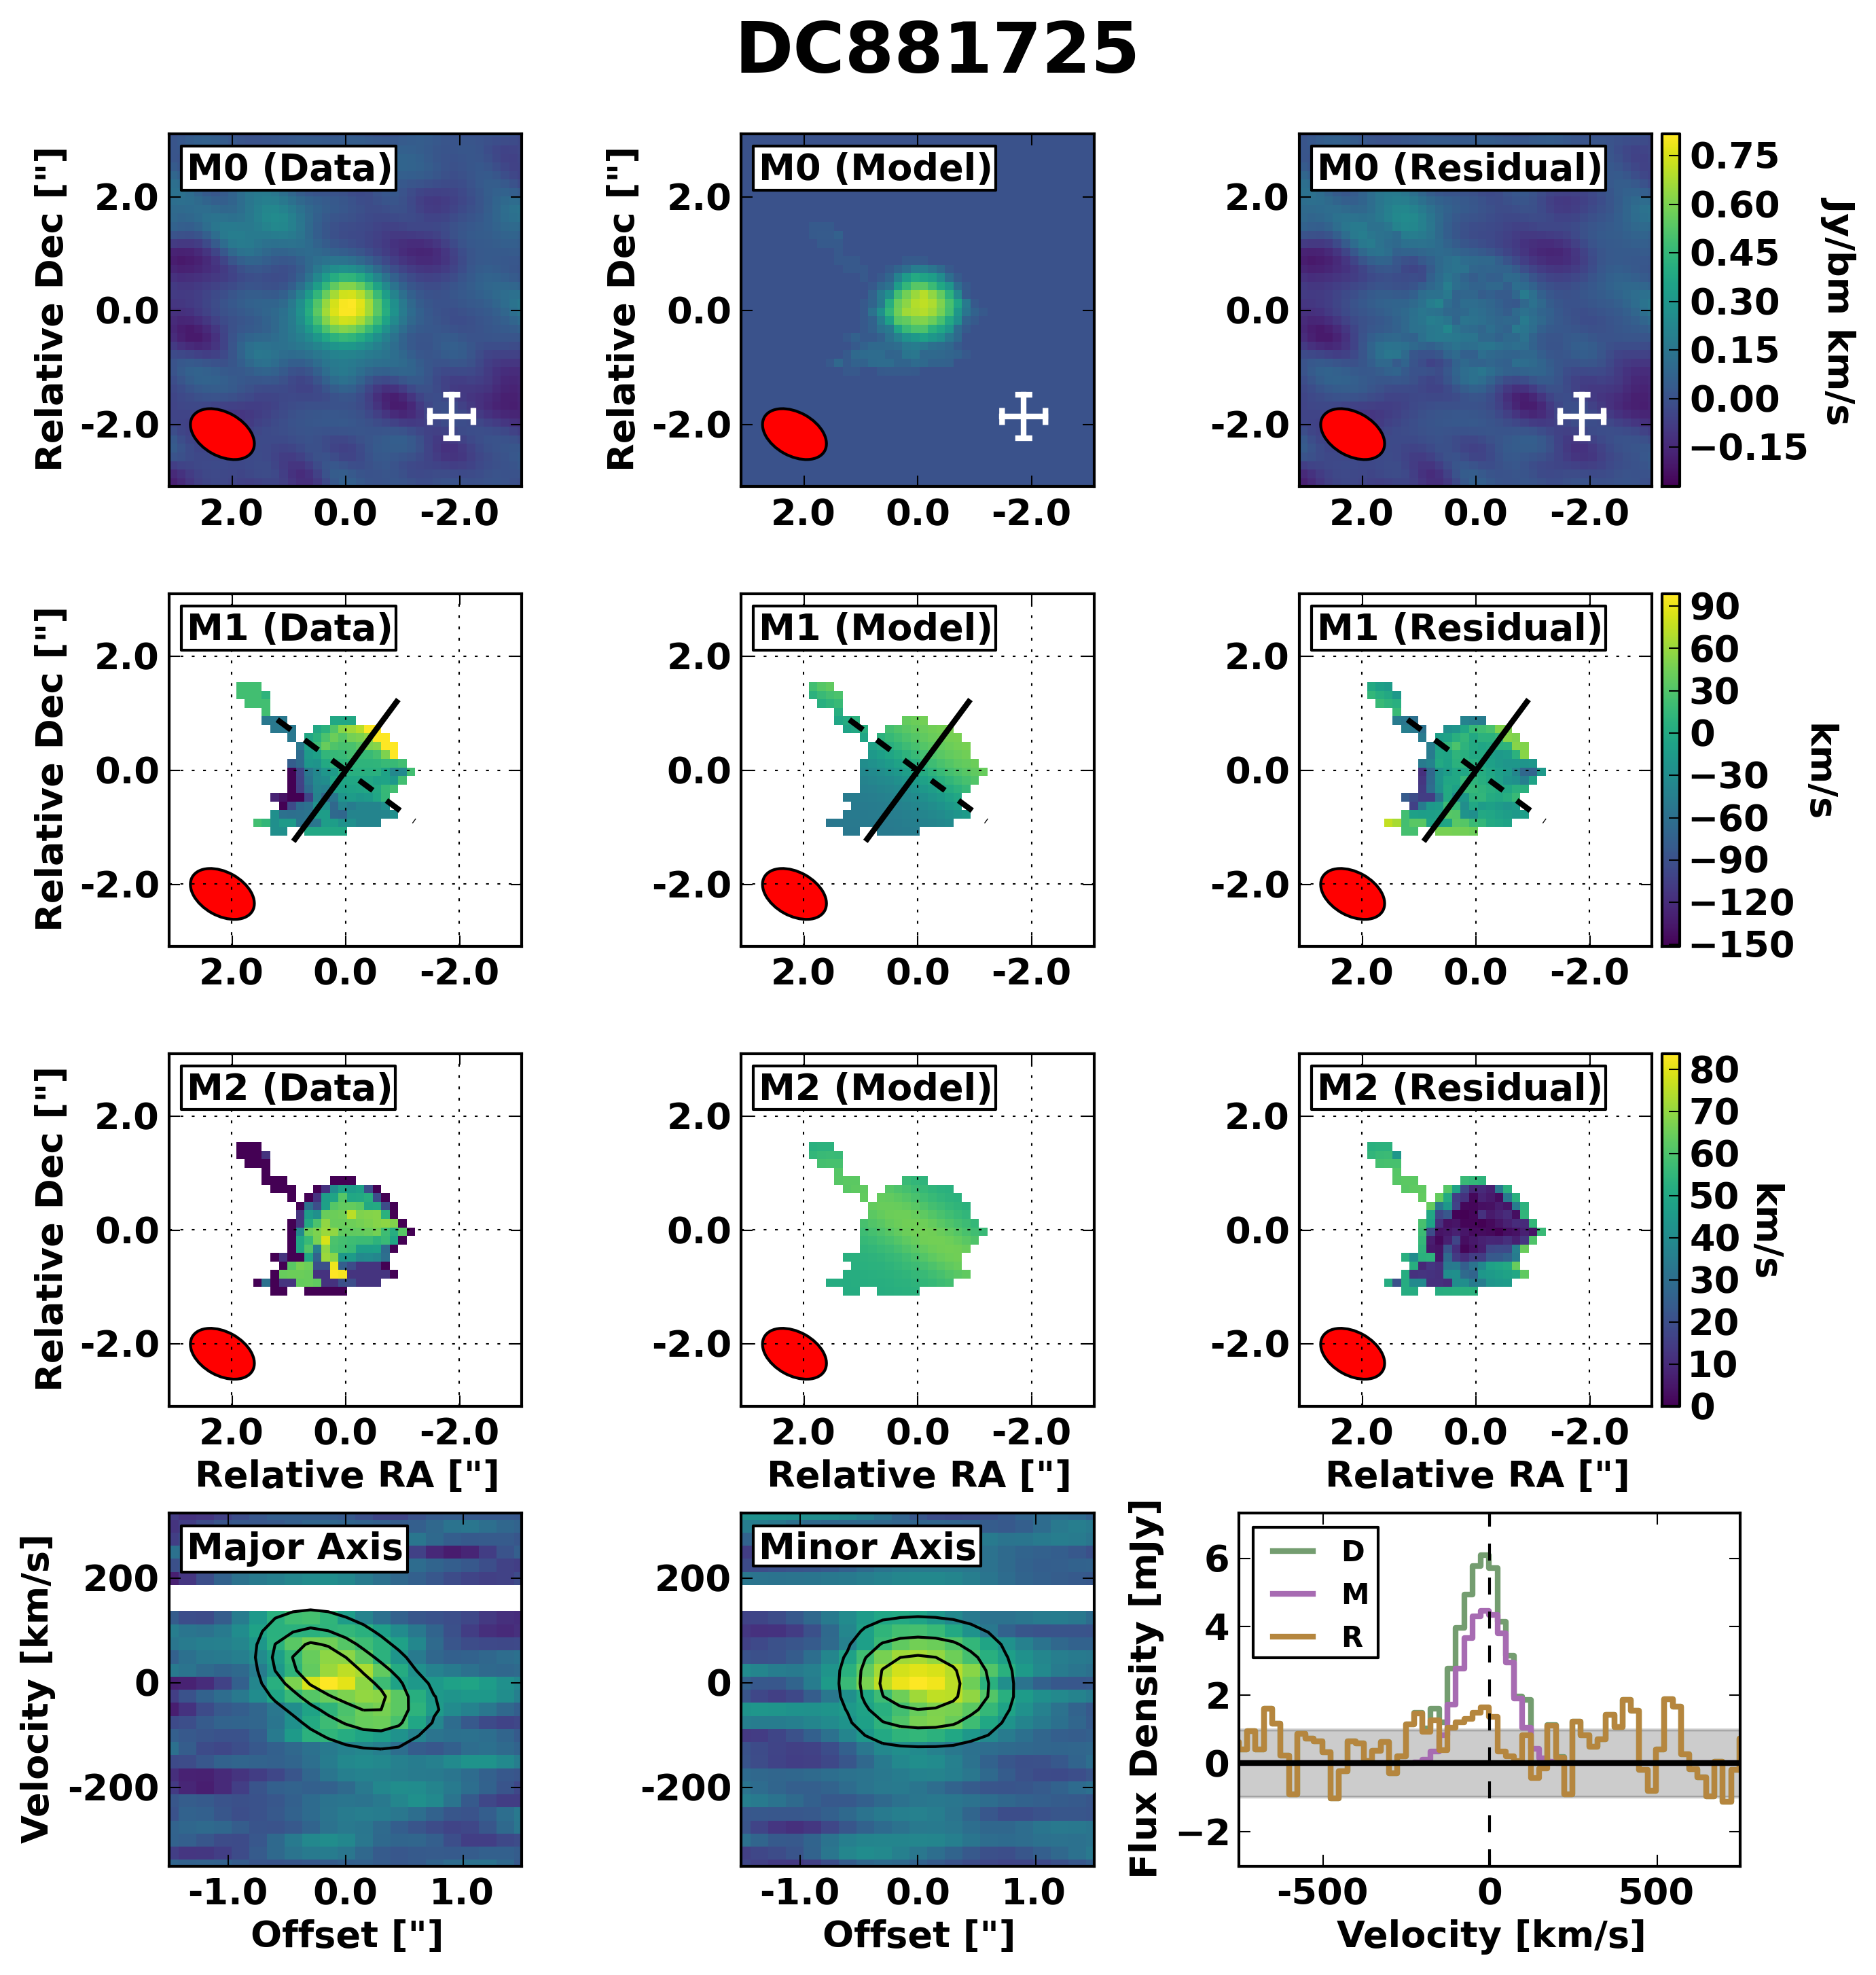
| DC881725 | 1 | ROT | ||||||||||
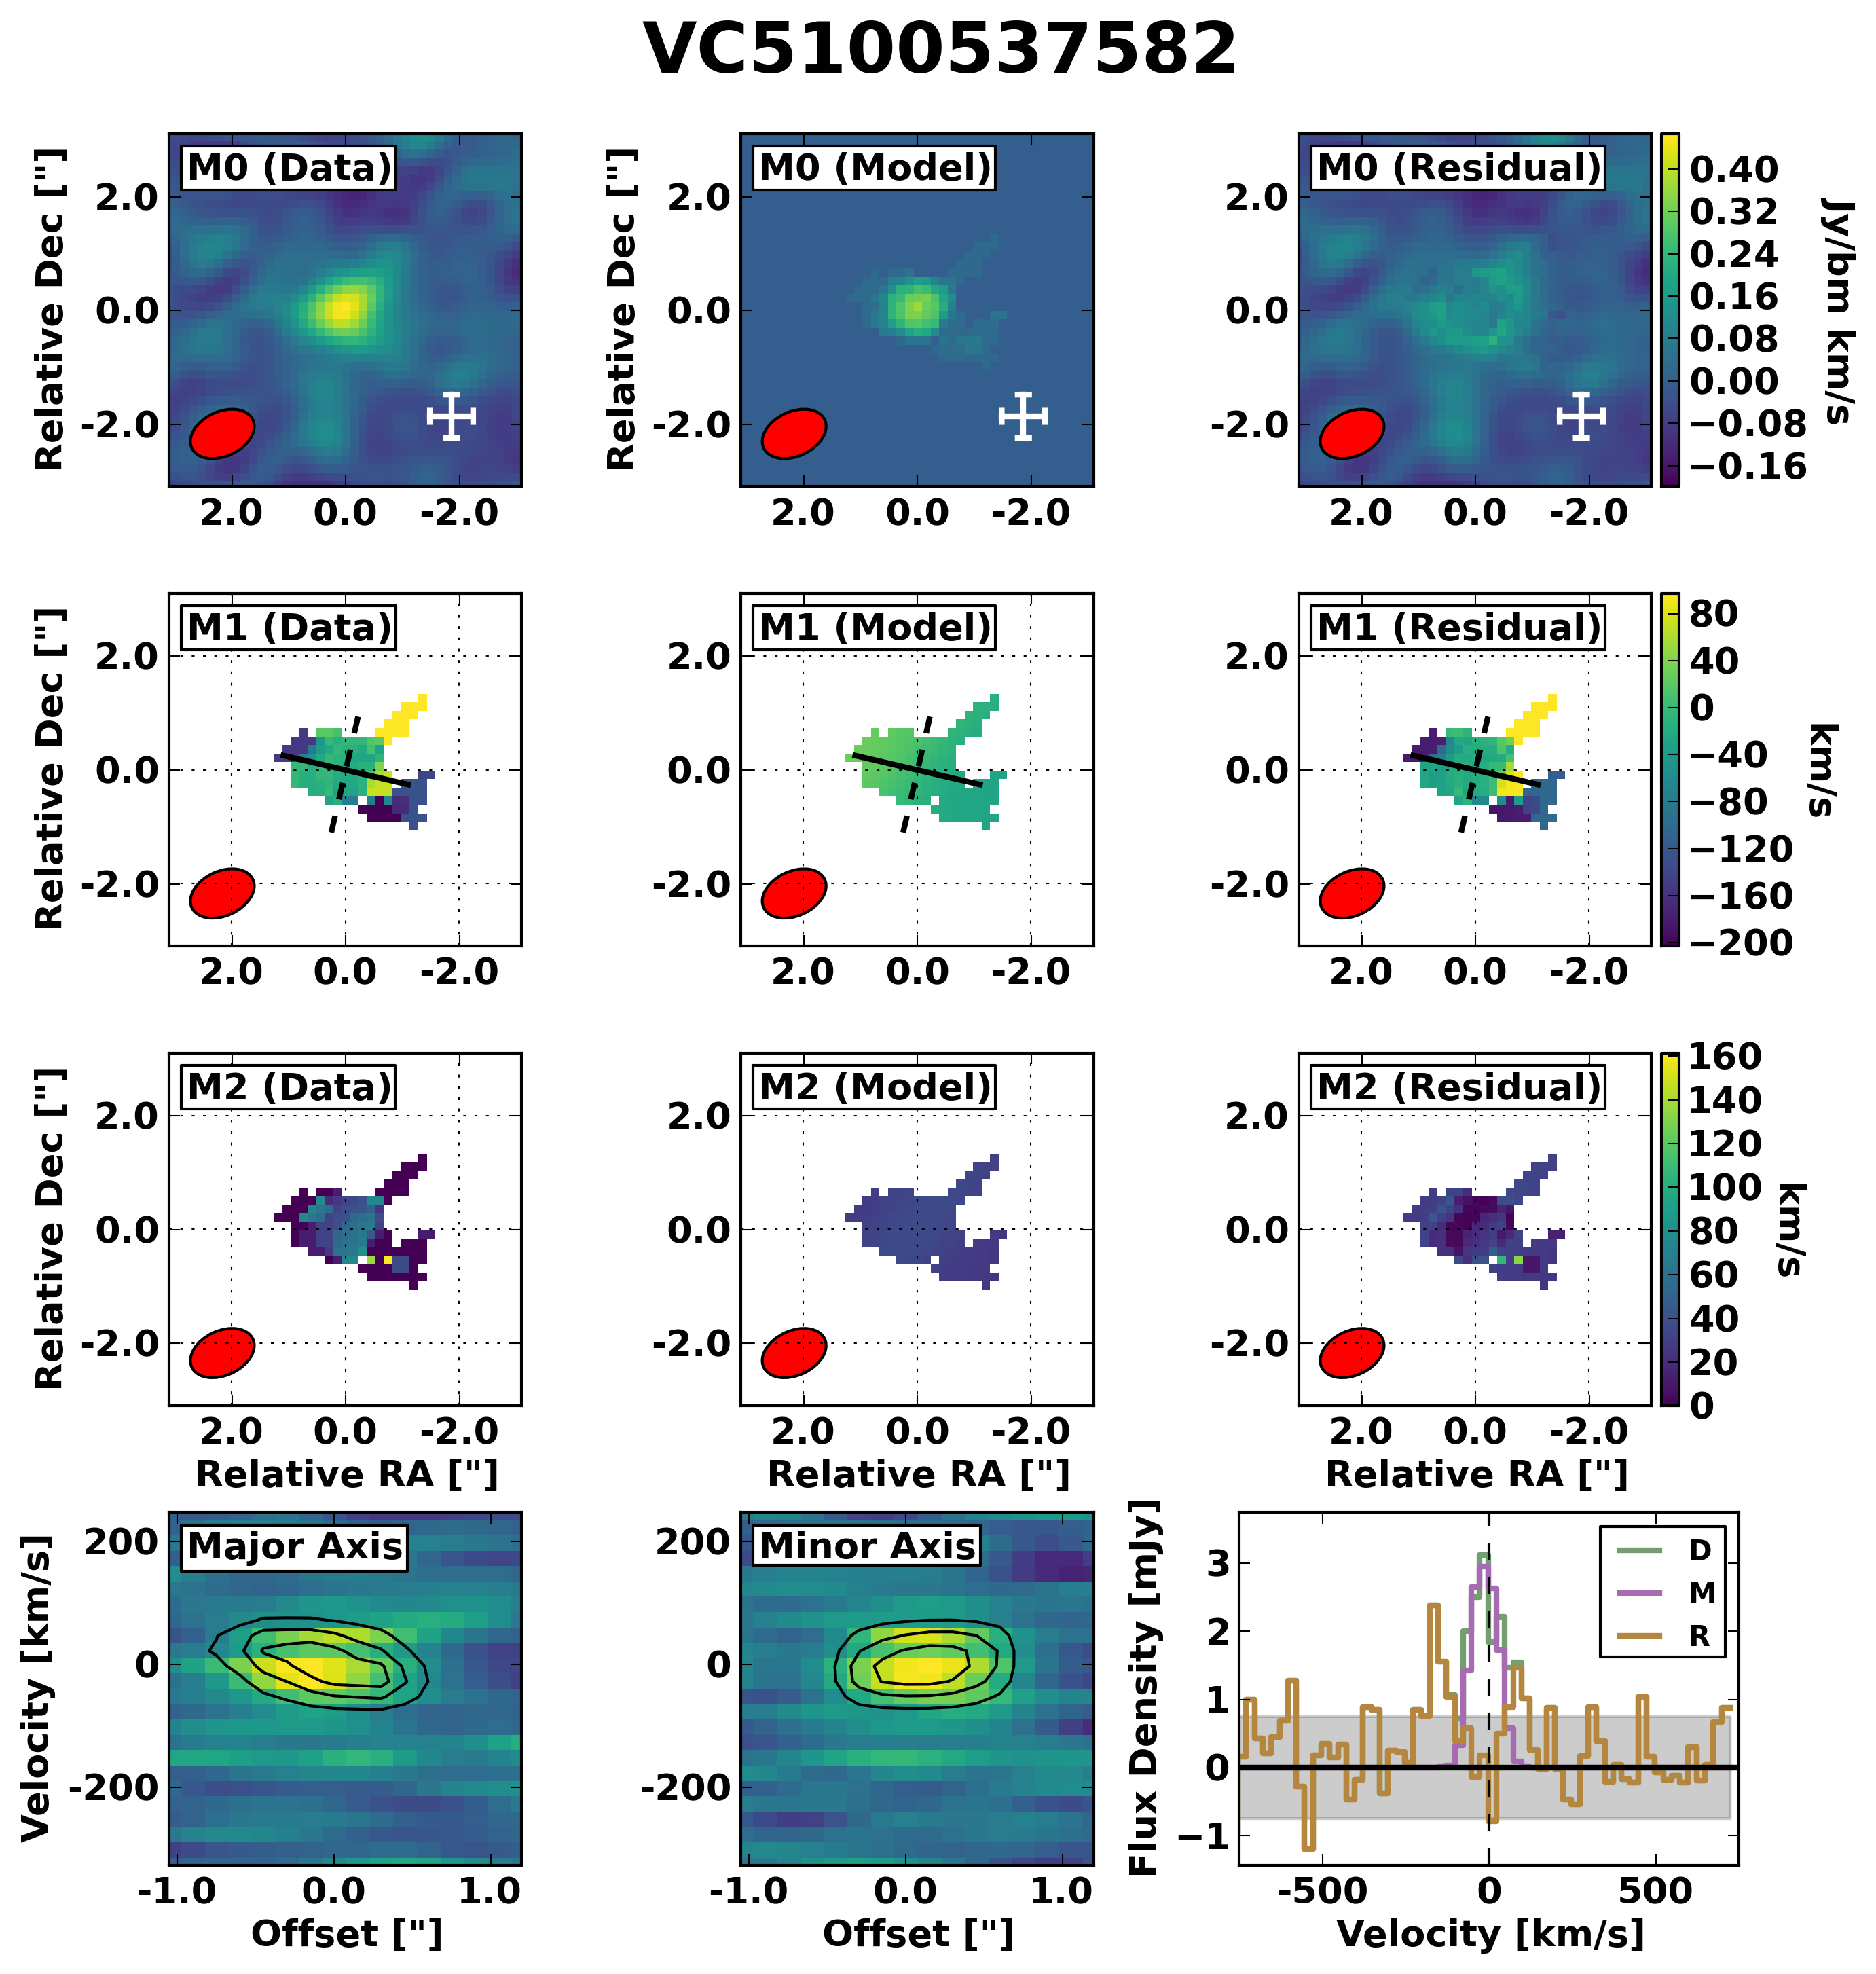
| VC5100537582 | 3 | UNC | ||||||||||
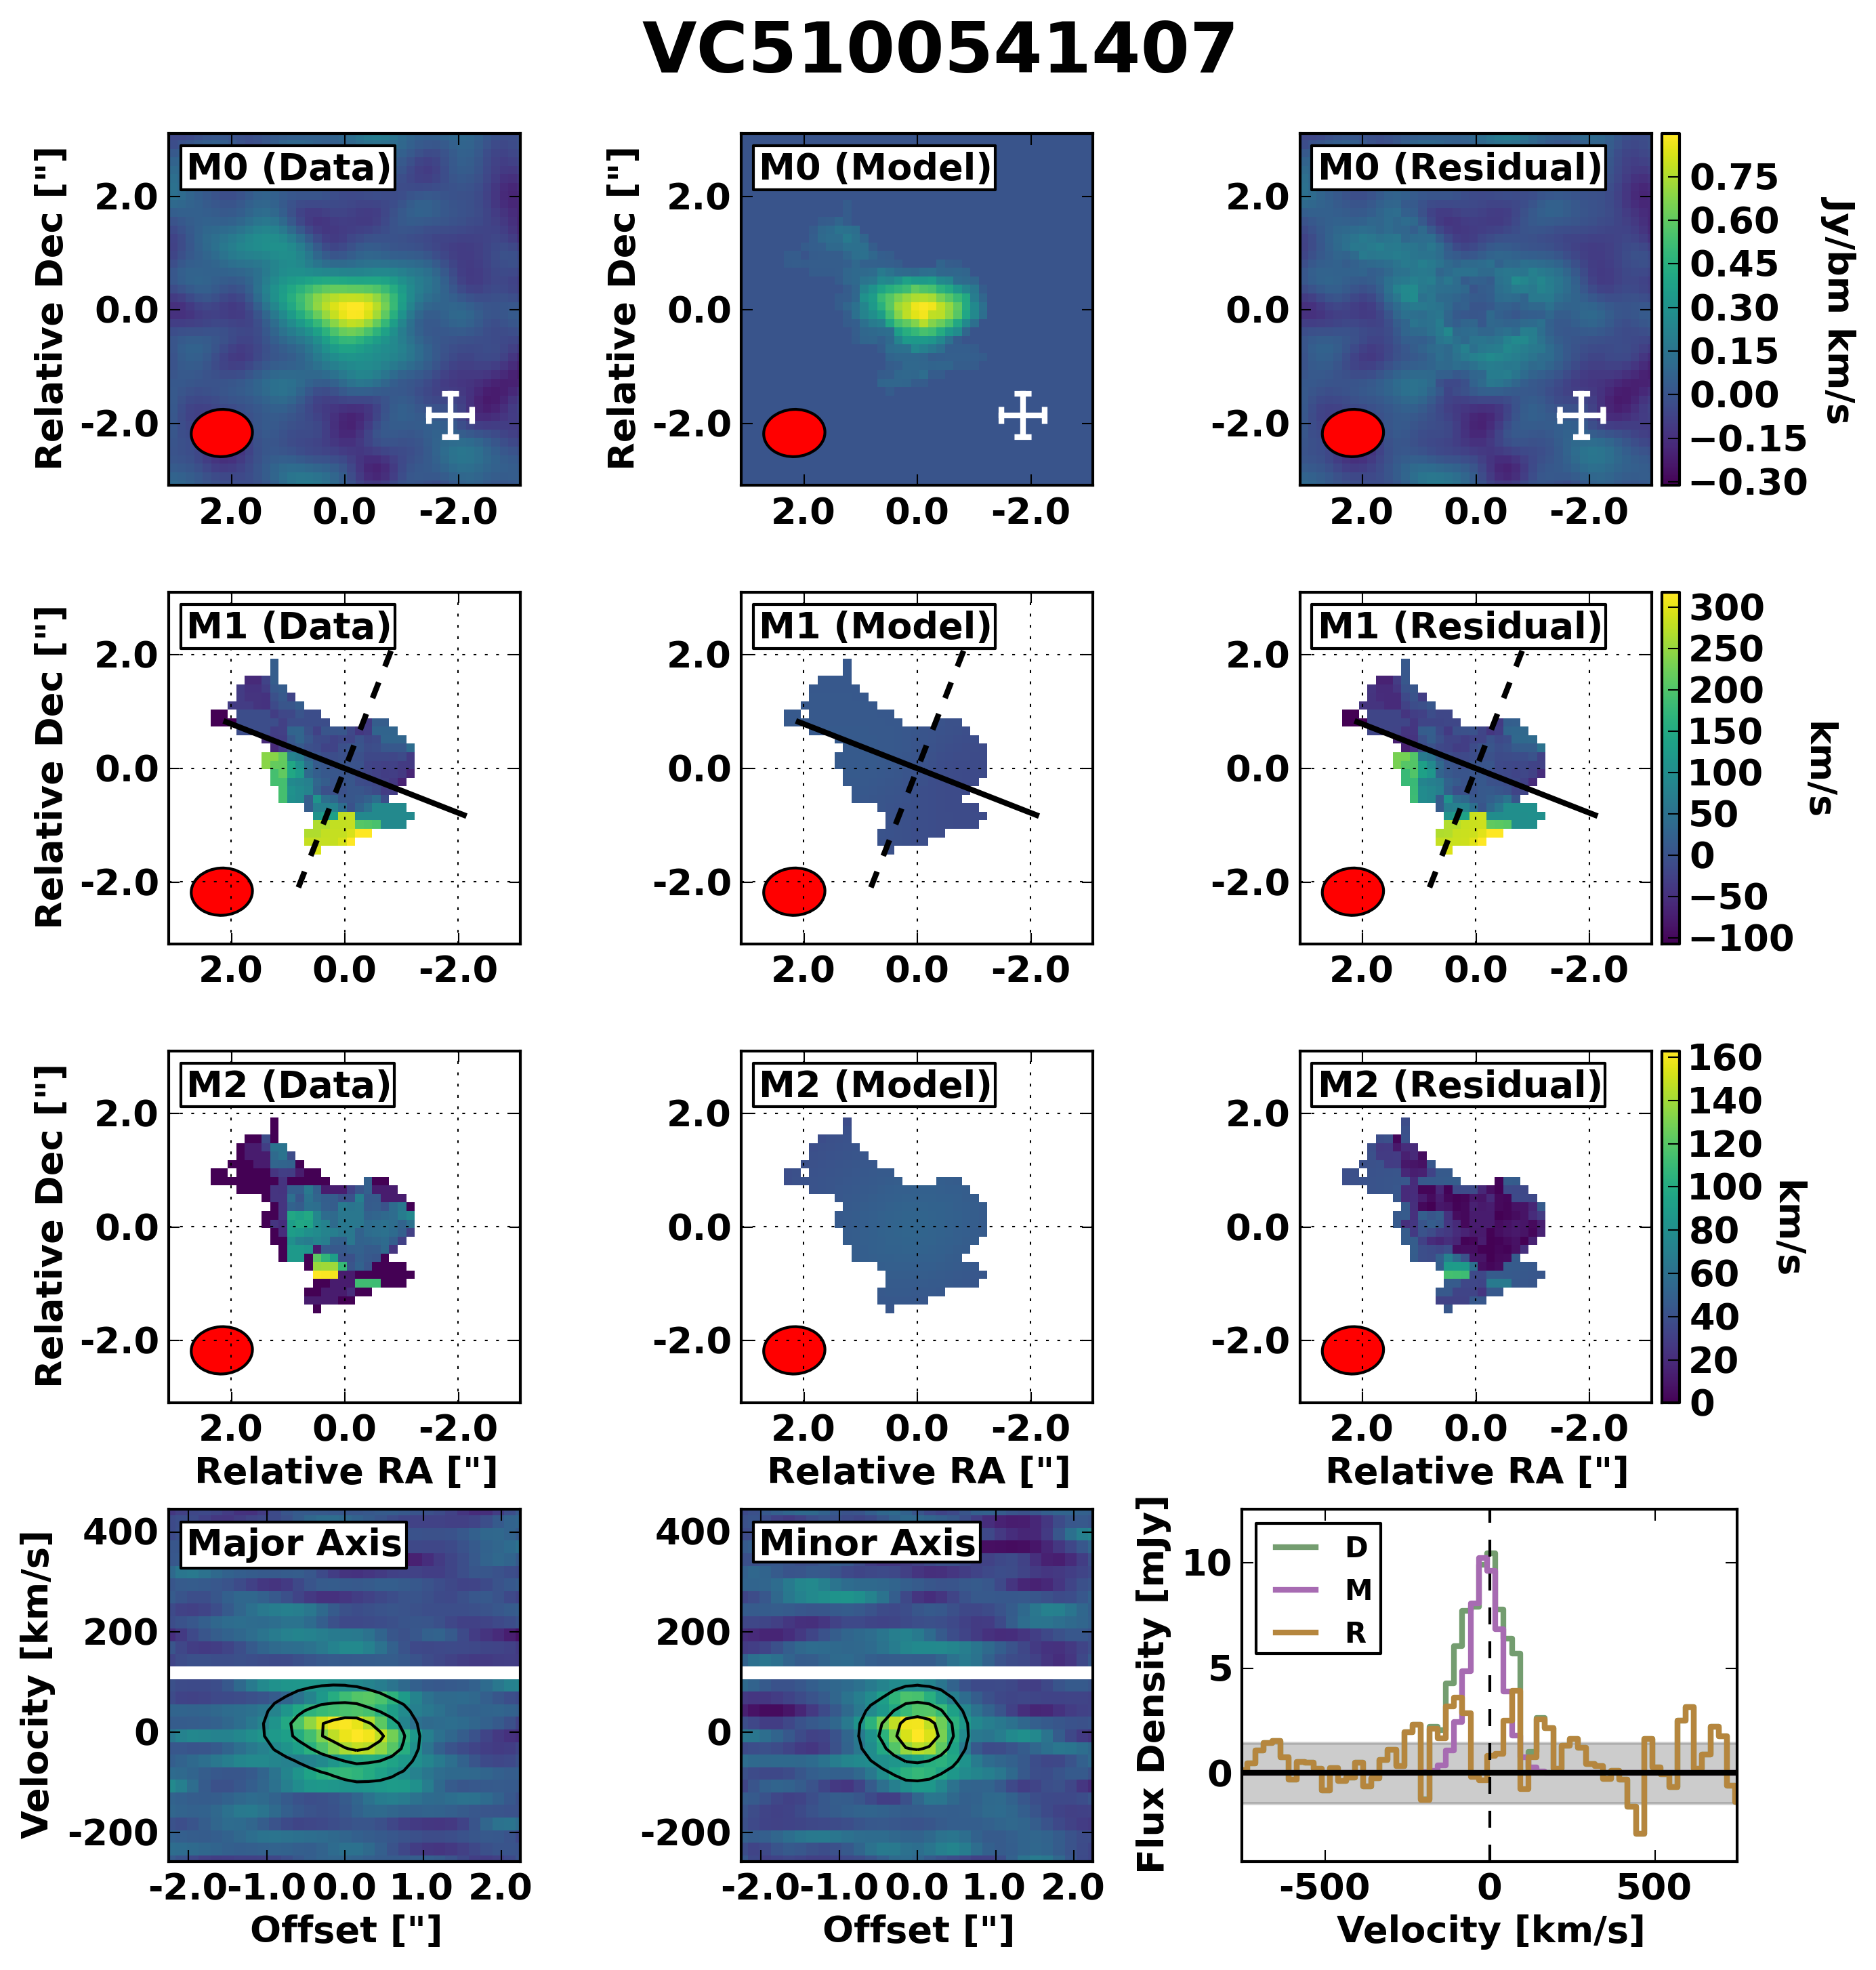
| VC5100541407 | 2 | UNC | ||||||||||
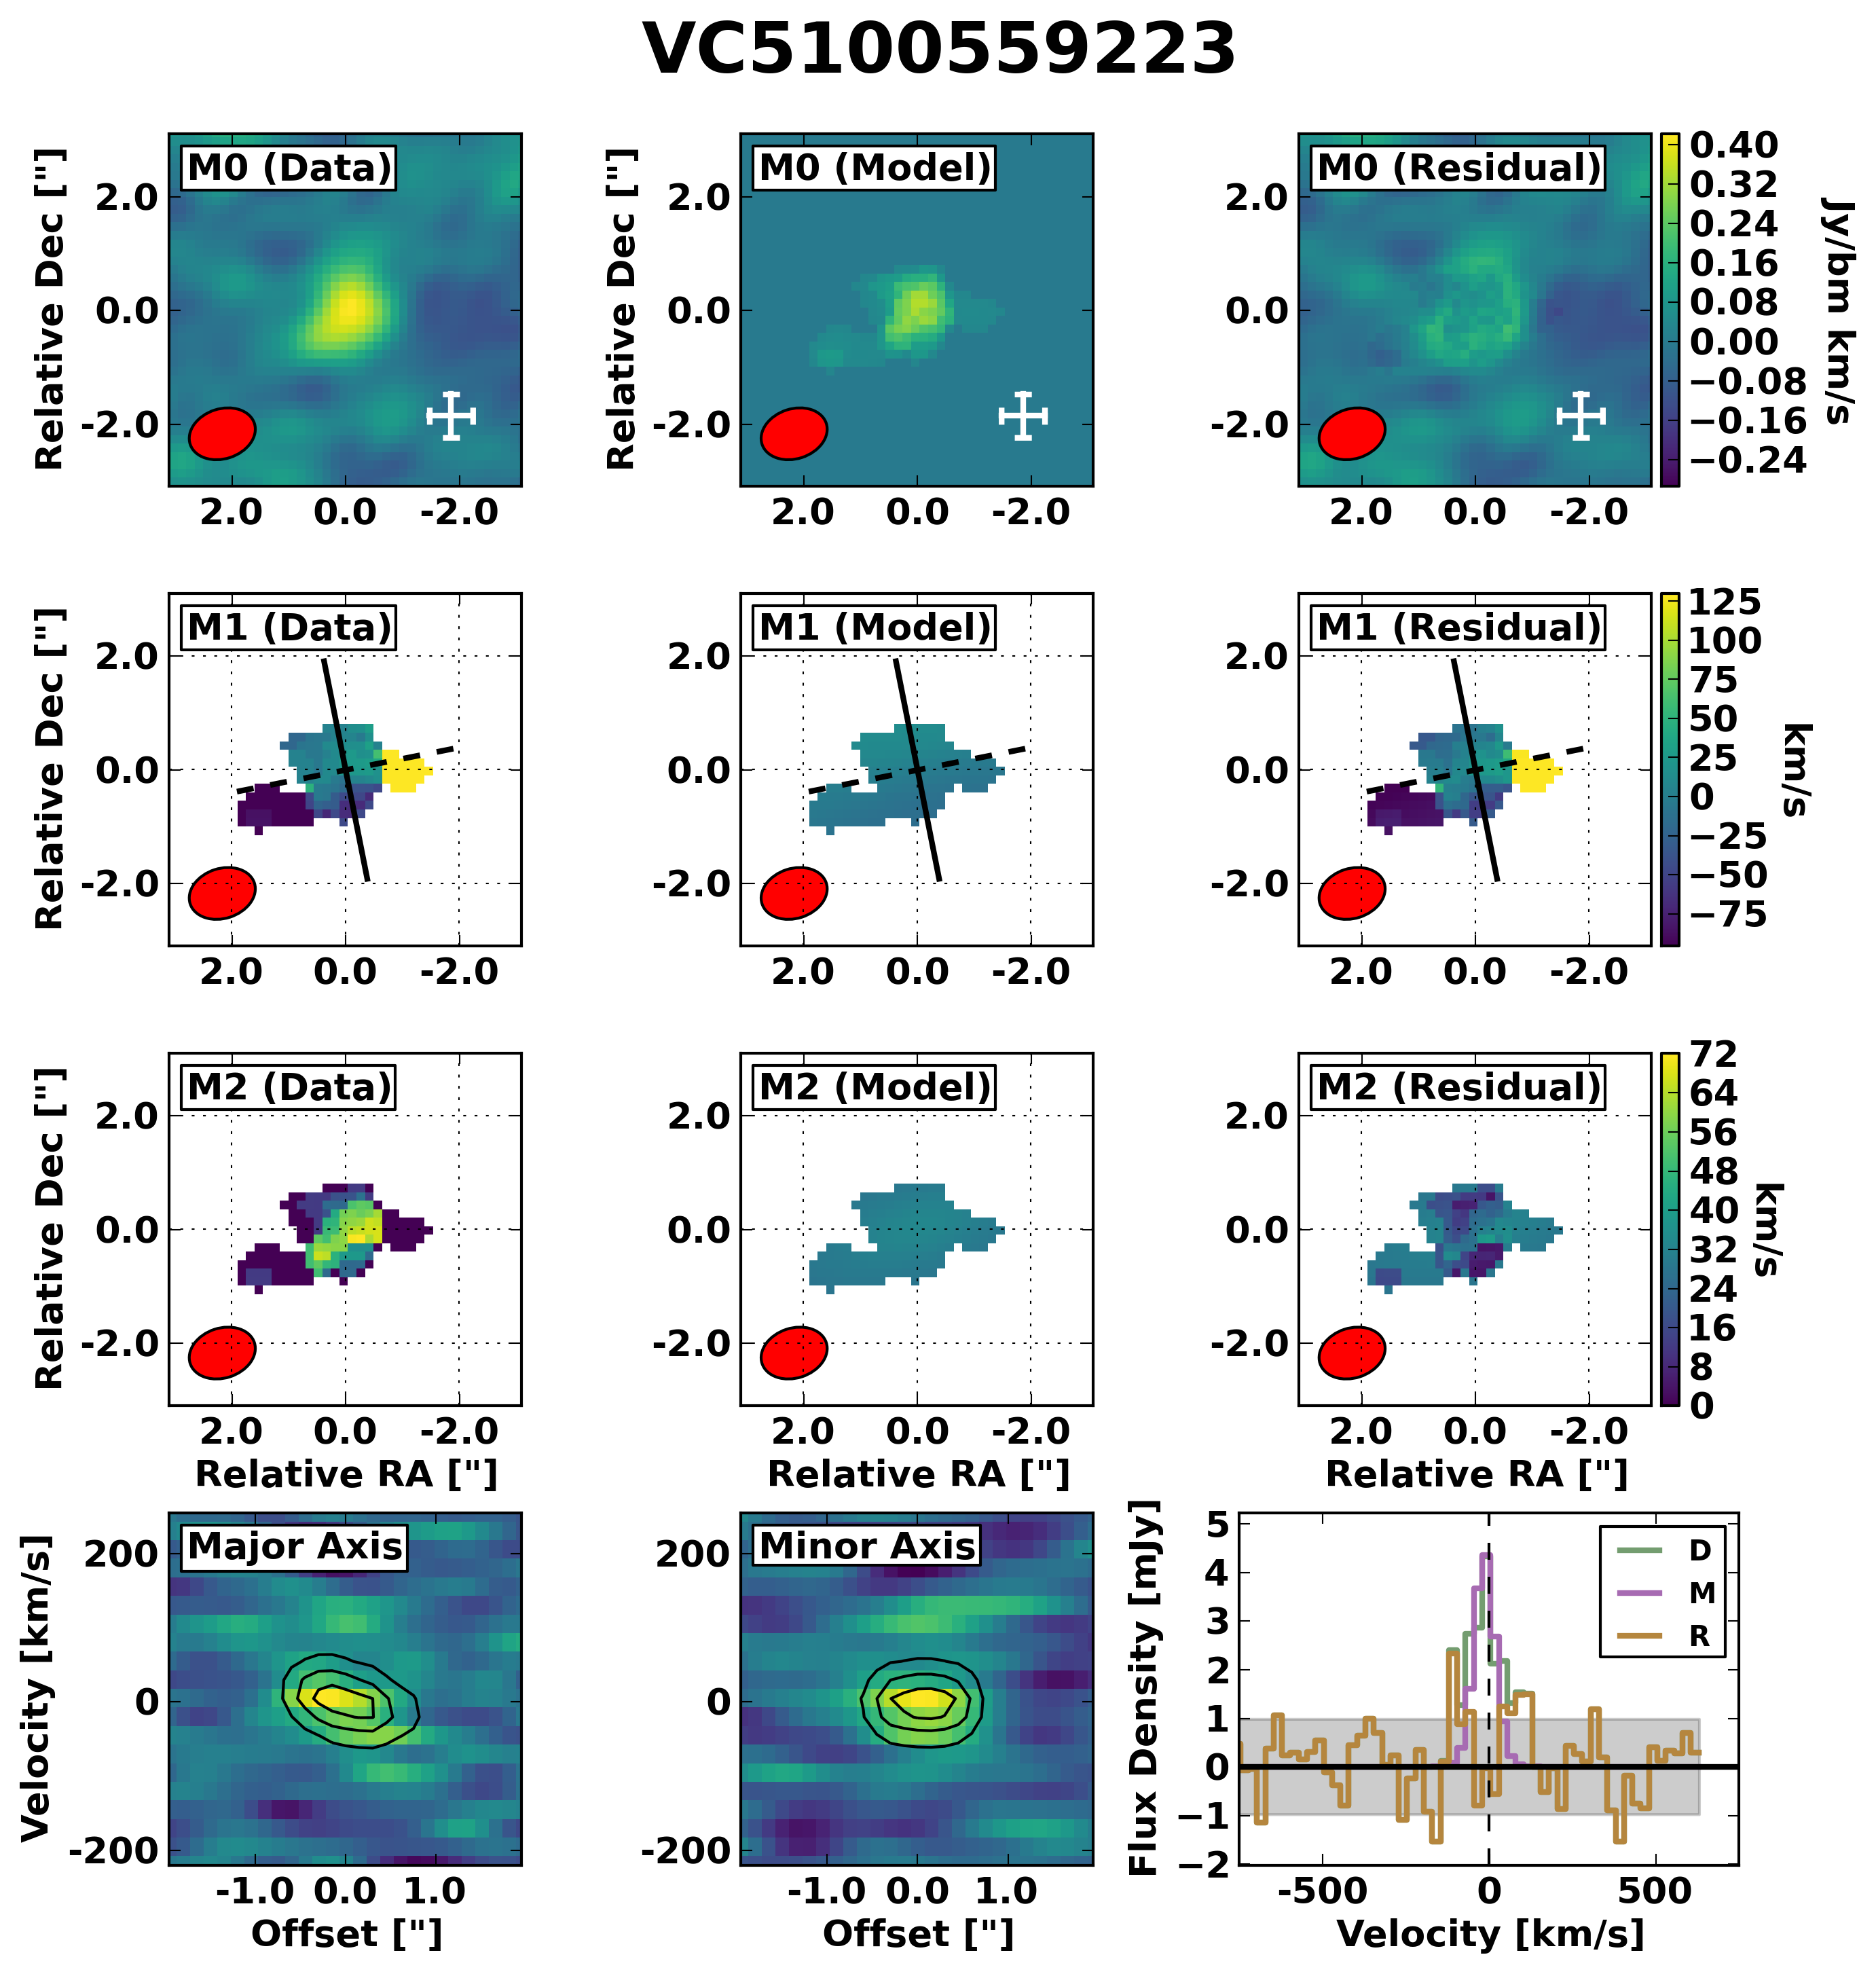
| VC5100559223 | 3 | UNC | ||||||||||
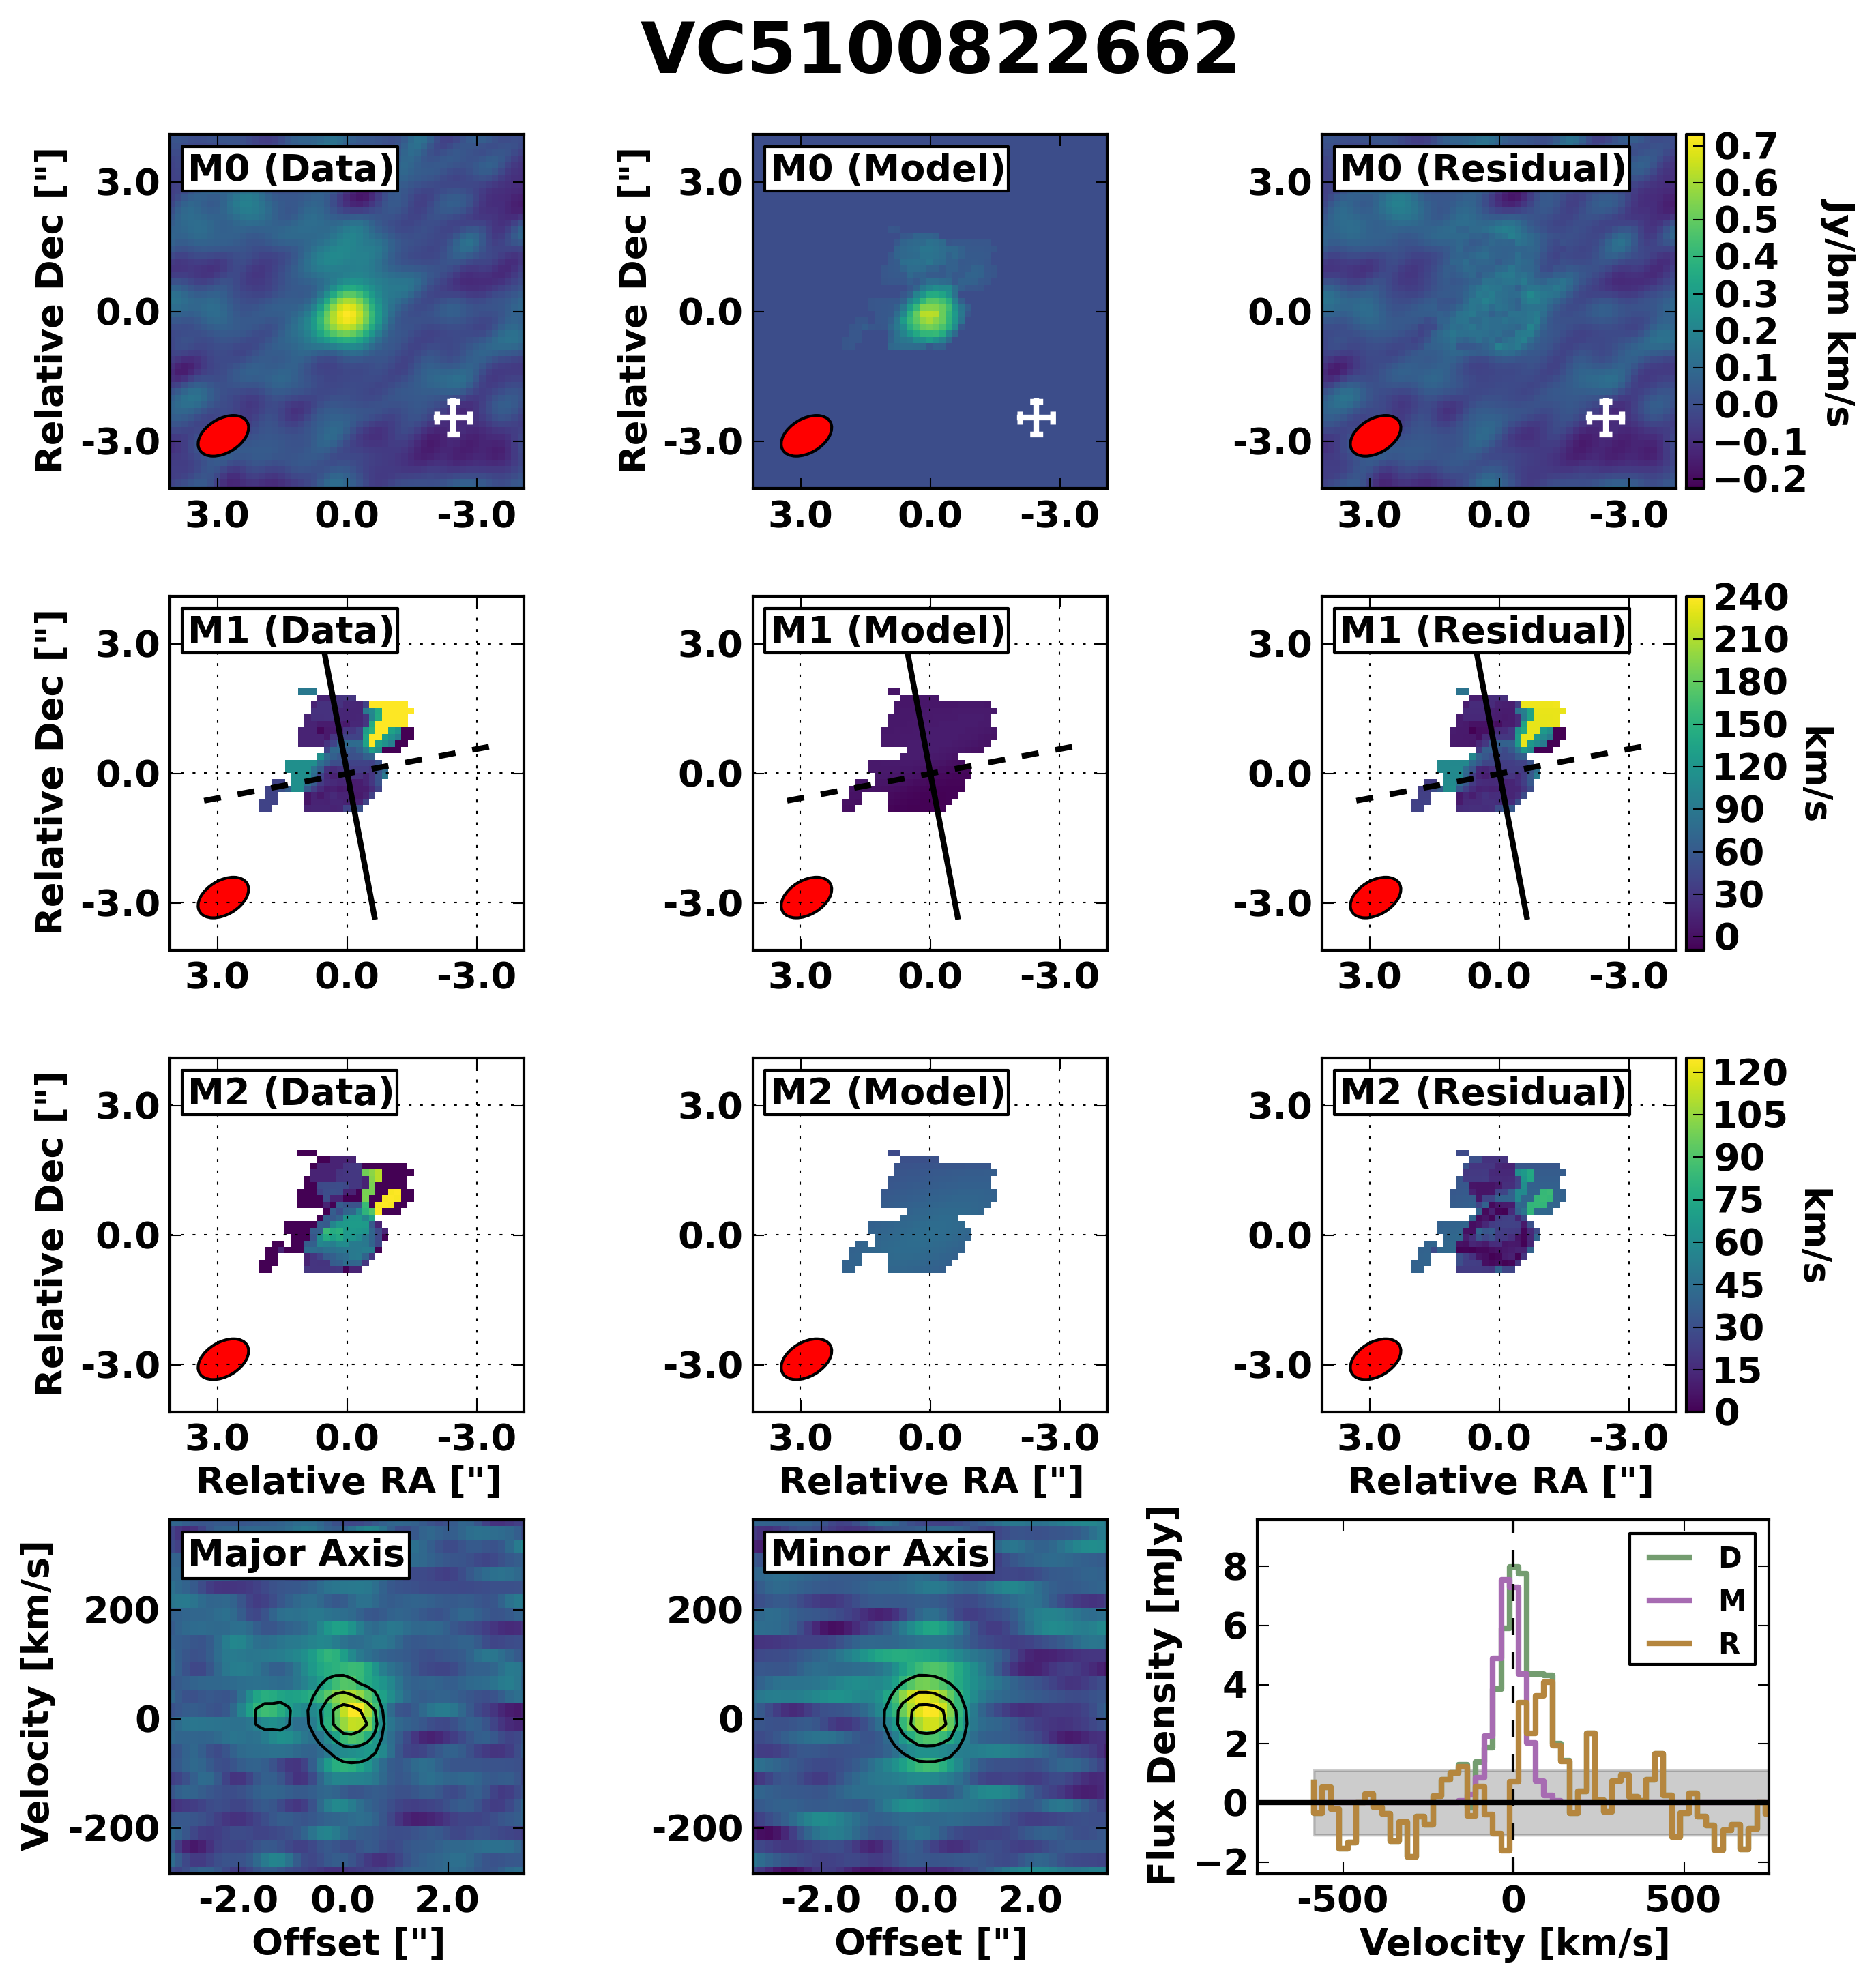
| VC5100822662 | 2 | MER | ||||||||||
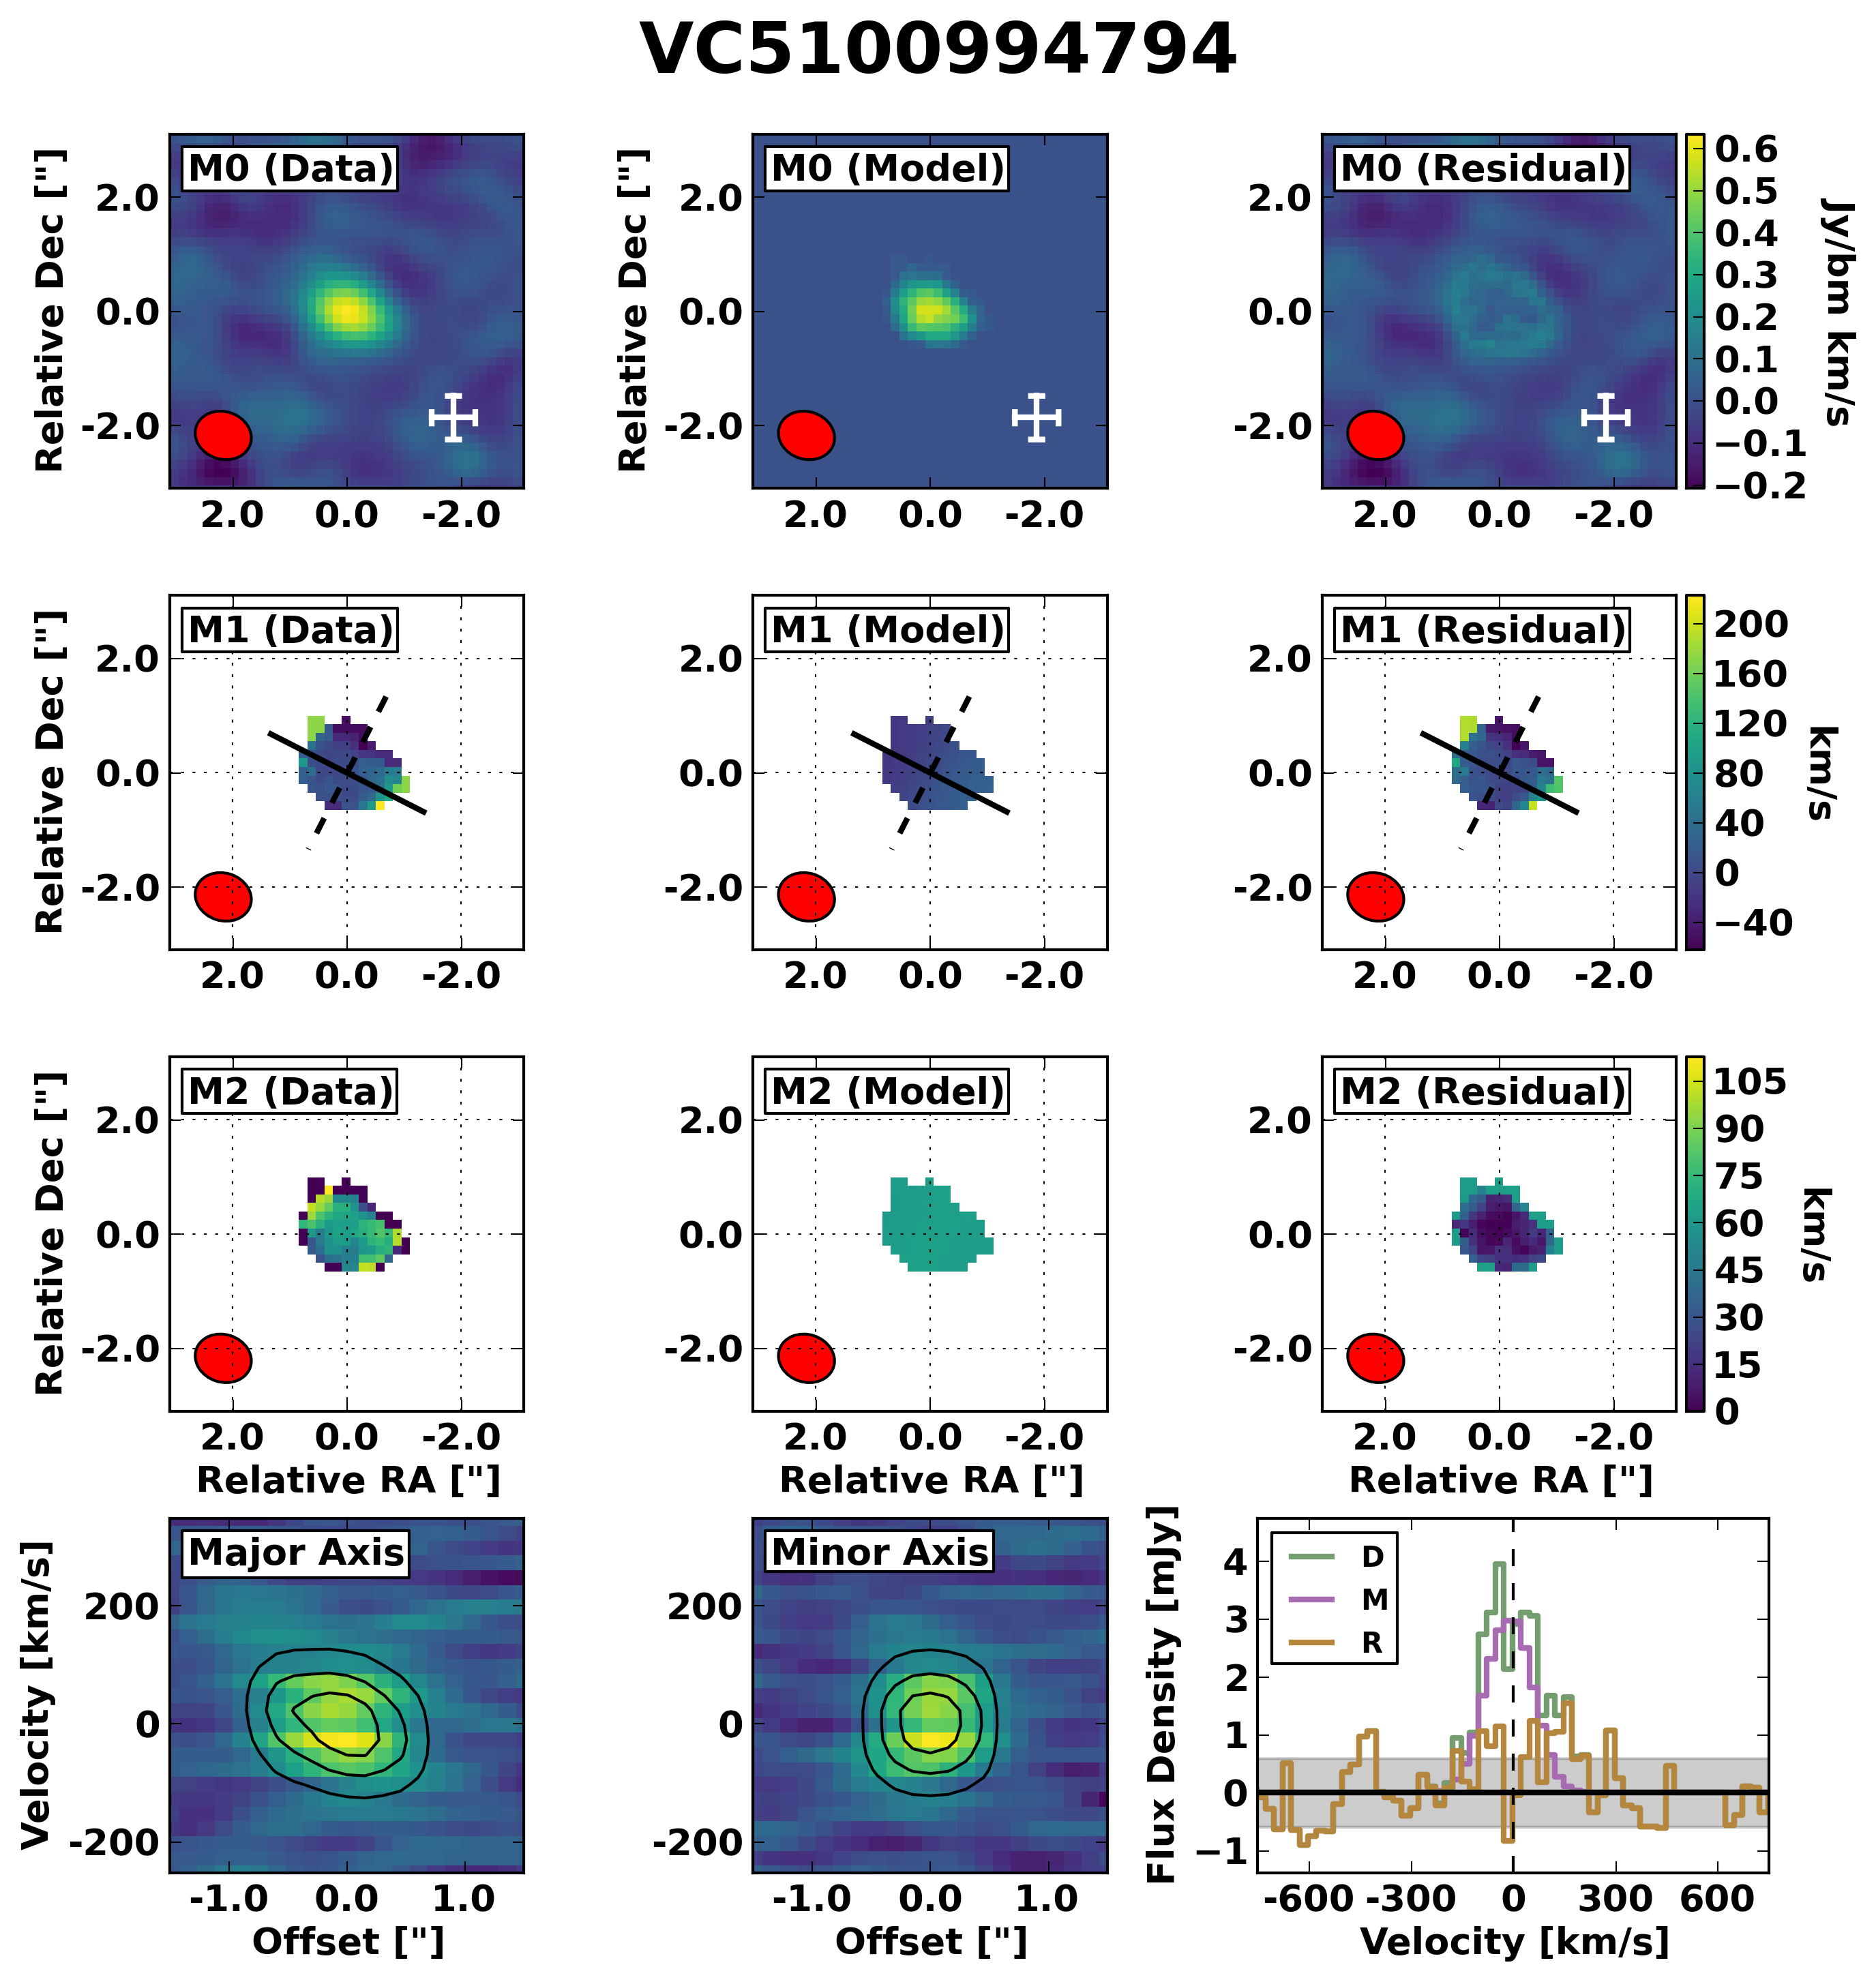
| VC5100994794 | 3 | UNC | ||||||||||
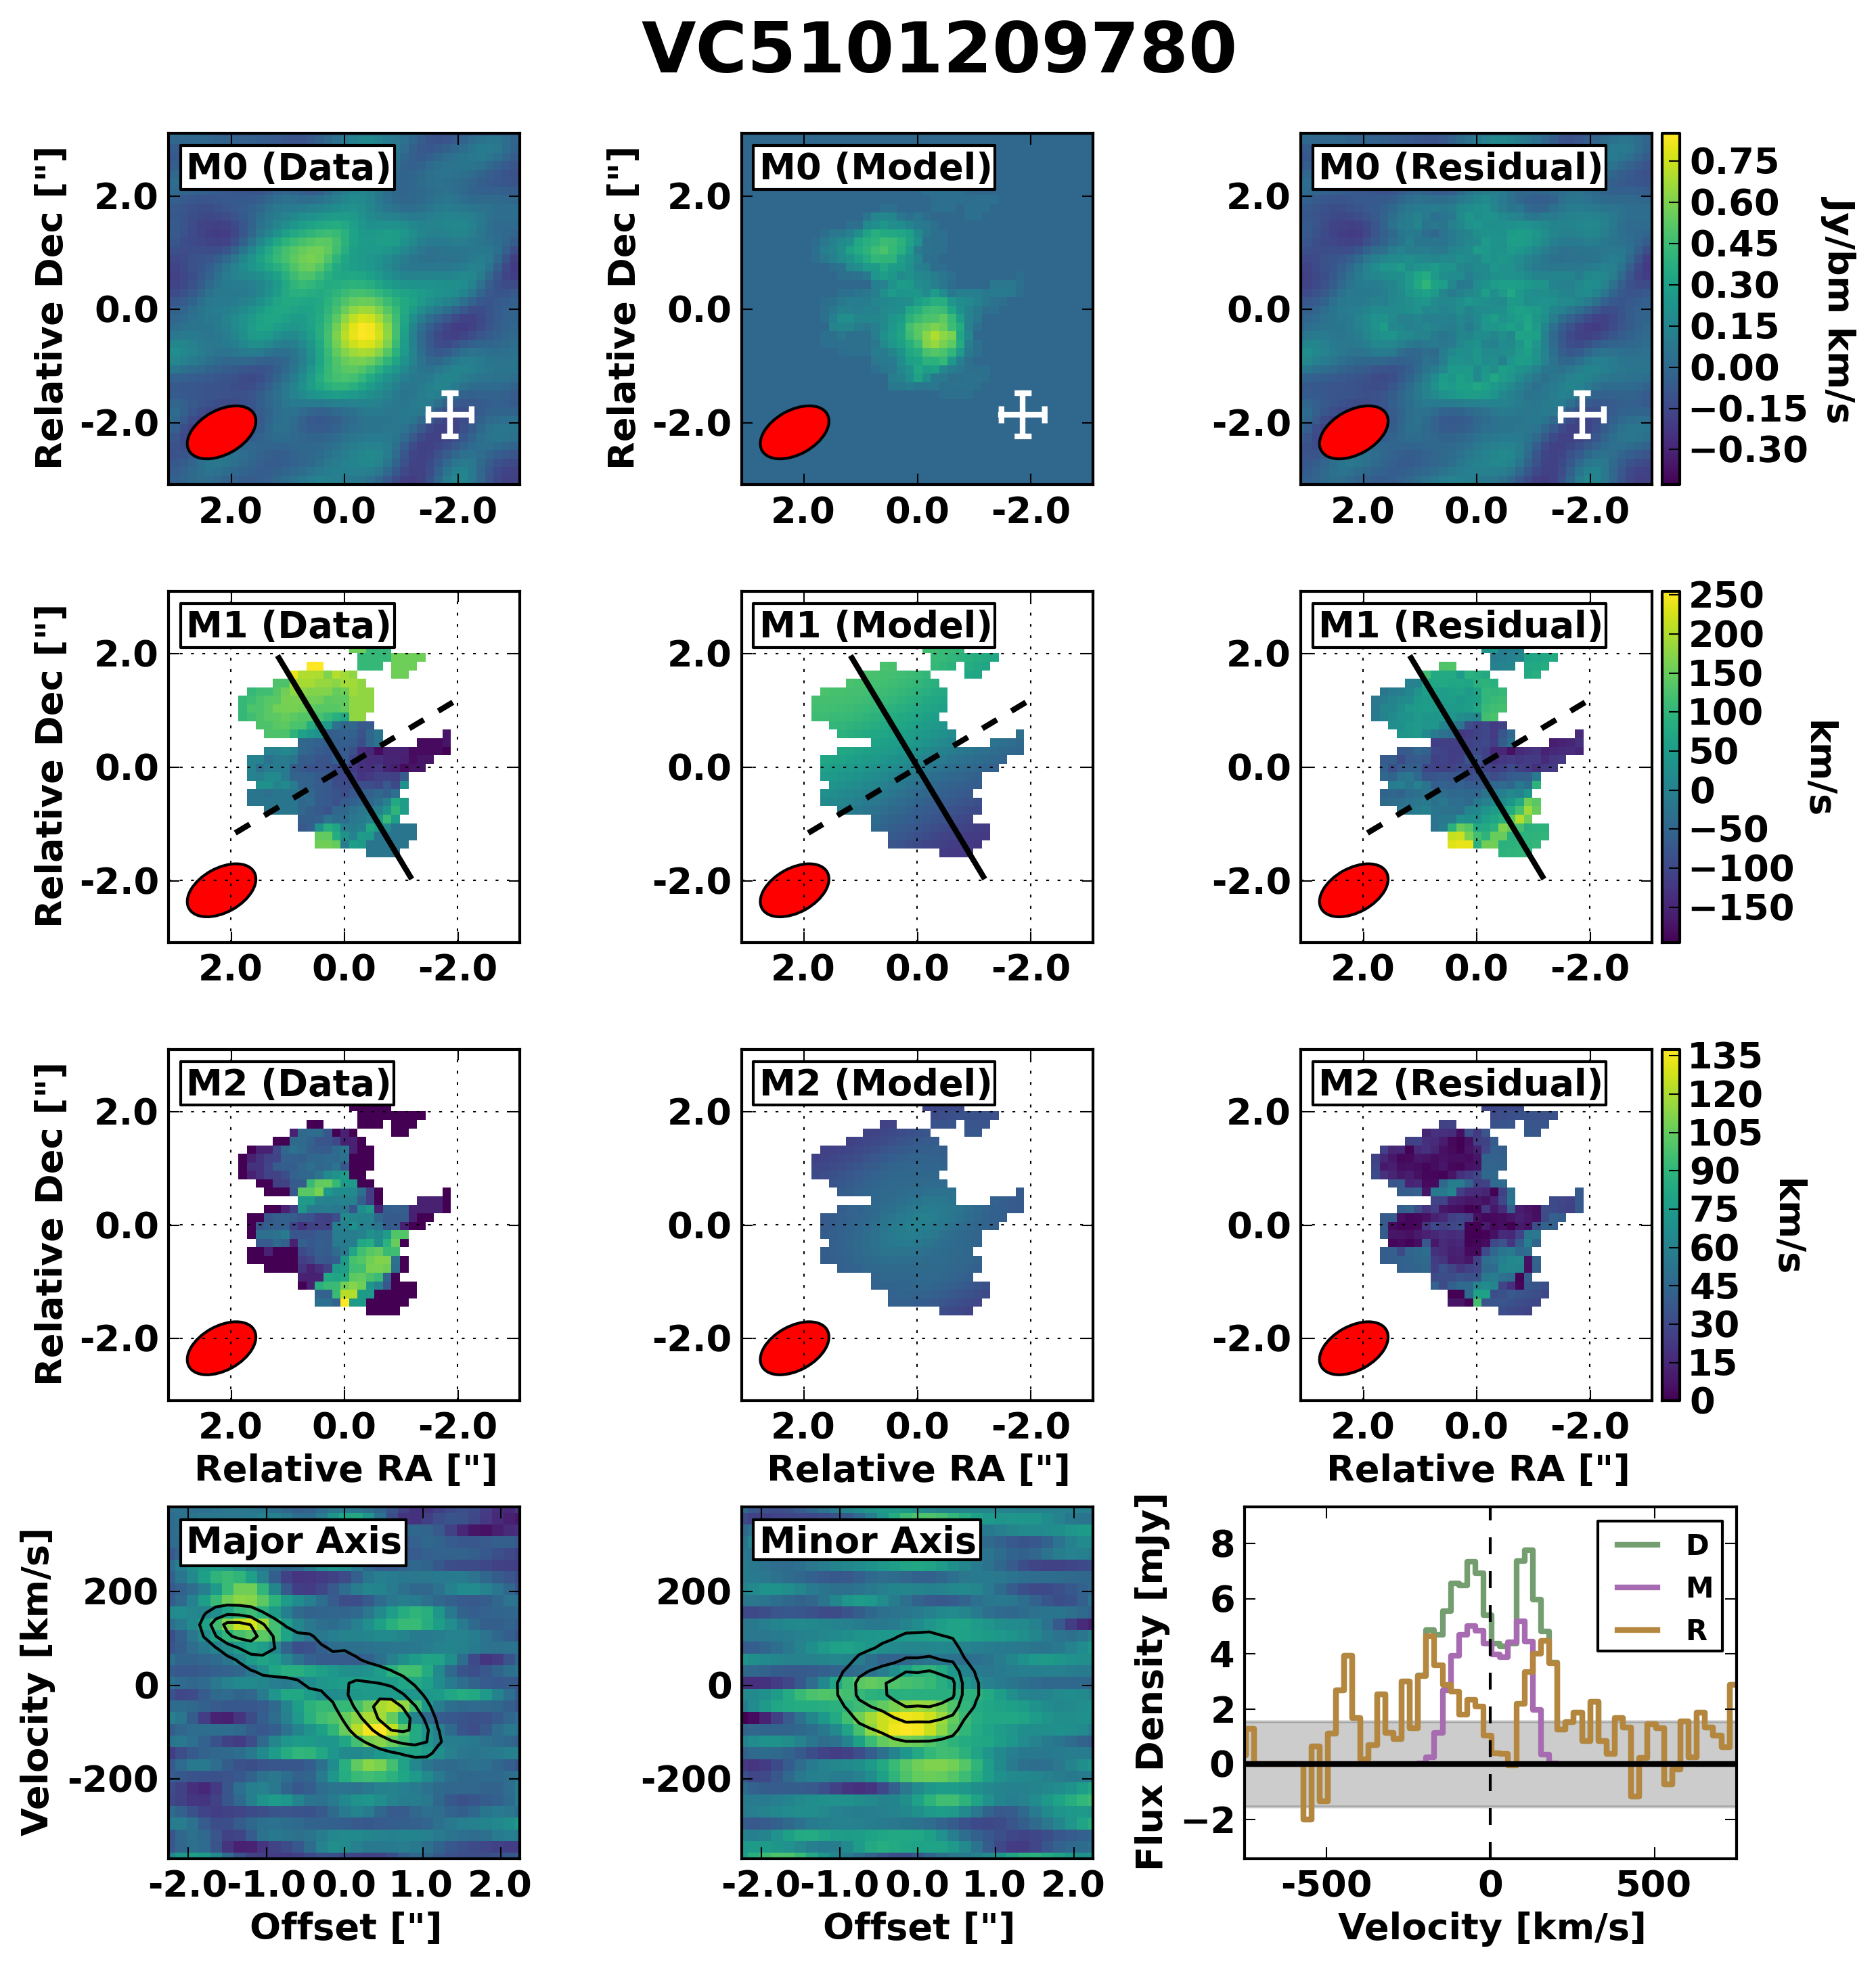
| VC5101209780 | 2 | MER | ||||||||||
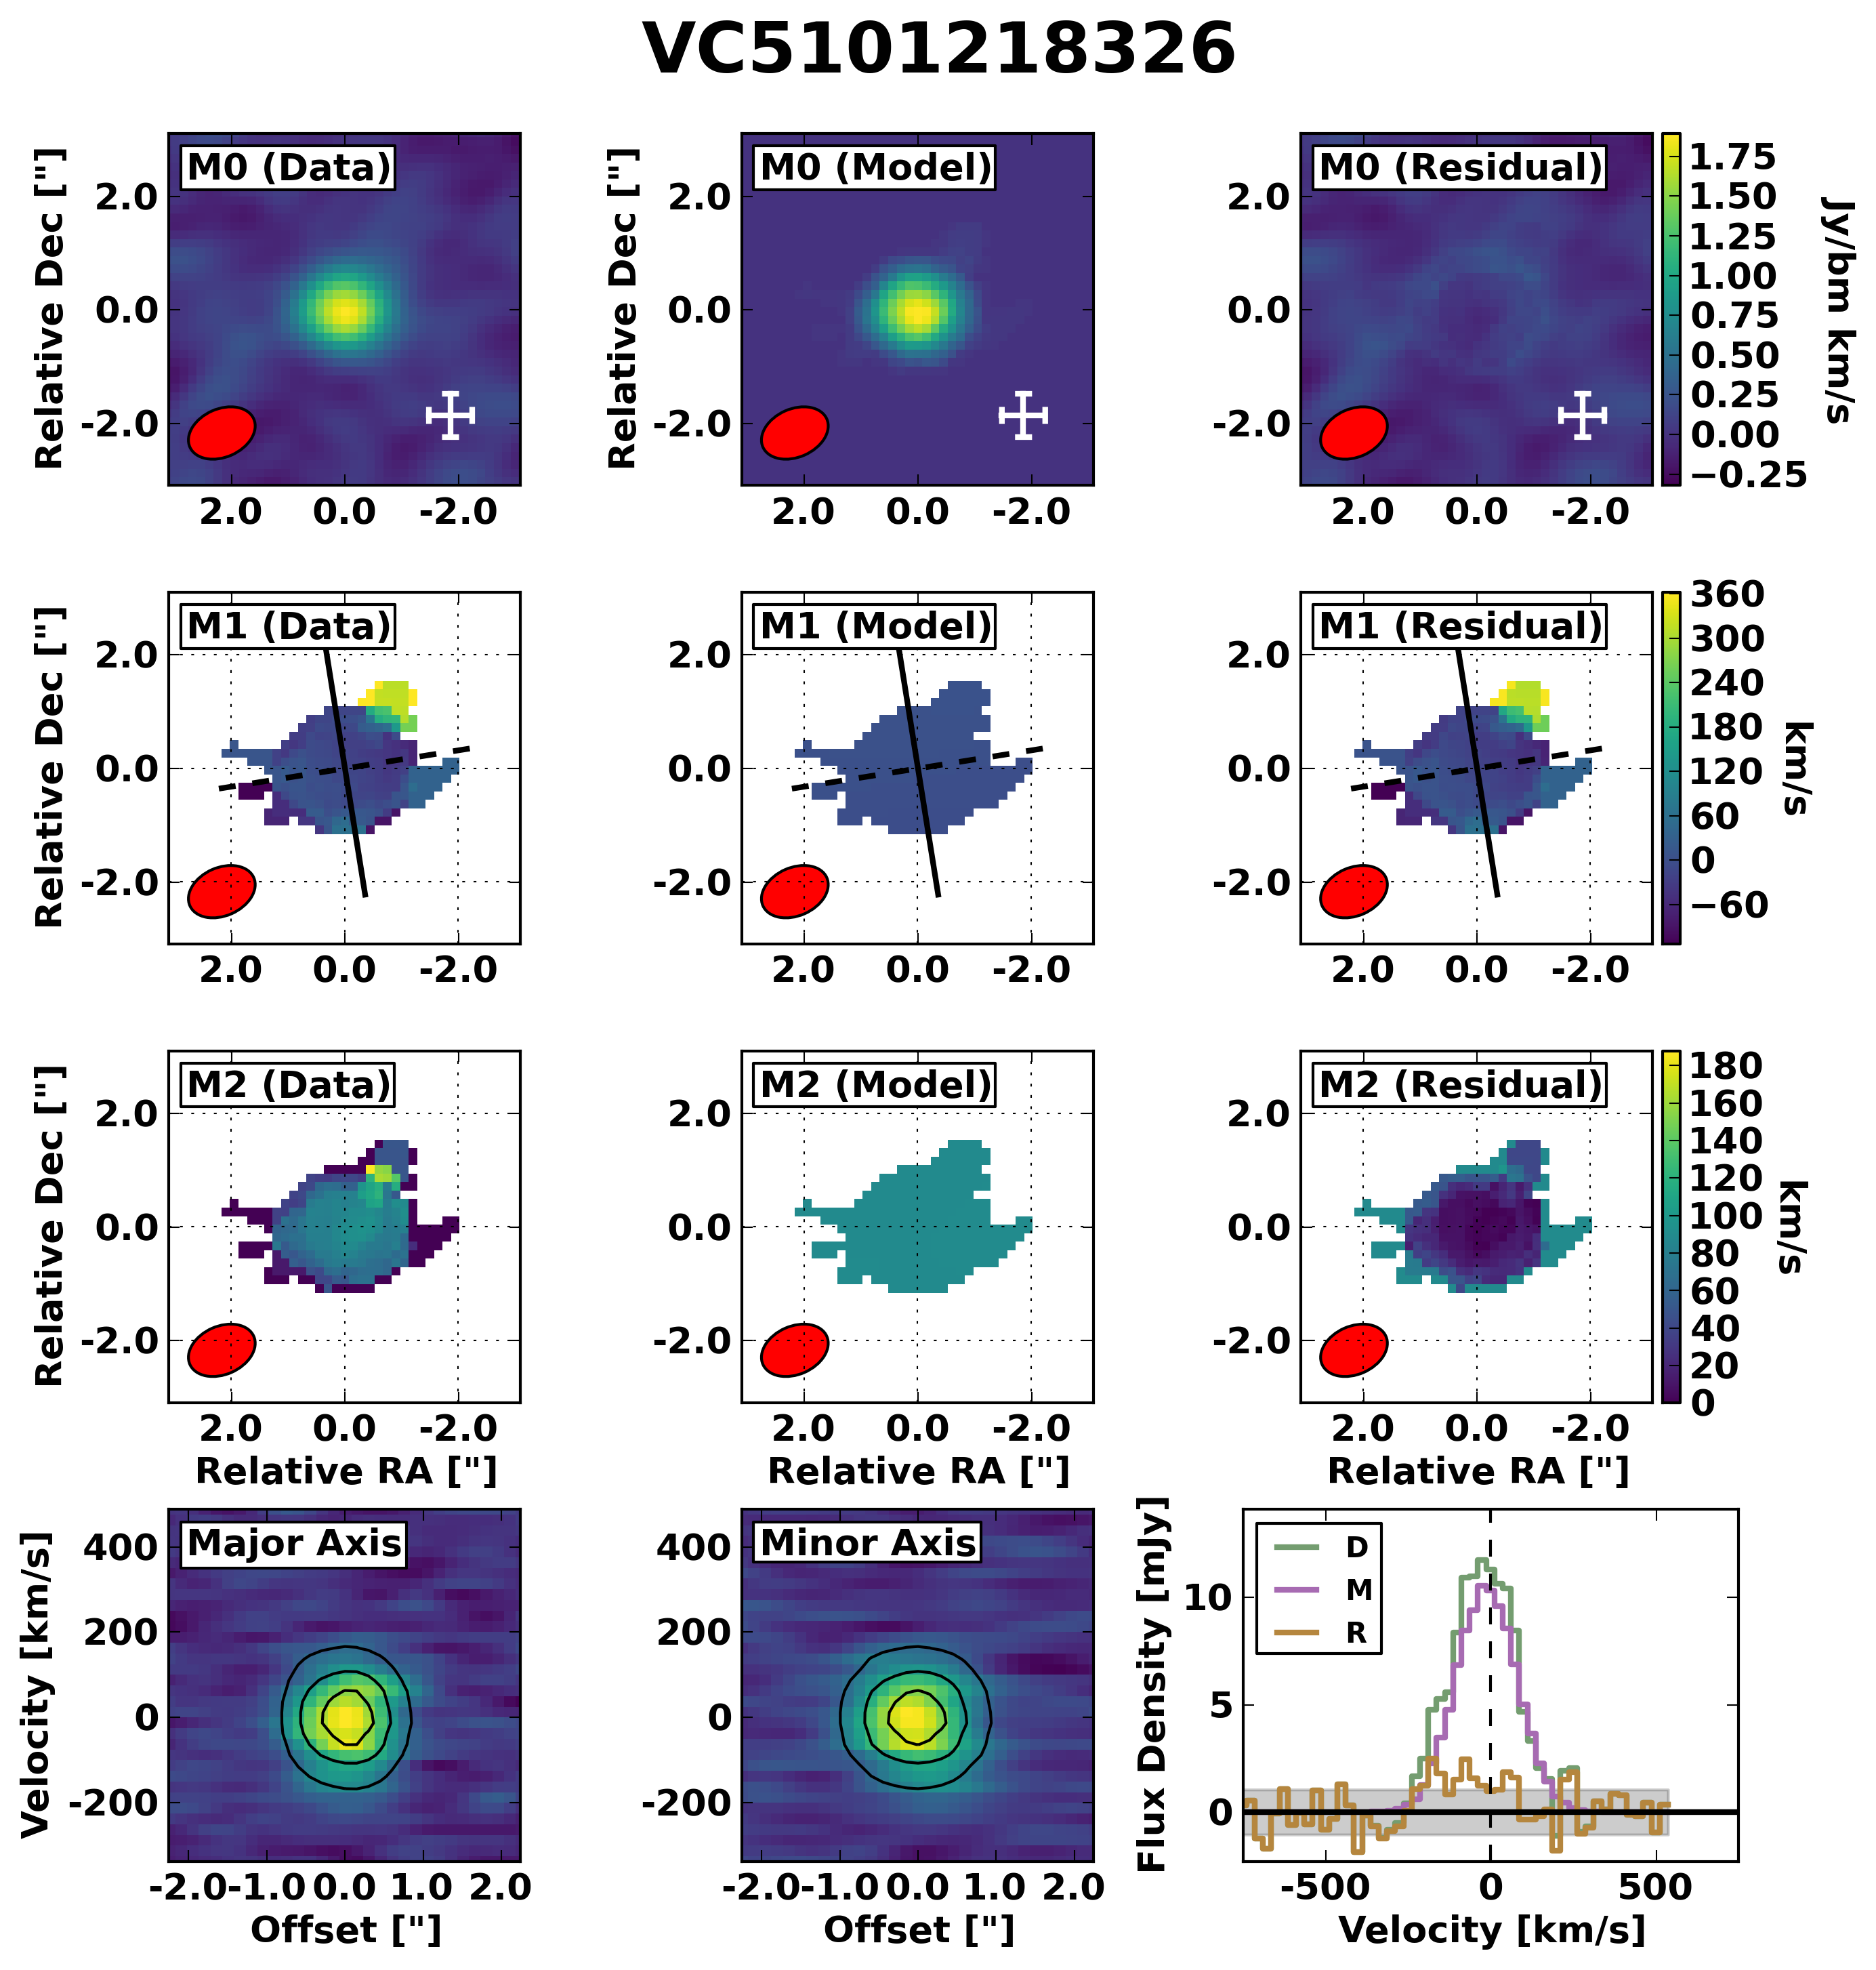
| VC5101218326 | 3 | DIS | ||||||||||
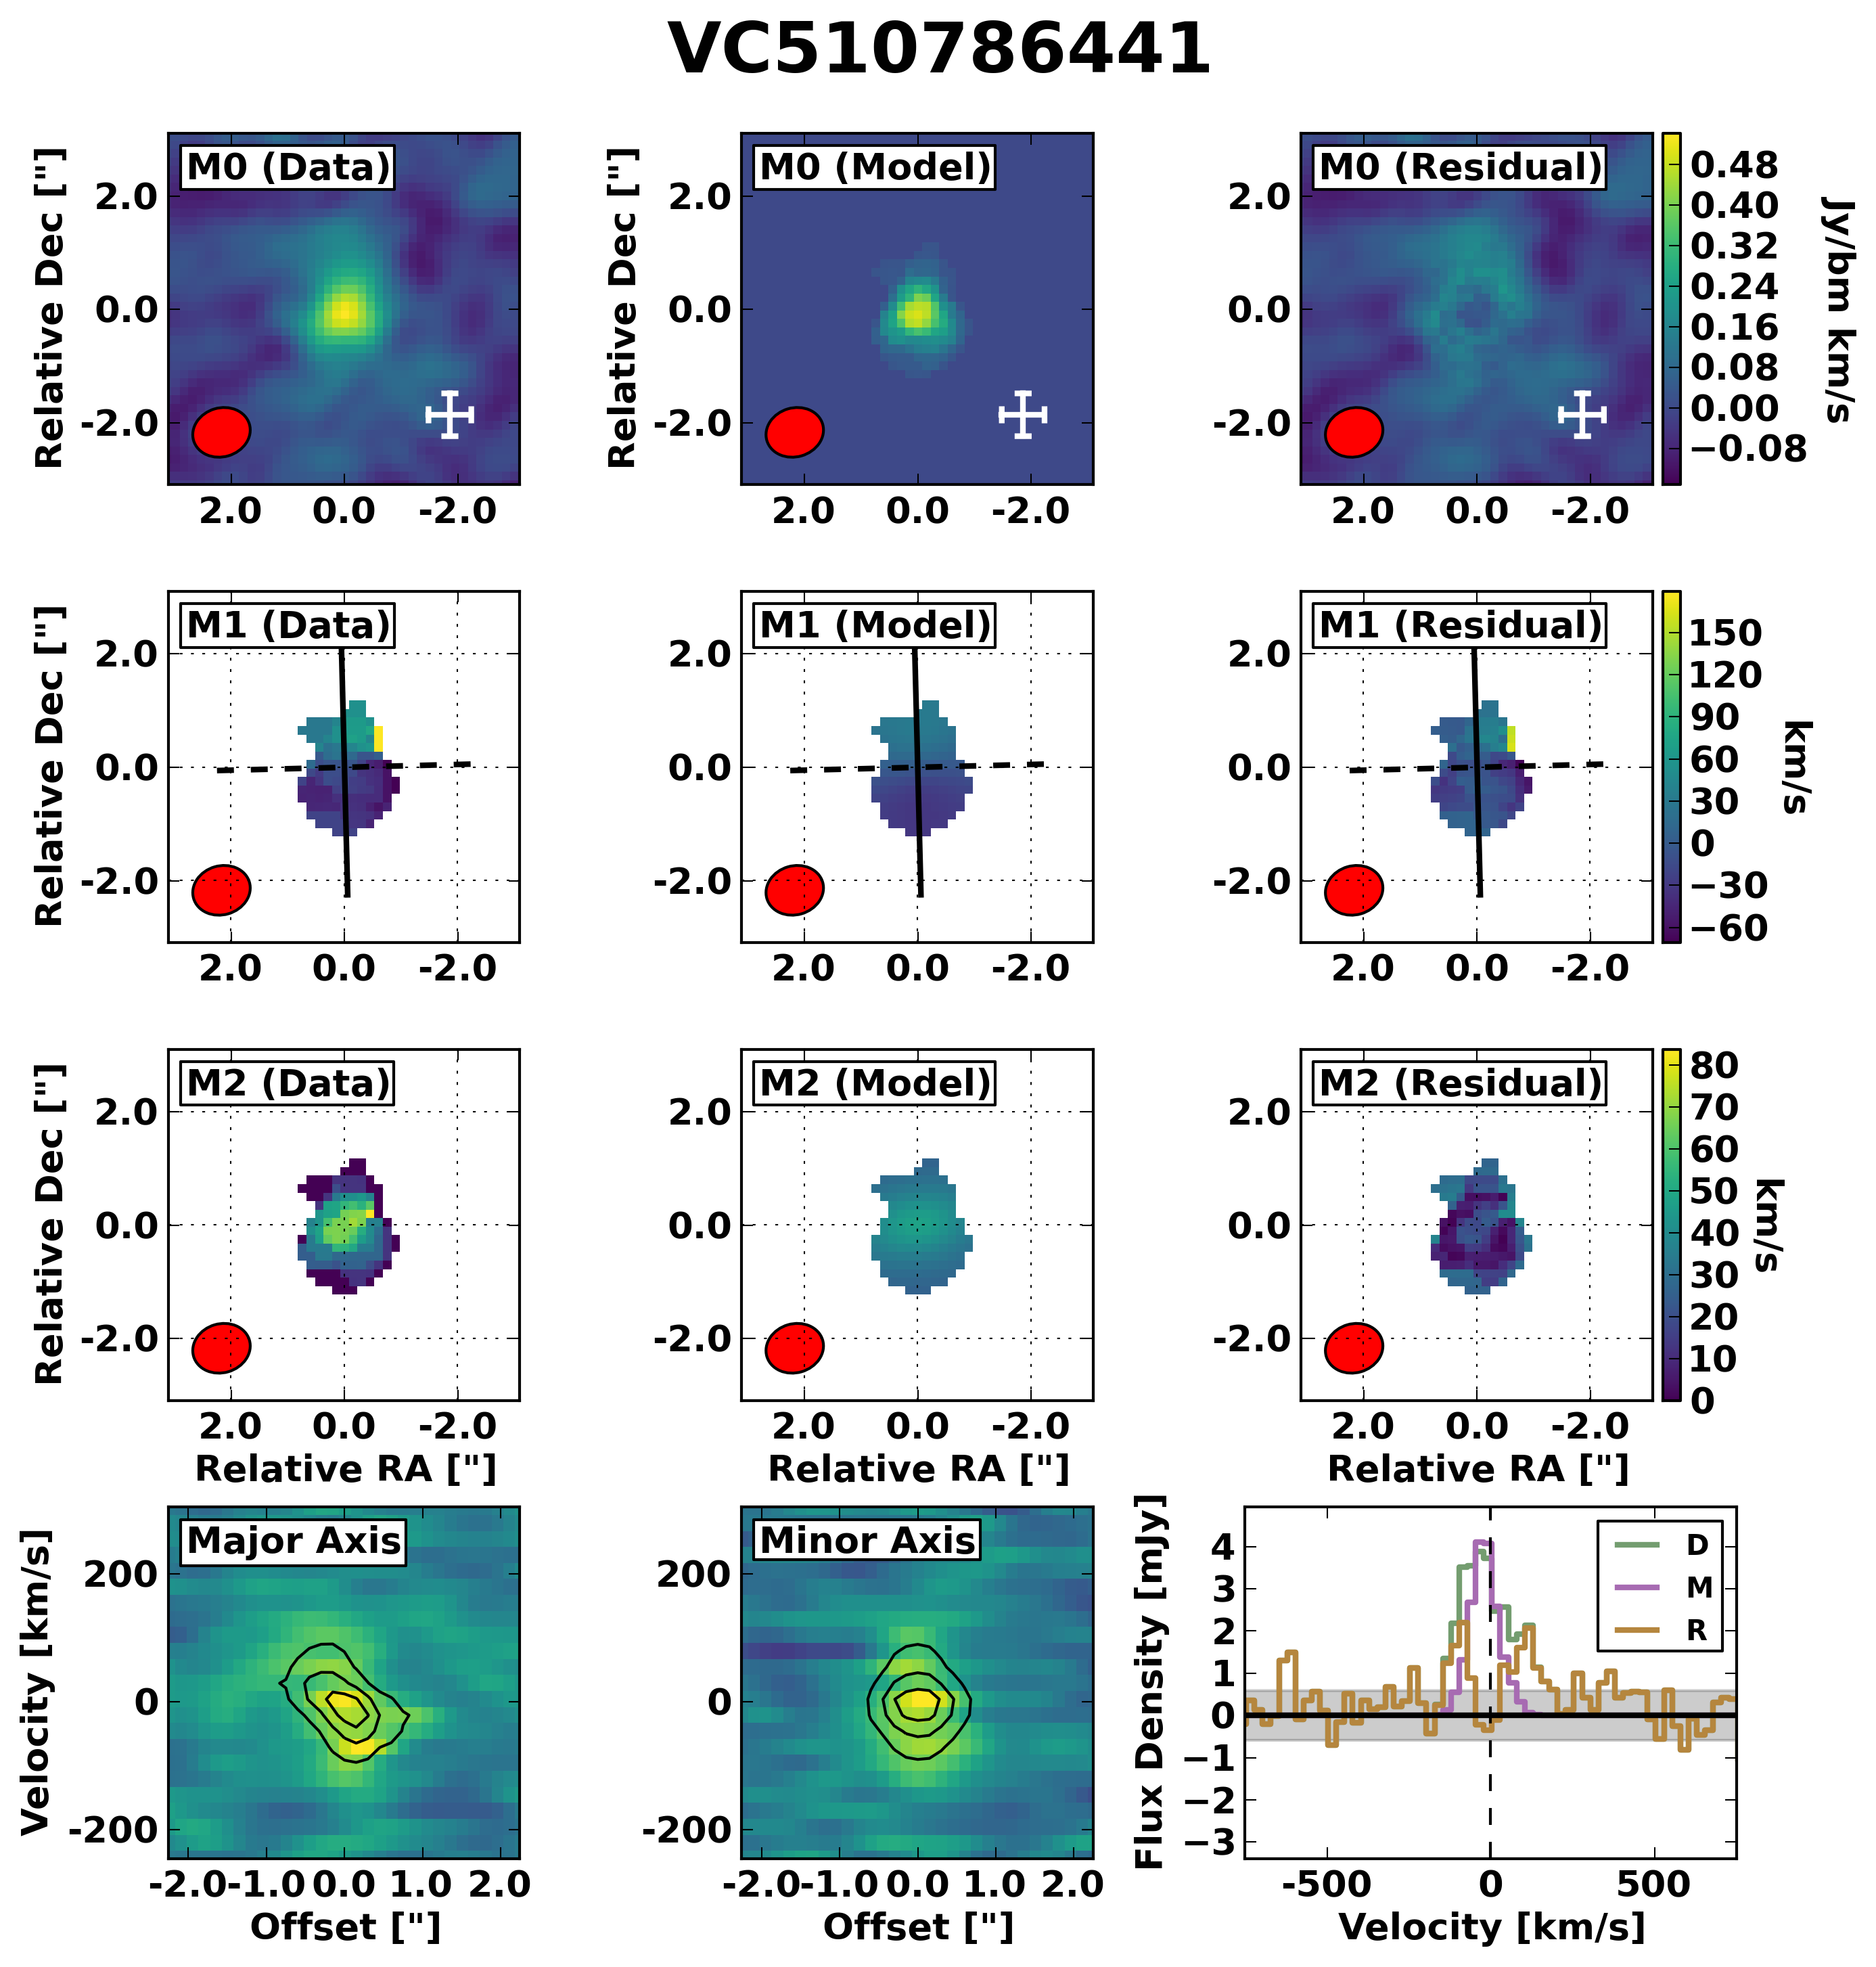
| VC510786441 | 2 | UNC | ||||||||||
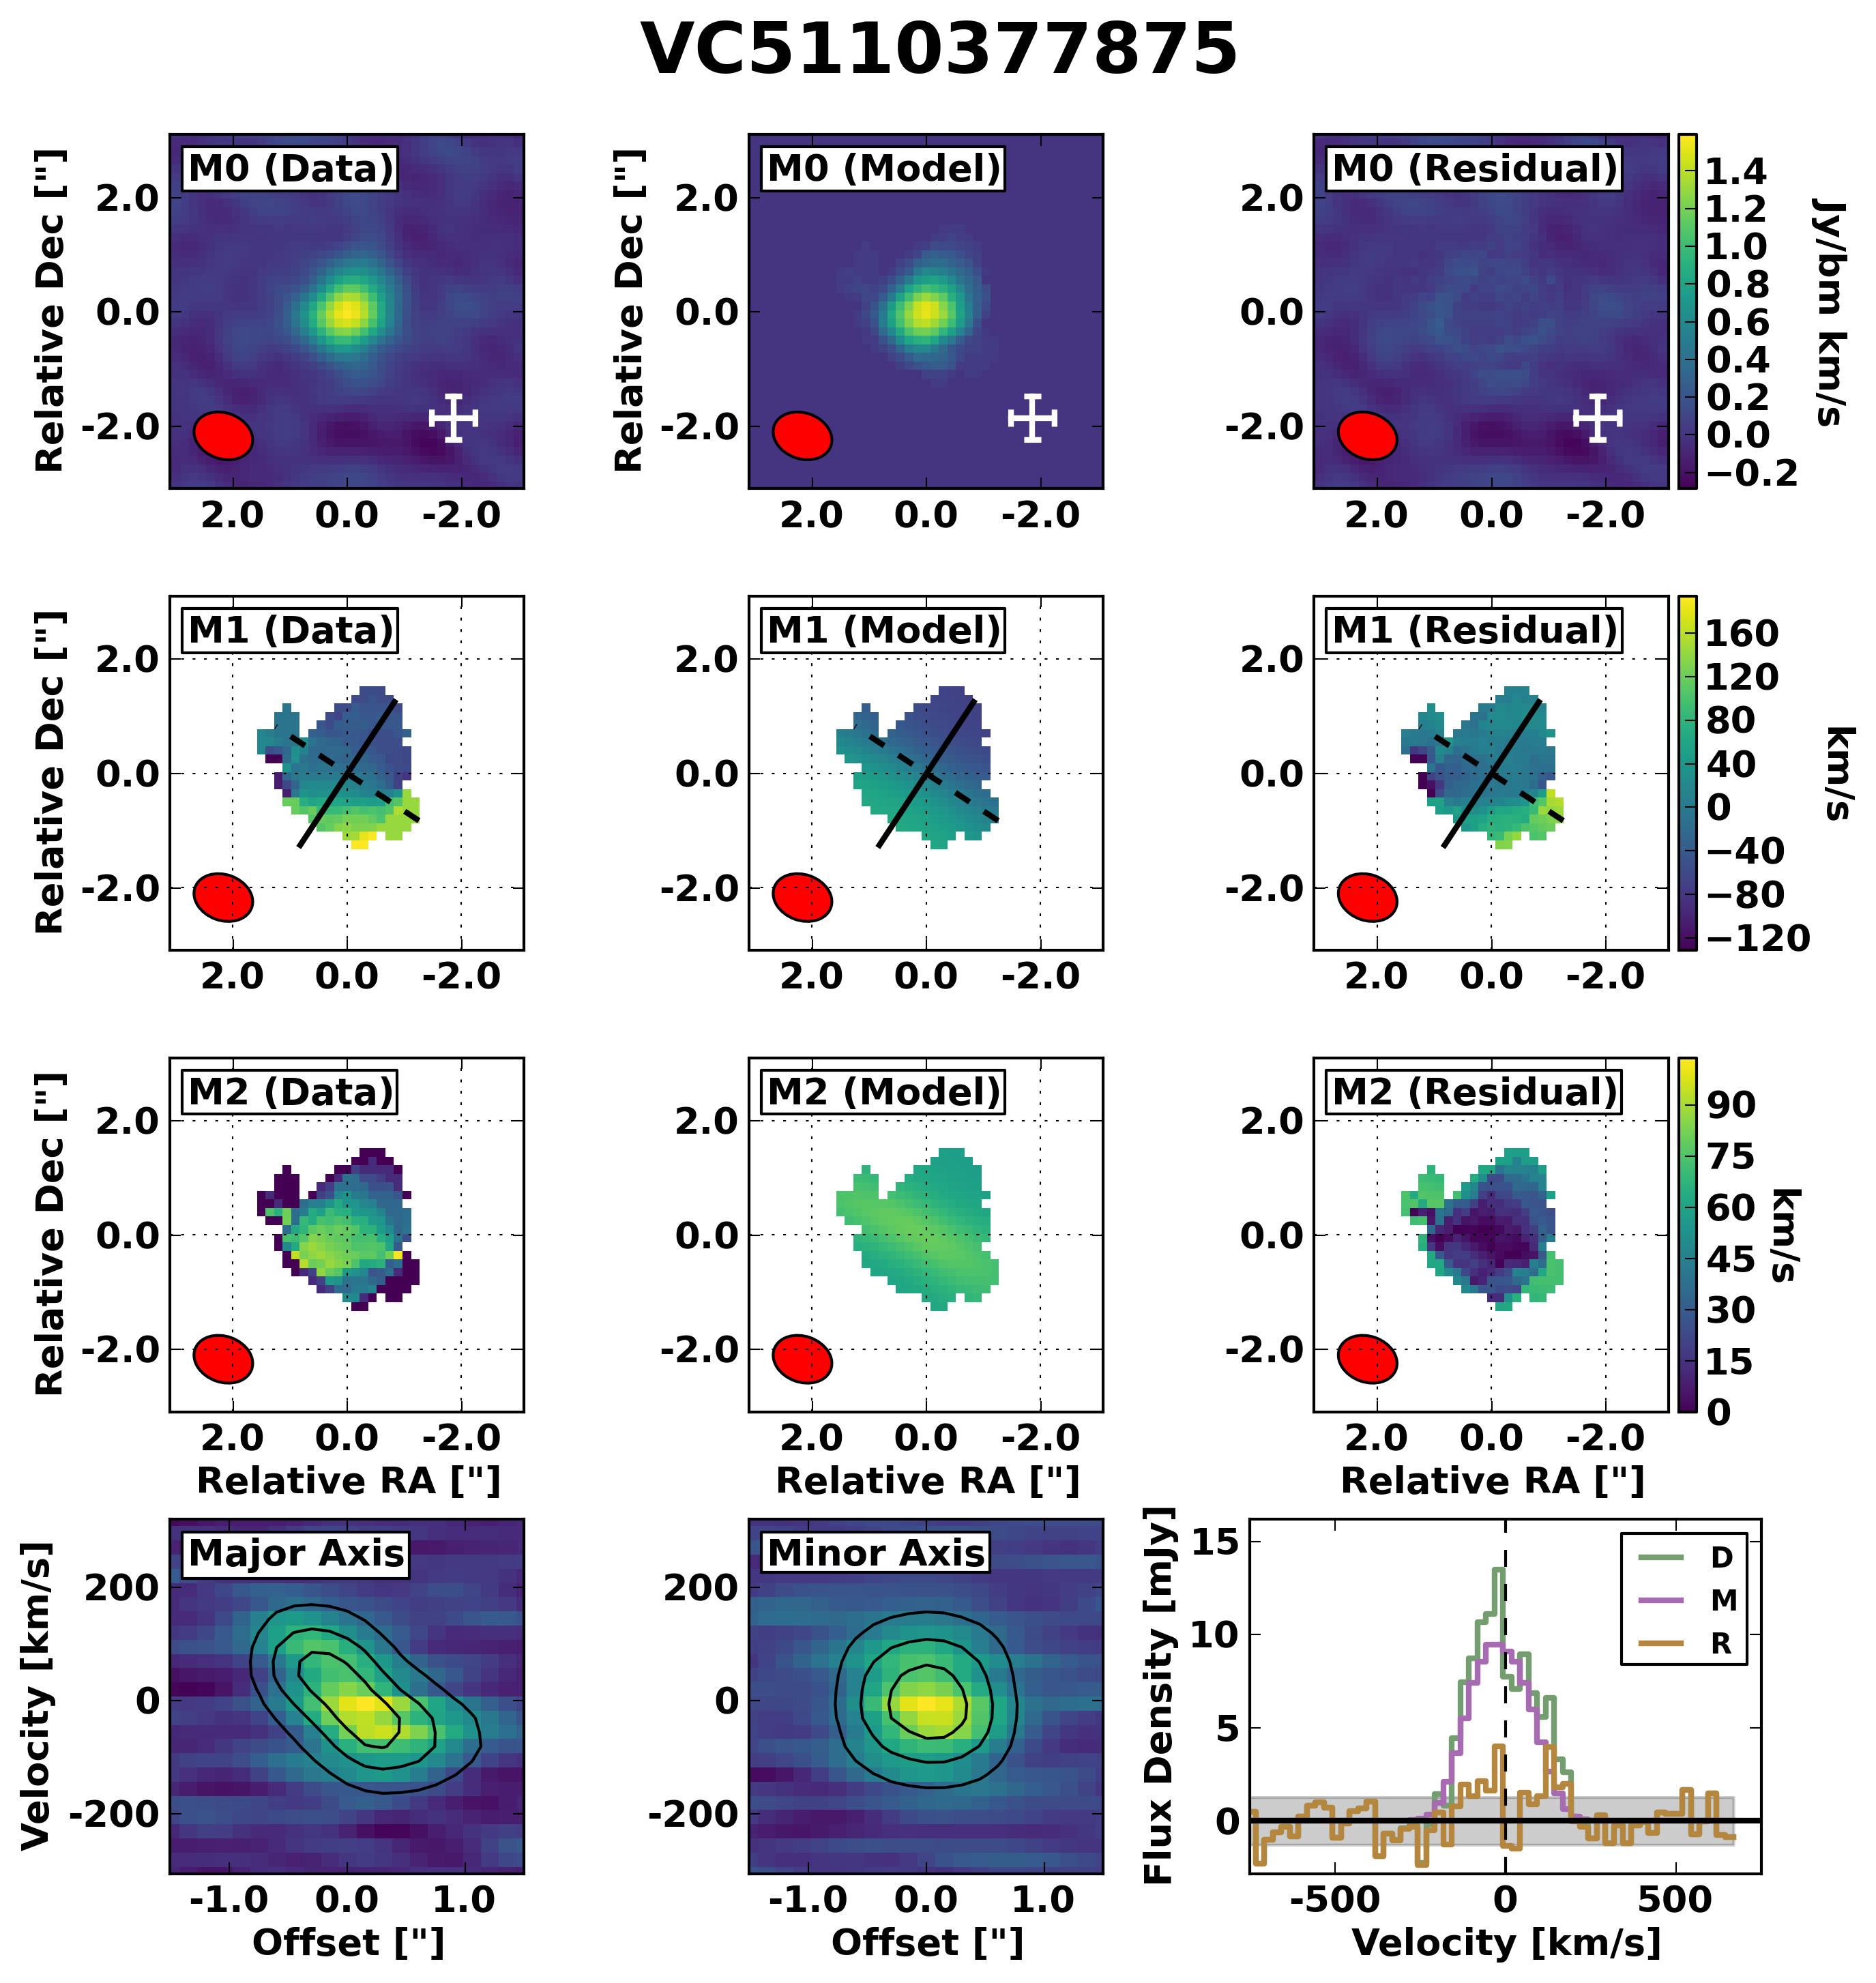
| VC5110377875 | 1 | ROT | ||||||||||
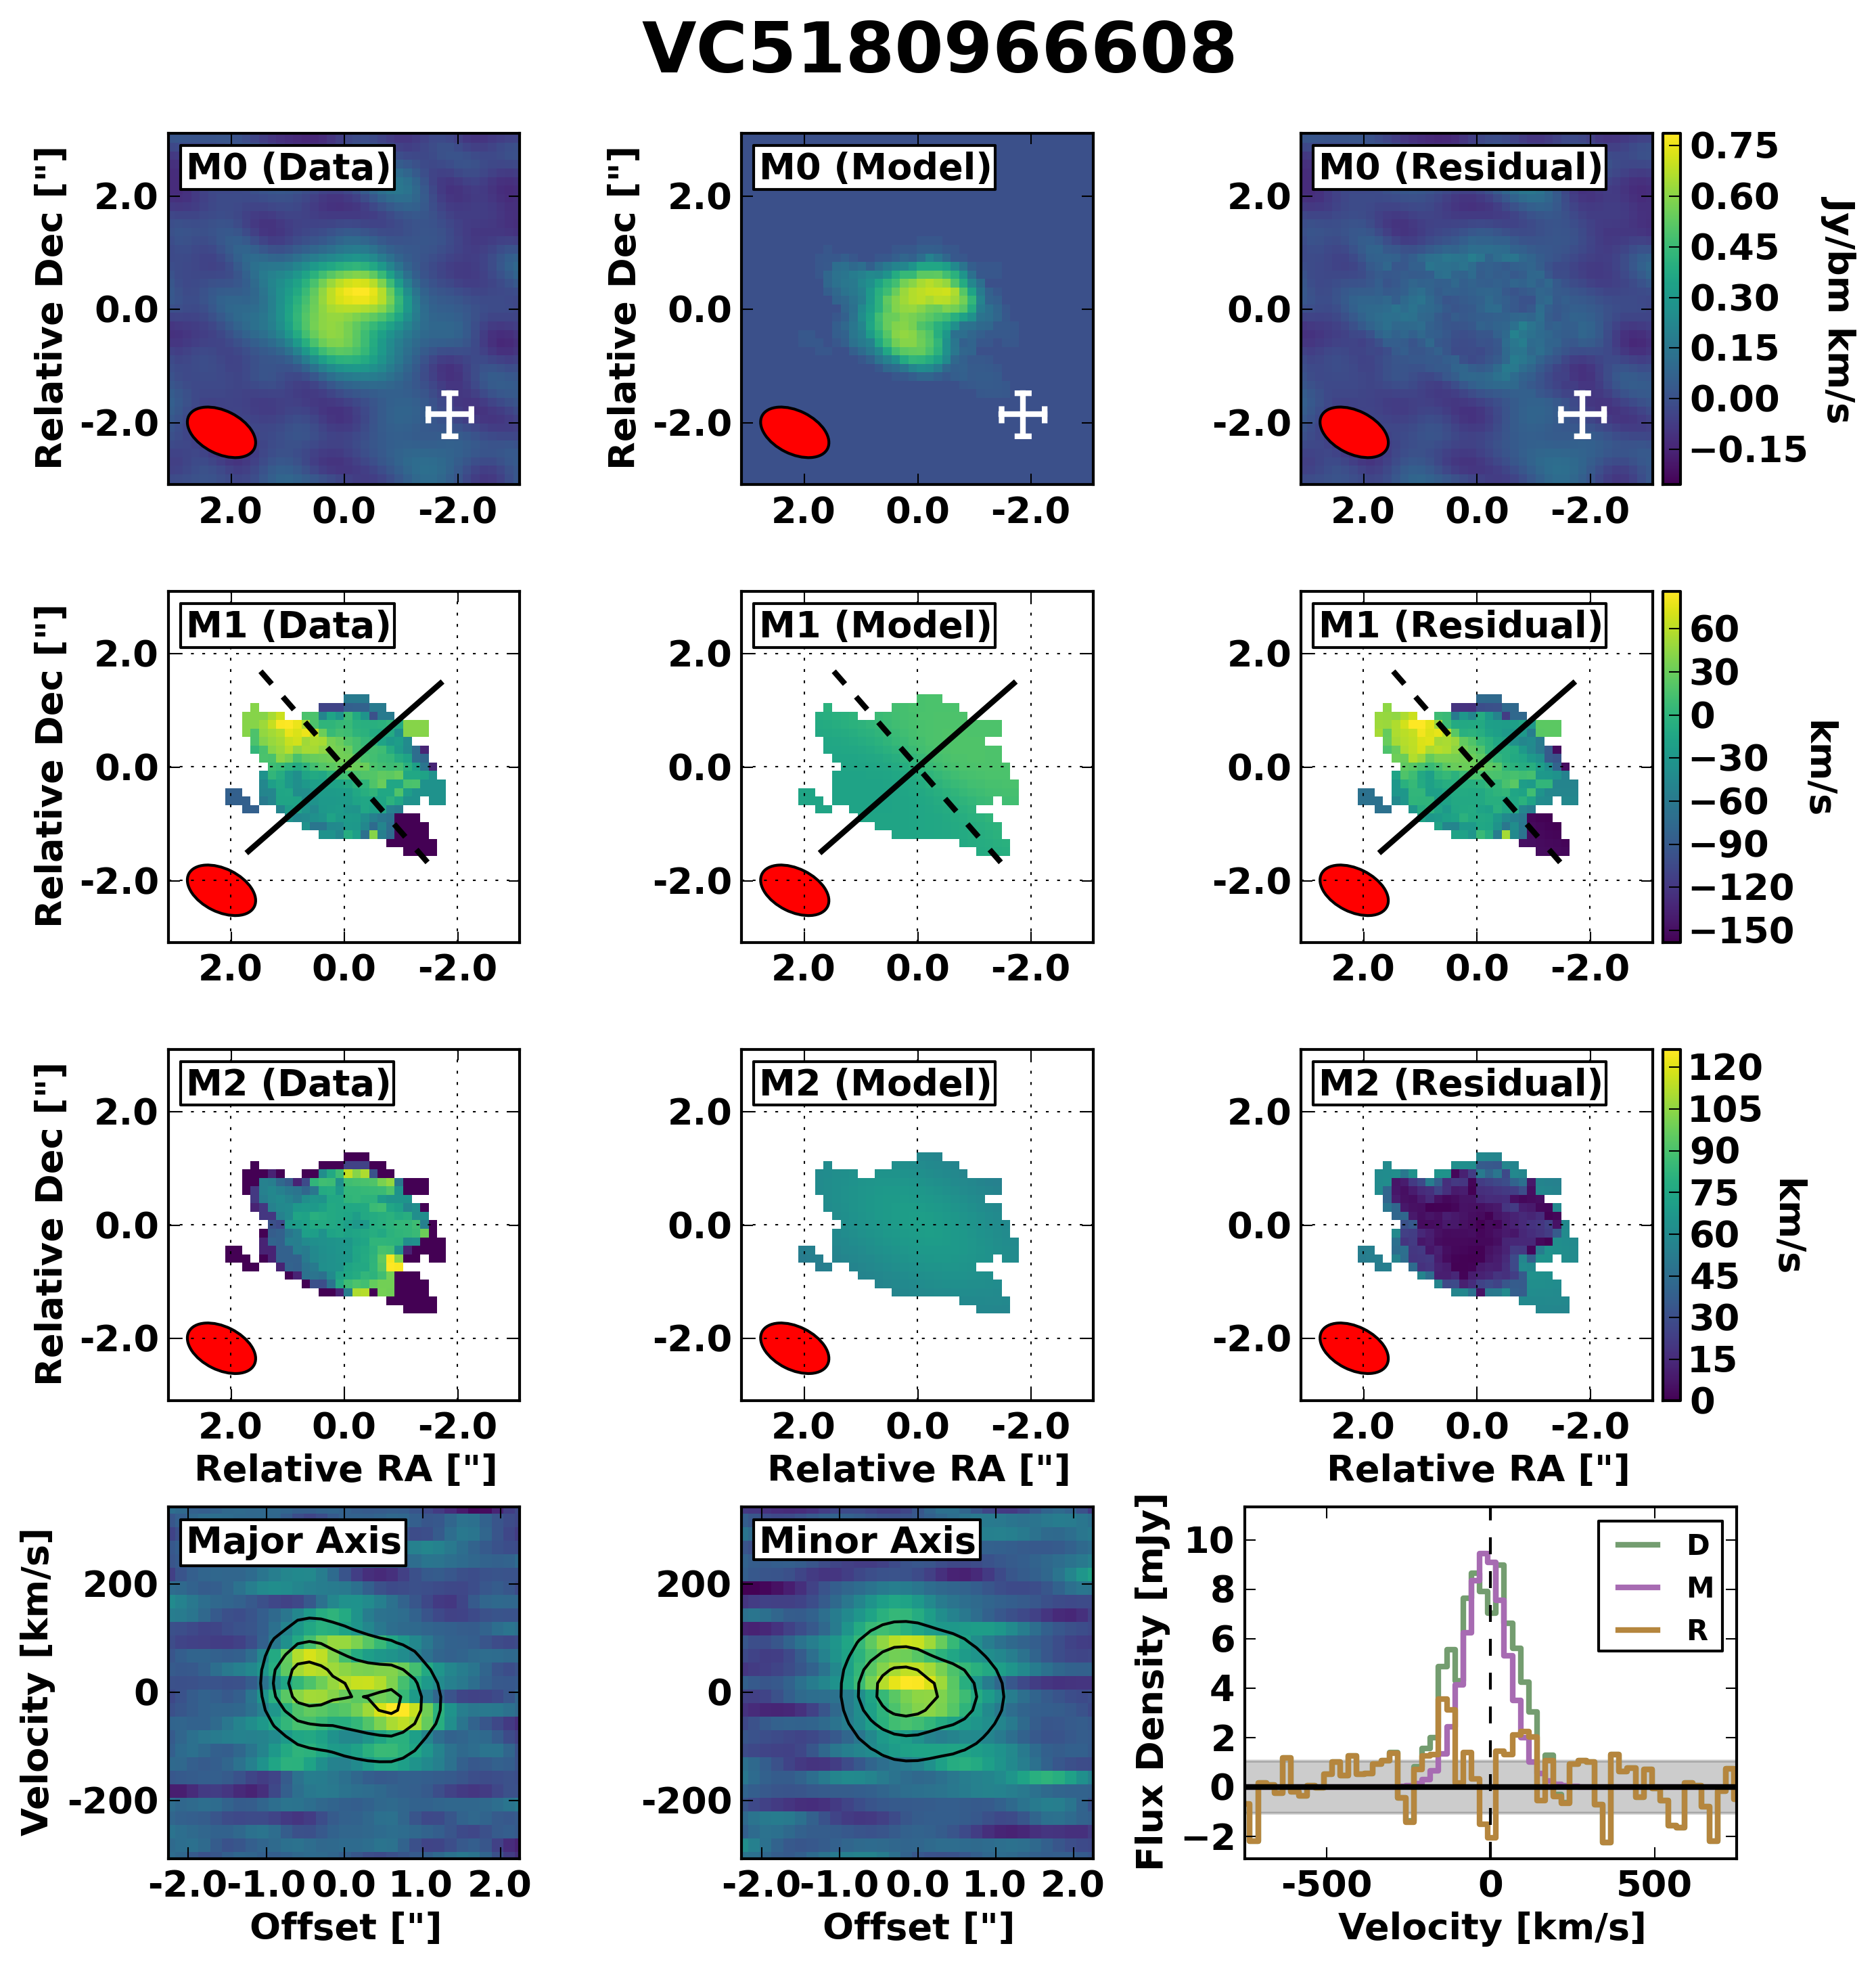
| VC5180966608 | 2 | UNC | ||||||||||
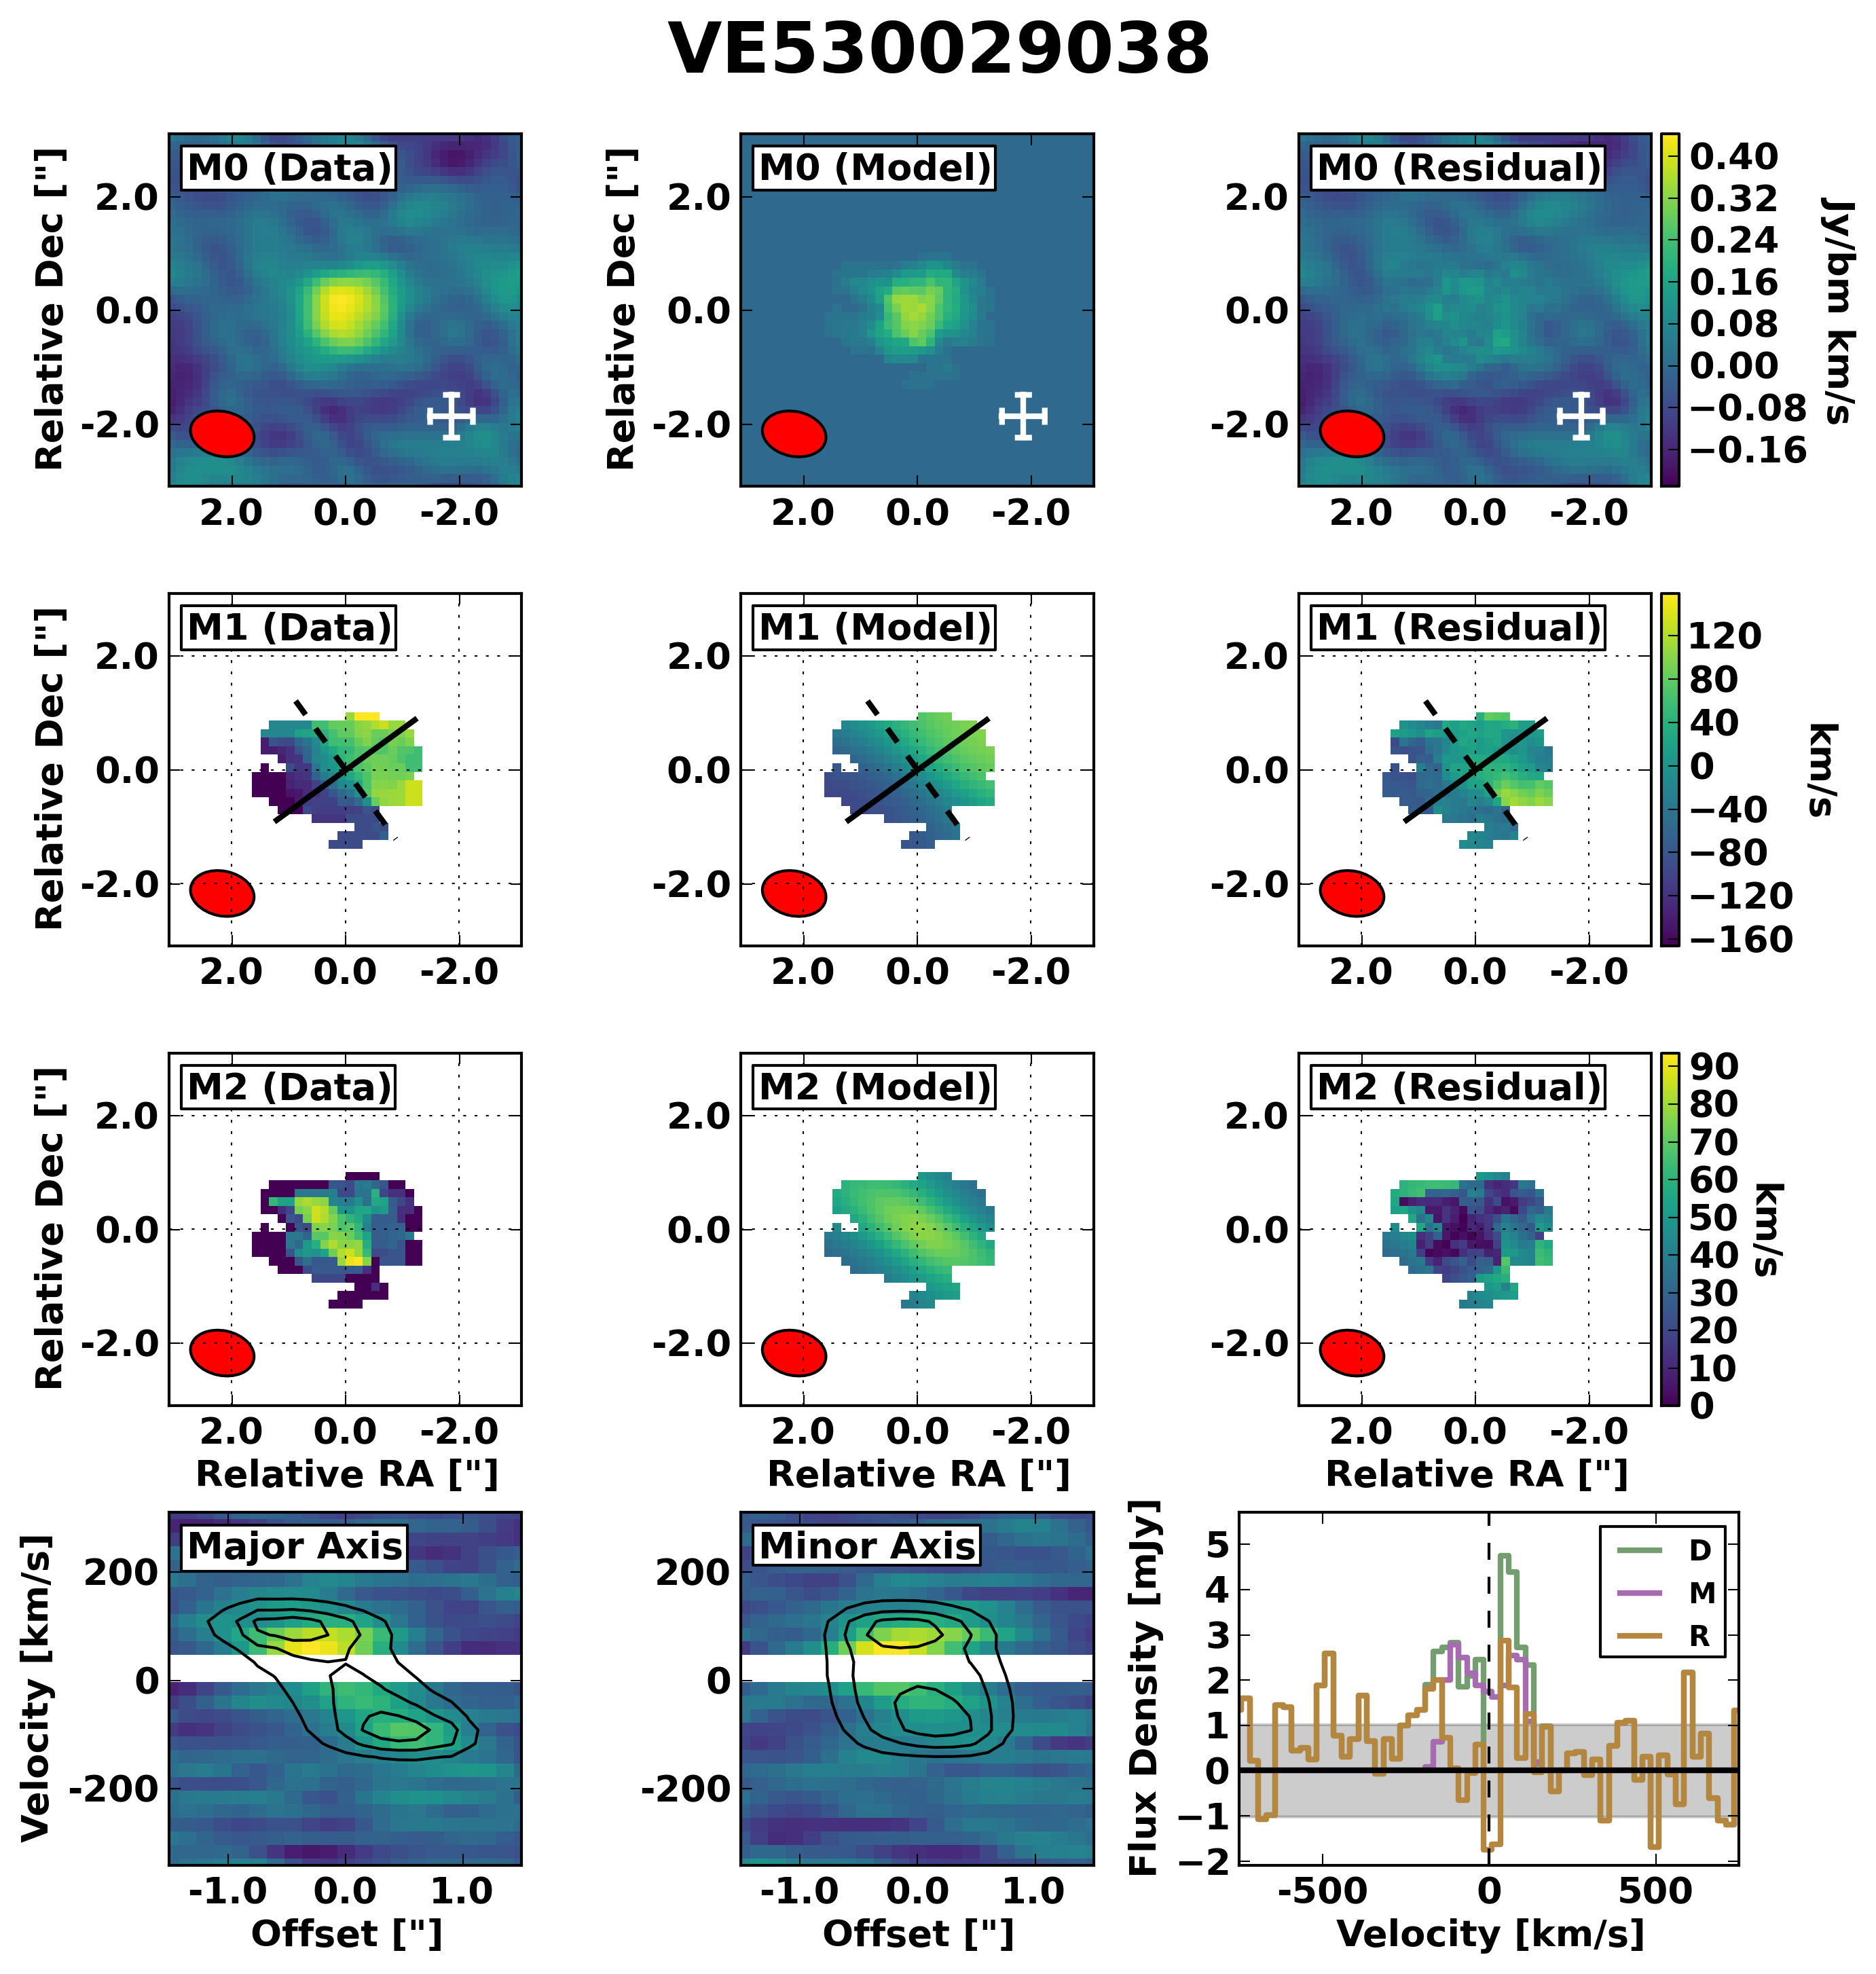
| VE530029038 | 1 | UNC | ||||||||||
| J0817, Low-Res | — | ROT | ||||||||||
| J0817, High-Res | — | ROT | ||||||||||
| HZ9 | — | ROT |
These figures show that the morpho-kinematic diversity noted by Le Fèvre et al. (2020) is indeed present. Some galaxies depict perfect velocity gradients and are well fitted with tilted ring models, while others show significant residuals, and others seem dispersion-dominated.
We apply 3DBarolo to each source with the intent of examining the residuals in each moment map, PVD, and the integrated spectrum, in order to refine the morpho-kinematic classification for the 40 ALPINE galaxies whose emission was identified though 3DBarolo SEARCH (see Section 3.1). That is, we do not pre-select rotators from the ALPINE sample before fitting the data with tilted ring models. Due to its optimization for low-SNR and low-resolution observations and large number of free parameters, it easily fits mergers and dispersion-dominated sources with rotating disk models. Because of this, the kinematic values presented in Table 1 and curves in Figure 2 should be interpreted with care. Only the results for galaxies that are robustly classified as rotators (see Section 5.3) are fully reliable.
3.3 Subsample Properties
The previous subsections have detailed the methods used to isolate [CII] line emission in the ALPINE data cubes and fit this signal with the tilted ring model fitting code 3DBarolo. Before proceeding, it is worth briefly discussing the features of our 29 3DBarolo-fit galaxies.
Our signal isolation and model fitting routine has successfully fit the majority of the bright [CII]-detected ALPINE sources. Of the 21 sources detected at SNR by Béthermin et al. (2020), we only exclude four sources due to weak (i.e., spectrally broad) and/or marginally resolved [CII] emission. While this does result in the exclusion of some strong but compact [CII] emitters, such as DC488399 (SNR) and DC630954 (SNR, Béthermin et al. 2020), we are exploring the three-dimensional (i.e., RA, Dec, velocity) distribution of [CII] emission in these galaxies, and so resolved data are required.
To further examine the subset of ALPINE sources studied in this work, we compare their location on the SFR-M∗ plane (see top panel of Figure 3, blue squares) to the ALPINE sources excluded by this analysis but detected by the line search algorithm of Béthermin et al. (2020) (green diamonds), and the [CII]-undetected sources (red circles). Note that the ALPINE sample was chosen to contain SFGs, so the vast majority of these sources are within the scatter of the main sequence relation. This plot shows that the subset fit here contains massive systems (i.e., M M⊙) that exhibit a wide range of SFR, including a few sources above and below the star-forming main sequence.
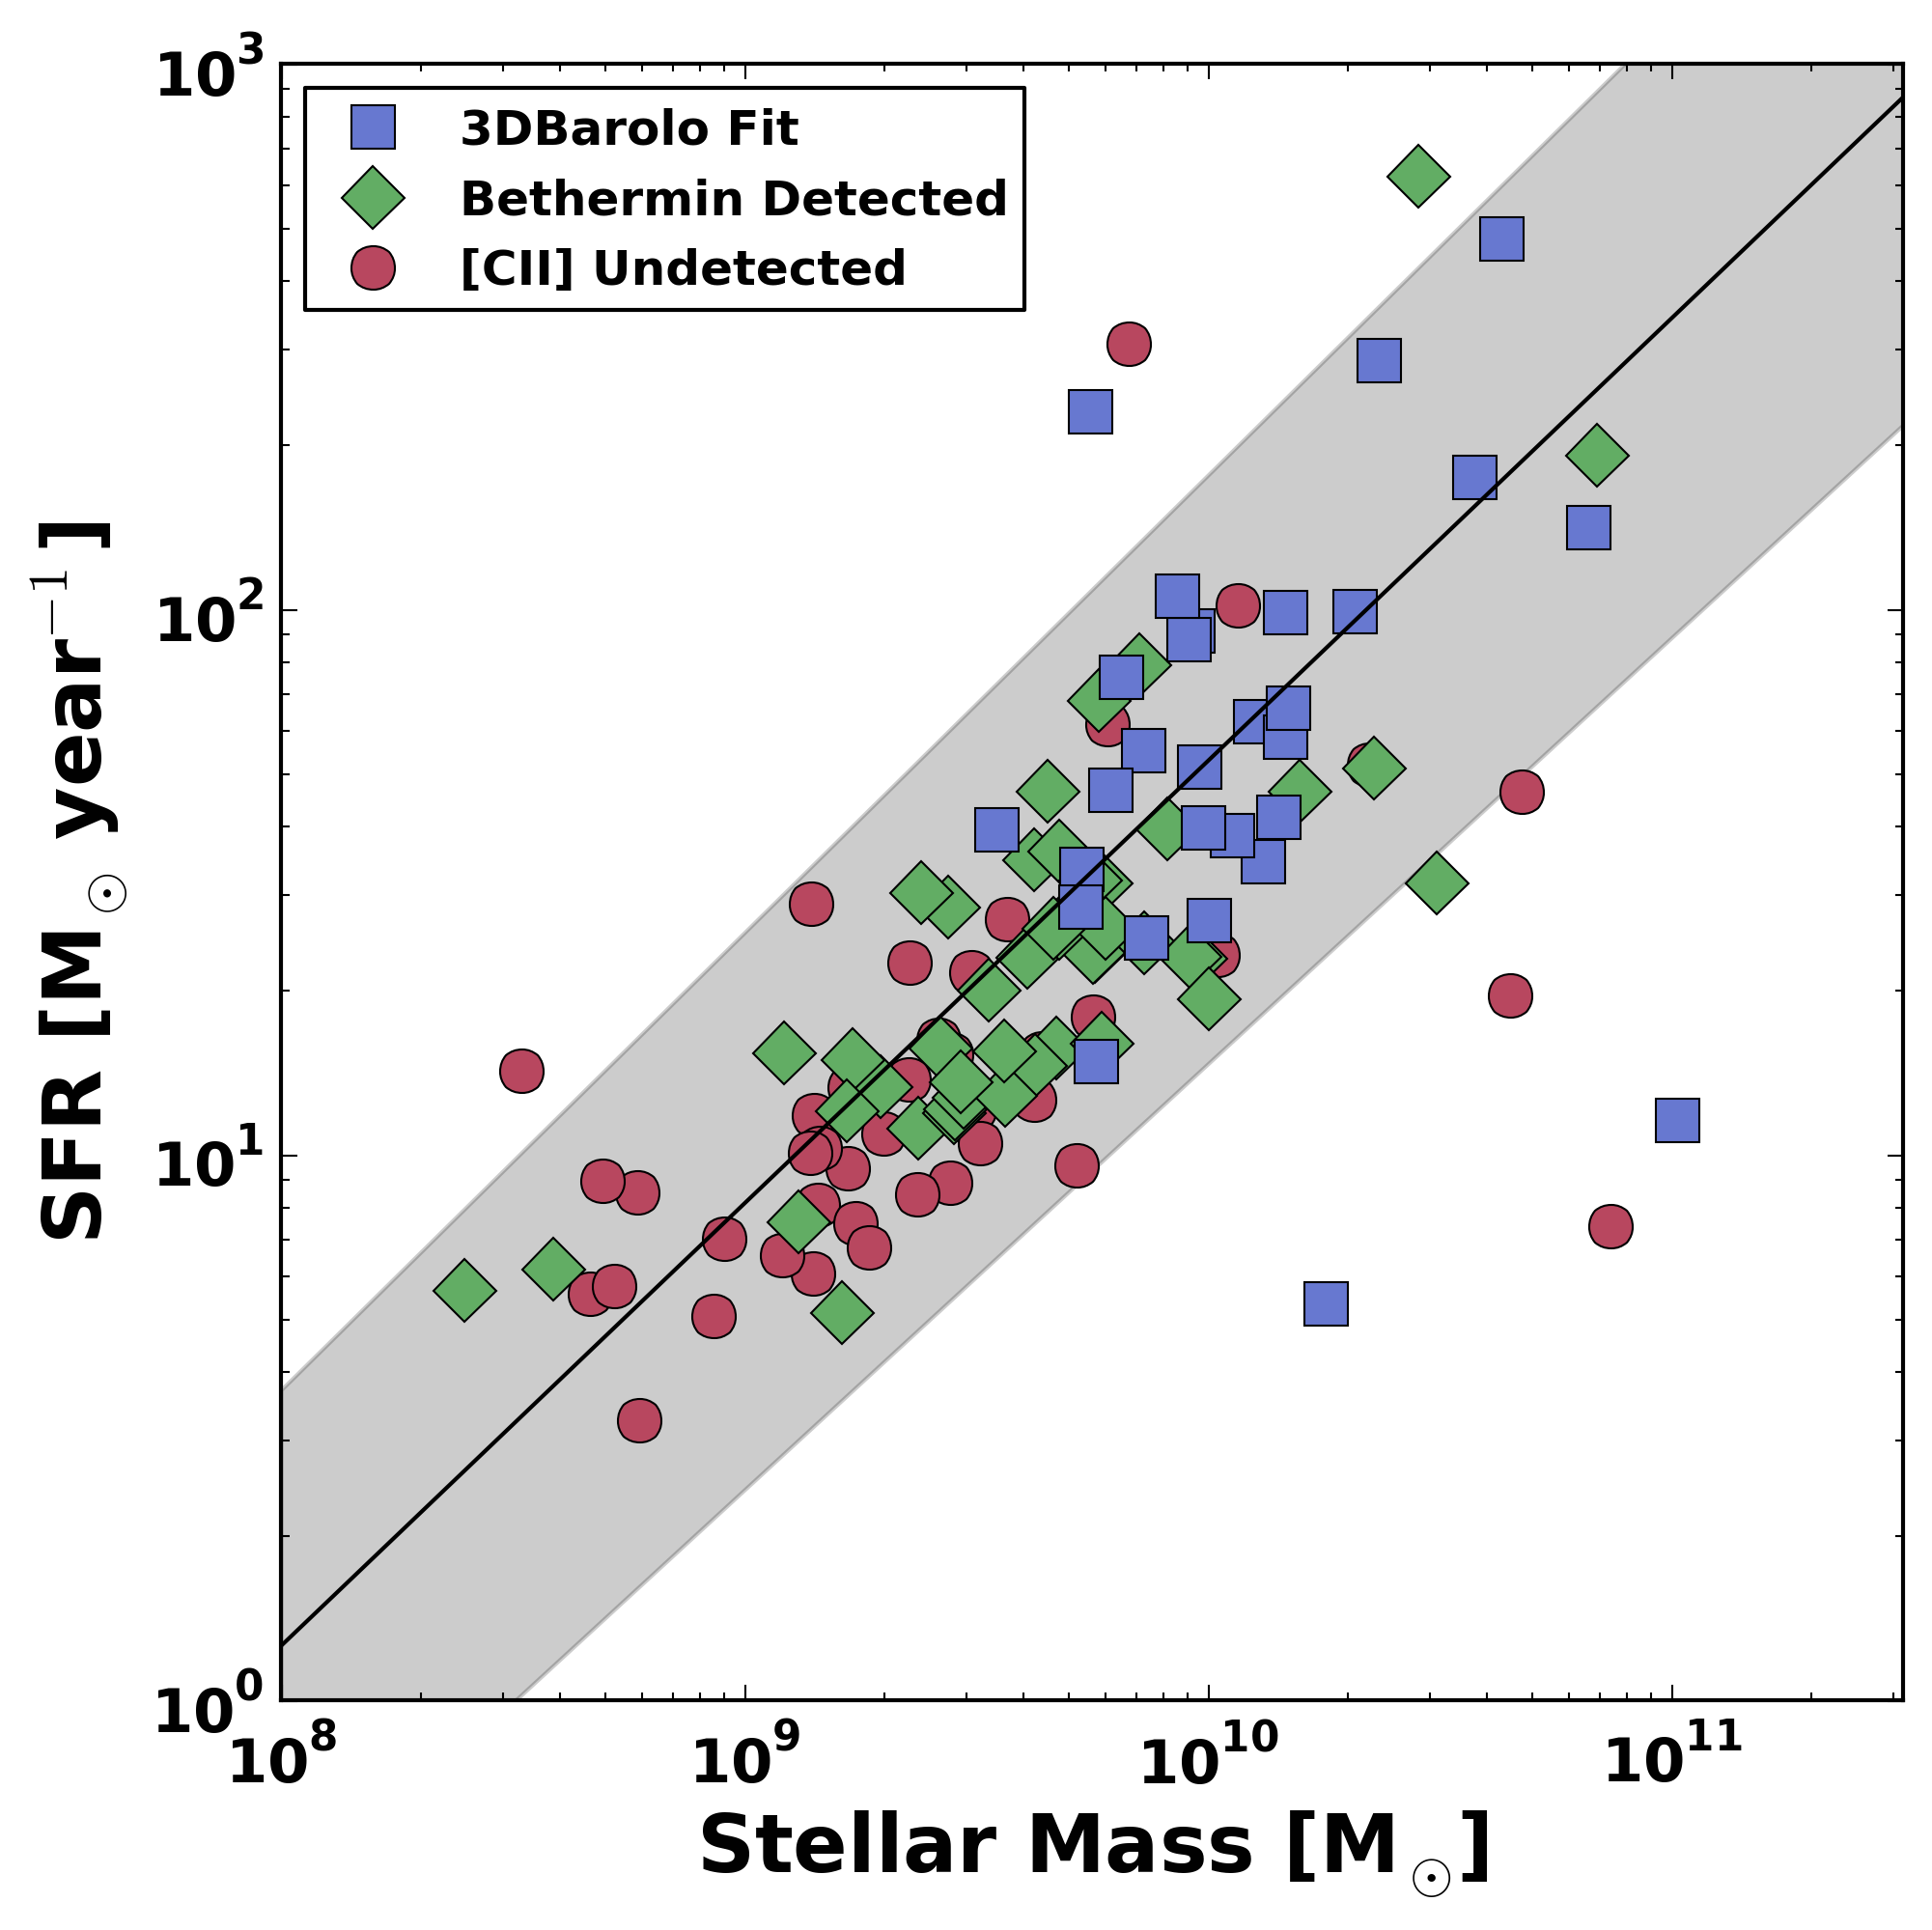
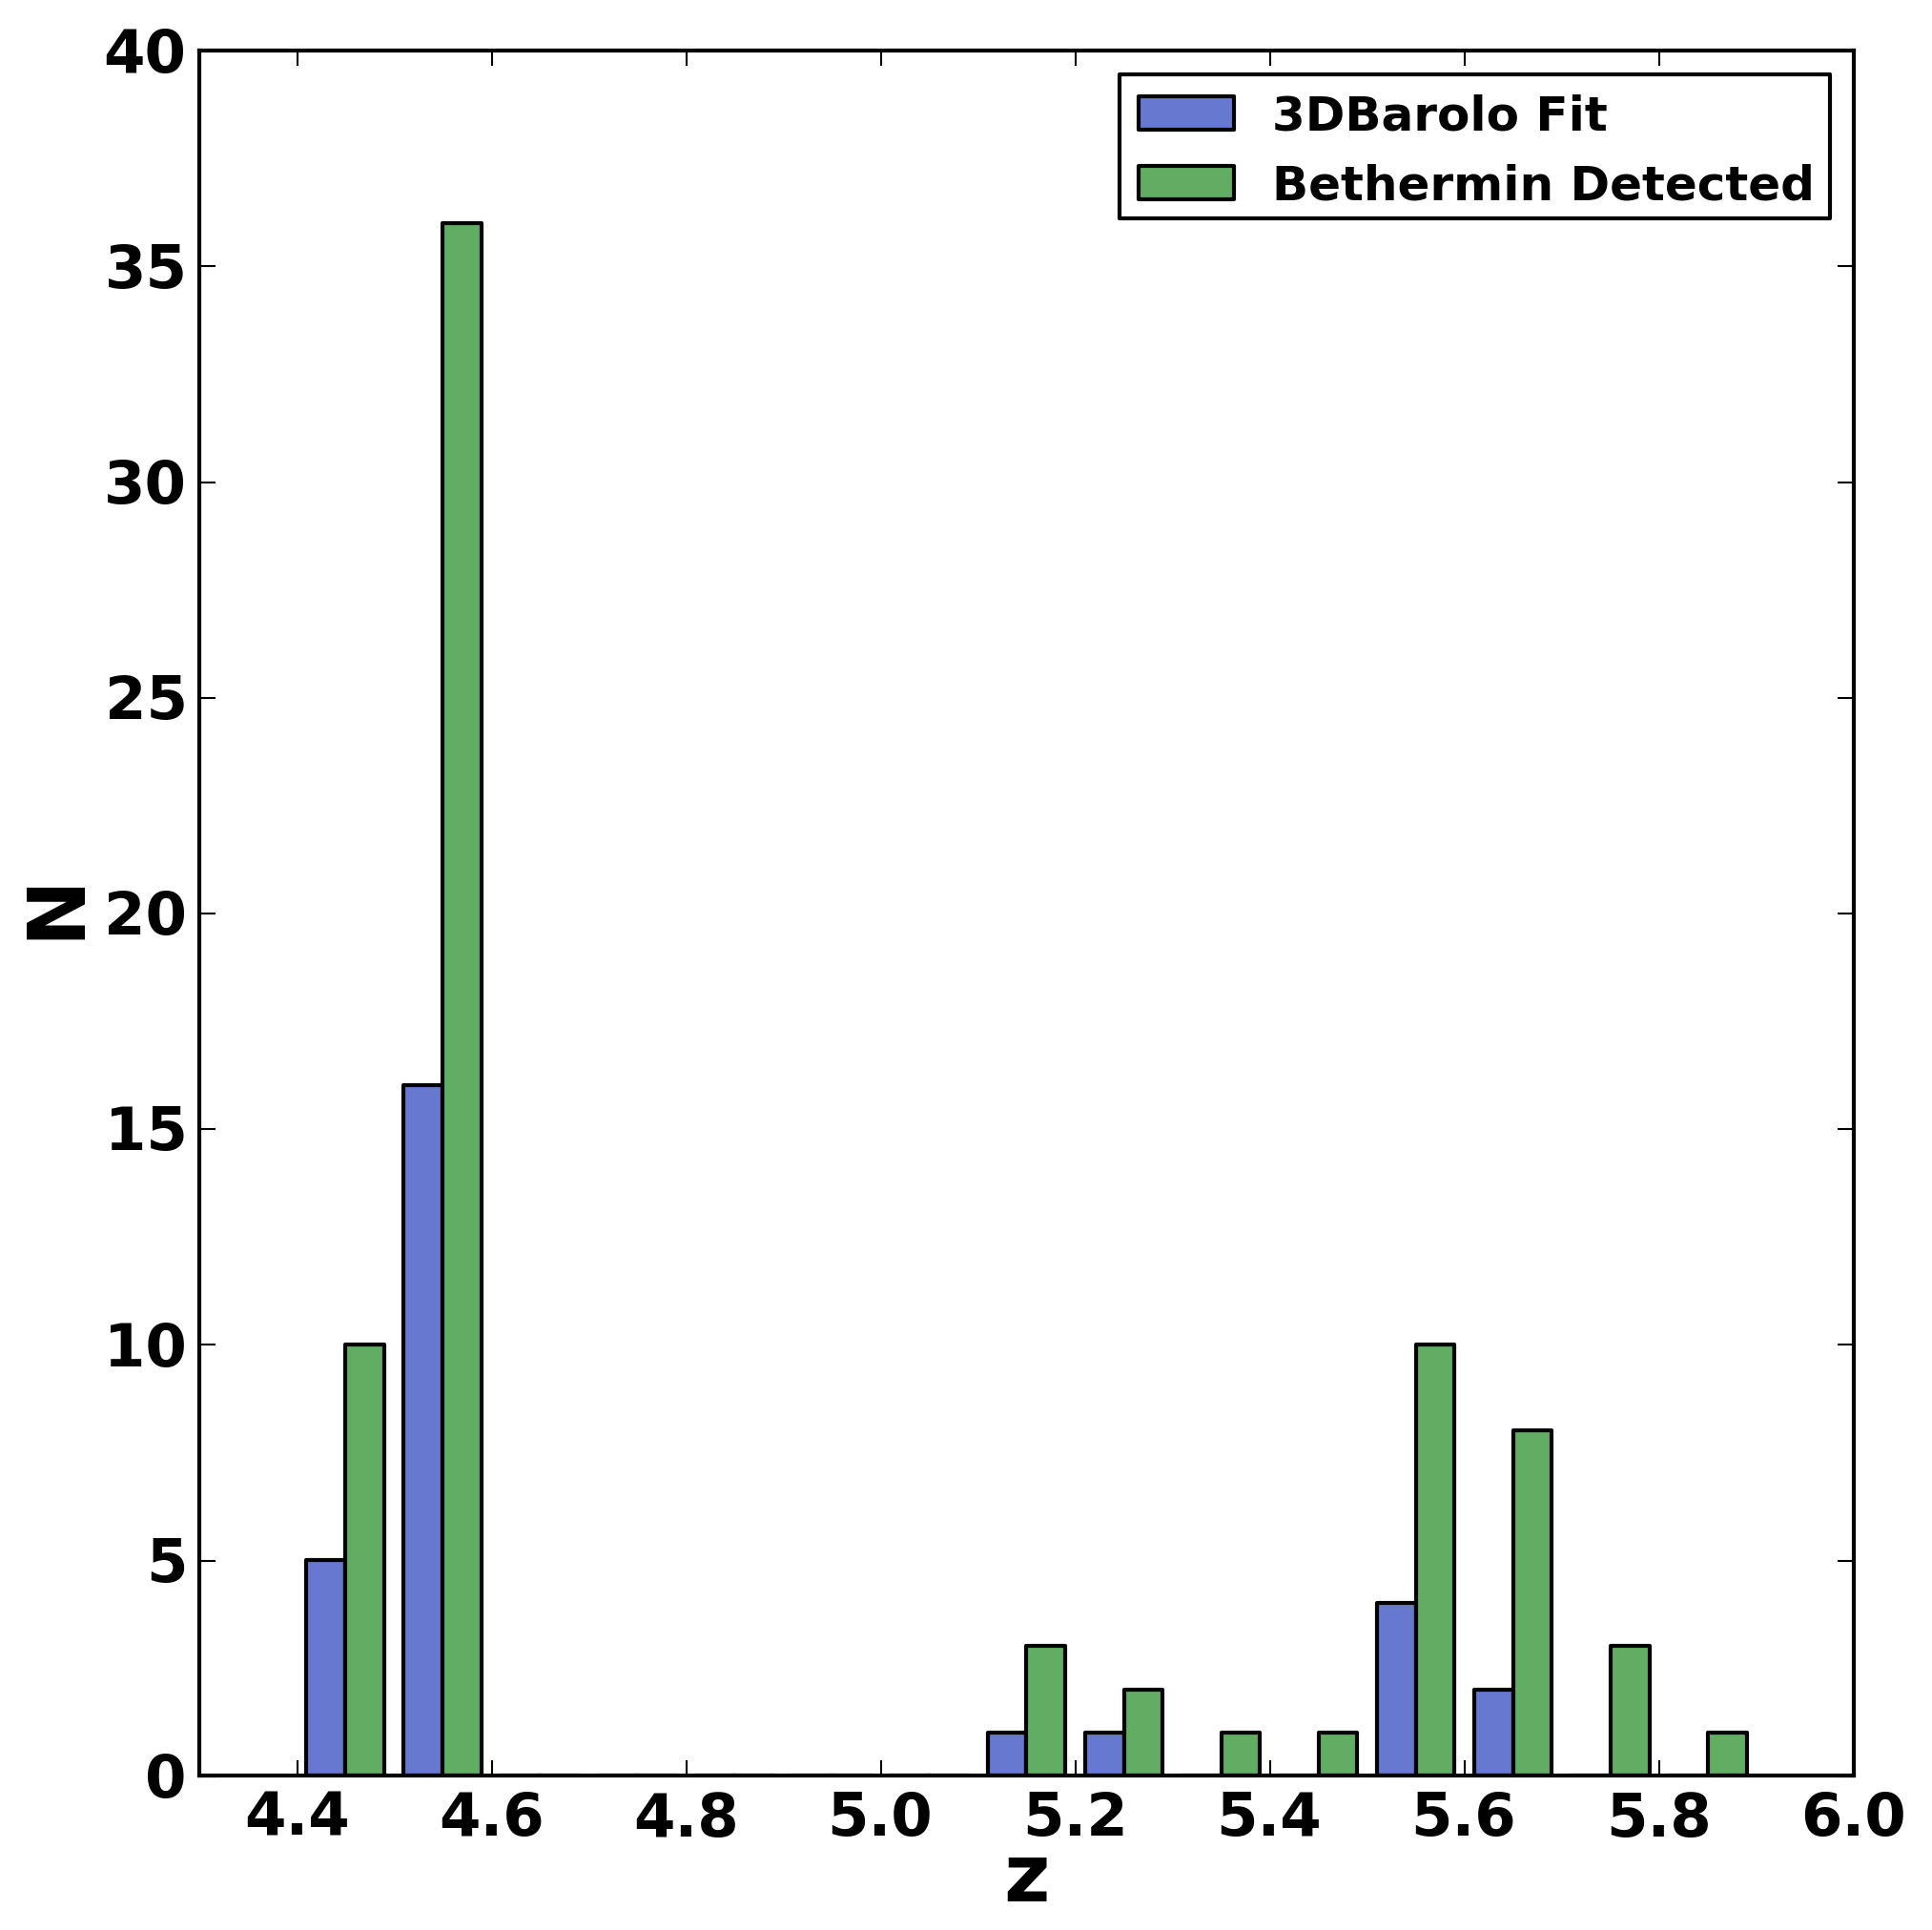
We may also examine the redshift distribution of the 3DBarolo-fit galaxies compared to the 75 [CII]-detected ALPINE sources (Béthermin et al., 2020) (see bottom panel of Figure 3). While each redshift bin contains as many [CII]-detected sources as 3DBarolo-fit sources, we can see that the 3DBarolo-fit galaxies cover nearly the same redshift range as the full sample. Thus, our sample of 29 3DBarolo- fit ALPINE galaxies contains massive SFGs at a range of SFR/M∗ and redshifts.
4 Additional Classification Methods
Thus far, we have presented the best-fit tilted ring models for a subset of the ALPINE sample. To further examine the morpho-kinematics of these sources, we apply two objective, quantitative classification methods tested at to the sample: the Gini-M20 method of Lotz et al. (2004) and the five disk-like criteria of Wisnioski et al. (2015). Each of these methods has not been applied to rest-frame FIR and [CII]158 m observations of SFGs, so this Section represents an investigation of their applicability to our data.
4.1 Gini - M20 Analysis
First, we test whether the ALPINE sample may be classified based solely on its observed morphology by examining the distribution of our sources in the “G-M20” plot (e.g., Lotz et al. 2004). This approach has been used to distinguish different morphological types in the local universe.
The Gini coefficient (or G) is a measure of how uniformly the brightness is distributed. This value approaches 0 when all pixels have the same value (e.g., diffuse emission), and approaches 1 when all brightness is focused in a few pixels (e.g., central nuclei). On the other hand, the moment of light (M20) is the normalized second order moment of the pixels that make up the brightest 20% of the galaxy, and is high when non-axisymmetric features (e.g., bars, clumps, spiral arms) are present. If both of these measures are calculated for each galaxy, then it is possible that mergers and single sources will occupy separate parameter spaces (Lotz et al., 2008).
4.1.1 Implementation
This analysis is applicable to two-dimensional images (i.e., not data cubes), so we apply it to both rest-frame FIR continuum (i.e., m) maps and [CII] moment zero maps from the ALPINE observations. Both sets of maps are taken from the ALPINE Data Release 1 (DR1), and the details of their creation are available in Béthermin et al. (2020). This set of maps contains 75 [CII] moment zero maps for the [CII]-detected set of sources and 23 continuum images for the FIR-detected set. Since our goal is to compare the G and M20 distribution of these maps to their [CII] morpho-kinematic diversity, we exclude two sources that are detected in FIR emission but not [CII] (CANDELSGOODSS19 and DEIMOSCOSMOS460378), bringing the number of analysed continuum maps to 21.
To isolate the signal in each map, we follow a procedure similar to that of 3DBarolo SEARCH. The noise level of each map is determined by sigma clipping above and below and taking the standard deviation of the resulting pixels (see astropy task sigmaclippedstats). All pixels above this standard deviation are identified. All such peaks outside of 20 pixels (i.e., beams) from the centre are rejected as noise or serendipitous sources. A mask is then created by extrapolating out from the central peaks to their surrounding contours222A higher threshold was tested () which shifted each source to a higher value, but was not used because it excluded low-level emission.. By applying this mask to the original map, we are able to isolate the pixels that are associated with the target source. We choose to mask the data in this way, rather than analysing the full image or using an aperture, to ensure that each masked map contains only signal.
To calculate G, it is first necessary to sort the value of each pixel in the map () into increasing order (i.e., for the smallest value, for the largest). G may then be calculated as:
| (1) |
where n is the number of pixels and is the mean pixel value.
M20 requires the values of all pixels sorted in decreasing order (i.e., for the largest value, for the smallest). We then calculate the second spatial moment of each pixel () and their sum ():
| (2) |
| (3) |
where () is the source centre computed by minimizing . Next, we find the index such that , and find using:
| (4) |
Our approach does not allow for the calculation of uncertainties on or , but we do note that these values are affected by imaging parameters (e.g., image weighting, cell size, cleaning threshold), as well as the choice of 3-D mask.
4.1.2 Results
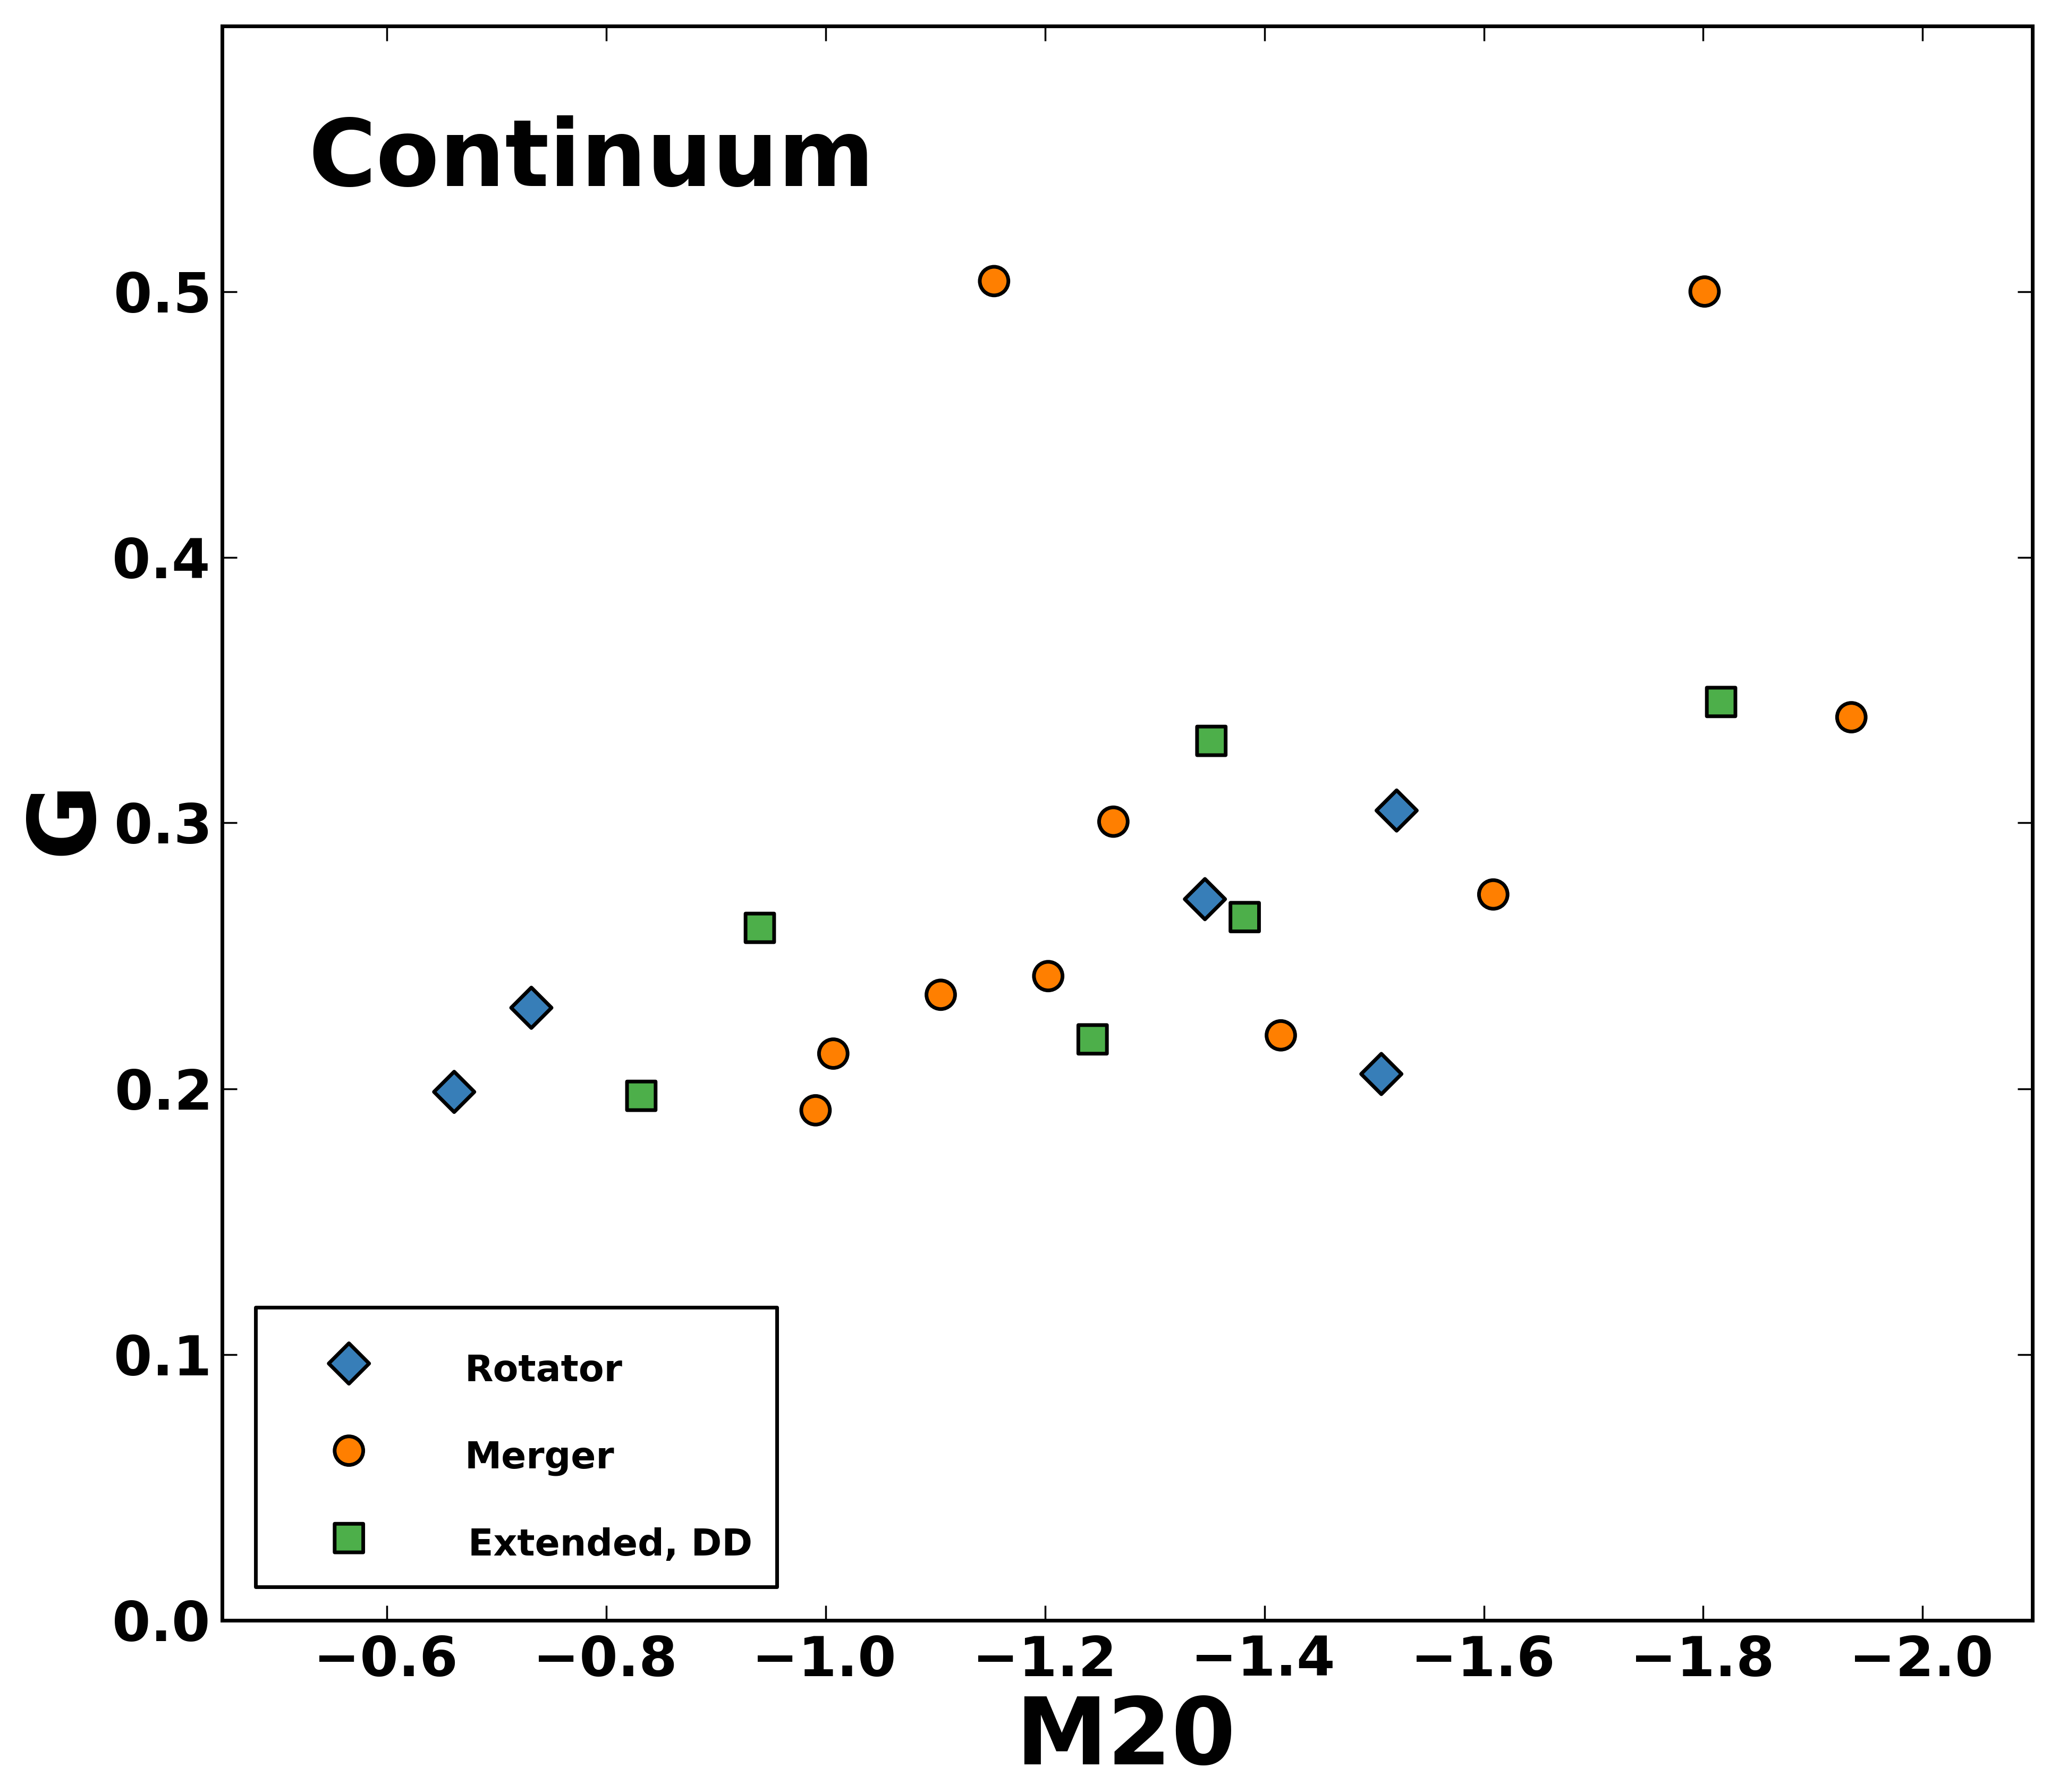
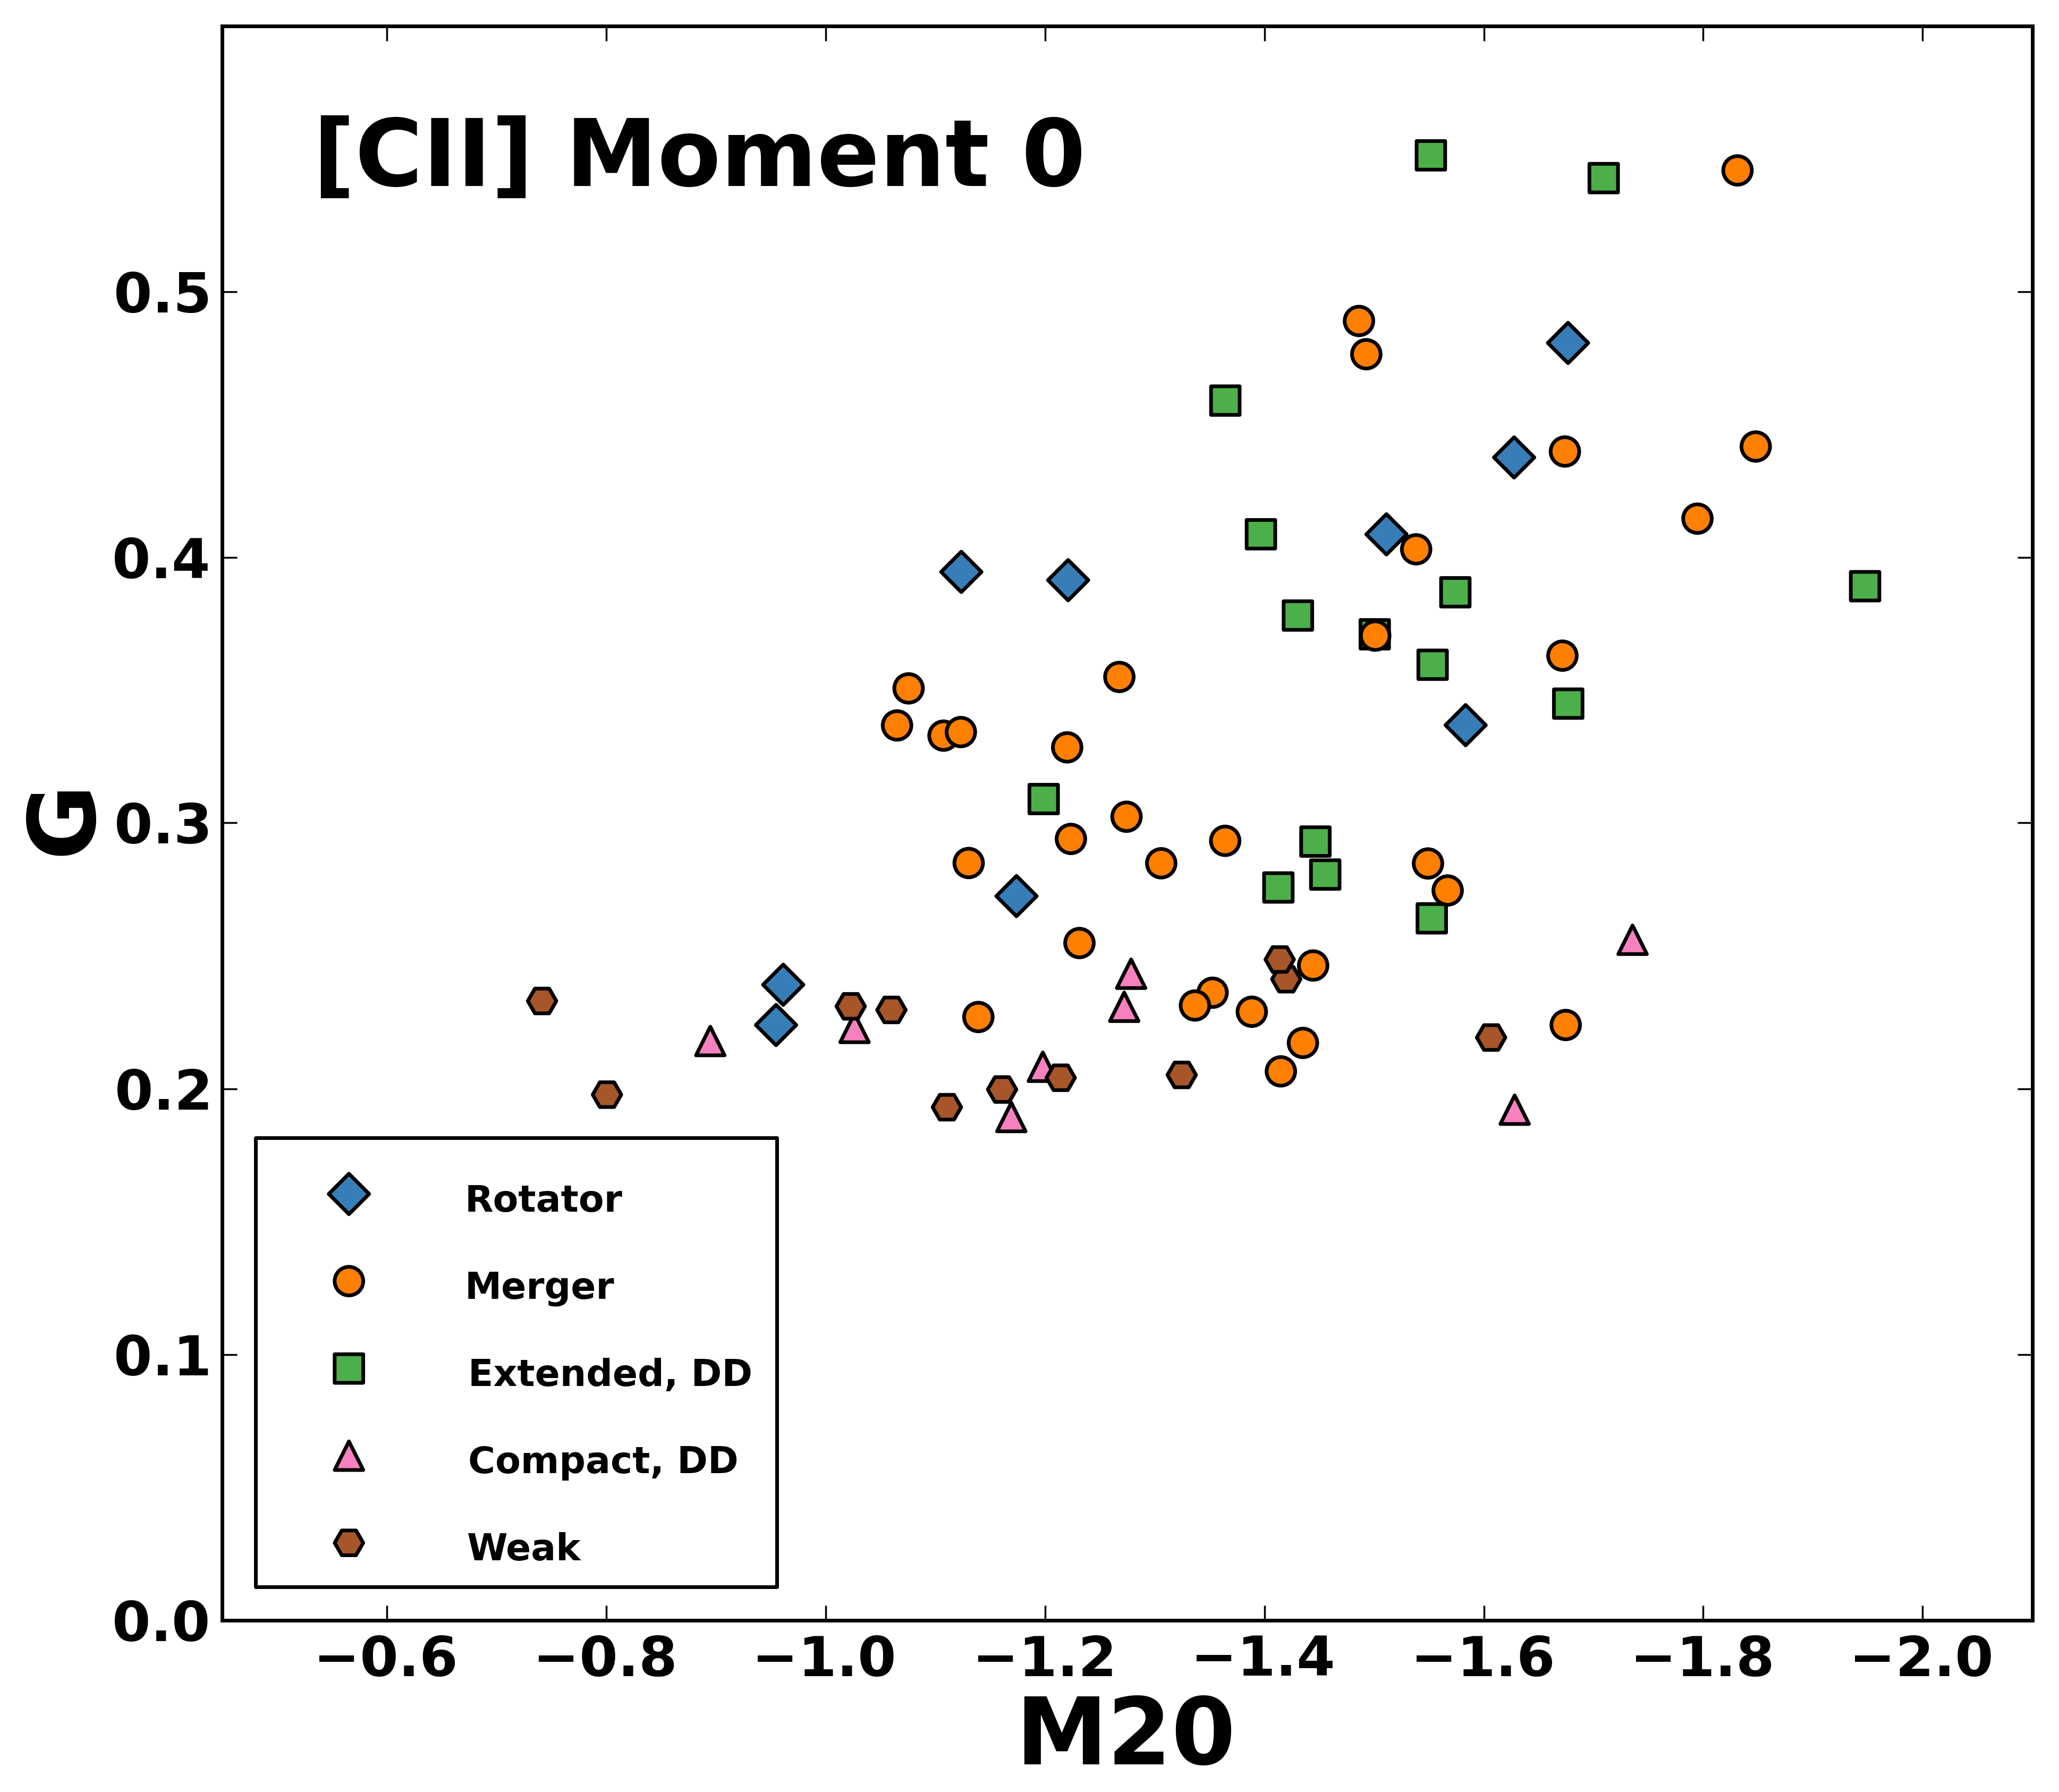
The bottom panel of Figure 4 shows that the [CII] moment zero maps feature a distinct distribution compared to the continuum maps. All of the ‘compact dispersion-dominated’ and ‘weak’ objects lie at low (i.e., ). While the class 1-3 objects spread to higher (i.e., ), there again is no separation between the kinematic classes.
Since this is the first application of this technique to ALMA FIR continuum and [CII] emission of SFGs, there is no comparison sample to which we may compare. One successful application of this procedure was that of Lotz et al. (2008), which analysed the stellar distribution of lower redshift () galaxies as observed with HST and found that mergers featured high values (i.e., clumpy emission), E/S0/Sa had low M20 values (i.e., symmetric morphology), and Sb-Irr galaxies featured low values (i.e., significant diffuse emission). This analysis of stellar morphology is not directly applicable to FIR and [CII] emission at , since the latter trace warm dust, star formation regions, and molecular gas.
This lack of separation between morphological types of galaxies was also seen in a sample of 494 SFGs at , as observed with HST H160 (Talia et al., 2014). Indeed, this HST study found that ellipticals, compact, disk-like, and irregular galaxies were focused between , with significant overlap between ellipticals, compact galaxies, disk-like galaxies, and irregulars.
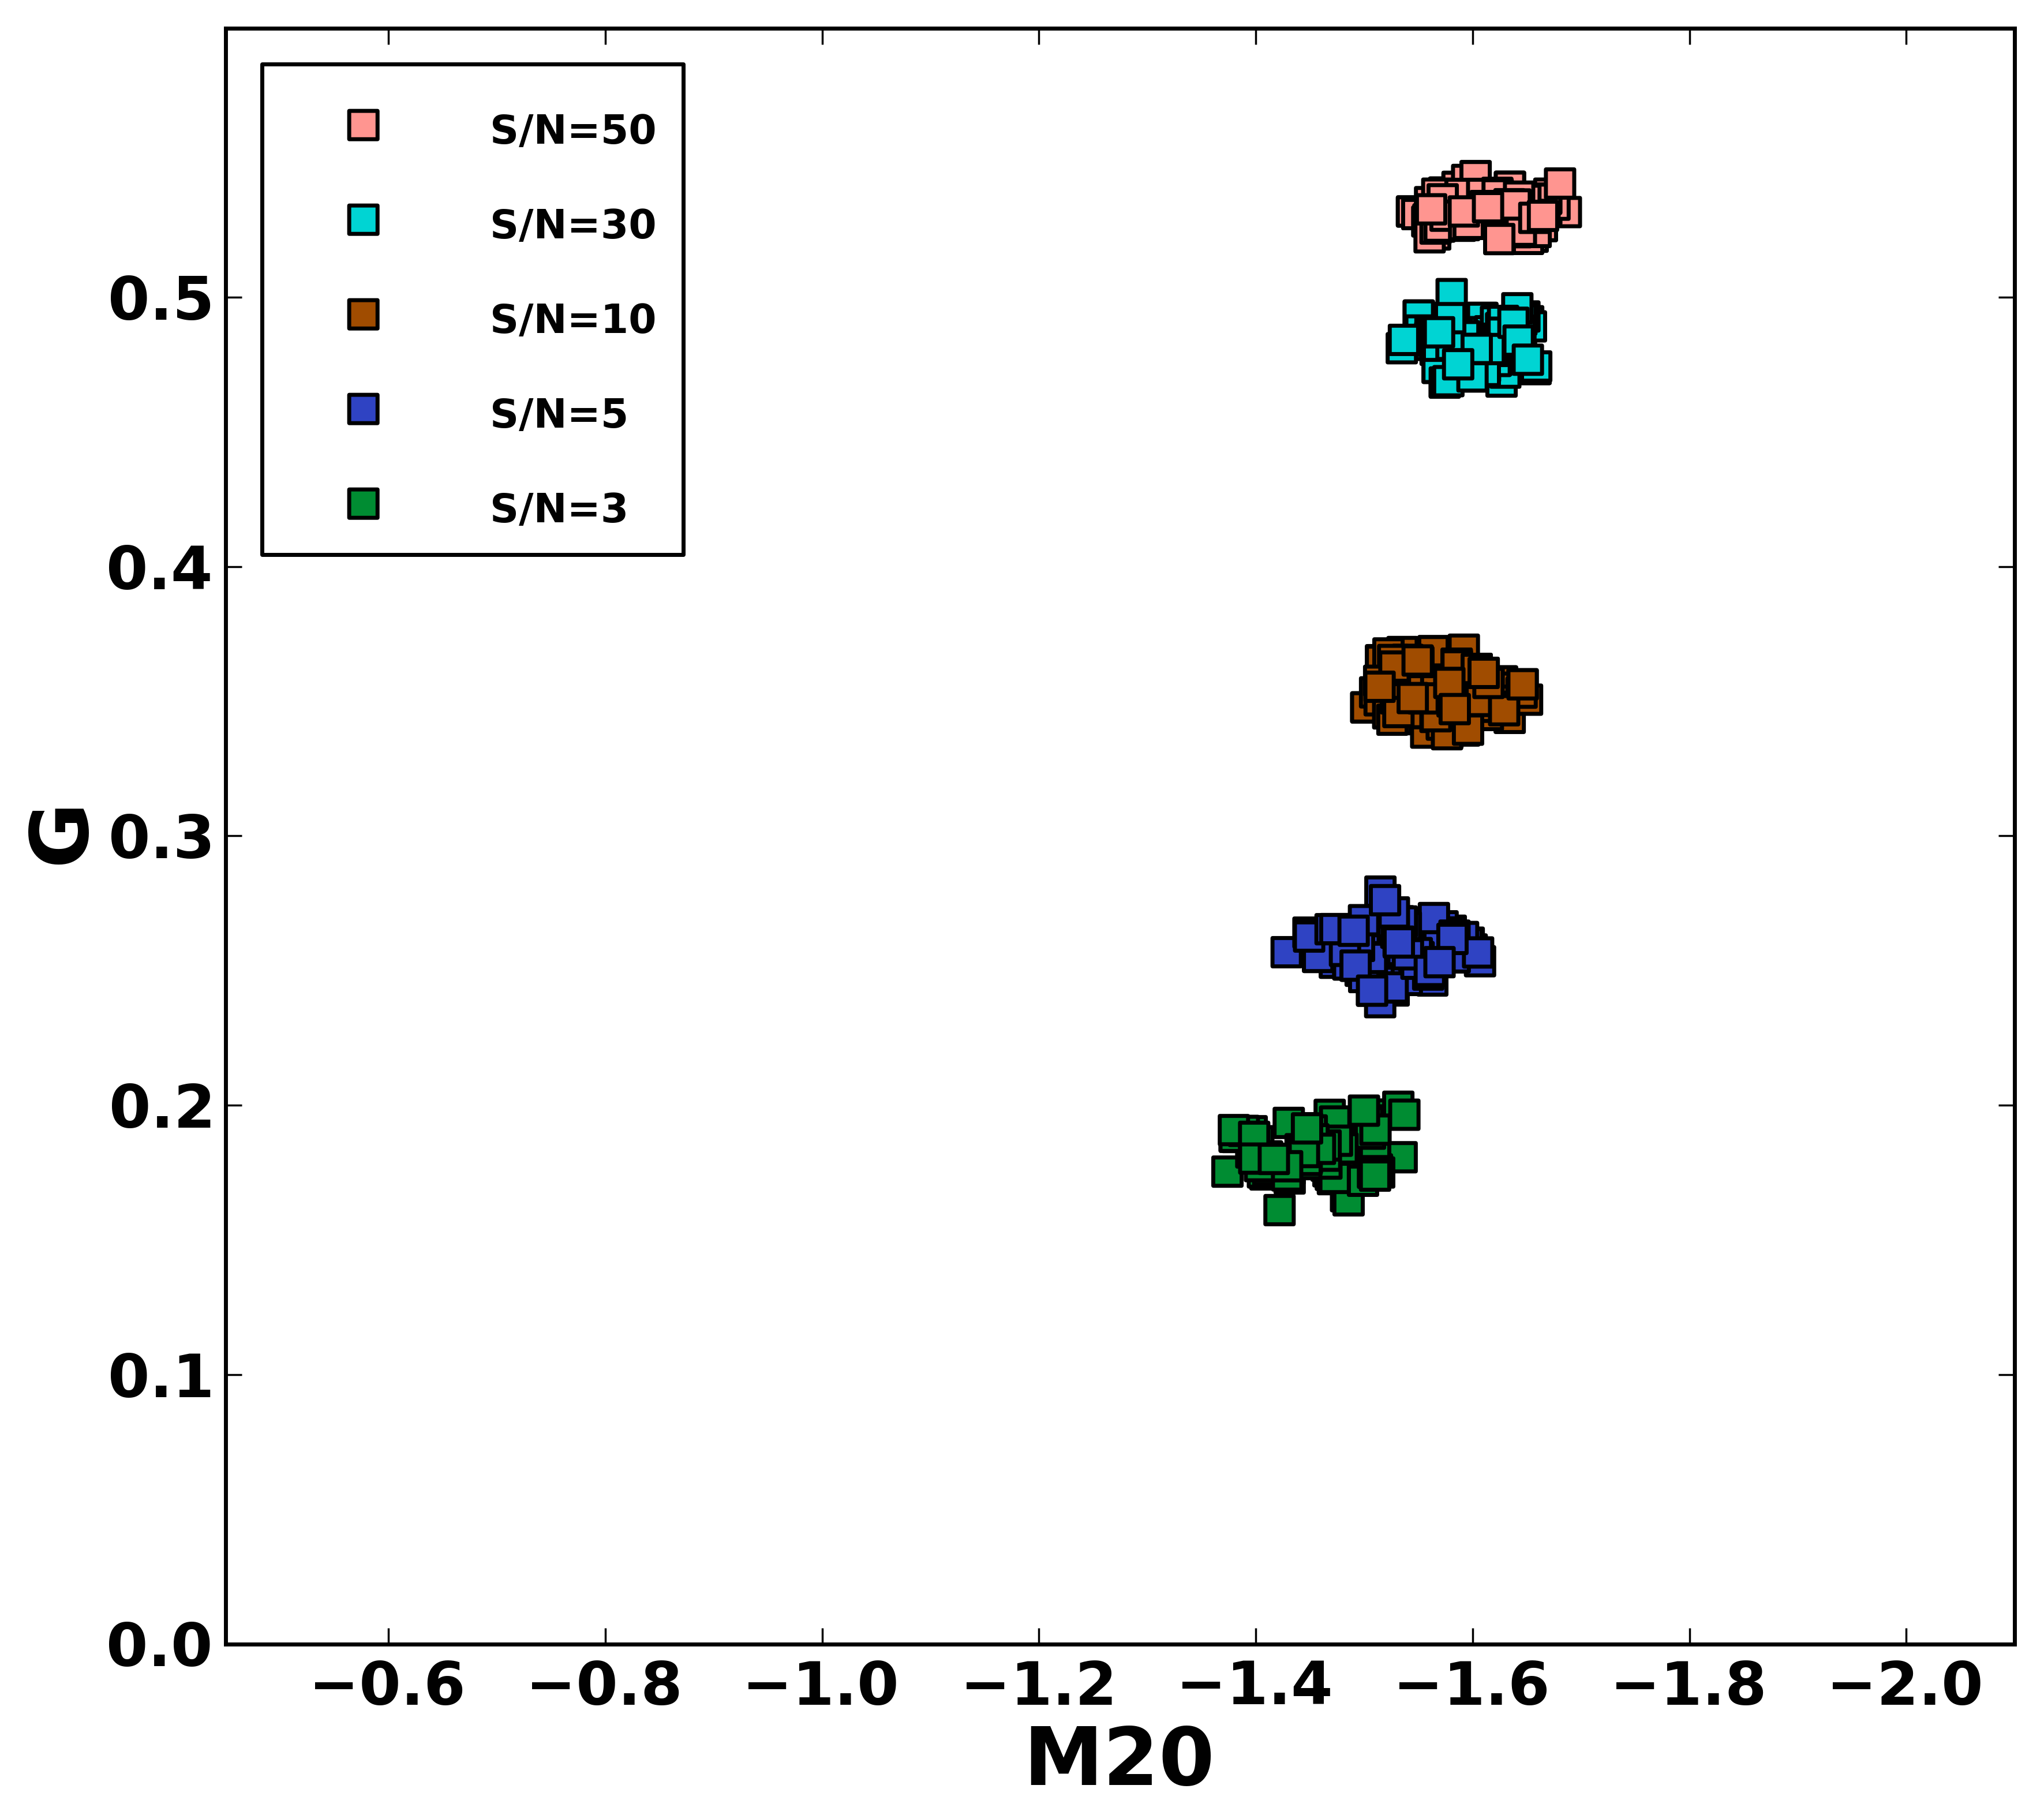
Since the galaxies in the ALPINE sample are marginally resolved (i.e., beams across the source) and feature a variety of SNR, it is conceivable that the observed G-M20 scatter could be affected by observational properties. To determine the effects of the degree of resolution on the recovered G and M20, we assume the extreme case of each source being completely unresolved, and convolve a point source with the set of ALPINE synthesized beams (Béthermin et al., 2020). Using these PSFs, we explore the effects of a range of SNR values on the recovered quantities. In practice, we take each of the 118 restoring beam axis ratios and explore five upper SNR values (3, 5, 10, 30, 50), assuming that the lower SNR threshold is 1. We construct a spatial model grid identical to that of the data (i.e., cells) and calculate G and M20 for each SNRupper.
As seen in Figure 5, the 118 beams of ALPINE are similar, and thus generate only a small scatter in the plane for a given SNRupper. The SNR threshold generates a significant effect, as stronger point sources result in higher G values. The ALPINE continuum and [CII] moment zero maps feature peak SNRs of 3.6-22.3 and 3.5-32.6, respectively. This suggests that the scatter in G values of the ALPINE sample may be explained by a point source convolved with a Gaussian. On the other hand, the point source models in Figure 5 occupy a narrow range of M20, so the observed range of ALPINE M20 sources is likely dominated by intrinsic source morphology. This simple test demonstrates that the observed data are not sufficient for classification on morphology alone. However, this is among the first applications of the Gini-M20 morphological classification technique to a statistical sample of FIR observations of high-redshift () SFGs and will be useful for future investigations of galaxy morphology in the early Universe.
Future high-resolution spectral and continuum observations will likely enable this classification to be performed unambiguously. These include lines observable with ALMA (e.g., [CII] m, [OIII] m) or future observatories such as JWST (e.g., H, H, [OIII] Å, [OII] Å), as well as the underlying rest-frame FIR and IR continuum emission.
4.2 Disk Identification
One of the strengths of this survey is the three-dimensional nature of our data (i.e., RA, Dec, velocity). This allows us to move beyond the two-dimensional morphological classification described above to examine the morpho-kinematics of each [CII] data cube. This was done in Section 3 using 3DBarolo, and here we add modified versions of the five disk identification criteria of Wisnioski et al. (2015):
-
1.
If a slice of the velocity field is taken along the kinematic major axis, does it show a slope that is significant (i.e., )?
-
2.
Is the average rotational velocity greater than the average velocity dispersion, across all rings?
-
3.
Is the average location of the two extreme values of the velocity field (moment 1 map) within one beam width of the peak of velocity dispersion (moment 2)?
-
4.
Is the difference between the morphological and kinematic position angles less than ?
-
5.
Is the average location of the two extreme values of the velocity field (moment 1 map) within one beam width of the peak of intensity (moment 0)?
If some or all of these criteria are met for a given source, then it is likely a rotating disk galaxy. Conversely, if none are met, the source is likely disturbed or a merger. Each criterion may be assessed using the three moment maps (i.e., integrated intensity, line of sight velocity, velocity dispersion) and the results of a 3DBarolo tilted ring model fit. The results for each galaxy are presented in Table 1.
The first criterion, which originally was the presence of a continuous velocity gradient, was made quantitative by requiring a significant slope in position-velocity space along the kinematic major axis. This replicates the standard “rotating disk” criterion used by many high-redshift investigations (e.g., Smit et al. 2018; Bakx et al. 2020), and agrees with a by-eye inspection that some sources show obvious gradients (e.g., VE.9038) and others do not (e.g., DC519281).
The second criterion requires the best-fit model to be strongly rotation-dominated. Perhaps surprisingly, this is met by almost all sources.
Both the third and fifth criteria relate to how well ordered the galaxy is. For an ideal disk, the extreme values of velocity would be at the extreme edges of the major axis, while both the integrated intensity and velocity dispersion would peak at the galaxy centre. On the other hand, the intensity peak in a merging system may be located in one of the component galaxies, resulting in a failure of criterion three. Similarly, the velocity dispersion map may be more complex, due to tidal features and shocks introduced by ongoing merging activity, resulting in a failure of criterion five.
The fourth criterion is a measure of how well the morphology and rotation pattern agree. Because the morphological position angle () is derived by fitting a 2D Gaussian to the [CII] moment zero map, a marginally resolved source will return a that is strongly influenced by the synthesized beam. The most illustrative case is DC396844, where the restoring beam is perpendicular to the kinematic axis, resulting in a failure of this criterion. On the other hand, CG32 is barely resolved (as seen by the best-fit ), but the kinematic angle happens to agree (), so this criterion returns a positive value.
Only two sources in our subset meet all five criteria: DC432340 (classified as ‘uncertain’) and DC818760 (classified as ‘merger’, see Section 5.1). Since neither of these are robustly determined to be rotating disk galaxies, we find that the resolution and sensitivity of our data are insufficient for this specific analysis alone.
5 Discussion
5.1 Synthesis of ALPINE Morpho-kinematic Classification
By combining our new 3DBarolo fits and Wisnioski et al. (2015) disk criteria, we are now able to describe the morphology and kinematics of a massive subset of the galaxies in the ALPINE sample in unprecedented detail. Individual descriptions of each galaxy fitted with 3DBarolo are included in Appendix B.
We classify each source into one of three robust classes or a fourth ‘uncertain’ classification:
-
•
ROT: Rotators
-
•
MER: Mergers
-
•
DIS: Dispersion-dominated
-
•
UNC: Uncertain
The ROT and MER classes are identical to classes 1 and 2 of Le Fèvre et al. (2020) respectively, while DIS is essentially a combination of their classes 3 and 4 (i.e., ‘extended dispersion-dominated’ and ‘compact dispersion-dominated’, respectively)333Since our signal isolation procedure (see Section 3.1) has excluded all compact sources, no class 4 objects are included in our analysis.. The ‘UNC’ class contains sources that we are unable to classify due to low SNR, low spectral resolution, and/or conflicting evidence from our combination of analyses. Note that the UNC class is quite different from class 5 (i.e., ‘weak’) of Le Fèvre et al. (2020), as it also contains strongly detected lines that we are unable to classify into ROT, MER, or DIS due to complex morpho-kinematics.
When classifying galaxies, we choose to be conservative. That is, a galaxy must clearly show multiple spatial and/or spectral components to be a merger, while it must exhibit a well-ordered velocity gradient and a single resolved source to be a rotator. Similarly, dispersion-dominated sources must show identical PVDs along orthogonal slices and be well-fit by a dispersion-dominated 3DBarolo model. If a source does not fit into these classes for any reason, it is classified as ‘UNC’, regardless of its strength.
Of course, this approach is not perfect, as it is still possible that close-separation mergers may be misidentified as rotators (Simons et al. 2019), and face-on rotators may be interpreted as dispersion-dominated galaxies (e.g., Kohandel et al. 2019). More importantly, these classes are a vast oversimplification of the true morpho-kinematics of each source, as each galaxy may contain ordered rotation, minor and major mergers, star-formation and AGN-driven outflows, filamentary accretion, and a number of other evolutionary processes that affect the kinematics, gas content, stellar mass, metallicity, and other properties of the galaxy and its environment (e.g., Law et al. 2009; Wisnioski et al. 2011, see also discussion in Valore et al. 2020). Indeed, cosmological simulations show that high-redshift galaxies are expected to interact with their environments through merging and accretion (e.g., Pallottini et al. 2017; Kohandel et al. 2019; Graziani et al. 2020; Zanella et al. 2021). So while these classes are worthwhile indicators of the general morpho-kinematic state of a galaxy, they may always be improved with higher-resolution, higher-sensitivity observations.
Of the 29 galaxies that were fit with rings by 3DBarolo, 6, 5, 3, and 15 were found to be ROT, MER, DIS, and UNC, respectively. As discussed in Section 3.3, these 29 galaxies constitute a representative subset (i.e., in redshift and SFR) of the high-M∗ portion of the ALPINE sample. The significance of this diversity is explored in the next Section.
5.2 Morpho-Kinematic Diversity Comparison
To examine the evolution of morpho-kinematic diversity with redshift, we may compare the fractions of galaxies in various kinematic classes in the ALPINE sample found in this work to those of lower-redshift samples. In addition, we will place the results of Le Fèvre et al. (2020) in this framework for the first time.
In the relatively low-redshift universe (i.e., ), the IMAGES survey observed 68 intermediate-mass galaxies with VLT/FLAMES-GIRAFFE, resulting in [OII] Å data cubes for each (Yang et al., 2008). Using the resulting moment 1 & 2 maps, they separate 39 galaxies into 9 () rotating disks, 11 () perturbed rotators, 16 () having complex kinematics, and 3 () unclassifiable. Note that the ‘perturbed rotator’ class contains sources that show disk-like rotation but have a velocity dispersion peak that is not coincident with the galactic centre. While this classification technique contains no possibility of dispersion-dominated sources or mergers, they may be hidden within the ‘complex kinematics’ class, due to the low spatial resolution and field of view of the utilized instrument.
Using VLT/SINFONI, Epinat et al. (2012) examined the H velocity fields and I-band images of 45 galaxies at from MASSIV (Mass Assembly Survey with SINFONI in VVDS; Contini et al. 2012). This sample is chosen to be representative of SFR galaxies at with . Using a blind group classification method, they find that 19 () are rotating disks, 16 () are non-rotating disks, and 10 () are not robustly classified. Separately, they carried out a search for companions, finding that of the 41 galaxies where this search was able to be performed robustly, 28 () were isolated and 13 () were interacting or merging.
A tremendous amount of work has been done to characterize the morpho-kinematics of galaxies around cosmic noon (i.e., ). By taking deep NIR adaptive optics-assisted (AO) observations from the Spectroscopic Imaging survey in the Near-infrared with SINFONI (SINS; Förster Schreiber et al. 2009) and zCOSMOS (Lilly et al. 2007, 2009) samples, Förster Schreiber et al. (2018) classified a representative subset of 35 sources from (i.e., SINS/zC-SINF). This sample contains rotation-dominated disks and other classes. This value agrees with the results of KMOS3D (Wisnioski et al., 2019), who found that of their galaxies were rotation-dominated.
At higher redshift (), Gnerucci et al. (2011) observed a sample of galaxies from the AMAZE (Maiolino et al., 2008) and LSD (Mannucci et al., 2009) programs with VLT/SINFONI, resulting in a set of [OIII] Å and H data cubes. By fitting each of their 32 velocity fields with a simple plane model, they find that 11 () are rotators, 14 () are non-rotators, and 7 () are unclassifiable444Based on the results reported in their Table 2.. This percentage of rotators agrees well with that of the KMOS Deep Survey (KDS; Turner et al. 2017), which examined 77 SFGs and found that were rotation dominated.
Le Fèvre et al. (2020) used a similar blind group classification approach as Epinat et al. (2012): a group of collaborators examined moment maps, multi-wavelength photometry, spectra, and channel maps of the 75 ALPINE galaxies detected in [CII] at by Béthermin et al. (2020). They find 9 () rotators, 31 () mergers, 15 () extended dispersion-dominated galaxies, 8 () compact dispersion-dominated galaxies, and 12 () galaxies that were too weak to classify. There are two notes of interest here: the fraction of sources classified as mergers is higher than at lower redshifts (, excluding the unclassifiable galaxies), and the ratio of rotators to dispersion-dominated systems is low (). When compared to the kinematic diversity of Epinat et al. (2012), this suggests that mergers were more common for SFGs at high redshift. A more in-depth study of these merging systems in ALPINE is presented in Romano et al. (2021).
By combining our analyses (see Section 5.1), we are able to robustly classify 14 high-M∗ ALPINE galaxies, finding 6 () rotators, 5 () mergers, and 3 () dispersion-dominated sources. Surprisingly, this massive subset of the ALPINE sample contains a higher number of rotators than mergers. The differences between these fractions and those of Le Fèvre et al. (2020) are likely primarily due to two reasons: our exclusion of unresolved sources, and our stricter criteria for classification (see Section 3). The latter results in different classifications for some galaxies compared to Le Fèvre et al. (2020). As an example, Le Fèvre et al. (2020) classified DC432340 as a merger (class 2) due to the presence of a northern extension and an asymmetric PVD. In this work, we classify it as UNC, as it is too asymmetric to be a ROT or DIS, and only shows a single source, excluding it from MER.
In general, we find that for the ALPINE sample, both the full set of [CII]-detected galaxies and the massive subset studied in this work feature significant morpho-kinematic diversity, containing rotators, mergers, and dispersion-dominated systems. This first statistical test of the diversity of star-forming main sequence galaxies only 1-1.5 Gyr after the Big Bang suggests a higher number of mergers compared to lower redshift sources, and a number of massive rotators. This agrees with cosmological simulations, which show that while high-redshift galaxies are expected to interact with their environments through merging and accretion, the central galaxy may still feature strong rotation (e.g., Kohandel et al. 2019; Kretschmer et al. 2021).
5.3 Main Sequence Rotators at z>4
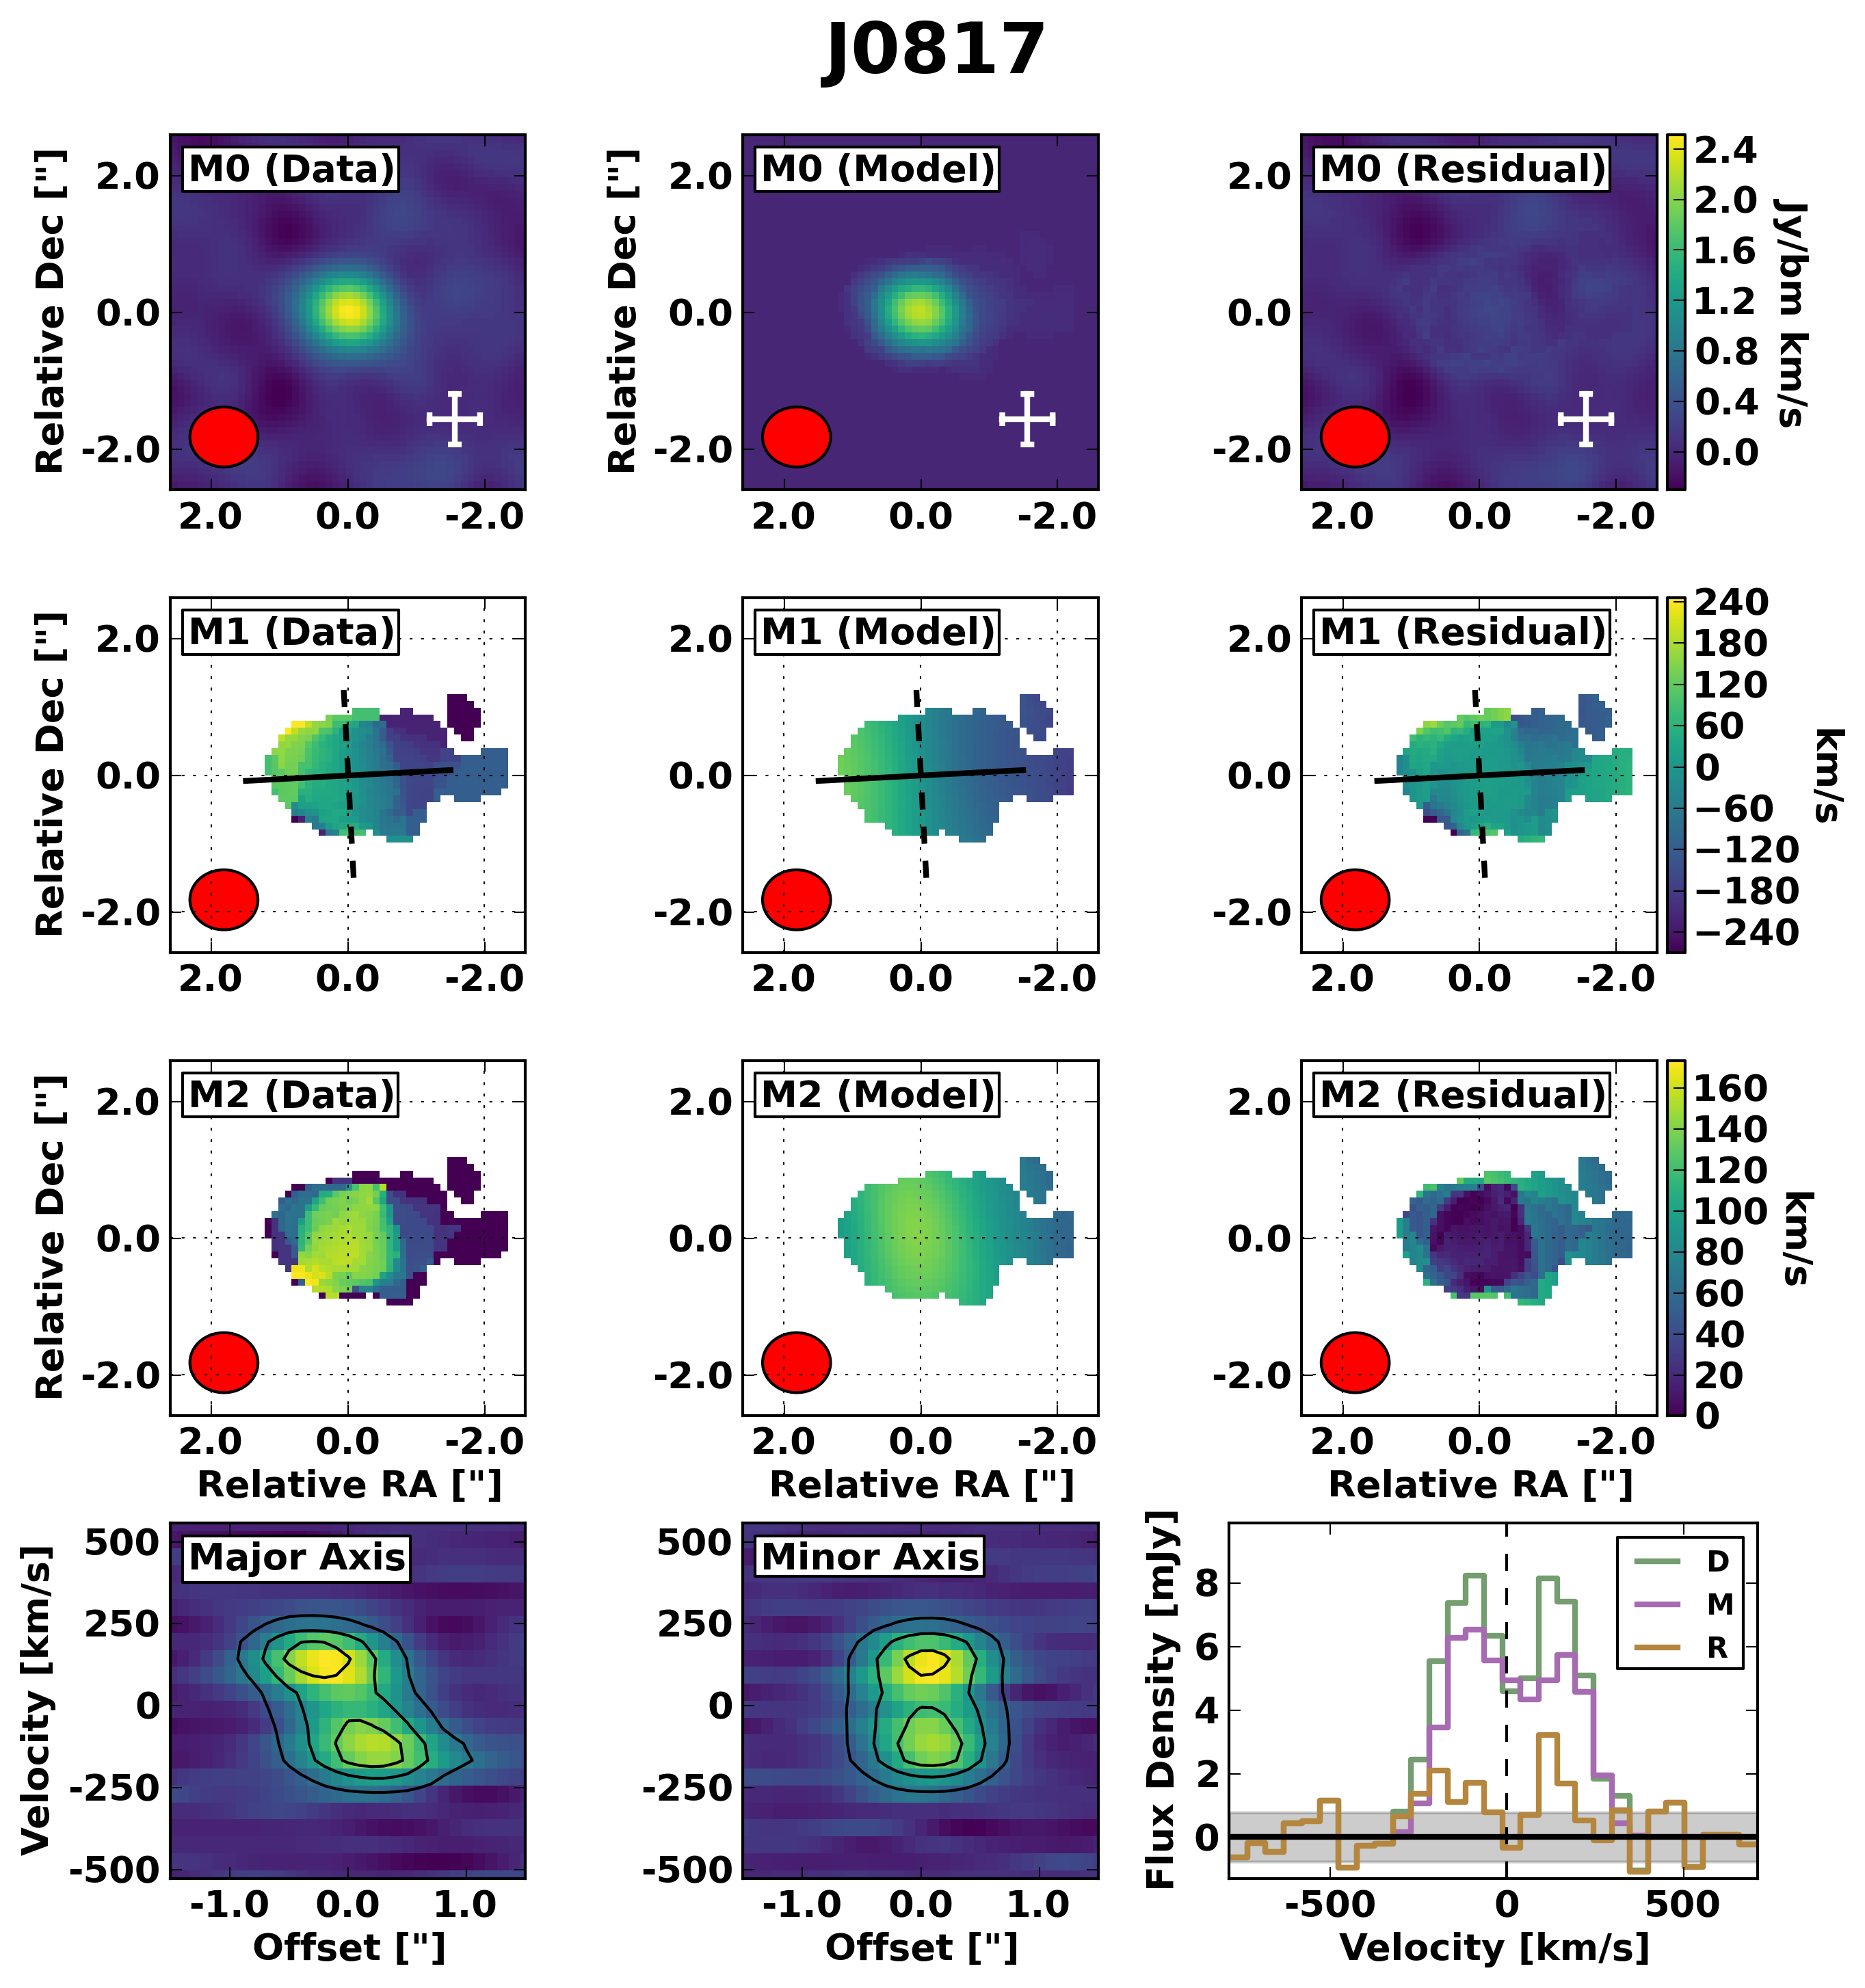
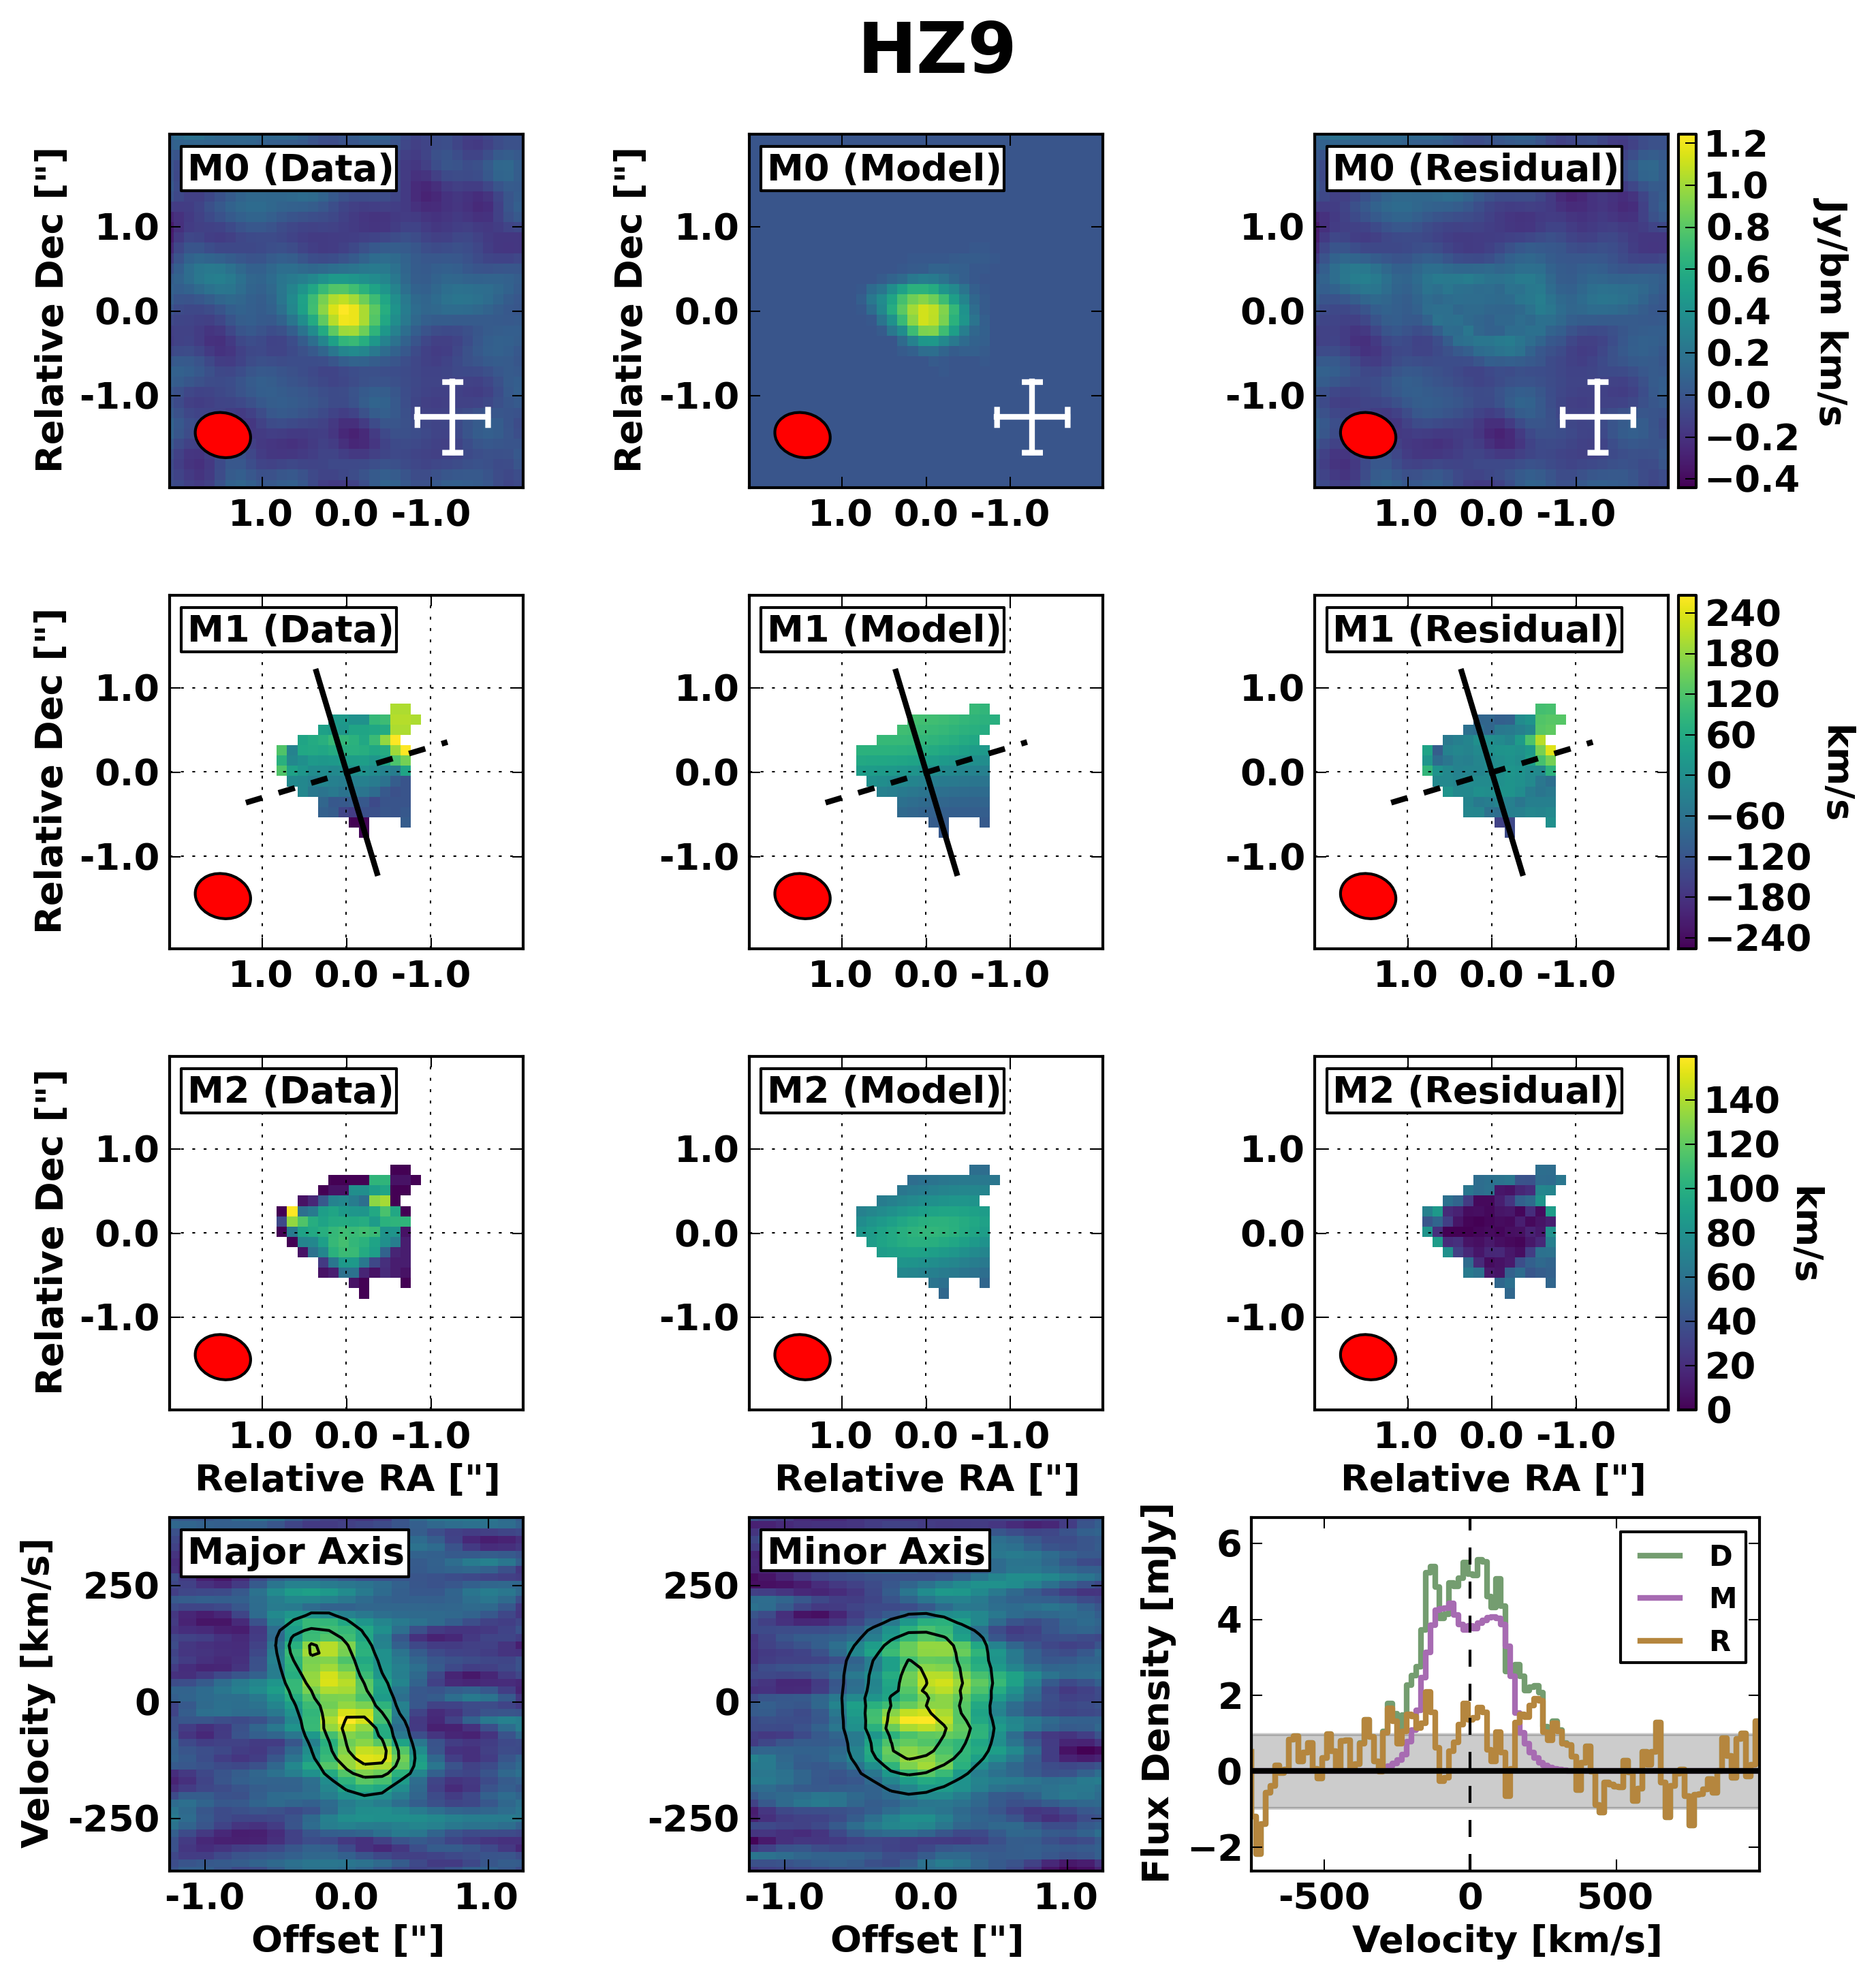
A vast sample of rotating galaxies has been well studied at (e.g., Epinat et al. 2008; Förster Schreiber et al. 2009; Gnerucci et al. 2011), revealing dynamical masses and empirical scaling relations. While a number of clumpy or merging galaxies have been detected at (e.g., Carniani et al. 2018; Pavesi et al. 2018; Díaz-Santos et al. 2018), and a handful of rotating starburst or quasar host galaxies at have been well-modelled (e.g., Jones et al. 2017; Pensabene et al. 2020; Tadaki et al. 2020; Fraternali et al. 2021; Lelli et al. 2021), only two unlensed rotating main sequence galaxies have been observed at : HZ9 (Capak et al. 2015) and J0817 (Neeleman et al. 2017, 2020)555Note that we exclude the galaxy HZ10 (likely a close-separation merger, Pavesi et al. 2016) and the strongly gravitationally lensed rotators of Rizzo et al. (2020) and Rizzo et al. (2021).. In this section, we add six new rotators from the ALPINE sample to this class: CG32, DC396844, DC494057, DC552206, DC881725, and VC.7875.
5.3.1 Previous Data
To compare each source on equal footing, we re-analyse the [CII] kinematics of the two previous rotators by fitting tilted ring models using the 3DBarolo analysis detailed in Section 3. Both of these sources were previously fit with the 2-D tilted ring fitting code GIPSY rotcur (Jones et al., 2017), resulting in decent reproductions of each velocity field. However, the two-dimensional nature of this previous work made it impossible to account for beam smearing or velocity dispersion, resulting in fits that were not quite physical.
The data for HZ9 comes from Capak et al. (2015), and is the same data cube analysed by Jones et al. (2017). The galaxy J0817 has been observed in [CII] emission with ALMA at two different resolutions: (Neeleman et al., 2017) and (Neeleman et al., 2020). To have similar spatial resolution to the ALPINE data, we choose to analyse the J0817 [CII] data cube of Neeleman et al. (2017), and will examine the observation of Neeleman et al. (2020) in Section 5.4. Each of these cubes was passed through the same 3DBarolo analysis as the ALPINE sources, resulting in the best-fit parameters listed in Table 1 (see also Figure 6).
Both of these data cubes are well-fit by 3DBarolo, with small residuals in each moment map and agreement between the model and data PVDs.
5.3.2 Addition of ALPINE Sources
We compare each of the best-fit rotation curves and dynamical mass profiles of the eight unlensed, main sequence rotators in Figure 7. The dynamical mass is estimated using the radius and circular velocity of each ring, assuming perfectly circular rotation:
| (5) |
where G is the gravitational constant (e.g., Wang et al. 2010; De Breuck et al. 2014; Lang et al. 2020). The values used to create the rotation curves, velocity dispersion profiles, and dynamical mass profiles are listed in Appendix C.
Due to the highly nonlinear nature of the kinematic fitting method used in 3DBarolo, the inclusion of this inclination uncertainty in the rotation curves or dynamical mass profiles is nontrivial. Since 3DBarolo fits each ring individually, a different inclination will result in both a different spatial distribution and kinematic properties of each ring, vastly changing the model. Due to this complexity, we simply note that the uncertainty in the best-fit inclination induces an additional source of uncertainty in each rotation curve and dynamical mass profile, which is not depicted in Figure 7.
The dynamical profiles of these sources may be compared to those derived through 2D-modelling by Jones et al. (2017), which includes both main sequence and starburst galaxies. We find smaller spatial extents (i.e., maximum model ring radii), due to our accounting for beam smearing, resulting in smaller dynamical masses. This may be seen in HZ9, where the 2-D approach yielded a maximum dynamical mass of M⊙ and a spatial extent of kpc, while we find M⊙ and a spatial extent of kpc. This confirms the well-known fact that beam smearing has severe impacts on the recovered kinematic parameters of marginally resolved objects, and must be taken into account (e.g., Begeman 1989; de Blok et al. 2008; Molina et al. 2019).
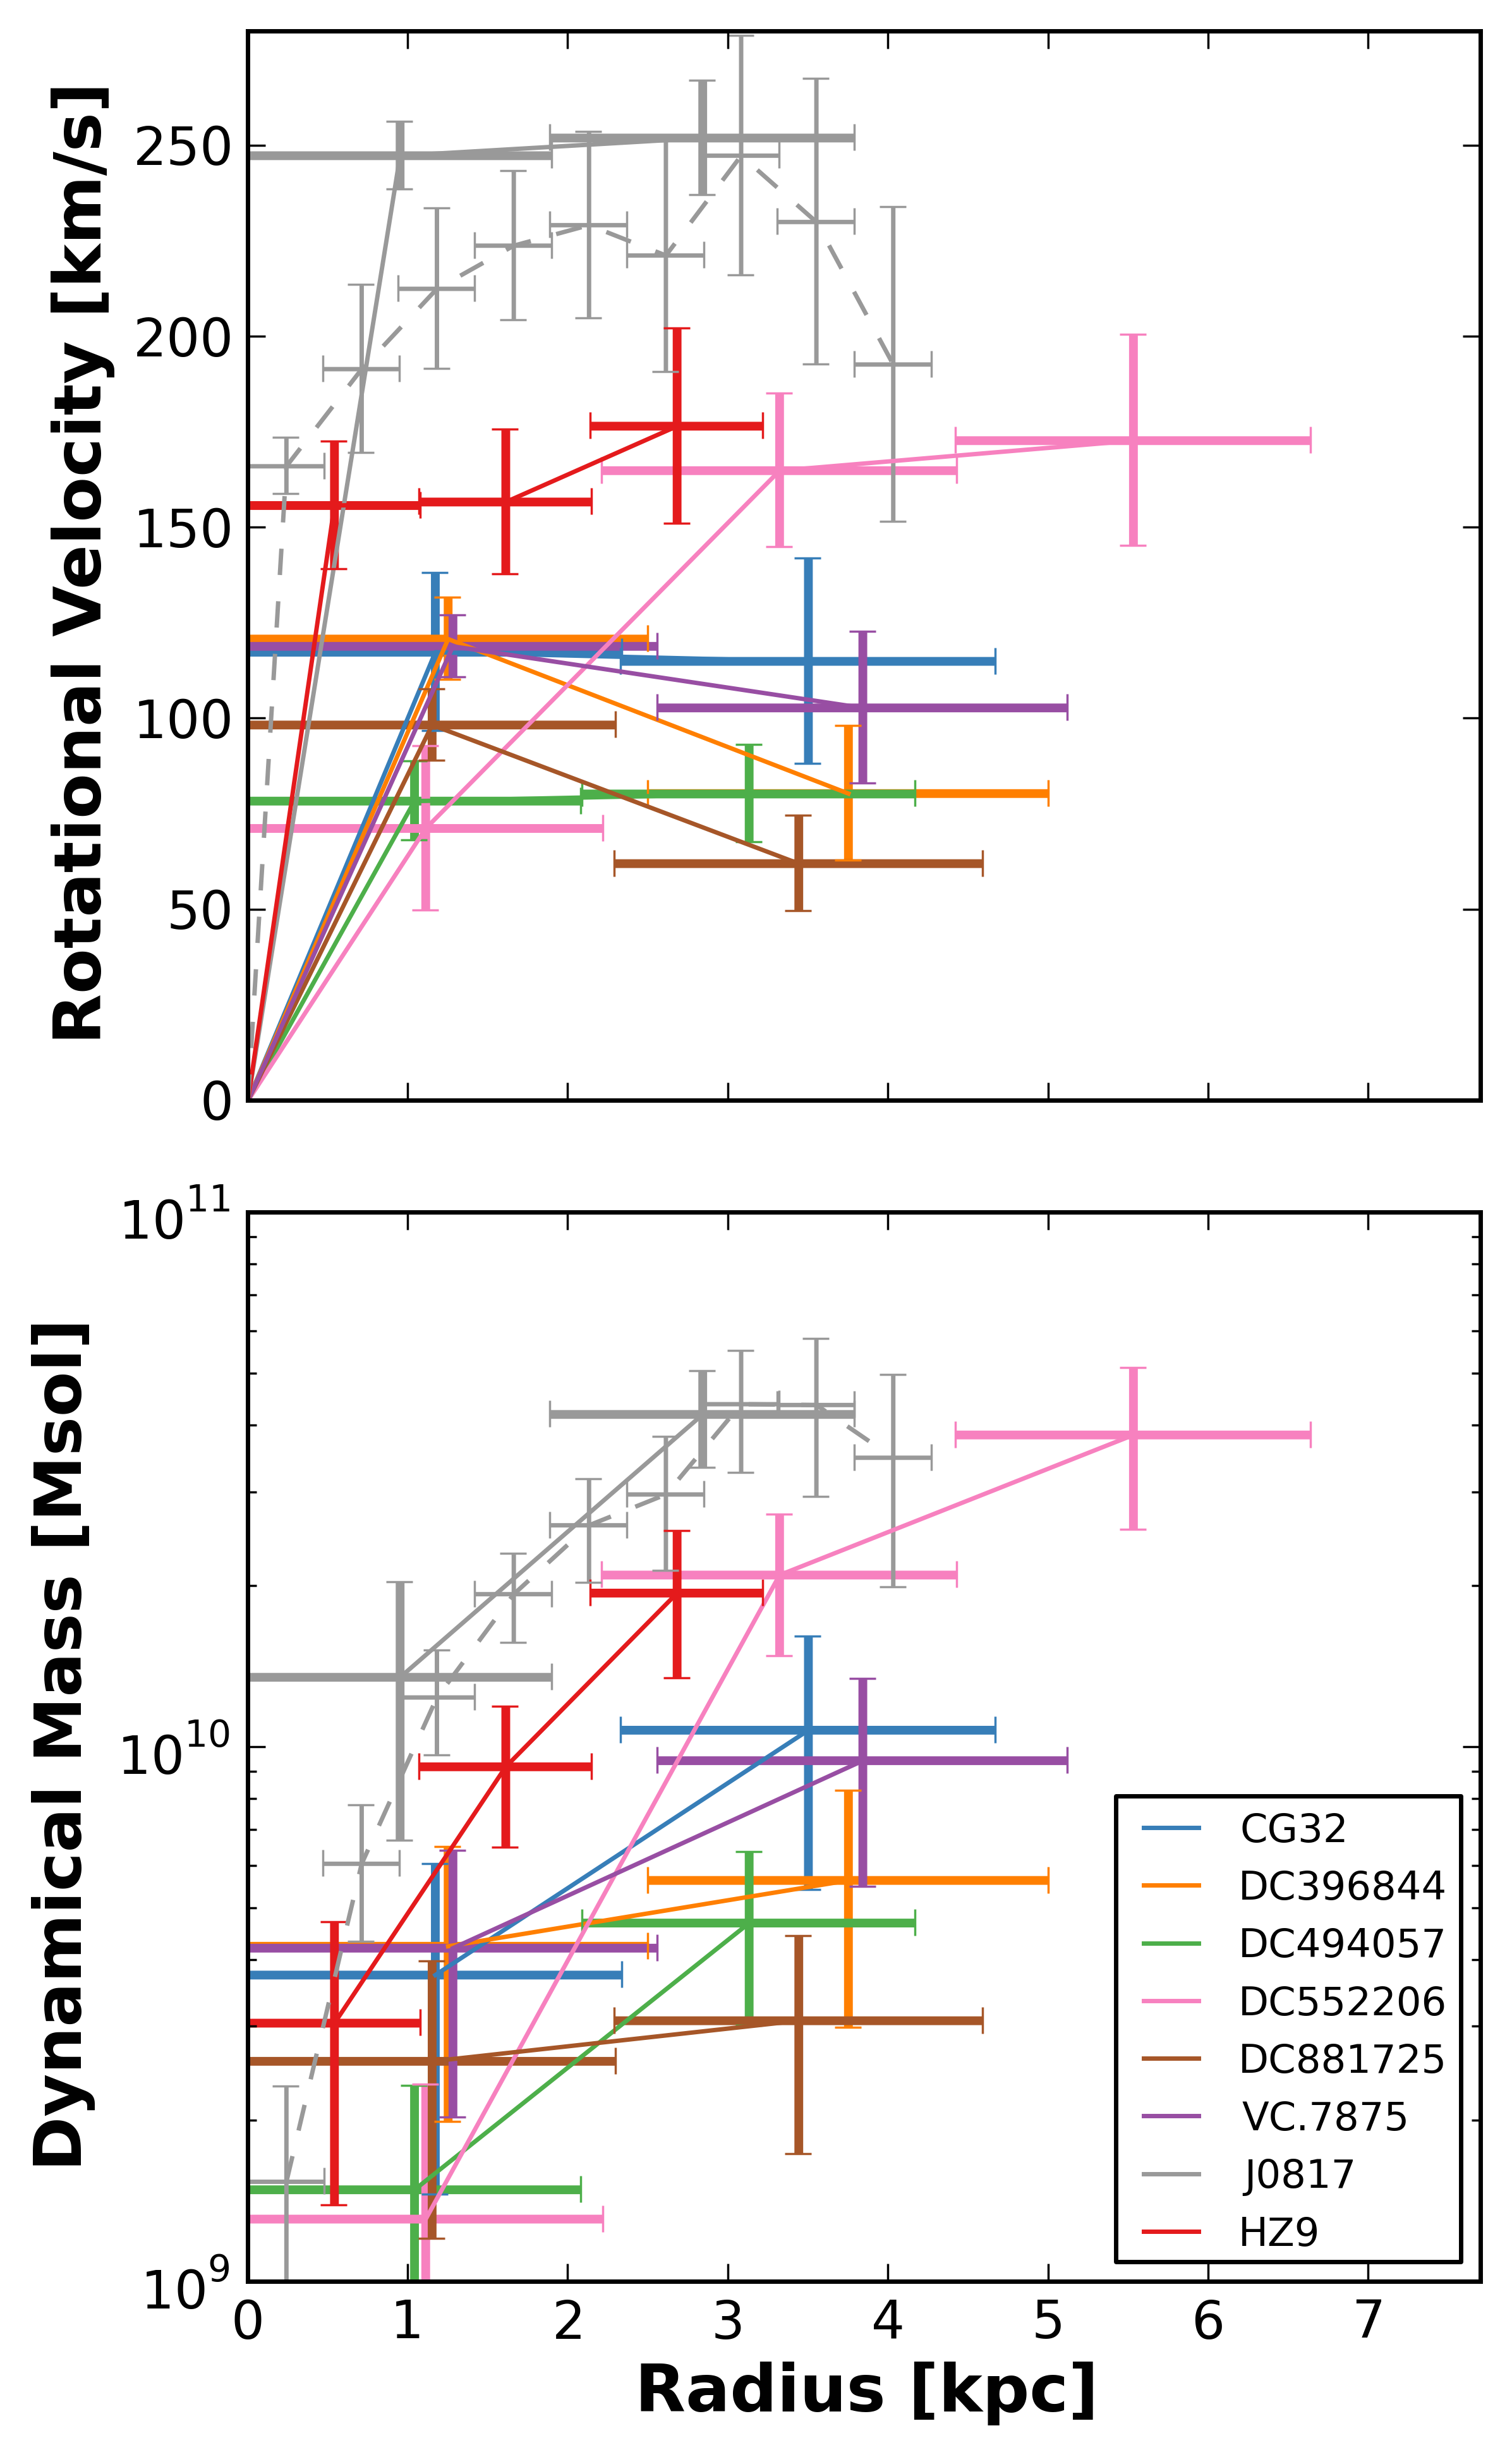
When examining the rotation curves in Figure 7, it is evident that the rotators in this sample show high inclination-corrected rotation speeds ( km s-1) and modest spatial extents ( kpc). The dynamical mass profiles for these sources show some variety, with some rising rotation velocity profiles (i.e., DC552206, J0817, HZ9), approximately flat profiles (i.e., CG32, DC494057, VC.7875), and declining profiles (i.e., DC396844, DC881725).
At first glance, these declining rotation curves could be interpreted as evidence for high baryon fractions (or a weak dark matter halo), as suggested in some analyses of galaxies (e.g., Lang et al. 2017; Genzel et al. 2017). However, there are several main points that do not allow such a strong conclusion. Primarily, the [CII] observations of these sources have synthesized beam sizes of kpc, and thus smooth over large swathes of each galaxy (i.e., beam smearing). This effect of low resolution is also seen in the small number of rings in each model. Similarly, while the cores of these galaxies are very well detected, the weaker outskirts may be confused by noise contributions. Finally, each of these tilted ring models includes a nonzero velocity dispersion for each ring, which is not accounted for in these dynamical masses.
Interestingly, half of the ALPINE rotators also show significant [CII] halos (DC396844, DC881725, VC.7875; Fujimoto et al. 2020). The coincidence of enriched (i.e., not pristine) halos and ordered rotation may be caused by a number of phenomena, including star formation-driven outflows, AGN activity (unlikely in the ALPINE sample, which was chosen to exclude type 1 AGN), and past merger activity. Indeed, cosmological simulations (e.g., Kohandel et al. 2019) have shown that galaxies may undergoing major mergers and revert to a rotation-dominated state a short time (i.e., tens of Myr) later.
Here, we are able to show that our current data strongly argues for order, disk-like rotation in each of these high-redshift galaxies, and that their rotation curves show a variety of shapes over kpc. The detailed comparison of how these rotators compare to low-redshift rotating galaxies (e.g., , Mdyn vs M∗, resolved gas fractions) will be presented in a future work (Rizzo et al. in prep). In addition, high-resolution observations will allow us to delineate the small-scale kinematics of these rotating galaxies, and low-resolution observations will reveal the kinematics of their surrounding gaseous halos.
5.4 Effects of Higher Spatial Resolution
Throughout this work, we have focused on [CII] datasets from the ALPINE survey, which feature spatial resolutions of . For the ALPINE sources (i.e., ), this spatial scale corresponds to kpc. This resolution is sufficient to identify a number of rotators, mergers, and dispersion-dominated objects, and to estimate the dynamical mass of each. This morpho-kinematic characterization may be made even more precise and informative by increasing the spatial resolution of observations.
To illustrate the effects of increased spatial resolution on the recovered kinematics, we apply our 3DBarolo analysis to the recent high-resolution ALMA [CII] observation of J0817 (; kpc; Neeleman et al. 2020). The kpc [CII] observations (Neeleman et al., 2017) of this source were analysed in Section 5.3.
We present the results of applying the 3DBarolo analysis (Section 3) to the high-resolution J0817 [CII] data in Figure 8. The kpc resolution of these data enables us to resolve the galaxy over many beams (i.e., ), revealing the presence of a central bulge (see moment zero map), a complex velocity field, and an non-axisymmetric velocity dispersion map. 3DBarolo is able to reproduce the moment 1 and 2 maps, as well as the PVDs. The spectrum features a significant red residual, which suggests that these high-resolution data expose non-rotating components of the J0817 system.
We may compare the observed morpho-kinematics of J0817 at (Figure 8) and (Figure 6) spatial resolution. The effects of beam smearing are drastically reduced in the high-resolution data, as seen by the more compact moment zero map, complex velocity field and sharp pair of PVDs. The rotator nature of this source is discernible from the low-resolution data, but high-resolution observations allow for more detailed characterization.
Finally, we may compare the recovered rotation curves and dynamical mass profiles for this galaxy at each resolution (Figure 7). Using the data, we are able to explore the rotation curve at higher spatial resolution. The observed curve is in agreement with a steep initial rise in circular velocity, followed by a flattening at large radii (as seen by Neeleman et al. 2020). The recovered velocities are slightly lower than those recovered from the resolution data, suggesting a different kinematic inclination angle. However, the two dynamical mass profiles are in complete agreement, suggesting that the resolution data are sufficient for this analysis.
6 Summary & Conclusions
In this work, we have investigated the morpho-kinematics of the star forming main sequence galaxies in the ALMA ALPINE survey using three quantitative analyses: a tilted ring model fitting code (3DBarolo), a morphological classifier (G-M20), and the disk-like criteria of Wisnioski et al. (2015).
-
•
For each galaxy that we fit with 3DBarolo 3DFIT (29 sources), we derive the best-fit morphological and kinematic parameters (e.g., position angle, inclination, rotation curve, velocity dispersion profile, and dynamical mass) and present moment maps, PVDs, and spectra, yielding a more detailed view into their kinematic and morphological nature. By examining the placement of this subset of 29 galaxies on the M∗-SFR plane, we find that it contains high-M∗ (M⊙) objects that are representative of the star-forming main sequence at this redshift. The morpho-kinematic diversity of these galaxies is further supported, with six rotators, five mergers, and three dispersion-dominated galaxies in our high-M∗ sample. The morpho-kinematic diversity of the ALPINE sample is placed in context with low-redshift studies, suggesting an increase in number of mergers at . This diversity implies for a number of pathways to building up the mass of these sources (e.g., mergers, filamentary accretion).
-
•
To examine the morphology of the ALPINE sample in an additional quantitative manner, we perform one of the first investigations of the distribution of high-redshift () galaxies on the Gini-M20 plane (e.g., Lotz et al. 2004) using maps of the integrated [CII] and rest-frame FIR emission. We find that our sources do not separate by morpho-kinematic class and feature low (signifying a large presence of diffuse emission. To test whether this scatter is due to the low resolution of our observations (i.e., 1-3 beams per source), we simulate the scatter in this plane due to point sources of different SNR, finding that the scatter in G is primarily due to the low resolution of our observations (i.e., ). This groundbreaking test suggests that future, high-resolution ALMA observations of high- galaxies will enable the use of this diagnostic plot.
-
•
We also apply the disk criteria of Wisnioski et al. (2015) to the 29 galaxies where 3DBarolo 3DFIT modelling was possible due to sufficient resolution and S/N. We find that the first two Wisnioski et al. (2015) criteria are useful for identifying rotating galaxies, but these criteria are not suitable for the current data when used alone.
-
•
We compare the six confirmed main sequence rotators in the ALPINE sample to the two previously detected unlensed sources, finding high inclination-corrected rotational velocities, little evidence for declining rotation curves, and comparable dynamical mass profiles. While future high-sensitivity observations will be required to place stronger constraints on the behaviour of these rotation curves at large radii, these current results show strong evidence for ordered rotation in a sample of SFGs.
-
•
To test the reliability of our recovered morpho-kinematics, we apply the same tilted ring model fitting procedure as above to both a low-resolution () and high-resolution () [CII] observation of the SFG J0817. The low-resolution observation is well-fit by such a model, revealing the intrinsic rotation of the galaxy. Thus, our resolution ALPINE data are appropriate for morpho-kinematic characterization and dynamical mass derivation. By using higher-resolution data, we may confirm these, and derive more detailed kinematics of the system (e.g., deviations from circular rotation).
By applying these analyses to the statistical sample of ALPINE, we may gain insight into the morpho-kinematics of main sequence galaxies at . Future high-resolution [CII] observations will allow us to precisely determine the merger rate, rotation properties, turbulence support, and dynamical mass of each source. In parallel, additional detailed investigations of single targeted (e.g., Jones et al. 2020; Ginolfi et al. 2020b) and serendipitous (e.g., Romano et al. 2020) galaxies will reveal the morpho-kinematics of early galaxies. Together, these statistical and single observations will inform current cosmological simulations (e.g., Kohandel et al. 2019) and allow us to precisely determine the kinematics (e.g., merger rate, relative populations of kinematic classes, baryon cycle) of galaxies in the early Universe.
Acknowledgements
We thank the anonymous referee for useful feedback that resulted in an improved manuscript. This paper is based on data obtained with the ALMA Observatory, under Large Program 2017.1.00428.L. We also analyse archival data from ALMA programs 2012.1.00523.S and 2017.1.01052.S. ALMA is a partnership of ESO (representing its member states), NSF (USA) and NINS (Japan), together with NRC (Canada), MOST and ASIAA (Taiwan), and KASI (Republic of Korea), in cooperation with the Republic of Chile. The Joint ALMA Observatory is operated by ESO, AUI/NRAO and NAOJ. Based on data products from observations made with ESO Telescopes at the La Silla Paranal Observatory under ESO programme ID 179.A-2005 and on data products produced by TERAPIX and the Cambridge Astronomy Survey Unit on behalf of the UltraVISTA consortium. This program is supported by the national program Cosmology and Galaxies from the CNRS in France. G.C.J. and R.M. acknowledge ERC Advanced Grant 695671 “QUENCH” and support by the Science and Technology Facilities Council (STFC). J.D.S. was supported by the JSPS KAKENHI Grant Number *JP18H04346*, and the World Premier International Research Center Initiative (WPI Initiative), MEXT, Japan. A.C. and M.T. acknowledge the support from grant PRINMIUR 2017 20173ML3WW001. E.I. acknowledges partial support from FONDECYT through grant N∘ 1171710. This paper is dedicated to the memory of Olivier Le Fèvre, PI of the ALPINE survey.
Data Availability
The data analysed in this work are available from the ALMA data archive (https://almascience.nrao.edu/asax/) under project code 2017.1.00428.L. Catalogs and data products are available from the ALPINE Data Release page (https://cesam.lam.fr/a2c2s/data_release.php).
References
- Aretxaga et al. (2011) Aretxaga I., et al., 2011, MNRAS, 415, 3831
- Bakx et al. (2020) Bakx T. J. L. C., et al., 2020, MNRAS, 493, 4294
- Begeman (1989) Begeman K. G., 1989, A&A, 223, 47
- Béthermin et al. (2020) Béthermin M., et al., 2020, A&A, 643, A2
- Bouché et al. (2015) Bouché N., Carfantan H., Schroetter I., Michel-Dansac L., Contini T., 2015, AJ, 150, 92
- Braine et al. (2020) Braine J., Hughes A., Rosolowsky E., Gratier P., Colombo D., Meidt S., Schinnerer E., 2020, A&A, 633, A17
- Burbidge et al. (1959) Burbidge E. M., Burbidge G. R., Prendergast K. H., 1959, ApJ, 130, 739
- Burkert et al. (2016) Burkert A., et al., 2016, ApJ, 826, 214
- Capak et al. (2008) Capak P., et al., 2008, ApJ, 681, L53
- Capak et al. (2015) Capak P. L., et al., 2015, Nature, 522, 455
- Carignan et al. (2006) Carignan C., Chemin L., Huchtmeier W. K., Lockman F. J., 2006, ApJ, 641, L109
- Carilli et al. (2008) Carilli C. L., et al., 2008, ApJ, 689, 883
- Carniani et al. (2018) Carniani S., et al., 2018, MNRAS, 478, 1170
- Cassata et al. (2020) Cassata P., et al., 2020, A&A, 643, A6
- Chemin et al. (2009) Chemin L., Carignan C., Foster T., 2009, ApJ, 705, 1395
- Conselice et al. (2005) Conselice C. J., Bundy K., Ellis R. S., Brichmann J., Vogt N. P., Phillips A. C., 2005, ApJ, 628, 160
- Contini et al. (2012) Contini T., et al., 2012, A&A, 539, A91
- Cramer et al. (2019) Cramer W. J., Kenney J. D. P., Sun M., Crowl H., Yagi M., Jáchym P., Roediger E., Waldron W., 2019, ApJ, 870, 63
- Cresci et al. (2009) Cresci G., et al., 2009, ApJ, 697, 115
- Davis et al. (2013) Davis T. A., et al., 2013, MNRAS, 429, 534
- De Breuck et al. (2014) De Breuck C., et al., 2014, A&A, 565, A59
- Di Teodoro & Fraternali (2015) Di Teodoro E. M., Fraternali F., 2015, MNRAS, 451, 3021
- Díaz-Santos et al. (2018) Díaz-Santos T., et al., 2018, Science, 362, 1034
- Epinat et al. (2008) Epinat B., Amram P., Marcelin M., 2008, MNRAS, 390, 466
- Epinat et al. (2012) Epinat B., et al., 2012, A&A, 539, A92
- Faisst et al. (2020) Faisst A. L., et al., 2020, ApJS, 247, 61
- Fan et al. (2019) Fan L., Knudsen K. K., Han Y., Tan Q.-h., 2019, ApJ, 887, 74
- Förster Schreiber et al. (2006) Förster Schreiber N. M., et al., 2006, ApJ, 645, 1062
- Förster Schreiber et al. (2009) Förster Schreiber N. M., et al., 2009, ApJ, 706, 1364
- Förster Schreiber et al. (2018) Förster Schreiber N. M., et al., 2018, ApJS, 238, 21
- Fraternali et al. (2021) Fraternali F., Karim A., Magnelli B., Gómez-Guijarro C., Jiménez-Andrade E. F., Posses A. C., 2021, A&A, 647, A194
- Fujimoto et al. (2019) Fujimoto S., et al., 2019, ApJ, 887, 107
- Fujimoto et al. (2020) Fujimoto S., et al., 2020, ApJ, 900, 1
- Garrido et al. (2002) Garrido O., Marcelin M., Amram P., Boulesteix J., 2002, A&A, 387, 821
- Genzel et al. (2017) Genzel R., et al., 2017, Nature, 543, 397
- Ginolfi et al. (2020a) Ginolfi M., et al., 2020a, A&A, 633, A90
- Ginolfi et al. (2020b) Ginolfi M., et al., 2020b, A&A, 643, A7
- Gnerucci et al. (2011) Gnerucci A., et al., 2011, A&A, 528, A88
- Gómez-López et al. (2019) Gómez-López J. A., et al., 2019, A&A, 631, A71
- Graziani et al. (2020) Graziani L., Schneider R., Ginolfi M., Hunt L. K., Maio U., Glatzle M., Ciardi B., 2020, MNRAS, 494, 1071
- Harrison et al. (2017) Harrison C. M., et al., 2017, MNRAS, 467, 1965
- Jones et al. (2017) Jones G. C., et al., 2017, ApJ, 850, 180
- Jones et al. (2020) Jones G. C., et al., 2020, MNRAS, 491, L18
- Józsa et al. (2007) Józsa G. I. G., Kenn F., Klein U., Oosterloo T. A., 2007, A&A, 468, 731
- Kohandel et al. (2019) Kohandel M., Pallottini A., Ferrara A., Zanella A., Behrens C., Carniani S., Gallerani S., Vallini L., 2019, MNRAS, 487, 3007
- Korsaga et al. (2019) Korsaga M., Epinat B., Amram P., Carignan C., Adamczyk P., Sorgho A., 2019, MNRAS, 490, 2977
- Krajnović et al. (2006) Krajnović D., Cappellari M., de Zeeuw P. T., Copin Y., 2006, MNRAS, 366, 787
- Kretschmer et al. (2021) Kretschmer M., Dekel A., Teyssier R., 2021, arXiv e-prints, p. arXiv:2103.06882
- Lang et al. (2017) Lang P., et al., 2017, ApJ, 840, 92
- Lang et al. (2020) Lang P., et al., 2020, ApJ, 897, 122
- Law et al. (2009) Law D. R., Steidel C. C., Erb D. K., Larkin J. E., Pettini M., Shapley A. E., Wright S. A., 2009, ApJ, 697, 2057
- Le Fèvre et al. (2020) Le Fèvre O., et al., 2020, A&A, 643, A1
- Lelli et al. (2021) Lelli F., di Teodoro E., Fraternali F., Man A. W. S., Zhang Z. Y., De Breuck C., Davis T. A., Maiolino R., 2021, Science, 371, 713
- Lilly et al. (2007) Lilly S. J., et al., 2007, ApJS, 172, 70
- Lilly et al. (2009) Lilly S. J., et al., 2009, ApJS, 184, 218
- Loiacono et al. (2019) Loiacono F., Talia M., Fraternali F., Cimatti A., Di Teodoro E. M., Caminha G. B., 2019, MNRAS, 489, 681
- Loiacono et al. (2021) Loiacono F., et al., 2021, A&A, 646, A76
- Lotz et al. (2004) Lotz J. M., Primack J., Madau P., 2004, AJ, 128, 163
- Lotz et al. (2008) Lotz J. M., et al., 2008, ApJ, 672, 177
- Madau & Dickinson (2014) Madau P., Dickinson M., 2014, ARA&A, 52, 415
- Maiolino et al. (2008) Maiolino R., et al., 2008, A&A, 488, 463
- Mancera Piña et al. (2020) Mancera Piña P. E., et al., 2020, MNRAS, 495, 3636
- Mannucci et al. (2009) Mannucci F., et al., 2009, MNRAS, 398, 1915
- McMullin et al. (2007) McMullin J. P., Waters B., Schiebel D., Young W., Golap K., 2007, CASA Architecture and Applications. p. 127
- Molina et al. (2017) Molina J., Ibar E., Swinbank A. M., Sobral D., Best P. N., Smail I., Escala A., Cirasuolo M., 2017, MNRAS, 466, 892
- Molina et al. (2019) Molina J., et al., 2019, MNRAS, 482, 1499
- Neeleman et al. (2017) Neeleman M., Kanekar N., Prochaska J. X., Rafelski M., Carilli C. L., Wolfe A. M., 2017, Science, 355, 1285
- Neeleman et al. (2020) Neeleman M., Prochaska J. X., Kanekar N., Rafelski M., 2020, Nature, 581, 269
- Noeske et al. (2007) Noeske K. G., et al., 2007, ApJ, 660, L43
- North et al. (2019) North E. V., et al., 2019, MNRAS, 490, 319
- Pallottini et al. (2017) Pallottini A., Ferrara A., Gallerani S., Vallini L., Maiolino R., Salvadori S., 2017, MNRAS, 465, 2540
- Pavesi et al. (2016) Pavesi R., et al., 2016, ApJ, 832, 151
- Pavesi et al. (2018) Pavesi R., et al., 2018, ApJ, 861, 43
- Pavesi et al. (2019) Pavesi R., Riechers D. A., Faisst A. L., Stacey G. J., Capak P. L., 2019, ApJ, 882, 168
- Pease (1918) Pease F. G., 1918, Proceedings of the National Academy of Science, 4, 21
- Pensabene et al. (2020) Pensabene A., Carniani S., Perna M., Cresci G., Decarli R., Maiolino R., Marconi A., 2020, A&A, 637, A84
- Puech (2010) Puech M., 2010, MNRAS, 406, 535
- Rizzo et al. (2020) Rizzo F., Vegetti S., Powell D., Fraternali F., McKean J. P., Stacey H. R., White S. D. M., 2020, Nature, 584, 201
- Rizzo et al. (2021) Rizzo F., Vegetti S., Fraternali F., Stacey H., Powell D., 2021, arXiv e-prints, p. arXiv:2102.05671
- Rogstad et al. (1974) Rogstad D. H., Lockhart I. A., Wright M. C. H., 1974, ApJ, 193, 309
- Romano et al. (2020) Romano M., et al., 2020, MNRAS, 496, 875
- Romano et al. (2021) Romano M., et al., 2021, arXiv e-prints, p. arXiv:2107.10856
- Rubin & Ford (1970) Rubin V. C., Ford W. Kent J., 1970, ApJ, 159, 379
- Salak et al. (2020) Salak D., Nakai N., Sorai K., Miyamoto Y., 2020, ApJ, 901, 151
- Schinnerer et al. (2008) Schinnerer E., et al., 2008, ApJ, 689, L5
- Schoenmakers (1999) Schoenmakers R. H. M., 1999, PhD thesis, University of Groningen
- Sellwood & Spekkens (2015) Sellwood J. A., Spekkens K., 2015, preprint, (arXiv:1509.07120)
- Shao et al. (2017) Shao Y., et al., 2017, ApJ, 845, 138
- Shapiro et al. (2008) Shapiro K. L., et al., 2008, ApJ, 682, 231
- Sharma et al. (2021) Sharma G., Salucci P., Harrison C. M., van de Ven G., Lapi A., 2021, MNRAS, 503, 1753
- Shelest & Lelli (2020) Shelest A., Lelli F., 2020, A&A, 641, A31
- Simon et al. (2003) Simon J. D., Bolatto A. D., Leroy A., Blitz L., 2003, ApJ, 596, 957
- Simons et al. (2019) Simons R. C., et al., 2019, ApJ, 874, 59
- Smit et al. (2018) Smit R., et al., 2018, Nature, 553, 178
- Speagle et al. (2014) Speagle J. S., Steinhardt C. L., Capak P. L., Silverman J. D., 2014, ApJS, 214, 15
- Swinbank et al. (2017) Swinbank A. M., et al., 2017, MNRAS, 467, 3140
- Tadaki et al. (2020) Tadaki K.-i., et al., 2020, ApJ, 889, 141
- Talia et al. (2014) Talia M., Cimatti A., Mignoli M., Pozzetti L., Renzini A., Kurk J., Halliday C., 2014, A&A, 562, A113
- Talia et al. (2018) Talia M., et al., 2018, MNRAS, 476, 3956
- Teuben (1995) Teuben P., 1995, in Shaw R. A., Payne H. E., Hayes J. J. E., eds, Astronomical Society of the Pacific Conference Series Vol. 77, Astronomical Data Analysis Software and Systems IV. p. 398
- Tiley et al. (2019) Tiley A. L., et al., 2019, MNRAS, 485, 934
- Turner et al. (2017) Turner O. J., et al., 2017, MNRAS, 471, 1280
- Valore et al. (2020) Valore P., Dainotti M. G., Kopczyński O., 2020, arXiv e-prints, p. arXiv:2008.04746
- Varidel et al. (2019) Varidel M. R., et al., 2019, MNRAS, 485, 4024
- Wang et al. (2010) Wang R., et al., 2010, ApJ, 714, 699
- Whiting (2012) Whiting M. T., 2012, MNRAS, 421, 3242
- Wisnioski et al. (2011) Wisnioski E., et al., 2011, MNRAS, 417, 2601
- Wisnioski et al. (2015) Wisnioski E., et al., 2015, ApJ, 799, 209
- Wisnioski et al. (2019) Wisnioski E., et al., 2019, ApJ, 886, 124
- Yang et al. (2008) Yang Y., et al., 2008, A&A, 477, 789
- Zanella et al. (2021) Zanella A., Pallottini A., Ferrara A., Gallerani S., Carniani S., Kohandel M., Behrens C., 2021, MNRAS, 500, 118
- de Blok et al. (2008) de Blok W. J. G., Walter F., Brinks E., Trachternach C., Oh S.-H., Kennicutt Jr. R. C., 2008, AJ, 136, 2648
- den Brok et al. (2020) den Brok M., et al., 2020, MNRAS, 491, 4089
- van der Hulst et al. (1992) van der Hulst J. M., Terlouw J. P., Begeman K. G., Zwitser W., Roelfsema P. R., 1992, in Worrall D. M., Biemesderfer C., Barnes J., eds, Astronomical Society of the Pacific Conference Series Vol. 25, Astronomical Data Analysis Software and Systems I. p. 131
Appendix A Additional Notes on Tilted Ring Modelling
In Section 3, we present an overview of our signal isolation and tilted ring model fitting procedure, as well as the results and properties of the analzyed subsample. Here, we discuss several assumptions that we have made in developing this process.
We have excluded all serendipitous (i.e., non-target) sources, which are analysed in Loiacono et al. (2021). By definition, each of these sources is not at the phase centre of our observations, and thus require a separate primary beam correction for accurate morpho-kinematic analysis. Since they were not selected as part of the ALPINE sample, they do not necessarily represent SFGs at . For example, they include sources at (S5110377875, S460378) as well as a well-studied SMG at (S842313, also known as AzTEC/C17; Aretxaga et al. 2011, COSMOS J100054+02343; Carilli et al. 2008; Capak et al. 2008; Schinnerer et al. 2008). Because of this variety, they will not be used in our current goal of probing the kinematic diversity of this specific class of galaxies. However, a number of these sources were successfully fit with our tilted ring model analysis (e.g., S842313), so their morpho-kinematics may be analysed in a future work.
As part of the fitting procedure, we only allow inclination to vary from , excluding face-on () and edge-on () disks. Face-on disks feature large spatial extents, but low line-of-sight velocities, resulting in dispersion-dominated, Gaussian line profiles (e.g., Kohandel et al. 2019). These sources are indistinguishable from true dispersion-dominated galaxies. On the other hand, edge-on disks are dominated by velocities along the line of sight, but have small axis ratios, and are likely to be poorly resolved along their minor axis. Because of these features, 3DBarolo has been found to return poor fits for extreme inclinations (e.g., Di Teodoro & Fraternali 2015).
Our analysis is based on signal isolation using 3DBarolo SEARCH, rather than a threshold-based 2D or 3D mask. This has the benefit of excluding low-level noise within the mask, but the relatively high lower SNR threshold (SNR) causes the 3DBarolo fits to miss diffuse, low-level emission, as seen in the nonzero residuals in the spectra and moment zero maps. Indeed, recent ALMA studies (e.g., Fujimoto et al. 2019, 2020; Ginolfi et al. 2020a) have revealed extended [CII] emission around galaxies, implying the presence of an diffuse, enriched circumgalactic medium (CGM). Because this CGM emission is not captured with our signal isolation technique, the scope of the kinematic analysis in this paper is focused on the relatively compact interstellar medium (ISM) of the galaxy.
The 3DBarolo 3DFIT routine allows the user to choose from two methods of normalizing the model. The first (‘local’) rescales the flux density of each pixel in the model data cube so that the moment zero map of the model is equal to the moment map of the masked input data cube. The second (’azimuthal’) performs a similar rescaling procedure, but requires the model to have azimuthal symmetry, resulting in an elliptical model. To account for the complex morphologies of the ALPINE sources, we have assumed ‘local’ normalization. This choice has no effect on the recovered moment 1 or moment 2 maps, but allows our model to fit models more complex than a simple symmetric disk. In addition, objects that are obviously not simple rotators (such as the merger VC9780 in Figure 1) return best-fit moment 0 maps that have multiple components or disturbed morphologies, adding additional evidence to their merger classifications.
The majority of our sources have only rings per model (Figure 2). This is much fewer than low-redshift studies (e.g., for de Blok et al. 2008; Lang et al. 2020), but is comparable to other studies (e.g., Jones et al. 2017; Fraternali et al. 2021). This low number of rings is a direct result of the relatively low spatial resolution of these observations (i.e., kpc), as this dictates the spatial scale that we may examine. Each of these tilted ring models is able to reproduce the morphology and kinematics of each galaxy (see Figures 1 and 9 through 14). So while our current analysis is not adversely affected by a limited number of free parameters (or ring number), future high-resolution observations will allow for the examination of small-scale morpho-kinematics (e.g., Neeleman et al. 2020).
Appendix B Galaxy Details
The diversity of this sample makes it worthwhile to comment on each source successfully fitted with 3DBarolo individually. Here, we present moment maps, PVDs, and spectra created from the data, 3DBarolo model, and residual for each source. In addition, we discuss the reasoning behind each morpho-kinematic classification (see Section 5.1) and compare them to the classifications of Le Fèvre et al. (2020). The rotation curves and velocity dispersion profiles of each source are depicted in Figure 2, while the best-fit parameters and W15 criteria are listed in Table 1.
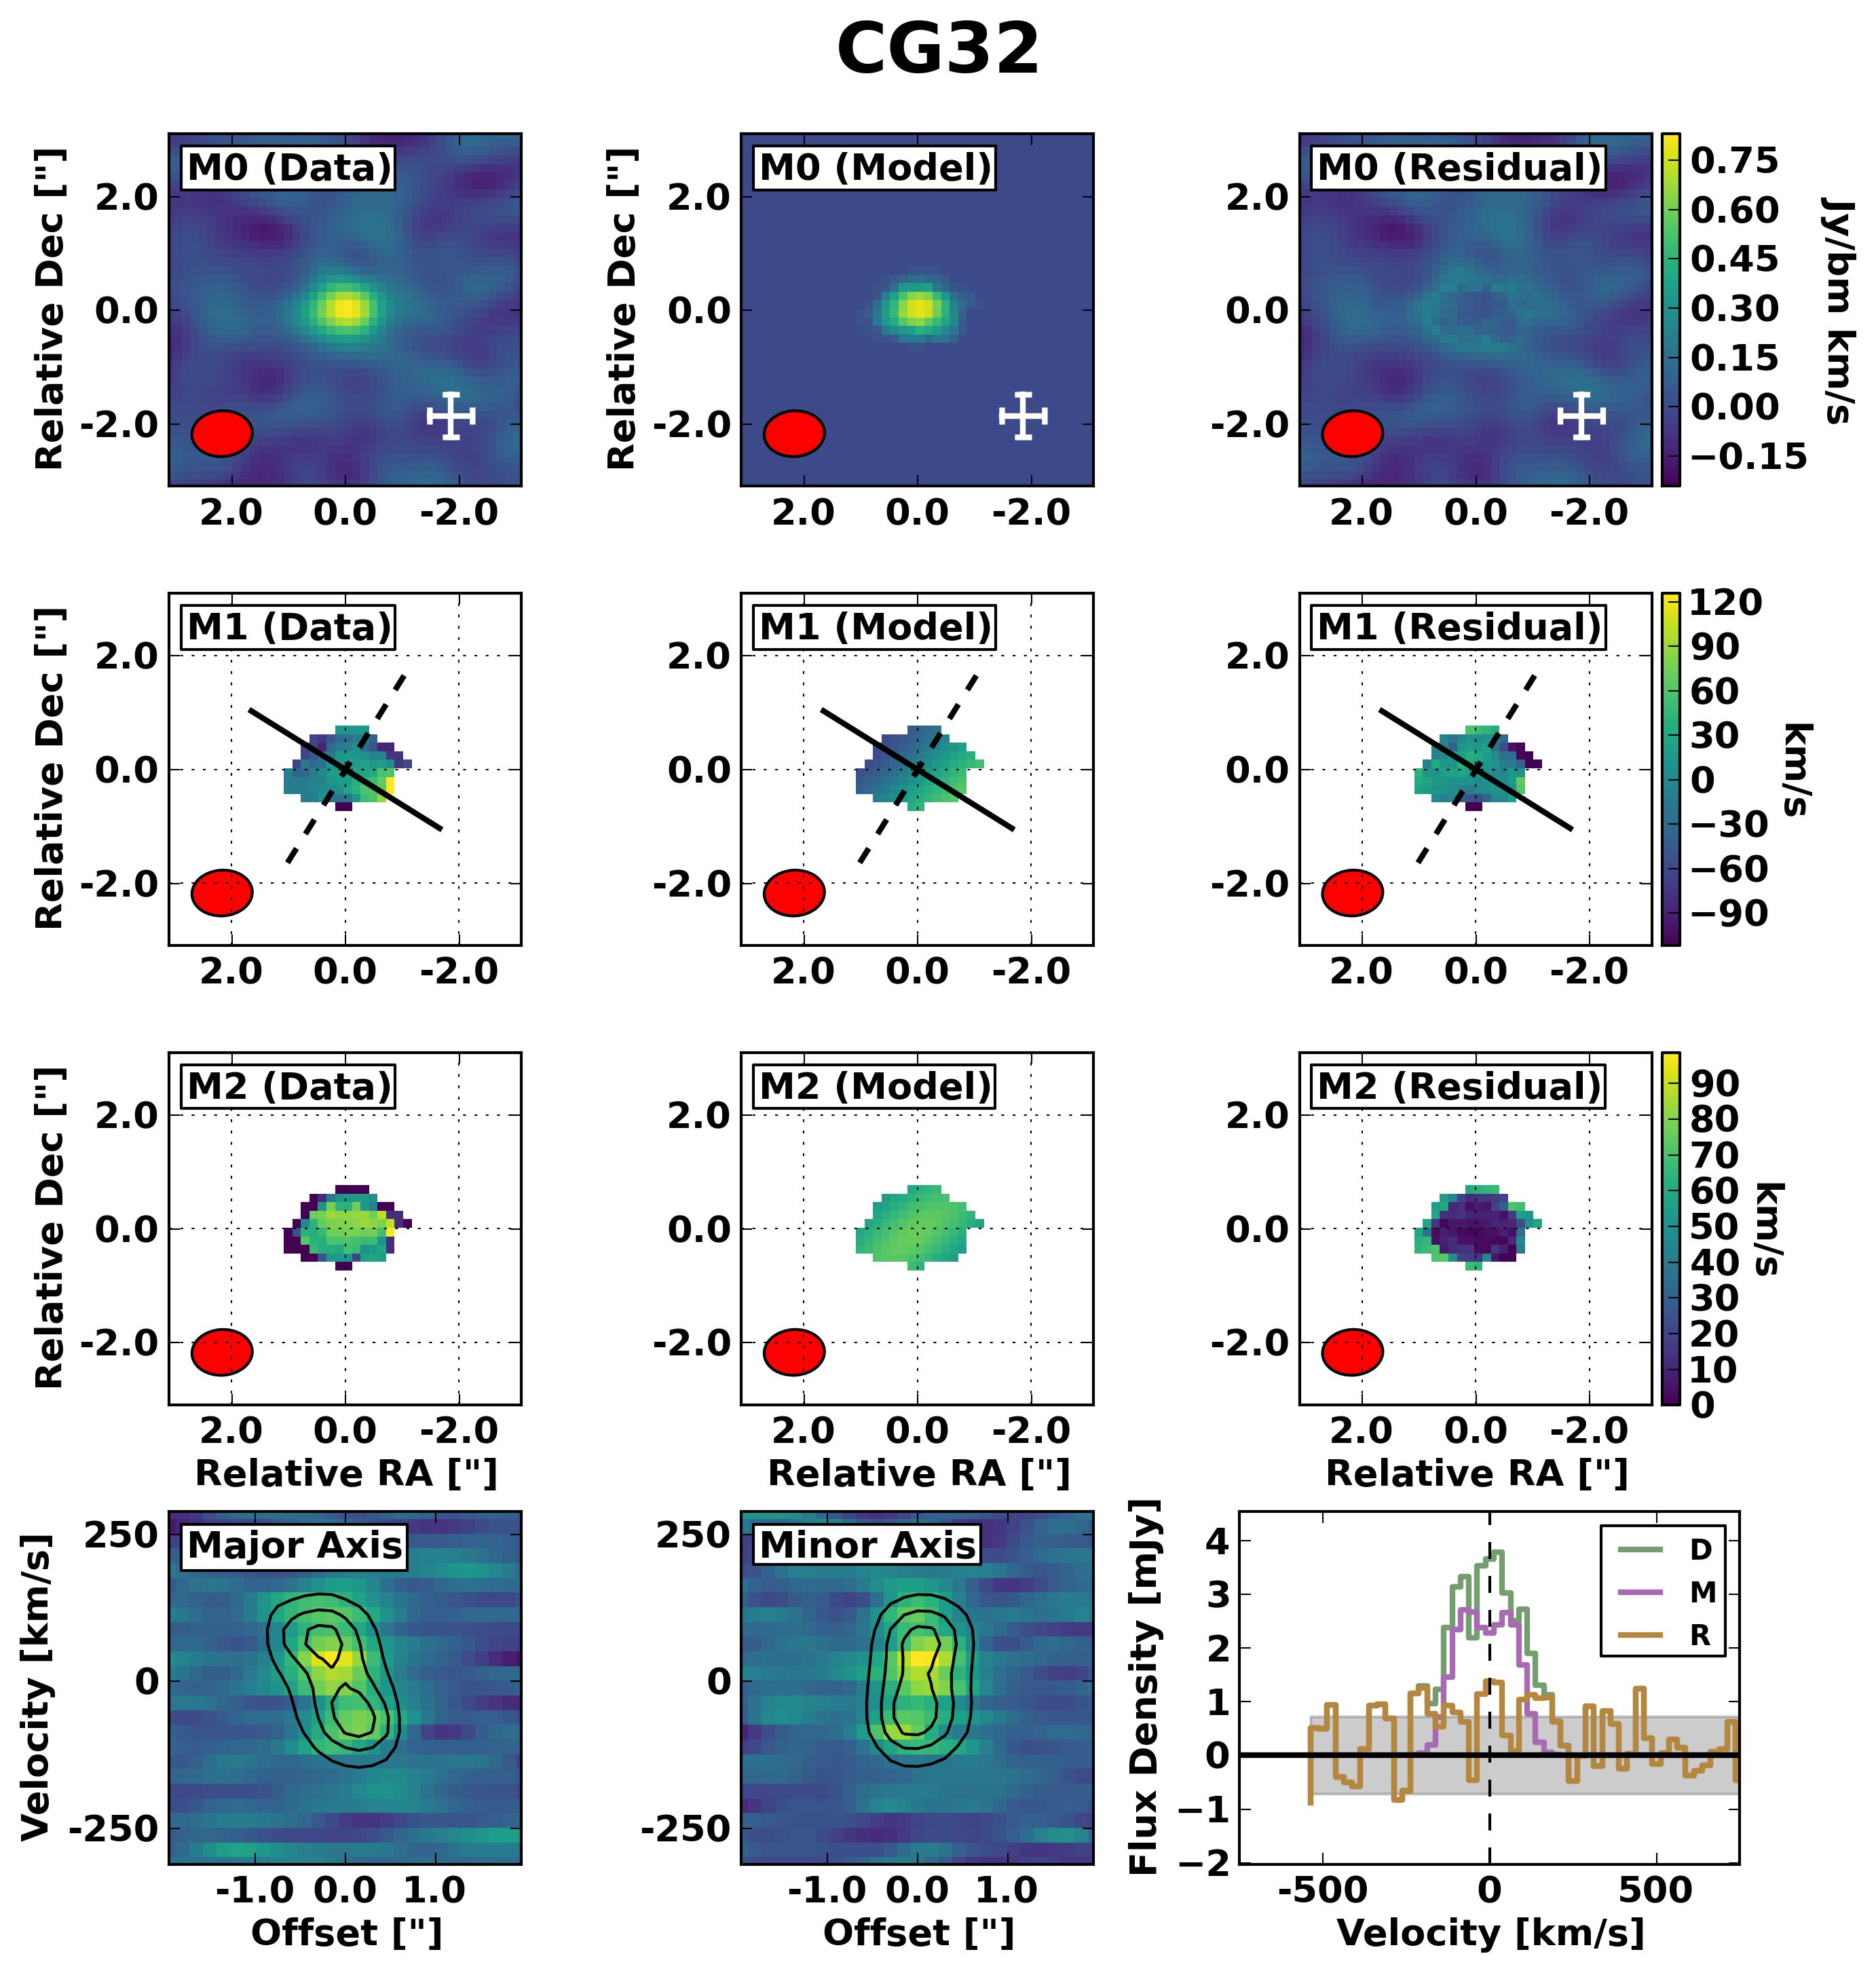
CANDELS GOODS 32 (ROT): Originally classified as a merger, we can see that the observed velocity field shows a strong, but not perfectly symmetric, gradient (Figure 9). The spectral residuals are quite low, the best-fit model is rotation-dominated, and four of the W15 criteria are met, so there is strong evidence that this source is a rotator.
DEIMOS COSMOS 396844 (ROT): Since the major axis of the restoring beam is nearly orthogonal to the observed velocity gradient of this source (Figure 9), its morphological and kinematic position angles are not in agreement (see failure of W15 criterion 4). The model is mostly well fit, adding additional credence to its original classification as a rotator. However, a broad region of residual emission is apparent at km s-1. At first glance, this residual emission may be interpreted as evidence for a broad blueshifted outflow or low-level satellite. But since it is so weak, we suggest that it is only noise. Due to the low residuals of a rotation-dominated model, we agree with the Le Fèvre et al. (2020) classification of a rotator.
DEIMOS COSMOS 417567 (UNC): Due to its complex PVD behaviour (i.e., multiple peaks, no overall trends), this source was originally classified as a merger. This is supported by the poor 3DBarolo fit, where significant residuals exist in every plot (Figure 9). However, we note that this source is one of the weakest in our present sample, and we may simply be experiencing the negative effects of poor SNR. While all W15 criteria besides PA agreement are met, the large residuals and odd appearance of each PVD earn this source a ‘uncertain’ classification.
DEIMOS COSMOS 432340 (UNC): The curved blue half of this galaxy was originally interpreted as evidence for an ongoing merger. 3DBarolo returns a reasonable rotation-dominated fit, and all five W15 criteria are met. However, the morphology of this source is quite disturbed, and the minor axis PVD shows a ‘C’-shape (Figure 9). The SNR of this source is too low to definitely classify it as an ongoing merger, a galaxy with an outflow, or a low-SNR well-ordered rotating disk, so we classify this source as ‘uncertain’.
DEIMOS COSMOS 434239 (MER): With a double intensity peak and unique PVD, this source was originally classified as a merger. We note that this source returns the same W15 criteria as DC552206 (a rotator), while the two galaxies show drastically different morpho-kinematics, highlighting the need to examine the morpho-kinematics of each source in multiple ways. The large residuals in the velocity field and spectrum, as well as the poor match in the major axis PVD (Figure 10), cause us to classify this source as a merger.
DEIMOS COSMOS 454608 (UNC): The double-peaked major axis PVD originally earned this galaxy the classification of merger, but our 3DBarolo fits are inconclusive (Figure 10). The tilted ring model returns large moment one residuals, and a positive-velocity clump is included by SEARCH, making interpretation difficult. This clump may be excluded by adopting a higher SNRlower threshold, but then this source is too compact to be fit by rings, and so the fit fails. Due to the low-SNR and low spatial resolution, we classify this source as ‘uncertain’.
DEIMOS COSMOS 494057 (ROT): This source is nearly a perfect example of a rotator, with only small residuals in the moment zero and two maps and spectrum, and well-fit PVDs (Figure 10). We do note that the moment one map shows residuals around the perimeter of the source, but this is likely due to the low-SNR of these regions. In addition, the morphological and kinematic position angles disagree (resulting in a failure of W15 criterion four), but this is likely due to the near-unity axis ratio (or low inclination) of the source.
DEIMOS COSMOS 519281 (UNC): While most sources in the present sample show monotonic velocity gradients, DC519281 features a central blueshifted region flanked by two redshifted components (Figure 1). This may be interpreted as evidence for a counterrotating merger (see Q1623-BX528 in Förster Schreiber et al. 2006). However, the small spatial extent of this source makes physical interpretation impossible, and 3DBarolo returns a poor fit. Of the five Wisnioski et al. (2015) criteria, this source only meets the second (v), agreeing that this is not a rotator. We also note that when applying SEARCH, the standard lower SNR of 2.5 returned a noise peak to the southwest, so we applied a SNRlower of 2.7 for this source. While the complex velocity field of this source could be interpreted as evidence for ongoing merging activity, the low resolution and SNR of this source cause us to classify it as uncertain.
DEIMOS COSMOS 552206 (ROT): The redshift of each source in the ALPINE sample was taken from previous UV spectroscopic observations. However, the velocity difference between these redshifts and those of [CII] may be substantial (i.e., up to km s-1, see Cassata et al. 2020 for details and physical interpretation). In the case of DC552206, this velocity shift caused the [CII] line to fall on the edge of an ALMA sideband, resulting in an incomplete line profile (Figure 10). However, since the observed profile features a prominent velocity gradient (seen in the moment 1 map and major axis PVD), 3DBarolo is still able to fit an agreeable model, suggesting that this source is truly a rotator, rather than a merger, as suggested previously. Of course, a follow-up observation containing the blue edge of this line should be conducted to confirm this.
DEIMOS COSMOS 627939 (UNC): This source was originally classified as a merger, mainly due to its complex PVDs. 3DBarolo returns a reasonable fit, which reproduces the primary velocity gradient, as well as the overall shape of each PVD (Figure 11). The returned W15 criteria are identical to those of DC396844 and DC494057, which are both classified as rotators. However, substantial residuals are present in both the velocity map and spectrum, hinting at ongoing merging below our spatial resolution. Since we can neither fit a rotating disk model nor distinguish multiple components, we classify this source as ‘uncertain’.
DEIMOS COSMOS 683613 (UNC): While this source was originally classified as an extended dispersion-dominated galaxy, further examination of the [CII] moment maps and PVDs presented in Figure 11 show that the [CII] appears to mainly emanate from a central source, with a weaker, blue, compact source to the south. The dominant source is moderately well fit by a tilted ring model, and appears to be a weaker version of the dispersion-dominated source DC848185. However, since it is not clear if the southern component is evidence of merging or simply noise, we classify this as uncertain.
DEIMOS COSMOS 733857 (UNC): With no obvious velocity gradient (resulting in a failure of W15 criterion one) and a poorly fit rotation-dominated model, (Figure 11) this source is unlikely to be a rotator. It was originally classified as an extended, dispersion-dominated galaxy, but since it is only marginally resolved and features a complex major-axis PVD, we classify it as uncertain.
DEIMOS COSMOS 773957 (UNC): As a relatively weak, spatially compact source, this source is difficult to characterize. The integrated spectrum is moderately well fit, but each of the PVDs show that the 3DBarolo fit is obviously not sufficient (Figure 11). The present observations are insufficient to determine whether this morpho-kinematic complexity is noise or truly signal. Therefore, we classify this as ‘uncertain’.
DEIMOS COSMOS 818760 (MER): As previously explored in detail (Jones et al., 2020), DC818760 is most likely a system of three galaxies undergoing a merger. The two dominant galaxies are closely related in both space and velocity, and an east-west monotonic velocity gradient is evident (Figure 12). Due to our relatively low resolution, a tilted ring model is able to replicate the flux density distribution, overall velocity gradient, and velocity dispersion of these two merging sources. However, the spectrum shows a significant red residual due to the third galaxy in this system not being captured by the fit, the model velocity dispersion and rotational velocity are nearly identical at all radii (Figure 2), and the spectral width of the eastern galaxy is poorly captured. So while this good fit highlights the ambiguity of close mergers and rotating disks, we conclude that this source is a triple merger.
DEIMOS COSMOS 848185 (DIS): Also known as HZ6 (Capak et al., 2015) or LBG-1 (Pavesi et al., 2019), this source exhibits strong [CII] emission, but little evidence for rotation (Figure 12). However, 3DBarolo still returns an excellent fit, with a large velocity dispersion (see also Figure 2). Thus, we agree that this source is extended and dispersion-dominated.
DEIMOS COSMOS 873321 (MER): Originally described as a merger in Capak et al. (2015, called HZ8), DC873321 features two bright peaks of emission at the same velocity (Figure 12). 3DBarolo returns a poor fit with comparable rotation velocity and velocity dispersion, strengthening this classification of ‘merger’.
DEIMOS COSMOS 873756 (DIS): Even with the brightest [C II] luminosity in the ALPINE sample, this source shows very little evidence for ordered rotation (Figure 12). Indeed, 3DBarolo is able to fit a dispersion-dominated model, resulting in only small residuals. The two PVDs are identical, with no evident gradient. There is some evidence for extended emission to the west at km s-1, which is also present as blue residuals in the spectrum. It is not clear if this represents a minor merger, an outflow perpendicular to the line of sight, or another feature. Since the main galaxy dominates the field, we conclude that this source is extended and dispersion-dominated.
DEIMOS COSMOS 881725 (ROT): With a strong velocity gradient and central velocity dispersion peak, this source is well fit by 3DBarolo, resulting in low spectral residuals (Figure 13). The moment one residuals are complex, but are mostly nonzero around the low-SNR perimeter. Thus, we agree with the Le Fèvre et al. (2020) classification of a rotator.
VUDS COSMOS 5100537582 (UNC): This source shows little to no velocity gradient, and PVDs along both axes are nearly identical (Figure 13), earning it a Le Fèvre et al. (2020) classification of 3 (extended dispersion-dominated). However, 3DBarolo fits it with a rotation-dominated model, and its W15 values are the same as those of DC733857, an UNC source. Visual inspection of the moment maps and PVDs shows that we lack the sensitivity and velocity resolution to determine the true morpho-kinematics of this source. Due to this ambiguity, we classify this source as ‘uncertain’.
VUDS COSMOS 5100541407 (UNC): With a significant extension to the northeast (Figure 13) and a number of W15 criteria failures, VC.1407 is difficult to characterize. 3DBarolo fits a moderately dispersion-dominated model, which results in significant residuals. Its extended morphology earned it a merger classification by Le Fèvre et al. (2020), but we classify it as ‘uncertain’.
VUDS COSMOS 5100559223 (UNC): This source is quite weak, as our SEARCH technique includes two single-channel clumps (Figure 13, similarly to DC454608). It was originally classified as an extended dispersion-dominated source, but it is poorly fit with a dispersion-dominated 3DBarolo model and shows a possible velocity gradient in the major axis PVD. Until higher-sensitivity observations are taken, we classify this source as ‘uncertain’.
VUDS COSMOS 5100822662 (MER): Similarly to DC873321, VC.2662 features two components at the same velocity (Figure 14). But unlike this other source, one component (which is the targeted galaxy) dominates the moment zero map. 3DBarolo returns a poor fit, adding further evidence that this is a merging system.
VUDS COSMOS 5100994794 (UNC): 3DBarolo returns a rotation-dominated model (see passed W15 criterion two), and the residuals are low, so it is possible that this source is a rotator, rather than the previous classification of an extended dispersion-dominated galaxy. In addition, the set of W15 criteria are identical to those of DC552206, a rotator. However, its major-axis PVD shows a broad region of red emission that dominates the velocity gradient (Figure 14), and while the model is rotation-dominated at small radii, it is dispersion-dominated at large radii. Thus, we classify it as ‘uncertain’
VUDS COSMOS 5101209780 (MER): The moment zero map of this source is qualitatively similar to that of VC.2662: a dominant source to the southwest, with a secondary source to the northeast (Figure 1). However, here the targeted ALPINE source is the subdominant [CII] emitter. The [CII] emission is relatively well-fit with a rotation-dominated tilted ring model, but the discrepancies in each PVD reveal the underlying merger nature of this source. Its kinematics and other properties are investigated in depth in Ginolfi et al. (2020b).
VUDS COSMOS 5101218326 (DIS): Similarly to DC873756, this source is quite luminous in [CII], and the 3DBarolo fit strongly suggests an extended dispersion-dominated galaxy (Figure 1). In addition, nearly all W15 criteria fail, strongly arguing against rotation.
VUDS COSMOS 510786441 (UNC): With an elongated morphology and disturbed major axis PVD, VC.6441 was originally classified as a merger. However, 3DBarolo fits a marginally rotation-dominated model to this source (Figure 14), and the W15 criteria are similar to rotators in the sample (e.g., DC552206). Examination of the PVDs shows that the underlying morpho-kinematics are too complex to be classified as a rotator, but our observations are too low-resolution to unambiguously classify this as a merger. We thus classify it as ‘uncertain’.
VUDS COSMOS 5110377875 (ROT): This source is perhaps the best case of an ordered rotator in the current sample, but it is not quite ideal (Figure 1). While the spectral and moment zero residuals are low, the velocity dispersion peak is not coincident with the intensity peak, the major axis PVD is not symmetric across km s-1, and the velocity field residuals are significant. As suggested by Fujimoto et al. (2020), these discrepancies may be caused by interaction with an extended halo or an extended outflow. Despite these imperfections, we classify this as a rotator.
VUDS COSMOS 5180966608 (UNC): VC.6608 is one of the most mysterious sources in the ALPINE sample. On one hand, its spectrum is well fit by a high-velocity dispersion tilted ring model, suggesting a single, extended source (Figure 14). However, the two intensity peaks evident in the major axis PVD are nearly coincident with point sources in HST /ACS F814W, Subaru i+, and Subaru r+ images (Faisst et al., 2020). These point sources may indicate the bright cores of closely interacting galaxies or may be caused by a dense screen of dust blocking the central rest-frame optical continuum emission. The FIR continuum emission peaks between these two point sources, but extends over both of them. High-resolution spectral line imaging of this source is required to determine its nature. Until then, we classify this as ‘uncertain’.
VUDS ECDFS 530029038 (UNC): Similarly to other sources, VE.9038 features a significant velocity offset between its [CII] and UV spectral line redshifts (Cassata et al., 2020). Instead of shifting the [CII] profile to the edge of a sideband, this emission is shifted to the intersection of the two SPWs that compose the sideband (Figure 15). Due to the bandpass shape of ALMA SPWs, a few edge channels at the edge of each SPW must be flagged. This extra flagging occasionally creates gaps in frequency coverage between bands, as seen here, where the central few channels of the [CII] profile are flagged. These missing channels at v km s-1 have an interesting effect, as the resulting moment 1 map is less smoothed in frequency, and the velocity gradient therefore appears more pronounced than it would with full velocity coverage. Despite this mostly cosmetic feature, 3DBarolo is able to fit a rotating disk model to the [CII] emission. However, the large velocity residual on the red half, and the incomplete velocity coverage mean that additional observations must be made before this source is characterized.
Appendix C Best-Fit Profiles of Rotators
| R | ||||
|---|---|---|---|---|
| Source | [kpc] | [km s-1] | [km s-1] | [] |
| CG32 | 1.17 | |||
| 3.5 | ||||
| DC396844 | 1.25 | |||
| 3.75 | ||||
| DC494057 | 1.04 | |||
| 3.13 | ||||
| DC552206 | 1.11 | |||
| 3.32 | ||||
| 5.53 | ||||
| DC881725 | 1.15 | |||
| 3.44 | ||||
| VC.7875 | 1.28 | |||
| 3.84 | ||||
| J0817 | 0.95 | |||
| 2.84 | ||||
| HZ9 | 0.54 | |||
| 1.61 | ||||
| 2.68 |