Enhancing Scientific Papers Summarization with Citation Graph
Abstract
Previous work for text summarization in scientific domain mainly focused on the content of the input document, but seldom considering its citation network. However, scientific papers are full of uncommon domain-specific terms, making it almost impossible for the model to understand its true meaning without the help of the relevant research community. In this paper, we redefine the task of scientific papers summarization by utilizing their citation graph and propose a citation graph-based summarization model (CgSum) which can incorporate the information of both the source paper and its references. In addition, we construct a novel scientific papers summarization dataset Semantic Scholar Network (SSN) which contains 141K research papers in different domains and 661K citation relationships. The entire dataset constitutes a large connected citation graph. Extensive experiments show that our model can achieve competitive performance when compared with the pretrained models even with a simple architecture. The results also indicates the citation graph is crucial to better understand the content of papers and generate high-quality summaries. Our code and dataset are available on https://github.com/ChenxinAn-fdu/CGSum
Introduction
Text summarization is to automatically compress a document into a shorter version preserving a concise description of the content. Most of the previous work focused on News domain (Nallapati et al. 2016; Rush, Chopra, and Weston 2015; Nallapati, Zhai, and Zhou 2016; Zhong et al. 2019), and achieved promising result using the neural encoder-decoder architecture. Although text summarization systems have not been explored too much in other domains, such as scientific papers, they still have broad application prospects.
Generating a good abstract for a scientific paper is a very challenging task, even for a beginner researcher, since the scientific papers are usually longer and full of complex concepts and domain-specific items in specific fields. Cohan et al. (2018) and Xiao and Carenini (2019) leveraged the paper structure information to generate the abstracts for scientific papers. However, their methods dedicate to solving the problem of long document modeling and do not utilize the information of references. As a matter of fact, researchers usually write an abstract of a paper by referring some examples. Especially a large number of papers on the same topic are often similar in content. Reasonable use of the information of reference papers may help us solve the scientific papers summarization task. To generate better summary for a scientific paper, Yasunaga et al. (2019) integrated the formation of the source paper and the papers which cite the source papers. However, the citing papers appeared after the source paper, so we tend to think that this task does not help a research to draft an abstract when the paper has not been cited yet.
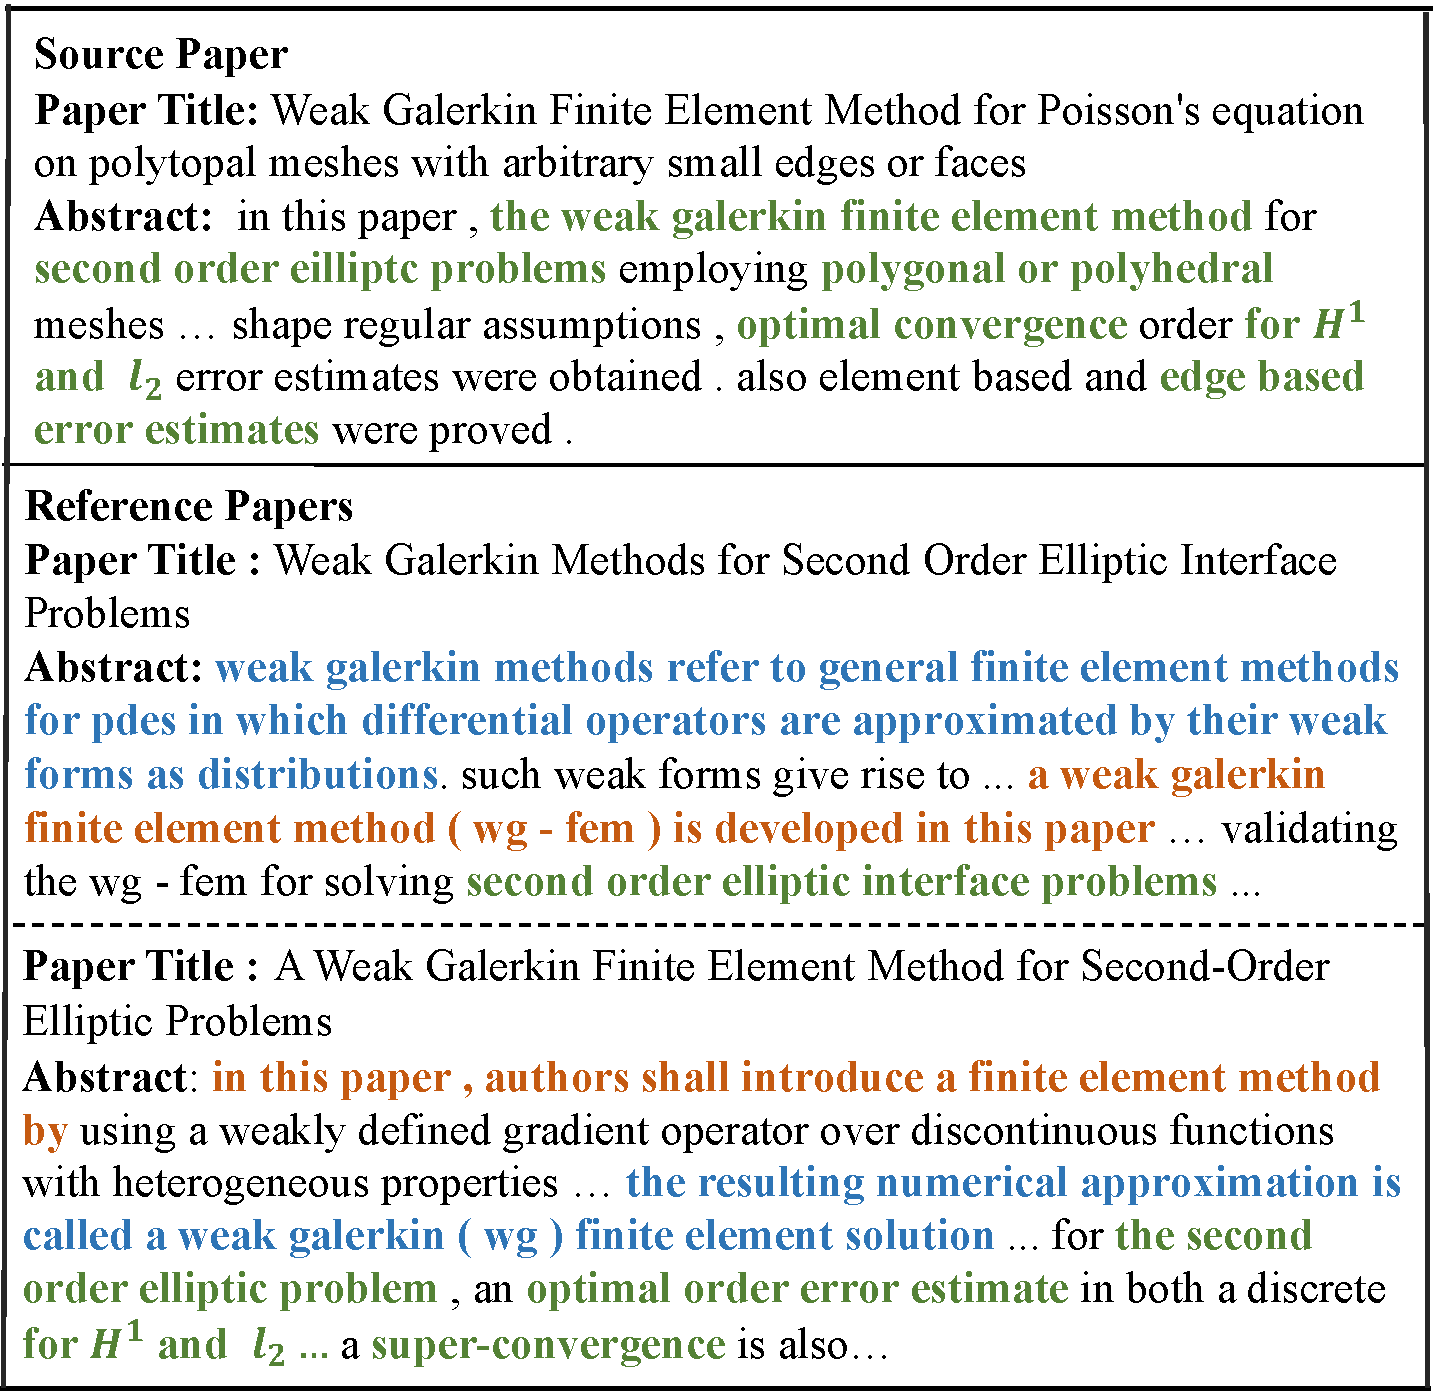
In this paper, we highlight the importance of the citation graph and believe that it can assist in generating high-quality summaries. Figure 1 shows an example of a small research community consisting of the source paper and several reference papers. They are all about topic Weak Galerkin Finite Element Method and are thus very similar in content, logic, and writing style. For instance, many uncommon domain-specific terms (green text) are shared in these papers, it is almost impossible for the model to understand the true meaning of these concepts without sufficient descriptions, so naturally, we should encourage the models to learn from the reference papers. The same expression always has different writing styles (orange text) in different papers, even some academic definitions that do not appear in the original text can be found in other papers (blue text), this relevant information will undoubtedly help the model to better understand the entire research community.
Motivated by the above observations, we augment the task of scientific papers summarization with citation graph. While generating the abstract of a source paper, the summarization systems are able to refer to papers in the same research community. Considering that all current large-scale scientific summarization datasets do not provide citation relationships between papers, we construct a scientific papers summarization dataset Semantic Scholar Network (SSN) which contains 141K papers and 661K citation relationships extracted from the Semantic Scholar Open Research Corpus (S2ORC) (Lo et al. 2020). Notably, our dataset is a huge connected citation graph, and each paper has class labels denoting its research field. We divide the enhanced summarization task into 2 settings: (1) transductive: during training, models can access to all the nodes and edges in the whole dataset including papers (excluding abstracts) in the test set. (2) inductive: papers in the test set are from a totally new graph which means all test nodes cannot be used during training.
Further, we propose a citation graph-based summarization model (CgSum). which incorporates the document and relevant citation graph when generating summaries. For each source paper, we obtain its corresponding research community by sampling a subgraph from the whole citation graph. We firstly encode the content of the source paper and utilize a graph encoder to capture the information of the subgraph. Finally, a decoder combines all the features outputted by the two encoders to produce the final summary. Additionally, we introduce a novel ROUGE credit method, which can instruct the model how to write summaries with the help of other papers’ abstract in the same research community. Although our model only uses BiLSTM and GNN structures, experimental results show that it achieves the competitive performance when compared with the pretrained model. We summarize our contributions as follows:
-
•
We augment the task of scientific papers summarization by introducing the citation graph.
-
•
We construct a large-scale summarization dataset SSN. To our best knowledge, this is the first large-scale scientific papers summarization dataset with citation graph.
-
•
We propose a citation graph-based summarization model to solve the enhanced task of scientific papers summarization, which can incorporate the source paper information and the features of the citation graph at the same time.
Datasets Source # Pairs Doc. Length Sum. Length # Sections Train Val Test # Words # Sent. # Words # Sent. CNN News 90,266 1,220 1,093 760.5 34.0 45.7 3.6 - DailyMail News 196,961 12,148 10,397 653.3 29.3 54.7 3.9 - ScisummNet Scientific Papers 1009 – – 4203.4 178.0 150.7 7.4 6.5 arXiv† Scientific Papers 215,913 6440 6436 4938.0 206.3 220.0 9.6 5.9 PubMed† Scientific Papers 119,924 6633 6658 3016.0 86.4 203.0 6.9 5.6 SSN (inductive) Scientific Papers 128,400 6123 6276 5072.3 290.6 165.1 6.4 10.8 SSN (transductive) 128,299 6250 6250
Related Work
Summarization with Graph Structures
Early approaches for extractive summarization, such as TextRank (Mihalcea and Tarau 2004), have taken advantage of graph structures by building the connectivity graph with inter-sentence cosine similarity. As for the neural systems ,Wang et al. (2020) construct a heterogeneous graph network to model the relations between different semantic units. On abstractive system, inspired by the great success of Graph Attention Networks (GATs) (Veličković et al. 2017) in NLP, Song et al. (2018) proposed the task of text generation from graph and Koncel-Kedziorski et al. (2019) design a GATs-based transformer encoder to generate summary with the help of knowledge graphs extracted from scientific texts. For the combination of text and graph, Fernandes, Allamanis, and Brockschmidt (2018) incorporates the regular document encoder with graph neural networks to make use of both the input sequence and graph structure, and Zhu et al. (2020); Huang, Wu, and Wang (2020) built a knowledge graph from the input document and integrated it into the decoding process. Instead of directly generating abstract from the graph, our model uses the graph-enhanced encoder, viewing the citation graph as complementary information.
Scientific Papers Summarization
Automatic summarization for scientific papers has been studied for decades. Previous work mainly focused on the content of document (Luhn 1958; Cohan and Goharian 2018) and most of them are extractive (Teufel and Moens 2002; Xiao and Carenini 2019). For instance, Cohan et al. (2018) propose a neural model under the sequence-to-sequence framework with the discourse structure of scientific papers. These methods focus on modeling long documents, but ignore the influence of the research community it belongs to. Another direction is citation summarization (Qazvinian and Radev 2008; Cohan and Goharian 2018; Yasunaga et al. 2019), which can make use of the reference relationship between papers. Citation summarization aims to generate the summary of a source Paper according to the papers citing it. Although we can improve the quality of summary for a paper with its citation information, it cannot help authors to draft the summary while writing paper. Different to citation summarization, we generate the summary of the source paper by utilizing its reference papers as background knowledge. In our setting, the papers citing the source paper are not visible during the process of writing a summary.
Semantic Scholar Network (SSN) Dataset
Many scientific summarization datasets have emerged in recent years. The most commonly used scientific datasets, arXiv and PubMed (Cohan et al. 2018), focus on long document summarization without providing citation relationships between papers, which undoubtedly ignores the characteristics of the academic domain. Yasunaga et al. (2019) proposes a relatively small dataset containing 1k papers based on The ACL Anthology Network (ANN) (Radev et al. 2013), but they generate summaries using only papers that cite the current paper (i.e., citing papers), which is unreasonable. In view of the above, we construct a large-scale summarization dataset, Semantic Scholar Network (SSN), consists of 141k research papers extracted from Semantic Scholar Open Research Corpus (S2ORC) (Lo et al. 2020). All the papers in SSN form a large connected citation graph, allowing us to make full use of citation relationships between papers.
Dataset Preprocessing
Semantic Scholar Open Research Corpus (Lo et al. 2020) contains 81.1M academic papers from multiple research fields. We only extract papers with full text LaTeX parses (1.5M) which provides us more details about the paper (e.g. section names, boundaries of paragraph/sections). We keep papers whose abstract length is between 50 and 1000, and the body length is between 1000 and 8000. Additionally, papers with less than 4 sections or do not have an Introduction section are also filtered out because they are likely to lose the discourse structure. A Breadth-first search algorithm is applied to get a large connected citation graph. To prevent the graph from being too sparse, we recursively remove papers with only one 1-hop neighbour. We also normalize inline formulas, equations, tables, figures and citation markers with special tokens.
Statistics
SSN has 140,799 nodes and 660,908 edges where most papers come from the fields of mathematical, physics and computer science. Statistics of our dataset and other general datasets are shown in Table 1. CNN/DailyMail (Hermann et al. 2015) is a widely used news dataset, others belong to the scientific field. SSN has the longest text, which brings difficulty to modeling. Meanwhile, it has the most sections, showing that our dataset retains the most complete paper structure possible. Besides, SSN is a connected huge citation graph, indicating that SSN can be used to train some auxiliary tasks such as node classification and link prediction to help models better understand the research community in the whole graph.
Method
In this section, we first define the task of scientific papers summarization with citation graph, then describe our citation graph-based summarization model (CgSum) in detail.
Problem Formalization
Existing document summarization methods usually conceptualize this task as a sequence-to-sequence problem. Given a dataset , each document can be represented as a sequence of words , the objective is to generate a target summary by modeling the conditional distribution .
However, scientific papers have their own characteristics: there are citation relationships between papers, and the content of these papers is logically closely related. Therefore, we introduce the concept of citation graph to strengthen summarization tasks in the scientific domain. We define a citation graph on the whole dataset, which contains scientific papers and citation relationships. Each node represents a scientific paper in the dataset, and each edge indicates the citation relationship between two papers. Notably, when generating the summary of a paper, we cannot rely on the information of the papers that cites this one (because they are later in chronological order), so we extract a subgraph for each node to avoid introducing information that should not be used, the specific method can be seen in Algorithm 1.
Given the source paper (w/o abstract) and the related citation graph (we only use the abstract of other nodes), we need to generate a summary of by modeling the conditional distribution .
Citation Graph-Based Summarization Model
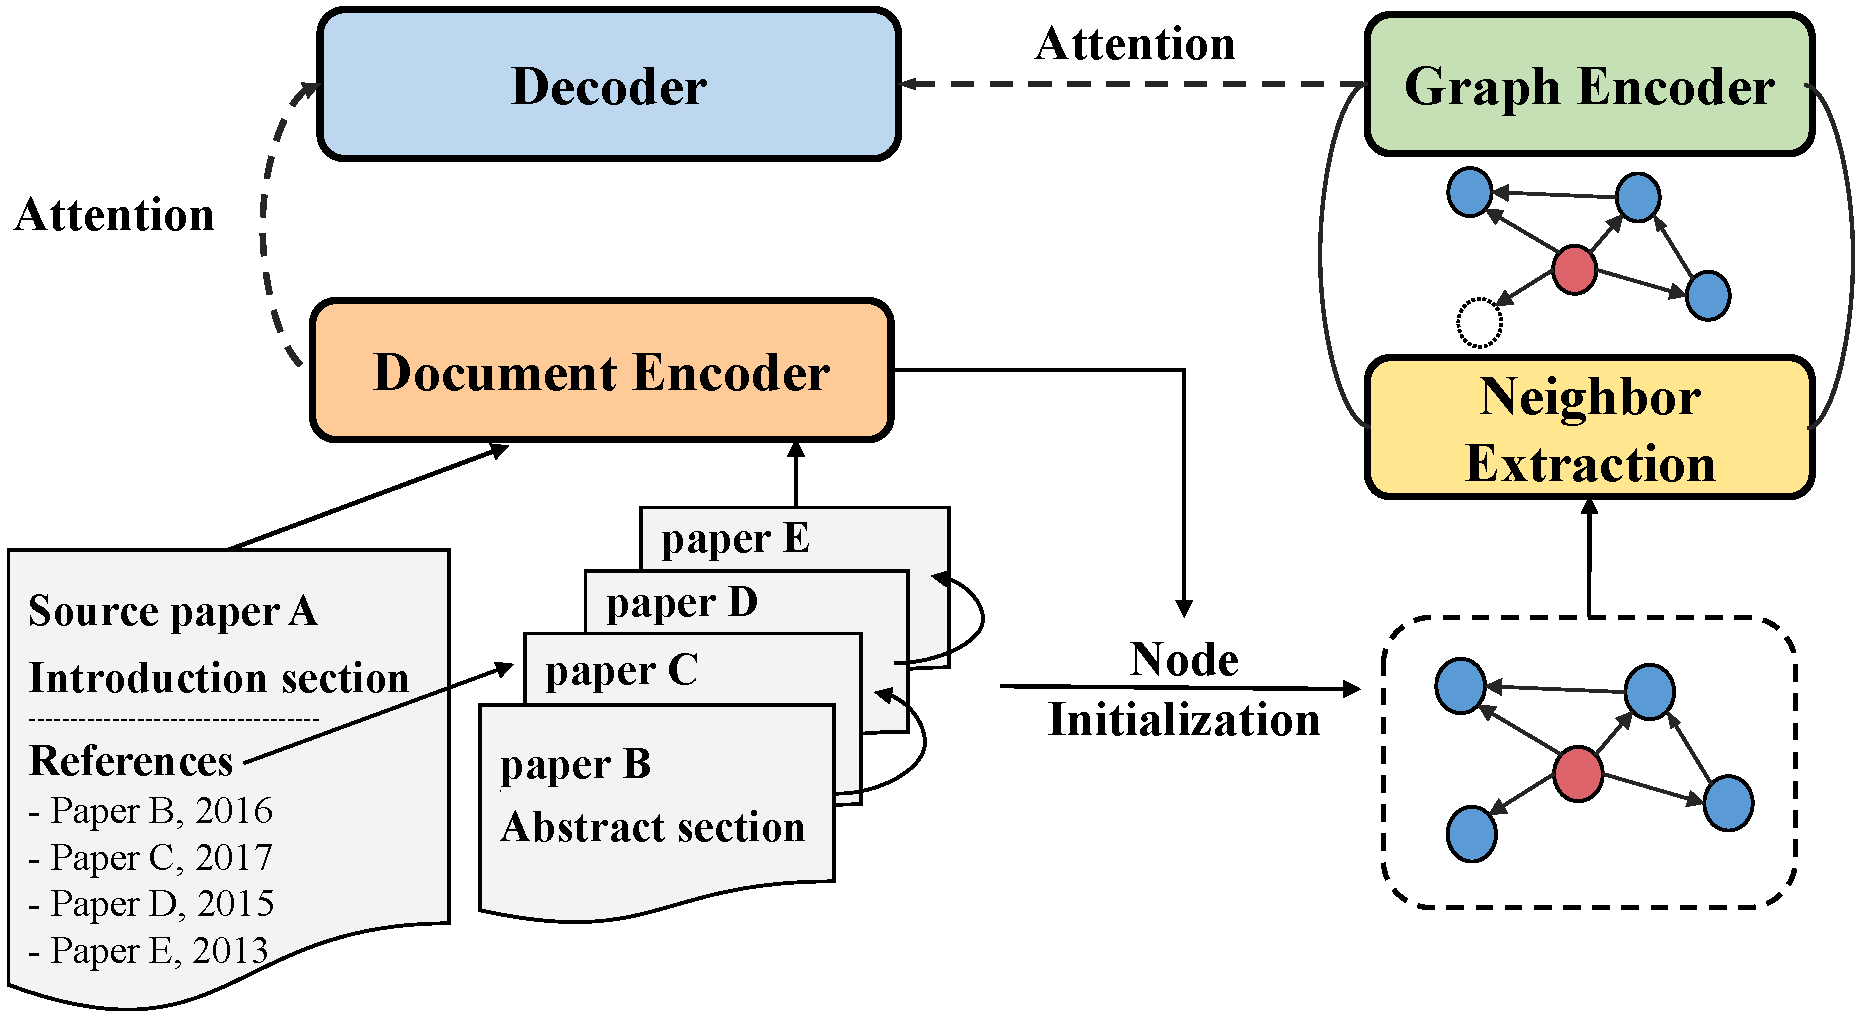
In this part, we illustrate our citation graph-based model (CgSum) as displayed in Figure 2. The key idea is not only to encode the source document , but also to capture the features of the corresponding citation graph to help us generate the summary. Our model consists of document encoder, graph encoder and decoder. In addition, we introduce a novel ROUGE credit approach.
Document Encoder
We employ a single-layer bidirectional LSTM (BiLSTM) to convert the input document to a sequence of hidden representations . We initialize the source node by pooling its hidden representations . For the neighbor nodes , where denotes the input neighborhood of , we feed their abstract to another BiLSTM and obtain the initial representation of node by aggregating the hidden representations of with a pooling layer.
Neighborhood Extraction
For each node , it is too computationally expensive to use the whole citation graph , so it is necessary to sample an informative subgraph. Specifically, we first extract a directed subgraph consisting of the source paper and its -hop neighbors, and add self-loops to for information enhancement. Before feeding to the graph encoder,
we employ a neighborhood extraction method to further extract neighbors by their salience scores with source node :
| (1) |
where , denotes the salience score between and , and is a 3-layers feed forward neural network. We extract the most salient vertices with function to construct the final citation graph . However, directly sampling important nodes corrupts the training of parameters in . To overcome this problem, we follow Huang, Wu, and Wang (2020) and view as an information gate and multiplies to itself, .
Graph Encoder
Given a sampled citation graph and the initial nodes features , we use 2-layers graph attention networks (GAT) (Veličković et al. 2017) to update the representation of each node. Besides, to avoid the gradient vanishing problem, we add residual connections between layers. is represented by the aggregation of its neighbors:
| (2) |
| (3) |
where denotes concatenation of attention heads, and is the normalized attention weight between and computed by the -th attention head, are trainable parameters. Dropout (Hinton et al. 2012) with probability 0.1 is applied in each layer.
Decoder
Our decoder is a single-layer unidirectional LSTM. At each step , the decoder has a hidden state . Previous works (See, Liu, and Manning 2017) employ an attention mechanism to compute the attention distribution over the source words in the sequence-to-sequence structure, and we extend it to the graph structure as:
| (4) |
| (5) |
| (6) |
where , , and are trainable weights. We compute the attention distribution over the nodes in and obtain a graph context vector . Furthermore, on the basis of introducing the features of the citation graph, we still need to pay attention to the source document as:
| (7) |
| (8) |
| (9) |
where , and are trainable parameters. and can be viewed as the aggregated representation of the citation graph and the source document respectively, so we concatenate them with the decoder hidden state to produce the vocabulary distribution :
| (10) |
In addition, to overcome the OOV problem, we allow the decoder to copy words from the source document as proposed by See, Liu, and Manning (2017). The generation probability (i.e. the copying probability ) for step is calculated as:
| (11) |
where denotes the decoder input at time step . Therefore, the probability distribution over the extended vocabulary is:
| (12) |
Obviously, if does not appear in the source document, is equal to zero, and if is an OOV word, is zero. The loss at time step is the negative log likelihood of the target word :
| (13) |
where is the source document and are the parameters of our model. We add an coverage loss to penalize repeatedly attending to the same word in the source document. where Finally the overall loss for the whole sequence is:
| (14) |
where is the hyperparameter to reweight the coverage loss.
ROUGE Credit
Intuitively, the information brought by the citation graph is not only useful during training, but it is also helpful for the model to generate summaries during inference. Motivated by this, we propose a novel ROUGE credit score in beam search algorithm to instruct our model to write summaries with the help of nearby nodes’ abstracts.
Specifically, at the decoding step , we first select the neighbor which has the most influence on the generated summary using function over the attention distribution on the graph . In the beam search process, there are candidate sequences per time step, then we calcaute the ROUGE credit score between the abstract of and as:
| (15) |
| (16) |
where represents the abstract of the selected neighbor, is a weight function corresponding to the decoding step and is a hyperparameter (if the credit score will take more weight). We design by simply modifying the sentence brevity penalty function in BLEU (Papineni et al. 2002), which makes the final generated summary neither bias towards the abstract of neighbor nodes, nor focus on the words selected by the model on the vocabulary. At last, the total score of the -th candidate summary is given by the sum of its average log likelihood and . In our experiments, we calculate this credit every 5 steps as a trade-off to decoding time.
Experiments
Dataset
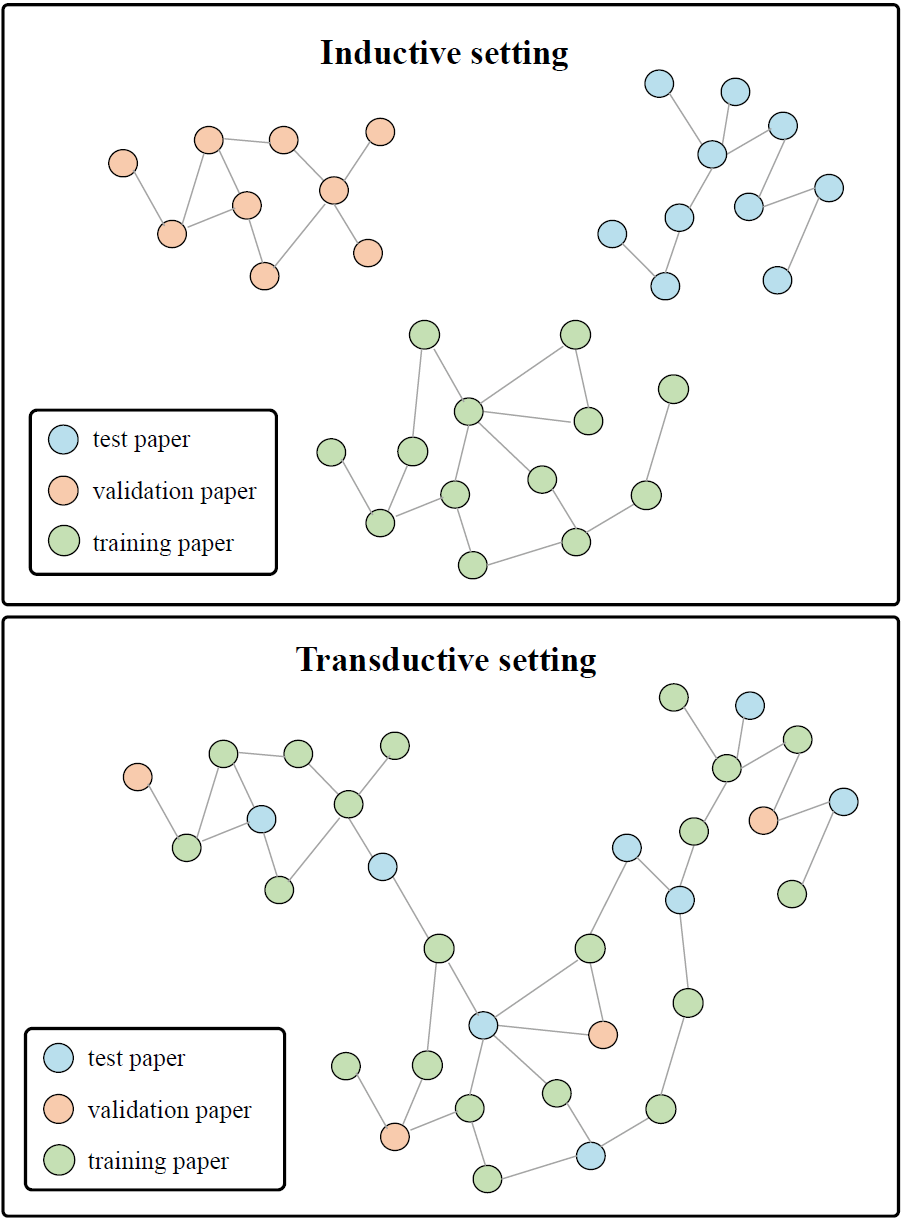
We evaluate our model on our Semantic Scholar Network dataset. Details about our dataset is shown in Table 1. We lowercase all tokens and tokenize sentence and word using spaCy (Honnibal and Johnson 2015). As is shown in Figure 3, for SNN (transductive) we randomly choose 6,250/6250 papers from the whole dataset as test/validation sets and the remaining 128,299 papers are classified as training set which is the most commonly way to split the dataset. The transductive division indicates that most neighbors of papers in test set are from the training set, but considering that in real cases, the test papers may from a new graph which has nothing to do with papers we used for training, thus we introduce SNN (inductive), by splitting the whole citation graph into three independent subgraphs – training, validation and test graphs with the breadth first search algorithm. The training/validation/test graphs in inductive setting contain 128,400/6,123/6,276 nodes and 603,737/17,221/14,515 edges. In both inductive and transducitve setting, the summary of papers in the test set and validation set are kept invisible during the training phase. Our inductive setting also has the intention to test whether models trained in a large-scale citation graph has the ability to transfer to another citation graph. Therefore, the inductive setting of our task is thought more difficult.
Training Details and Parameters
We use hyperparameters suggested by See, Liu, and Manning (2017) in the BiLSTM model. The word embeddings layer is trained from scratch without using any pretrained language models and embeddings. We use mini-batches of size 16 and we limit the input document length to 500 tokens. The input citation graph includes the source paper and its -hop neighbors ( = 1, 2), and we initialize the node representation with body text of source papers and the abstract of neighbors. We constrain the maximum number of papers in an input graph to 64. We implement graph attention network with Deep Graph Library (Wang et al. 2019) and the number of attention heads is set to 4. We use Adagrad optimizer with learning rate 0.15 and an initial accumulator value of 0.1. We set the beam size to 5 and to 75 in the ROUGE credit, and the ROUGE (Lin 2004) score used is the value of ROUGE-1 . We do not train the model with coverage loss in the first epoch to help the model converge faster, and we train our model for 10 epochs and do validation every 2000 steps. We select the best checkpoint based on the ROUGE-L score on the validation set.
Baseline Methods
We provide the LEAD baseline which extracts the first (depending on the number of sentences in the reference summary) sentences from the source document and Oracle as an upper bound of extractive summarization systems. We use a greedy algorithm following Nallapati, Zhai, and Zhou (2016) to generate an oracle summary. Since we truncate the document to 500 tokens,Oracle in this paper is calculated on the truncated datasets.
Besides, we implement the following extractive systems: (1) TextRank (Mihalcea and Tarau 2004): an unsupervised extractive system based on the graph structure (2) TransformerExt: an extractive system based on transformer encoders (3) BertSumExt (Liu and Lapata 2019): an extractive summarization model with BERT. We further add the following abstractive baseline models: (1) PTGen+Cov (See, Liu, and Manning 2017): an abstractive summarization system with copy mechanism. (2) TransformerAbs: an abstractive summarization model based on transformer (3) BertSumAbs(Liu and Lapata 2019): an abstractive summarization system built on BERT. We employ trigram blocking (Paulus, Xiong, and Socher 2017) to reduce redundancy for both the baseline systems and our models.
Experimental Results
| Systems | R-1 | R-2 | R-L |
| Oracle | *51.04* | 23.34 | *45.88 * |
| LEAD | 28.29 | 5.99 | 24.84 |
| Extractive | |||
| TextRank | 36.36 | 9.67 | 32.72 |
| TransformerExt | 43.14 | 13.68 | 38.65 |
| BertSumExt | 42.41 | 13.10 | 37.97 |
| BertSumExt (mp = 640) | 44.28 | 14.67 | 39.77 |
| Abstractive | |||
| PTGen + Cov | 42.84 | 13.28 | 37.59 |
| Concat Nbr. Summ | 43.05 | 13.53 | 37.97 |
| TransformerAbs | 37.78 | 9.59 | 34.21 |
| TransformerAbs + Copy | 43.35 | 14.87 | 39.17 |
| BertSumAbs | 41.22 | 13.31 | 37.22 |
| BertSumAbs (mp = 640) | 43.73 | 15.05 | 39.46 |
| Concat Nbr. Summ (mp=640) | 43.45 | 14.89 | 39.27 |
| Our Model | |||
| CgSum + 1-hop Nbr. | 44.36 | 14.69 | 39.43 |
| CgSum + 2-hop Nbr. | 44.28 | 14.75 | 39.76 |
| Systems | R-1 | R-2 | R-L |
| Oracle | *50.12* | 23.31 | *45.29 * |
| LEAD | 28.30 | 6.87 | 24.93 |
| Extractive | |||
| TextRank | 40.81 | 12.81 | 36.47 |
| TransformerExt | 41.45 | 13.02 | 37.20 |
| BertSumExt | 41.68 | 13.31 | 37.42 |
| BertSumExt (mp = 640) | 43.23 | 14.59 | 38.91 |
| Abstractive | |||
| PTGen + Cov | 39.46 | 12.06 | 35.72 |
| Concat Nbr. Summ | 40.12 | 12.58 | 35.94 |
| TransformerAbs | 36.58 | 10.19 | 33.13 |
| TransformerAbs + Copy | 40.83 | 14.71 | 36.93 |
| BertSumAbs | 40.38 | 14.07 | 36.54 |
| BertSumAbs (mp = 640) | 41.92 | 15.09 | 37.79 |
| Concat Nbr. Summ (mp=640) | 41.11 | 14.50 | 37.16 |
| Our Model | |||
| CgSum + 1-hop Nbr. | 43.10 | 14.90 | 39.10 |
| CgSum + 2-hop Nbr. | 43.45 | 14.71 | 38.89 |
Reusult on SSN
We evaluate summarization quality with the standard ROUGE score (Lin 2004) where R-1 and R-2 represent informativeness and R-L represents fluency. Table 2,3 show the results on our dataset. Several well-known extractive and abstractive baselines as well as models that make use of pretrained language model BERT (Devlin et al. 2018) using their open-sourced implementations are shown in the second and third part. Besides, to better compare our model with the baseline models, for each abstractive baseline we give an additional Concat Nbr. Summ version whose input is the concatenation of source document and the neighbors’ abstracts separated by a special token [SEP] following the general setting in multi-documents summarization. In our experiments, we are surprised to find that TransformerAbs performs poorly on our dataset, but it will be significantly improved if we further add copy mechanism.
Although BERT has achieved the state-of-the-art performance in the News domain (Zhong et al. 2020), it has not shown great advantages in the field of scientific papers. We think the main reason here is that BERT has a length limit of 512, but scientific papers are usually much longer than this limit. To solve this issue, we break the constrain on maximum length in BERT by adding more position embeddings which are initialized randomly and finetune them in the training phrase, which brings remarkable improvement for two BERT-based models (BertSumExt and BertSumAbs). In addition, all models have not significantly improved after adding the content of the cited papers (i.e., Concat Nbr. Summ), which shows that the content of the reference papers is not enough.
As can be seen from Table 2,3, in both inductive and transductive settings, CGSum outperforms all the pretrained models in terms of R-1 and R-L metrics. When compared with BertSumAbs (mp = 640), which is also an abstractive model, although our model uses a shorter input sequence (500 vs 640) and a simpler encoder structure (1-layer BiLSTM and 2-layers GAT vs 12-layers pretrained transformers), it still outperforms BertSumAbs (mp = 640). This result fully illustrates a combination of the document information and the features of the citation graph structure can greatly help the model better understand the relevant research community, thereby naturally generating high-quality abstracts. In inductive setting, CGSum beats BERT by 0.63 R-1 score and beats PTGen + Cov by 1.52 R-1 score while CGSum brings more significant improvements in transductive setting (beats BERT by 1.53 R-1 score and beats PTGen + Cov 3.99 R-1 score).
Degree of Source Paper
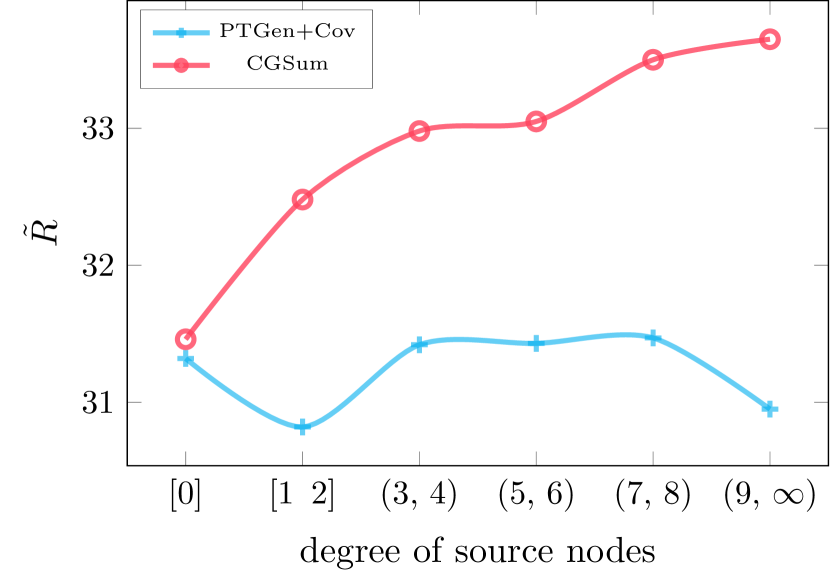
We further explore the relationship between model performance and the degree of the source node. We divide our test set into six parts according to the degree of the node. As is shown in Figure 4, there is no obvious connection between the performance of PTGen + Cov and the degree of the source paper. Notably, PTGen + Cov can be viewed as our model removes the graph encoder, so for the nodes with degree 0, the two models have similar performance. However, as the degree of nodes increases, our model can gradually achieve better performance. This dataset splitting experiment shows that our model is good at handling papers with rich citation graph information, that is to say, an informative and relevant research community is very important for understanding a scientific paper. In inductive setting the average degree of nodes in test set is much smaller than that in transductive setting . This experiment also gives an explanation of why CGSum outperforms other baseline models without using citation graph by a larger margin in the transductive setting.
| Model | R-1 | R-2 | R-L |
| CgSum | 44.36 | 14.69 | 39.43 |
| - Nbr. Extraction | 44.23 | 14.63 | 39.29 |
| - Residual Connection | 44.25 | 14.41 | 38.95 |
| - Trigram Blocking | 43.48 | 14.49 | 38.92 |
| - ROUGE Credit | 43.81 | 14.49 | 38.70 |
| - GNN Encoder | 42.84 | 13.28 | 37.59 |
Ablation Study
To have a better understanding of the contribution of each component in our proposed model, we remove the neighborhood extraction, residual connection, trigram blocking, rouge credit and GNN from the origin model. As shown in Table 4, neighborhood extraction obtains a certain performance improvement because it extracts a more informative subgraph. Residual connection and trigram blocking have been proven to work well in previous work, and they are also effective in our task. Besides, our proposed ROUGE credit method significantly improve the performance on R-1 and R-L because of the shared domain-specific terms and the similar writing style among papers in the same research community. Finally, if we remove the GNN encoder, our model actually become PTGen + Cov.
Conclusion
In this paper, we augment the task of scientific papers summarization with the citation graph. Specifically, summarization systems can not only use the document information of the source paper, but also find the useful information from the corresponding research community from citation graph to generate the final abstract. Different to the previous work, we aim to help researchers draft a paper abstract by utilizing its references, rather than the papers citing it. We construct a large-scale scientific summarization dataset which is a huge connected citation graph with 141K nodes and 661K citation edges. We also design a novel citation graph-based model which incorporates the features of a paper and its references. Experiments show the effectiveness of our proposed model and the important role of citation graphs for scientific paper summarization.
Acknowledgements
We would like to thank the anonymous reviewers for their valuable suggestions. This work was supported by the National Key Research and Development Program of China (No. 2017YFB1002104).
References
- Cohan et al. (2018) Cohan, A.; Dernoncourt, F.; Kim, D. S.; Bui, T.; Kim, S.; Chang, W.; and Goharian, N. 2018. A discourse-aware attention model for abstractive summarization of long documents. arXiv preprint arXiv:1804.05685 .
- Cohan and Goharian (2018) Cohan, A.; and Goharian, N. 2018. Scientific document summarization via citation contextualization and scientific discourse. International Journal on Digital Libraries 19(2-3): 287–303.
- Devlin et al. (2018) Devlin, J.; Chang, M.-W.; Lee, K.; and Toutanova, K. 2018. Bert: Pre-training of deep bidirectional transformers for language understanding. arXiv preprint arXiv:1810.04805 .
- Fernandes, Allamanis, and Brockschmidt (2018) Fernandes, P.; Allamanis, M.; and Brockschmidt, M. 2018. Structured neural summarization. arXiv preprint arXiv:1811.01824 .
- Hermann et al. (2015) Hermann, K. M.; Kocisky, T.; Grefenstette, E.; Espeholt, L.; Kay, W.; Suleyman, M.; and Blunsom, P. 2015. Teaching machines to read and comprehend. In Advances in neural information processing systems, 1693–1701.
- Hinton et al. (2012) Hinton, G. E.; Srivastava, N.; Krizhevsky, A.; Sutskever, I.; and Salakhutdinov, R. R. 2012. Improving neural networks by preventing co-adaptation of feature detectors. arXiv preprint arXiv:1207.0580 .
- Honnibal and Johnson (2015) Honnibal, M.; and Johnson, M. 2015. An Improved Non-monotonic Transition System for Dependency Parsing. In Proceedings of the 2015 Conference on Empirical Methods in Natural Language Processing, 1373–1378. Lisbon, Portugal: Association for Computational Linguistics. doi:10.18653/v1/D15-1162. URL https://www.aclweb.org/anthology/D15-1162.
- Huang, Wu, and Wang (2020) Huang, L.; Wu, L.; and Wang, L. 2020. Knowledge Graph-Augmented Abstractive Summarization with Semantic-Driven Cloze Reward. arXiv preprint arXiv:2005.01159 .
- Koncel-Kedziorski et al. (2019) Koncel-Kedziorski, R.; Bekal, D.; Luan, Y.; Lapata, M.; and Hajishirzi, H. 2019. Text Generation from Knowledge Graphs with Graph Transformers. In Proceedings of the 2019 Conference of the North American Chapter of the Association for Computational Linguistics: Human Language Technologies, Volume 1 (Long and Short Papers), 2284–2293. Minneapolis, Minnesota: Association for Computational Linguistics. doi:10.18653/v1/N19-1238. URL https://www.aclweb.org/anthology/N19-1238.
- Lin (2004) Lin, C.-Y. 2004. Rouge: A package for automatic evaluation of summaries. In Text summarization branches out, 74–81.
- Liu and Lapata (2019) Liu, Y.; and Lapata, M. 2019. Text summarization with pretrained encoders. arXiv preprint arXiv:1908.08345 .
- Lo et al. (2020) Lo, K.; Wang, L. L.; Neumann, M.; Kinney, R.; and Weld, D. S. 2020. S2ORC: The Semantic Scholar Open Research Corpus. In Proceedings of the 58th Annual Meeting of the Association for Computational Linguistics, 4969–4983.
- Luhn (1958) Luhn, H. P. 1958. The automatic creation of literature abstracts. IBM Journal of research and development 2(2): 159–165.
- Mihalcea and Tarau (2004) Mihalcea, R.; and Tarau, P. 2004. Textrank: Bringing order into text. In Proceedings of the 2004 conference on empirical methods in natural language processing, 404–411.
- Nallapati, Zhai, and Zhou (2016) Nallapati, R.; Zhai, F.; and Zhou, B. 2016. Summarunner: A recurrent neural network based sequence model for extractive summarization of documents. arXiv preprint arXiv:1611.04230 .
- Nallapati et al. (2016) Nallapati, R.; Zhou, B.; Gulcehre, C.; Xiang, B.; et al. 2016. Abstractive text summarization using sequence-to-sequence rnns and beyond. arXiv preprint arXiv:1602.06023 .
- Papineni et al. (2002) Papineni, K.; Roukos, S.; Ward, T.; and Zhu, W.-J. 2002. BLEU: a method for automatic evaluation of machine translation. In Proceedings of the 40th annual meeting of the Association for Computational Linguistics, 311–318.
- Paulus, Xiong, and Socher (2017) Paulus, R.; Xiong, C.; and Socher, R. 2017. A Deep Reinforced Model for Abstractive Summarization. arXiv preprint arXiv:1705.04304 .
- Qazvinian and Radev (2008) Qazvinian, V.; and Radev, D. R. 2008. Scientific paper summarization using citation summary networks. arXiv preprint arXiv:0807.1560 .
- Radev et al. (2013) Radev, D. R.; Muthukrishnan, P.; Qazvinian, V.; and Abu-Jbara, A. 2013. The ACL anthology network corpus. Language Resources and Evaluation 47(4): 919–944.
- Rush, Chopra, and Weston (2015) Rush, A. M.; Chopra, S.; and Weston, J. 2015. A neural attention model for abstractive sentence summarization. arXiv preprint arXiv:1509.00685 .
- See, Liu, and Manning (2017) See, A.; Liu, P. J.; and Manning, C. D. 2017. Get To The Point: Summarization with Pointer-Generator Networks. In Proceedings of the 55th Annual Meeting of the Association for Computational Linguistics (Volume 1: Long Papers), 1073–1083.
- Song et al. (2018) Song, L.; Zhang, Y.; Wang, Z.; and Gildea, D. 2018. A Graph-to-Sequence Model for AMR-to-Text Generation. In Proceedings of the 56th Annual Meeting of the Association for Computational Linguistics (Volume 1: Long Papers), 1616–1626. Melbourne, Australia: Association for Computational Linguistics. doi:10.18653/v1/P18-1150. URL https://www.aclweb.org/anthology/P18-1150.
- Teufel and Moens (2002) Teufel, S.; and Moens, M. 2002. Summarizing scientific articles: experiments with relevance and rhetorical status. Computational linguistics 28(4): 409–445.
- Veličković et al. (2017) Veličković, P.; Cucurull, G.; Casanova, A.; Romero, A.; Lio, P.; and Bengio, Y. 2017. Graph attention networks. arXiv preprint arXiv:1710.10903 .
- Wang et al. (2020) Wang, D.; Liu, P.; Zheng, Y.; Qiu, X.; and Huang, X. 2020. Heterogeneous Graph Neural Networks for Extractive Document Summarization. arXiv preprint arXiv:2004.12393 .
- Wang et al. (2019) Wang, M.; Yu, L.; Zheng, D.; Gan, Q.; Gai, Y.; Ye, Z.; Li, M.; Zhou, J.; Huang, Q.; Ma, C.; Huang, Z.; Guo, Q.; Zhang, H.; Lin, H.; Zhao, J.; Li, J.; Smola, A. J.; and Zhang, Z. 2019. Deep Graph Library: Towards Efficient and Scalable Deep Learning on Graphs. ICLR Workshop on Representation Learning on Graphs and Manifolds URL https://arxiv.org/abs/1909.01315.
- Xiao and Carenini (2019) Xiao, W.; and Carenini, G. 2019. Extractive Summarization of Long Documents by Combining Global and Local Context. In Proceedings of the 2019 Conference on Empirical Methods in Natural Language Processing and the 9th International Joint Conference on Natural Language Processing (EMNLP-IJCNLP), 3002–3012.
- Yasunaga et al. (2019) Yasunaga, M.; Kasai, J.; Zhang, R.; Fabbri, A. R.; Li, I.; Friedman, D.; and Radev, D. R. 2019. Scisummnet: A large annotated corpus and content-impact models for scientific paper summarization with citation networks. In Proceedings of the AAAI Conference on Artificial Intelligence, volume 33, 7386–7393.
- Zhong et al. (2020) Zhong, M.; Liu, P.; Chen, Y.; Wang, D.; Qiu, X.; and Huang, X. 2020. Extractive Summarization as Text Matching. In Jurafsky, D.; Chai, J.; Schluter, N.; and Tetreault, J. R., eds., Proceedings of the 58th Annual Meeting of the Association for Computational Linguistics, ACL 2020, Online, July 5-10, 2020, 6197–6208. Association for Computational Linguistics. URL https://www.aclweb.org/anthology/2020.acl-main.552/.
- Zhong et al. (2019) Zhong, M.; Liu, P.; Wang, D.; Qiu, X.; and Huang, X.-J. 2019. Searching for Effective Neural Extractive Summarization: What Works and What’s Next. In Proceedings of the 57th Annual Meeting of the Association for Computational Linguistics, 1049–1058.
- Zhu et al. (2020) Zhu, C.; Hinthorn, W.; Xu, R.; Zeng, Q.; Zeng, M.; Huang, X.; and Jiang, M. 2020. Boosting factual correctness of abstractive summarization with knowledge graph. arXiv preprint arXiv:2003.08612 .