The G 305 Star-forming Region: II. Irregular variable stars.
Abstract
We present a catalog of 167 newly discovered, irregular variables spanning a 7 deg2 area that encompasses the G 305 star-forming complex, one of the most luminous giant H II regions in the Galaxy. We aim to unveil and characterize the young stellar object (YSO) population of the region by analyzing the -band variability and infrared colors from the VISTA Variables in the Vía Láctea (VVV) survey. Additionally, SDSS-IV APOGEE-2 infrared spectra of selected objects are analyzed.
The sample show relatively high amplitudes ( mag). Most of them resemble sources with outbursts with amplitude mag and duration longer than a few days, typically at least a year, known as Eruptive Variables. About 60 % are likely to be Class II/Flat/I objects. This is also confirmed by the spectral index when available.
From the analysis of APOGEE-2 near-infrared spectra of sources in the region, another 122 stars are classified as YSOs, and displays some infrared variability. The measured effective temperature peak is around 4000K and they are slightly super-solar in metal abundance. The modal radial velocity is approximately 41 km/s.
Combining available catalogs of YSOs in the region with our data, we investigate the spatial distributions of 700 YSOs. They are clearly concentrated within the central cavity formed by the massive clusters Danks 1 and 2. The calculated surface density for the entire catalog is 0.025 YSOs/pc-2, while the central cavity contains 10 times more objects per area (0.238 YSOs/pc-2).
1 Introduction
Since stars in formation or in very early stages of evolution undergo rapid structural changes, variations in their luminosity and colours are widely observed. Historically, various types of brightness changes have been noticed in young stellar objects (YSOs). For instance, strong variability may be due to accretion events, while smaller-scale variability may be caused by geometrical effects, such as clearing of dust, spots, and rotation (Audard et al., 2014). FU Orionis stars (FUors; Herbig, 1966) are thought to be pre-main sequence (pre-MS) stars characterized by increases in brightness by 4 magnitudes in optical wavelengths. According to Audard et al. (2014), only about two dozen such sources were known in 2014. EX Lupi-type objects (EXors; Herbig, 1989) show similar brightness increases to FUors, but with shorter timescales. There are still problems in the interpretation of the variety of outburst intensities and timescales for those types of stars.
This variable brightness also can be observed in several stages of the classical model of pre-MS evolution, after the collapse of a molecular cloud has begun. Due to conservation of angular momentum, the infalling matter forms a protostellar disk, through which accretion on to the central source occurs (McKee & Ostriker, 2007; Li et al., 2014). Numerous physical processes are involved in the evolution from a heavily obscured protostar until it reaches the main sequence. The physical origin of the variability could be a consequence of irregular intrinsic changes, such as episodic accretion (Audard et al., 2014), variable extinction induced by their circumstellar disks (e.g., Meyer et al. 1997; Cody et al. 2014; Rebull et al. 2014a), rotational modulation by cool and hot spots on the stellar surface, and the variations in accretion disk/envelope geometry. Massive YSOs, with , likely undergo slightly different accretion and formation processes (Davies et al., 2011; Mottram et al., 2011; Frost et al., 2021). Observations of variability may provide some insight into these processes (Caratti o Garatti et al., 2017).
Rice et al. (2015) determined that the amplitude of brightness variations is correlated with evolutionary class in YSOs. In other words, Class I YSOs are more variable than Class II, which are in turn more variable than Class III. Therefore YSOs at earlier evolutionary stages will be preferentially identified in variability-based searches.
Optical variability was one of the original, defining characteristics of a YSO (Joy, 1945; Herbig, 1952). Therefore, in addition to analysis based on spectroscopy, the colour-magnitude diagram (CMD), and the colour-colour diagram (CCD), the study of photometric variability has been essential to understand the underlying physical processes. Existing time-domain surveys (e.g., the Catalina Real-time Transient Survey (Drake et al., 2009), the Pan-STARRS survey (Kaiser et al., 2002)), the near future Gaia variability releases (Gaia Collaboration et al., 2019) and the Vera C. Rubin Observatory, previously known as the Large Synoptic Survey Telescope (LSST; Ivezić et al., 2019) provide and will continue providing both large area and time-series covering in the optical wavelength regime.
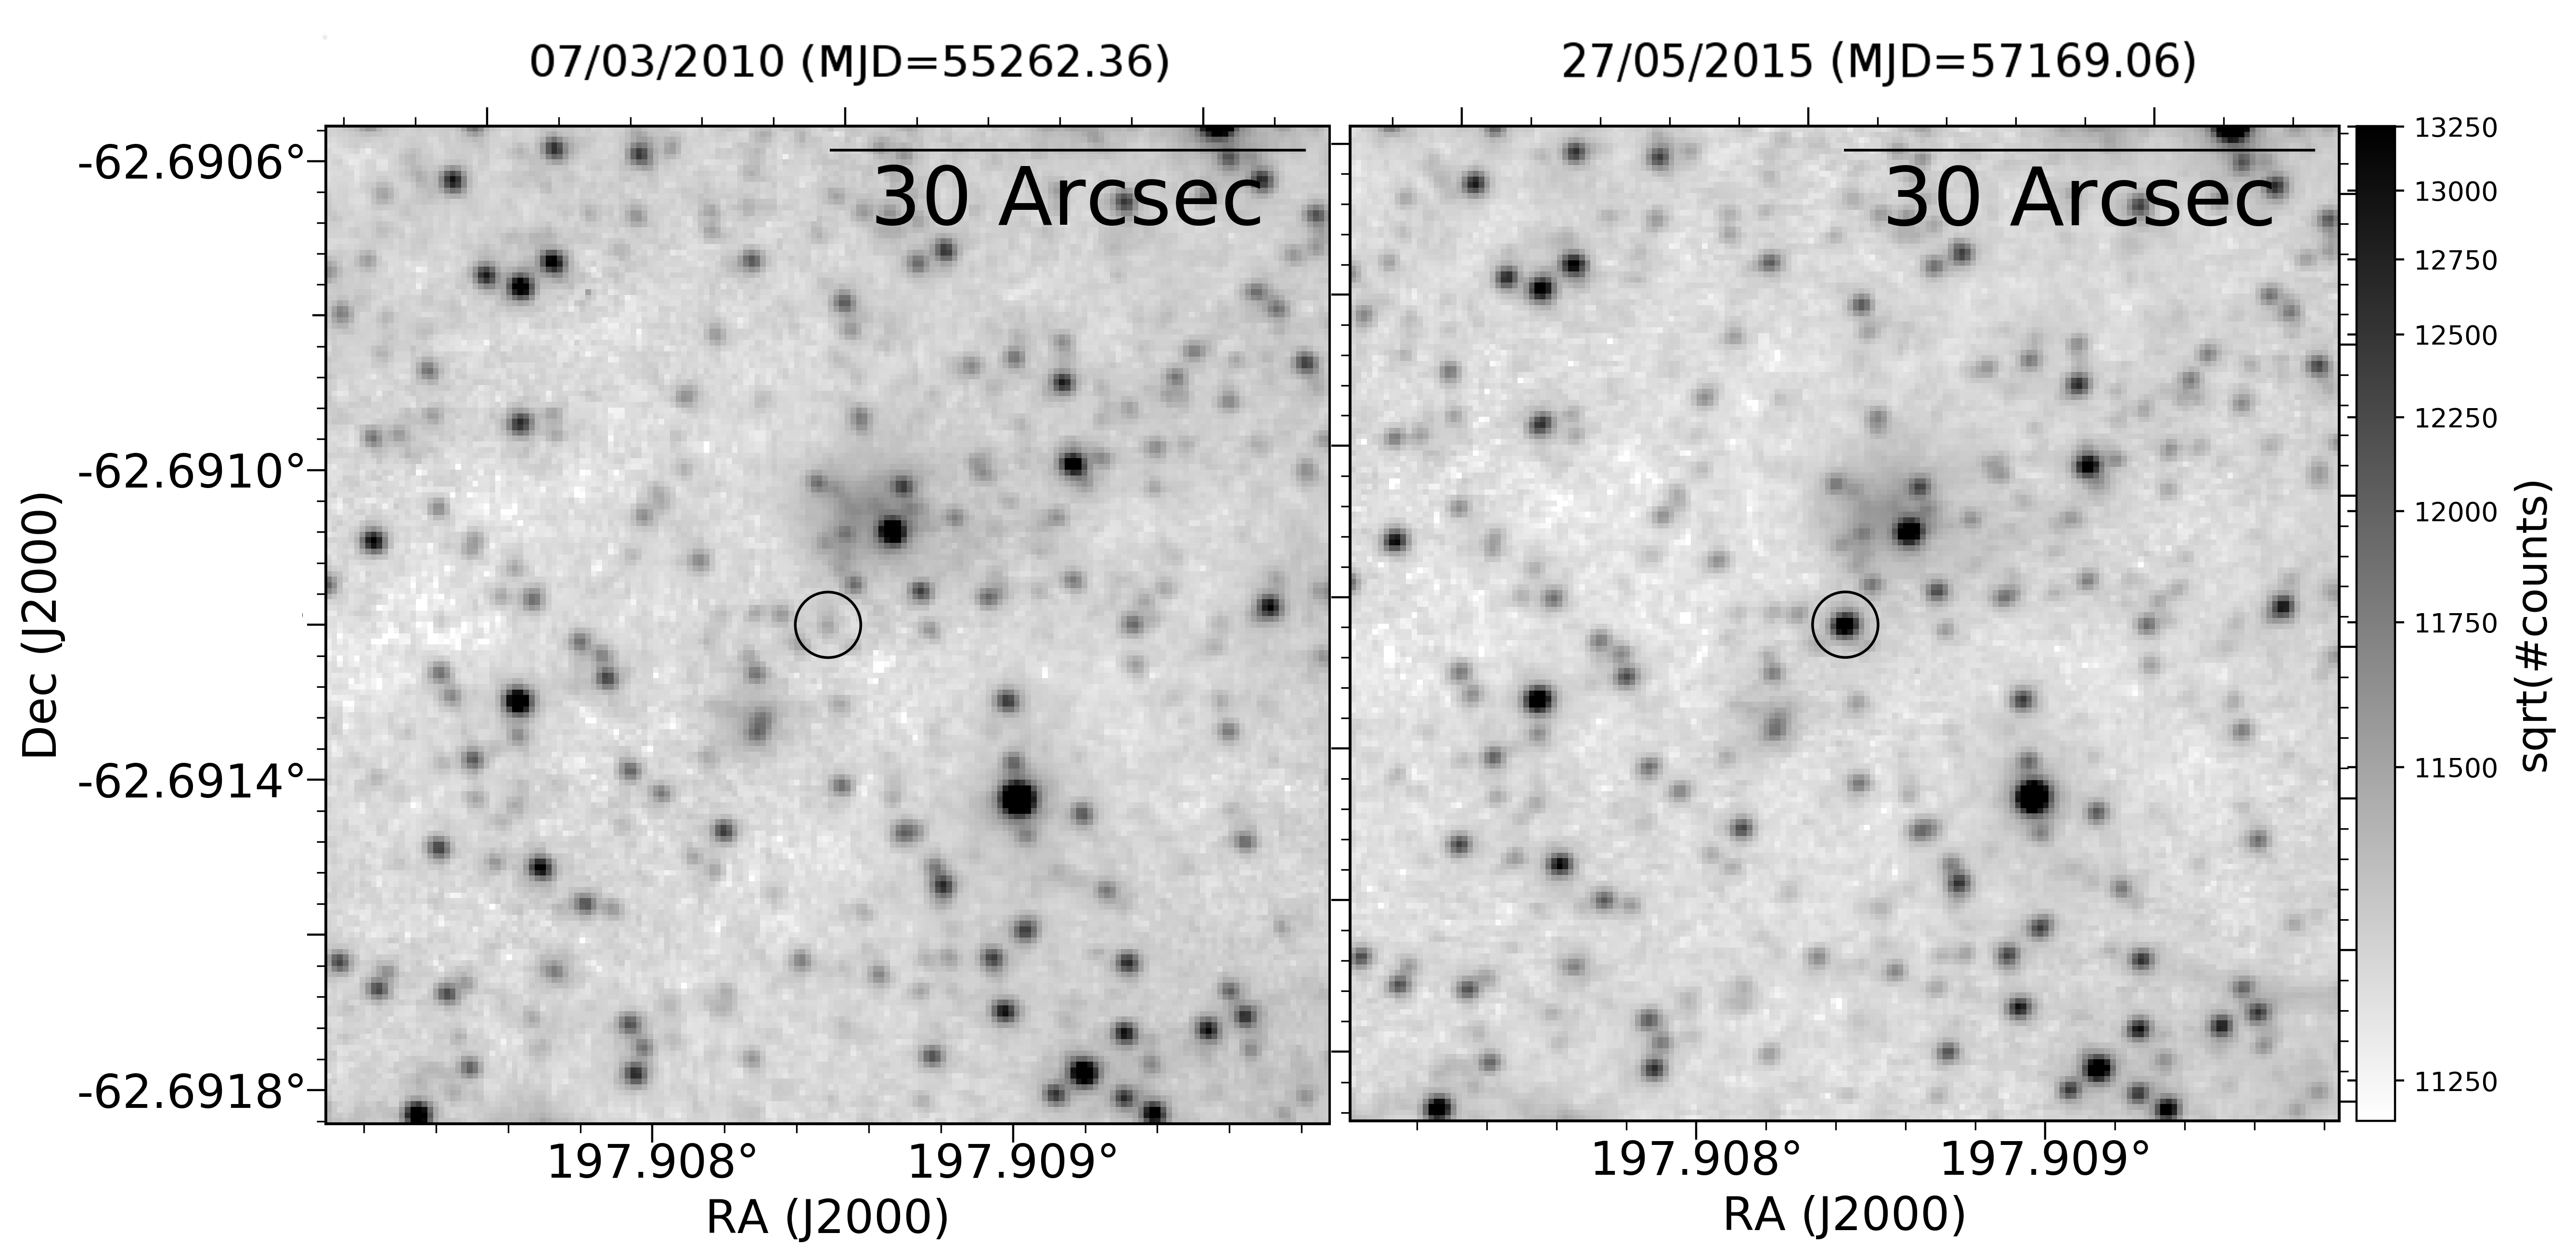
However, the YSOs are often located inside or adjacent to dense molecular clouds (Evans et al., 2009) These clouds of material absorb and re-emit an important amount of the radiation from the young sources. Also, the disks and envelopes of the YSOs themselves are optically thick. Photometric surveys in the mid-infrared (MIR), such as Young Stellar Object VARiability (YSOVAR; Rebull et al., 2014b), or in the near-infrared (NIR) are very useful to minimize the influence of interstellar extinction. One of these NIR surveys is the VISTA Variables in the Vía Láctea survey (VVV; Minniti et al., 2010; Saito et al., 2012) and its undergoing extension, the VISTA Variables in the Vía Láctea Extended survey (VVVX; Minniti, 2018). The VVV survey is fully comparable to the optical ones both in area and time-domain coverage (Arnaboldi et al., 2007) and have been designed to catalogue more than 109 sources, where 106 are expected to be variable stars. VVV is very suitable to characterize the changes along time. Several authors reported objects with considerable amplitudes ( mag; Contreras Peña et al., 2017a) in and bands, and also revealing that variability in the NIR is relatively common in YSOs. According to Rice et al. (2012), out of the 30 YSOs they studied, 28 (93%) are variable. Figure 1 shows an example demonstrating a significant brightness change of the variable source named d084_v8, discovered in this work. The images correspond to different epochs (marked in the top of each image).
1.1 The G 305 region
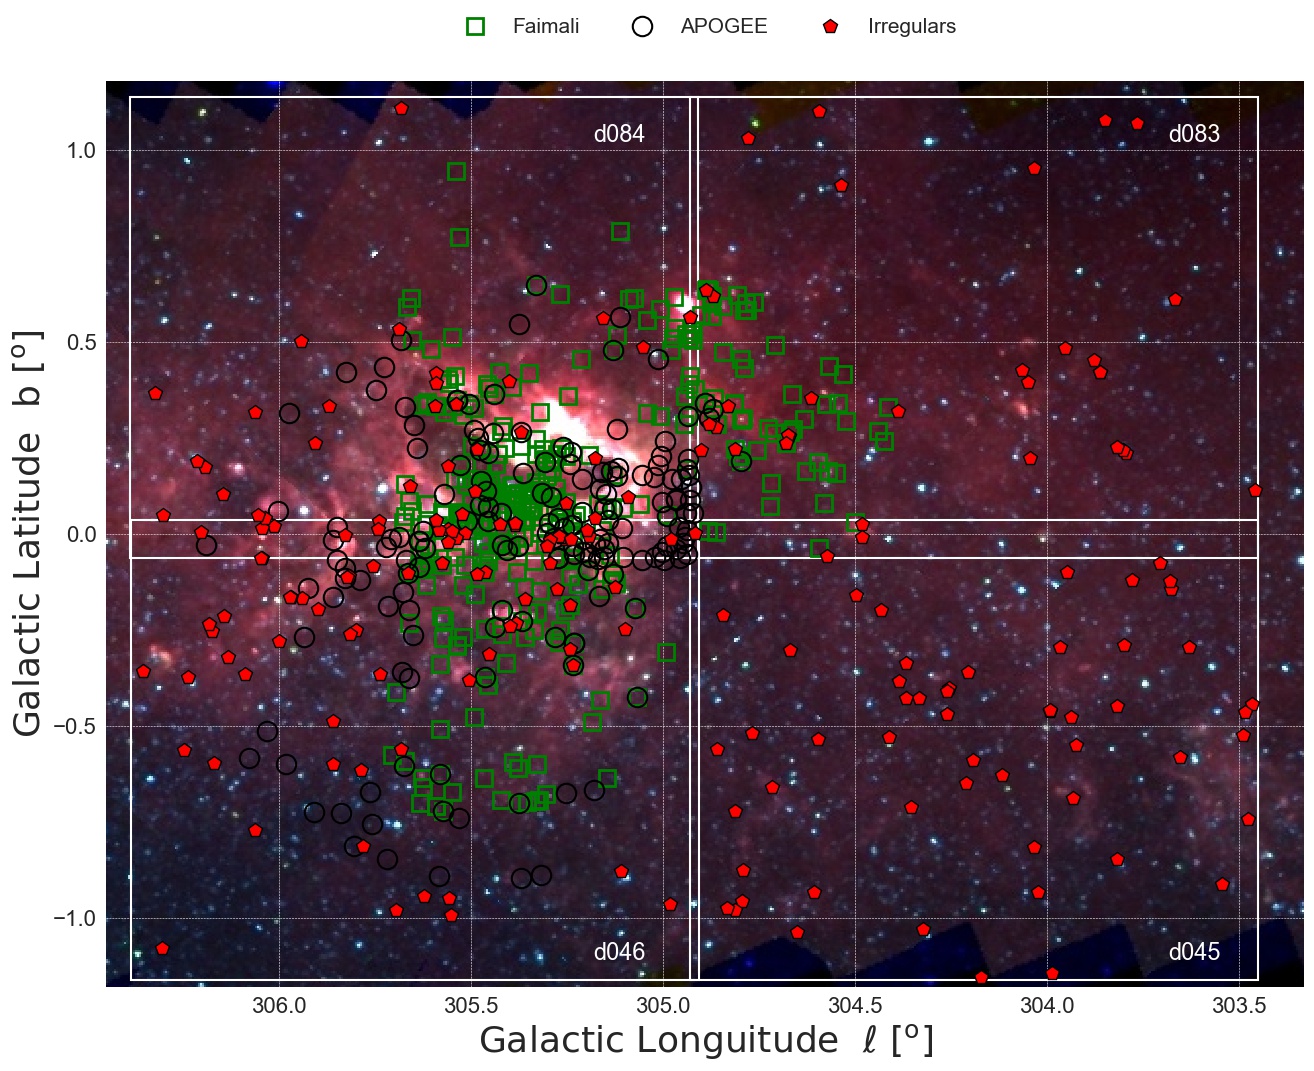
G 305 (Fig. 2) is one of the most massive star-forming regions in our Galaxy, located within the Scutum-Crux arm (in galactic coordinates: , ). Its integrated radio luminosity can be directly comparable to the most luminous giant H II regions of the Galaxy (Conti & Crowther, 2004). G 305 is also a valuable laboratory for studying sequential star formation. According to Clark & Porter (2004), there are at least two different generations of young stars within the G 305 radio complex. The first generation is associated with the massive clusters Danks 1 and 2, which contain many massive OB and Wolf-Rayet stars. The well known Wolf-Rayet star WR48a is projected nearby. The presence of a dusty WCL star implies a minimum age of 3 Myr and the lack of the red supergiants in the region suggests a maximum age of 4-5 Myr. The second generation consists of embedded IR sources, maser emission and ultracompact H II regions (UCHIIs; Hindson et al., 2012). A significant portion of the radio emission comes from the regions which coincide with the periphery of the mid-IR nebula (Clark & Porter, 2004).
This is the second paper of our series on this region. In Borissova et al. (2019), we used moderately high resolution spectroscopy obtained with the Apache Point Observatory Galaxy Evolution Experiment-2 (APOGEE-2; Majewski et al., 2017) spectrograph to study the massive stellar content in the area. We investigated 29 OB type, Wolf-Rayet, and emission-line stars, adding 18 newly identified objects to the existing catalogs. Thus, we improved the census of the hot stellar population in the region. The average spectroscopic and Gaia DR2 distances are obtained as 3.21.6 kpc and 3.71.8 kpc, respectively. The OB stars have a mean radial velocity of RV= . Eight objects show time-series variations in the -bandpass with amplitudes greater than 0.5 mag. All of them, except 2MASS J13113560-6245324 (class 0/I YSO) and 2MASS J13160379-6242218 (OIf*/WN), are B type main sequence stars.
In this paper, we report a new study of the YSO population in the region. A variability search in the NIR -bandpass is performed. Sources are identified as variable stars by their variability indices via analysis of the time-series data of the entire VVV survey period between 2010 and 2015. Spectroscopic follow-up of a sample is performed with the APOGEE-2 spectrograph. Finally, we collated catalogs of YSOs and candidate YSOs from the literature in order to investigate their spatial distribution.
2 Variability search
The VVV is an ESO NIR public survey (Minniti et al., 2010; Saito et al., 2012) which uses the 4-meter VISTA telescope (Sutherland et al., 2015) at Cerro Paranal Observatory, Chile. It was designed for mapping 562 deg2 in the Galactic bulge and the southern disk in five NIR broad-band filters: , , , , and , which has a time coverage spanning over five years, between 2010 and mid-2015. The observations were performed with the VIRCAM NIR camera (Dalton et al., 2006), which is an array of 16 detectors with pixels each. The disk area is divided into 152 observing areas (1.51.2 deg each, called tiles) and the bulge is covered with 196 tiles. Currently, the observed disk and bulge regions are extended by the ongoing VVVX ESO public survey (Minniti, 2018). The multi epoch observations are performed only in . The VVV data were our main source of information for identifying stellar objects with variable brightness.
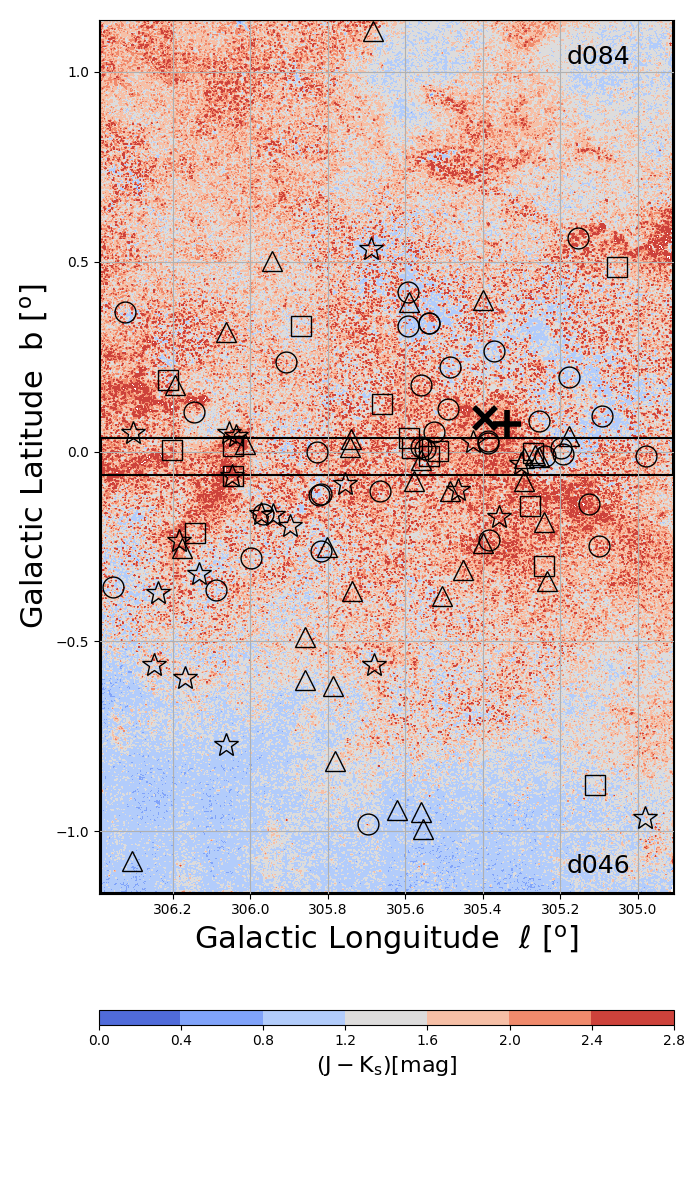
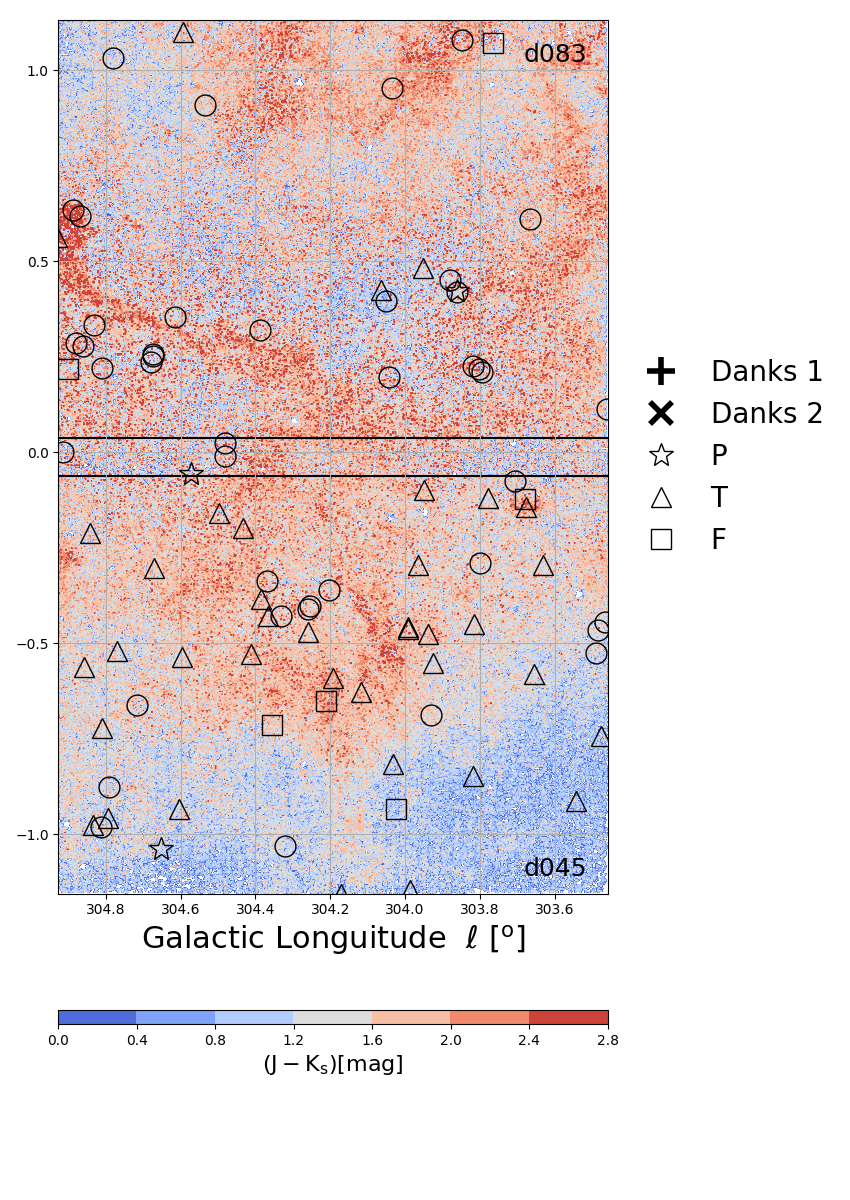
According to radio observations (Hindson et al., 2012), the projected diameter of the G 305 complex is 30 pc, at 3.5 kpc distance. Thus, the complete region is covered by four VVV tiles, namely d045, d046, d083 and d084, with total area of deg2. The selected regions and the total field of view (FoV) are shown in Figure 2.
In order to identify and characterize variable sources in the FoV, we used the automated tool presented in Medina et al. (2018). Briefly, each pawprint image was retrieved from the VISTA Science Archive111http://horus.roe.ac.uk/vsa (VSA; Cross et al., 2012). Then, point spread function (PSF) photometry was obtained using the software (Schechter et al., 1993; Alonso-García et al., 2012) in all available images. The calibration process on to the VISTA system was done using the aperture photometry catalogs produced by the Cambridge Astronomical Survey Unit222http://casu.ast.cam.ac.uk/ (CASU, v1.3 pipeline). We selected sources with flags -1 (“Stellar”) or -2 (“Border-line stellar”) morphological classification to perform the cross-match, using a tolerance of 0.”34 (the VISTA pixel size). The conversion factors and uncertainties were estimated using a linear fit to the PSF photometry vs. selected, well isolated CASU sources. A 2 clipping was used in the linear model to avoid the scatter caused by fainter sources ( mag) in both photometric catalogues. We also included VVV tile images with flag “”, which indicate the atmospheric during the observation. These images are found to be still useful for variability measurements, after careful inspection. In total, we generated and analyzed 3,570,064 light curves of stars that populate the complete FoV. Table 1 lists some basic information of the tiles, such as identification number, coordinates, and the number of available epochs. The number of sources with time-series and the number of irregular variables are also reported.
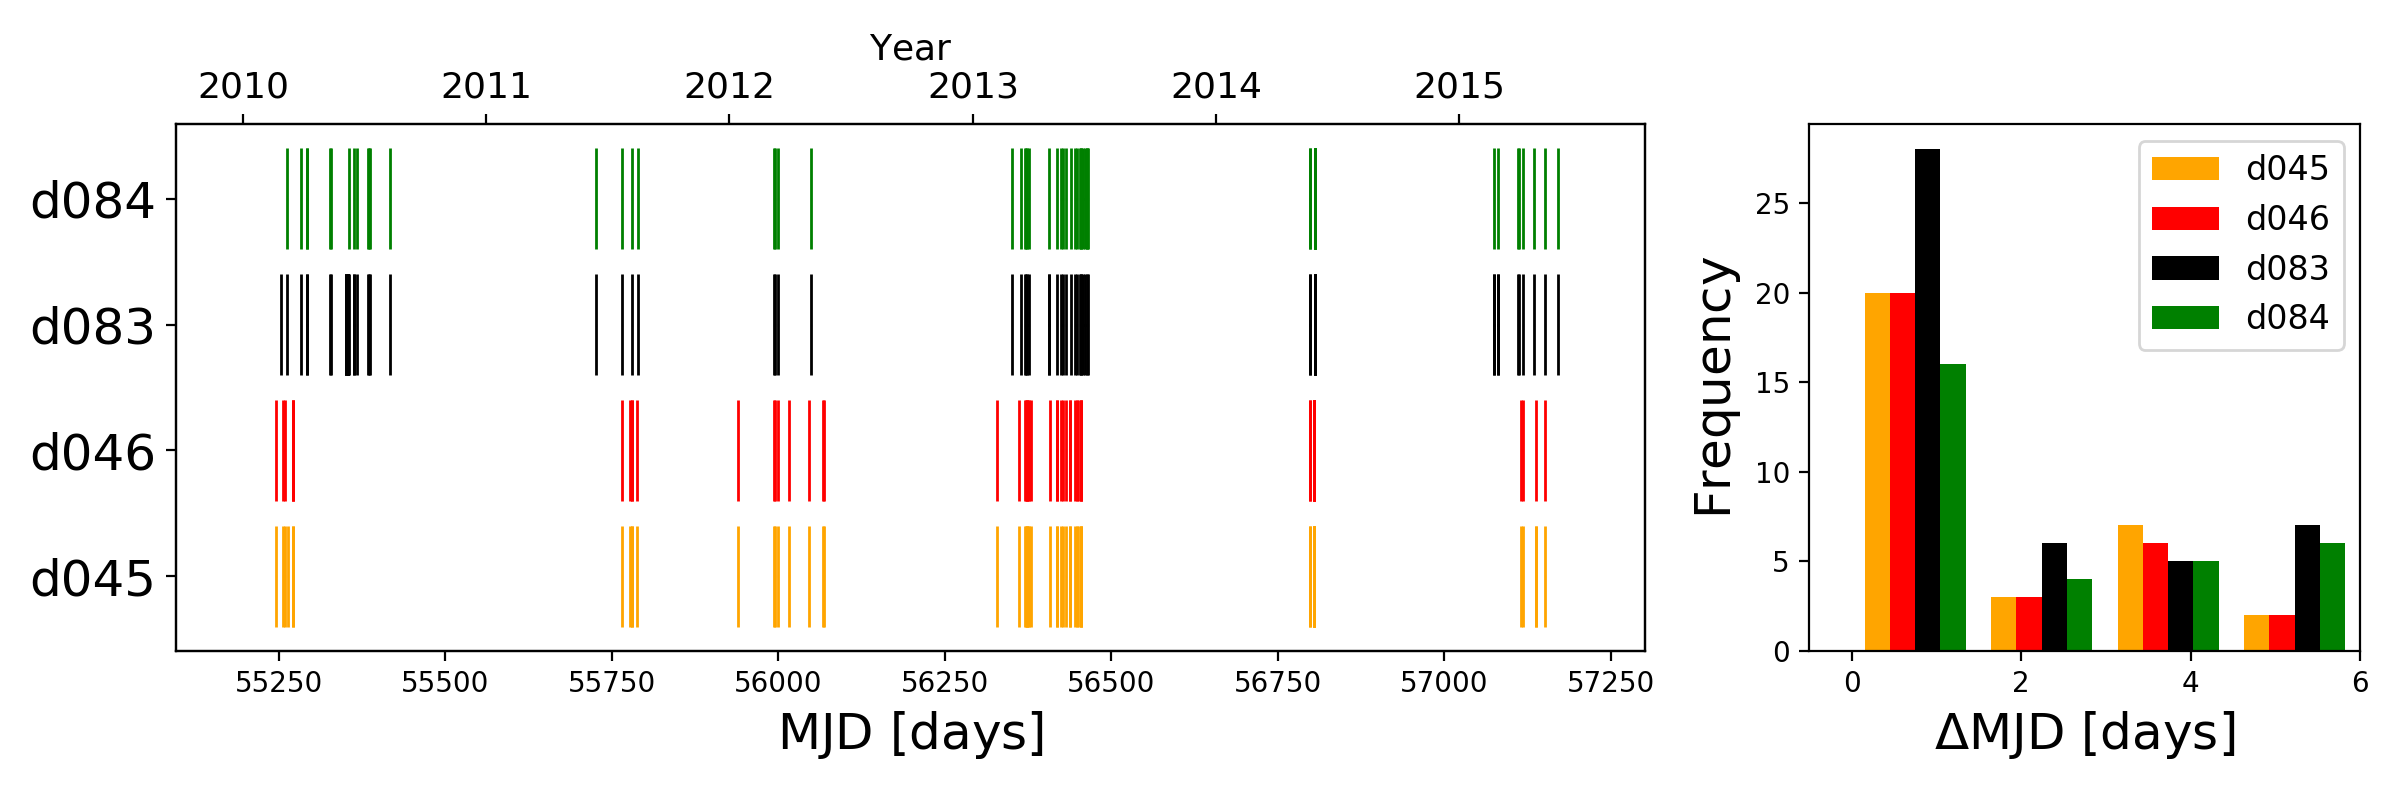
As shown in Figure 3, VVV produces unevenly sampled time-series (Scargle, 1982) that vary in sampling and cadence from tile to tile. As can be seen in the right panel, the typical time interval between observations is between 0.3 and 1.6 days for all tiles. Thus, the cadence of observations are well suited to detect short timescales variability in YSOs, related to short term accretion rate variations, episodic accretion events, rotational modulation by star spots and variable extinction (Rebull et al., 2014a). In fact, some studies have already been published regarding these topics and based on VVV data: Contreras Peña et al. (2017a, b) and Lucas et al. (2017) cataloged high amplitude eruptive variable stars; Borissova et al. (2016) searched for YSOs around young stellar clusters; Teixeira et al. (2018) measured variability in intermediate luminosity YSOs and massive YSO candidates; Medina et al. (2018) defined a new class of slowly varying YSOs, the so called “Low Amplitude Eruptive (LAE)” variables; and Guo et al. (2020) identified ”multiple timescale variables” that are highly variable on timescales of weeks and years.
| VVV | Central coordinates | Epochs | Sources with | Irregular |
|---|---|---|---|---|
| tile ID | () | time-series | sources | |
| d045 | (304.2,-0.5) | 55 | 950,085 | 57 |
| d046 | (305.7,-0.5) | 54 | 1,068,806 | 66 |
| d083 | (304.2,0.5) | 74 | 754,122 | 32 |
| d084 | (305.7,0.5) | 59 | 797,051 | 41 |
Following Medina et al. (2018) we used two main variability indices, and , to select the variable star candidates. These two indices capture two fundamental properties of variable sources: the maximum change in brightness and the level of correlation among consecutive observations. The ranges of values of interest for each index were determined from their dispersion. The distribution was characterized using a non-parametric fit to determine the behavior of as a function of . Then the dispersion, , in as a function of was measured. Sources with amplitude above 4 were selected. For the index, we assumed that the index comes from a Gaussian distribution and used, therefore, the parameter of the fitted distribution was used as a proxy for the standard deviation. Sources more than 3 below the mean were considered for the method, given the fact that an value that tends toward zero, is a strong indicator of variability (Sokolovsky et al., 2017). More specifically, in this study, we selected any star with mag AND values as a variable source.
Then, we searched for periodicity in the time series using the Generalized Lomb-Scargle Periodogram (GLS; Zechmeister & Kürster 2009) and the Information Potential Metric (IP metric; Huijse et al. 2011). We classified 177 variable stars as periodic (e.g. RRL, LPV). Their analysis will be the subject of a forthcoming paper and they are removed from the list of variable stars presented in this paper.
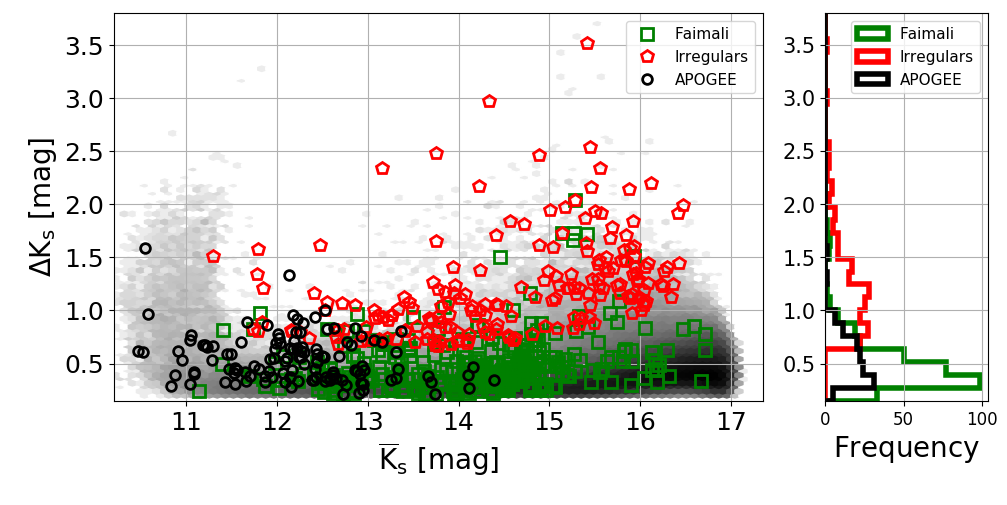
Under the above constraints we found 196 variable sources without any periodicity. Figure 4 shows the distribution for the sources found in the FoV, where red dots represent the selected irregular variable sources.
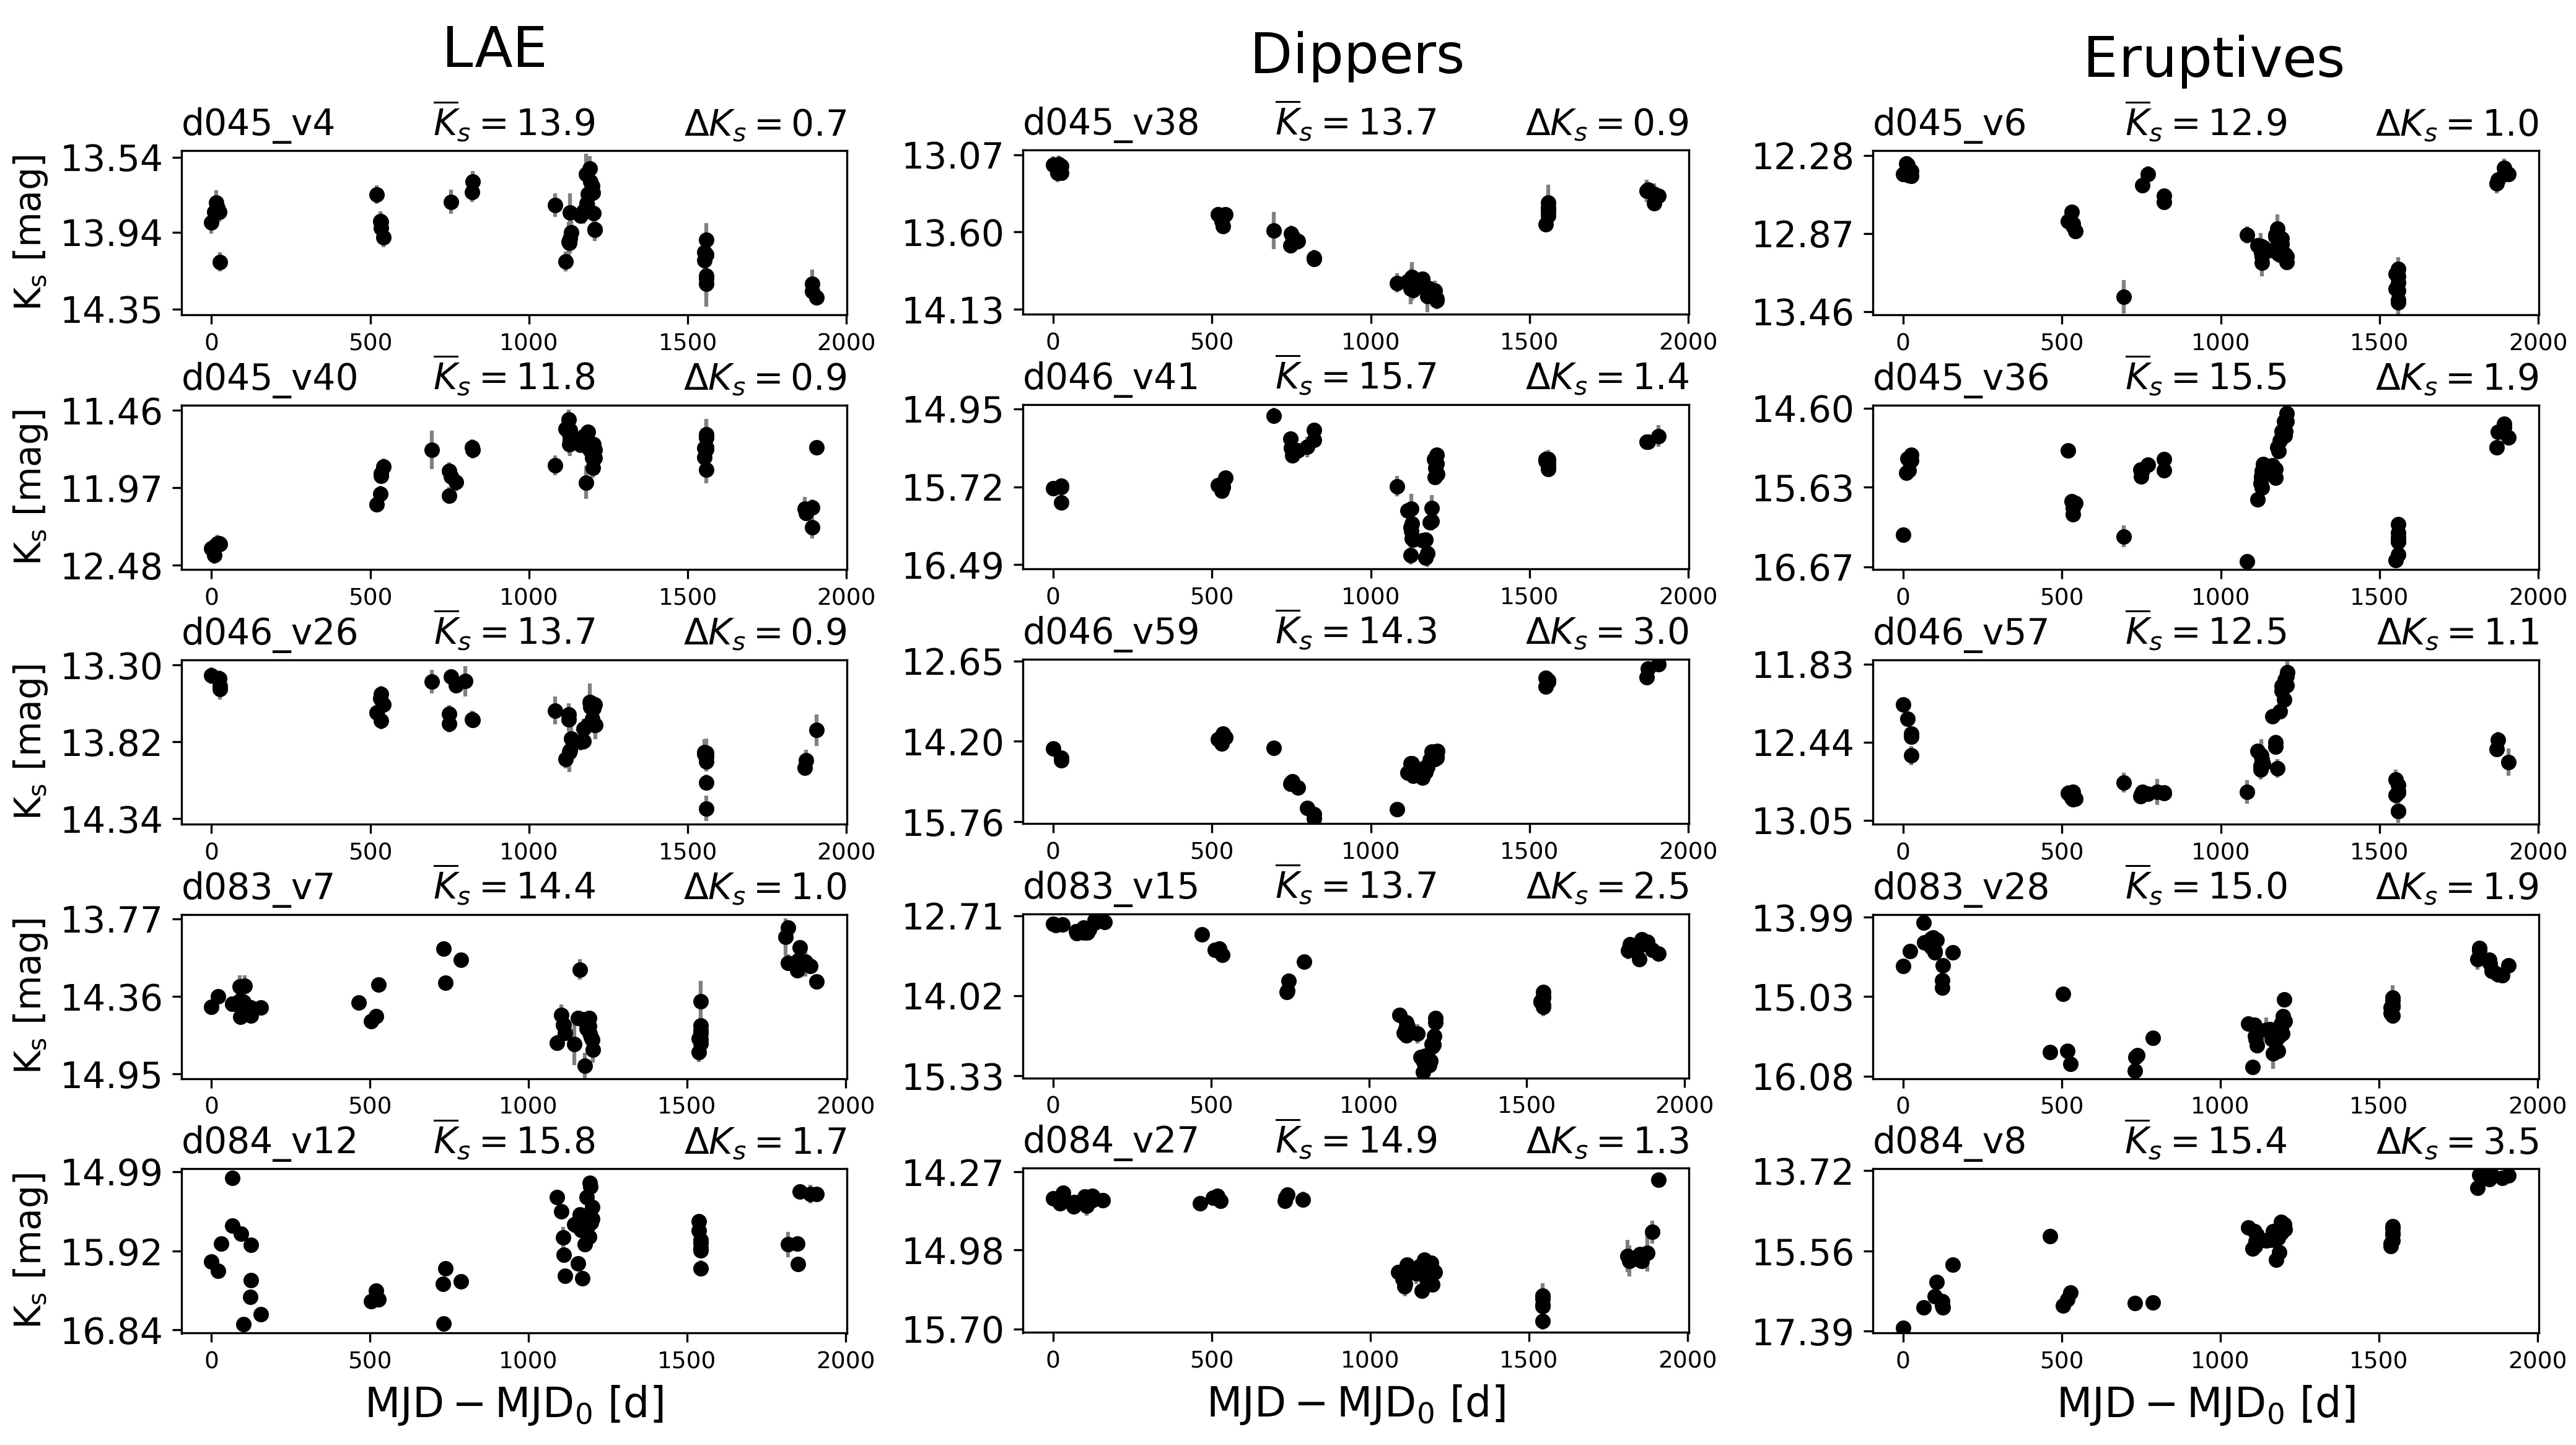
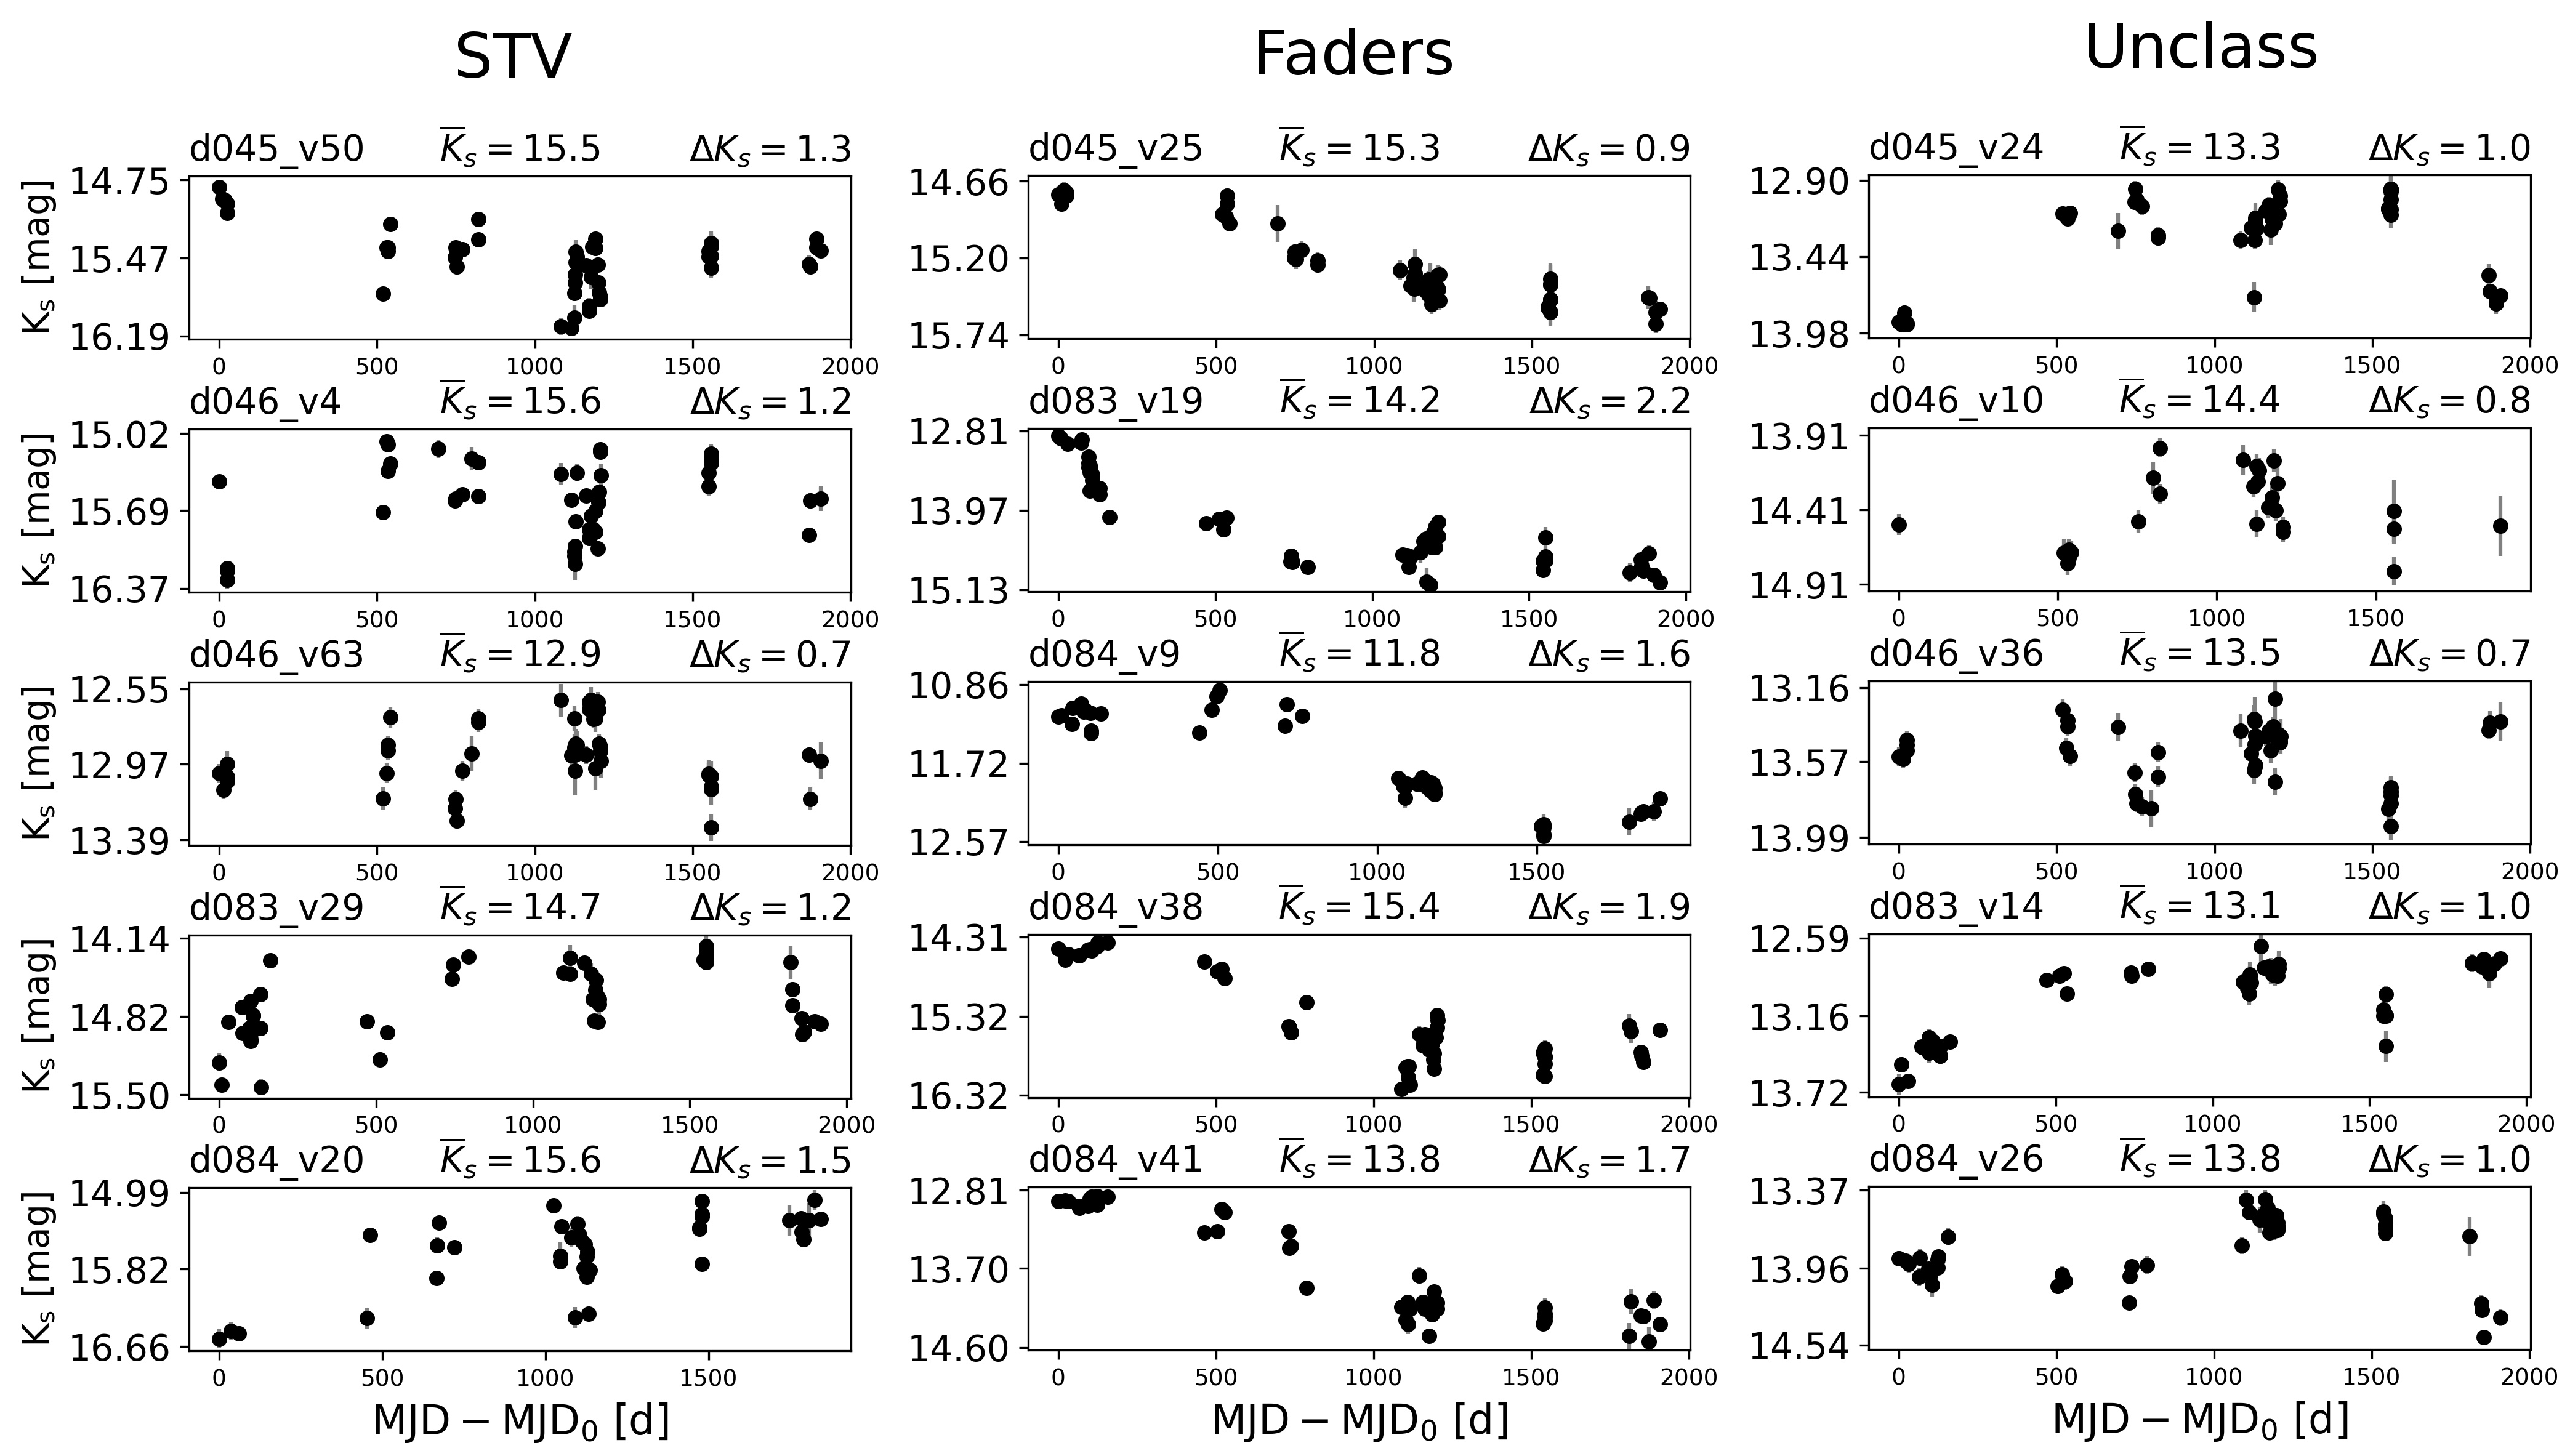
Part of the complete sample of the irregular variable sources are listed in Table 5, and some examples of time-series are shown in Figure 5.
3 Comparison with previously known YSOS in G 305
YSOs in the G 305 region have been investigated by Faimali (2013), Robitaille et al. (2008), Contreras Peña et al. (2017a), and Marton et al. (2019). These data-sets were cross-matched with our time-series catalogs for d045, d046, d083 and d084 VVV tiles (using a tolerance of 0.4 arcsecs), in order to compare them with our catalog of irregular variable sources.
- Faimali (2013)
-
in this work the authors combined data from 2MASS, the first two years (2010-2011) of the VVV survey, the Spitzer Space Telescope (Werner et al., 2004) Galactic Legacy Infrared Midplane Survey Extraordinaire (GLIMPSE; Benjamin et al., 2003), Multiband Infrared Photometer for Spitzer aboard the Spitzer Space Telescope (MIPSGAL; Carey et al., 2009), MSX, and the Herschel infrared Galactic Plane Survey (Hi-GAL; Molinari et al., 2016) observations to conduct the first YSO census of G305. They detected 599 YSOs, but the published catalog reports only 339 of them. The authors estimated that their catalog is complete up to solar masses. From those, 319 have time-series in our catalogs, but only six (IDs d046_v8, d046_v9, d046_v22, d083_v23, d084_v17 and d084_v24; see Table 5) are identified as irregular variable sources by our criteria.
- Contreras Peña et al. (2017a)
-
they reported 13 sources with an amplitude mag, that were classified either as YSO candidates or long period variables (LPVs). We recovered 12 of them. Four stars are in common with the catalog reported here (V51, V482, V43 and V480 in their list). Three sources have a well defined period and are removed from our catalog: V816 (P=616.9 d), V45 (P=584,6 d), and V49 (P=696.5 d). Another four did not fulfill the index criteria, having index larger than the average selection value: V42 (), V44 (), V481 (), and v48 (with ). Source V476 has , but an amplitude mag, thereby passing the threshold in amplitude but not passing the threshold in .
- Robitaille et al. (2008)
-
intrinsically red sources their catalog of extremely red objects contains sources classified as YSOs, YSOs candidates or Asymptotic Giant Branch (AGB) candidates. Those stars were selected from the GLIMPSE I and II surveys, based on their MIR color excess. There are 71 sources projected in our FoV, and nineteen of them have been identified also as irregular variable sources (see Table 5).
- SIMBAD database (Wenger et al., 2000)
-
we found 4 sources in common between this database and ours. The source d046_v12 (Borissova et al., 2016), named DBS130 Obj1, is a member of the cluster DBS[2003] 130. The source d046_v40 is identified in a maser catalog of Pestalozzi et al. (2005). The source d083_v29 is identified as an outflow candidate in Chen et al. (2011) and Cyganowski et al. (2008). Finally, the source d084_v41 is a well known nova called NOVA Cen 2005 or V1047 Cen (Samus, 2005). It is interesting to note that the recently reported outburst in V1047 Cen (Aydi et al., 2019) is suggested to be a dwarf nova eruption.
- Marton et al. (2019)
-
finally, we cross-matched Faimali (2013), Robitaille et al. (2008), and our sample of irregular sources with the all-sky catalogue of YSO candidates of Marton et al. (2019). The authors combined the Gaia DR2 data with Wide-field Infrared Survey Explorer (WISE) and Planck measurements using machine learning techniques. We found only 65 stars in common, which is not surprising taking into account that our sources are much fainter than the optical Gaia DR2 data, as illustrated in Figure 6. From those, 44 stars (68) are identified as YSOs, with probability. Thus, NIR studies are a useful addition to optical surveys.
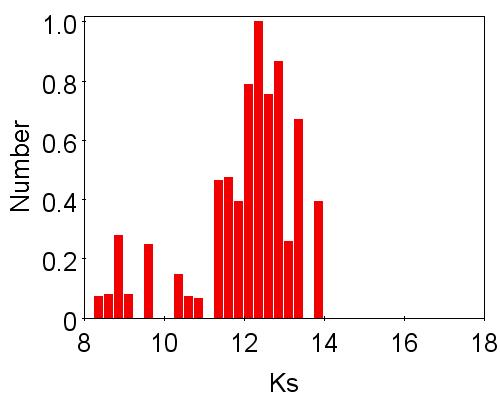
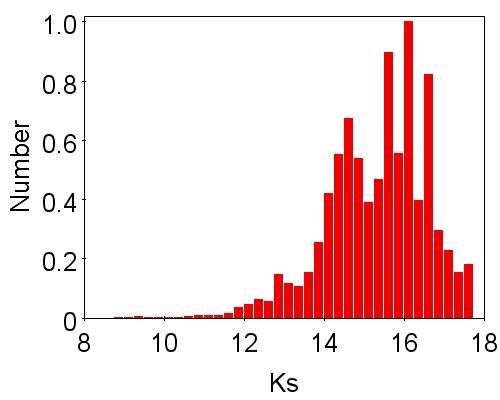
Figure 6: The histogram of magnitudes of Marton et al. (2019) catalogue of YSO candidates (left) and the combined catalog of NIR YSOs. The magnitudes are taken from the VVV database.
The relatively small number of common objects is indicative of the very conservative and stringent selection criteria of our sample ( mag and values ). Nevertheless, we decided to report only highly reliable variable sources, rather than a list containing all possible candidates. We are aware that we can have omitted a true irregular variable source and thus have reduced the completeness of the sample. However, by this approach we will have few false positive detections. Thus, the total number of newly proposed irregular variable sources is 167. Most probably, according to their light curves and irregularity, these objects are YSO candidates. Although recent studies (e.g. Cody et al. 2014; Contreras Peña et al. 2017a, Zhen et al., in preparation) found periodicity in some of the YSOs, in general the high amplitude variations do not show well-defined periods. But variability alone is not enough to confirm their status. For example, it is hard to distinguish between YSO and LPV irregular light curves. Further follow-up observations and analysis are necessary to clarify their classification. Thus, conservatively, hereafter we will continue to call these objects irregular variable sources.
4 Analysis and classification of the irregular variable sample
Figure 4 shows the amplitude distribution of the sources as a function of the mean magnitude. In the background, as gray hexagons, the distribution of amplitudes of the whole tile d046 is shown for comparison. The amplitude interval (red open pentagons) is between mag with an average value of = 1.22 mag. Since the effects of saturation in VVV are substantial in the distributions for sources brighter than mag and amplitudes larger than 0.65 magnitudes, these sources are carefully verified. To further investigate the nature of this amplitude distribution, we compare our sample of irregular variable sources with the one from Faimali (2013). Sources in this sample (green open squares) have SED classifications mainly as Class 0/I/II sources and amplitudes in the range mag, with mag. The amplitude distribution of APOGEE sources (black open circles) is similar, with mag and an average value of mag. The right panel of Figure 4 shows the histogram of the distribution where our irregular sources are almost separated from the other two data sets in terms of amplitude covering the higher amplitudes.
Carpenter et al. (2001), constructed a simple model of variations in brightness induced by cold spots, assuming a photospheric effective temperature K for stars with age 1Myr and mass 1. According to this model, if the spot coverage in the photosphere is assumed not to be larger than 30 %, the amplitude caused by this mechanism can be magnitudes. This mechanism could explain part of the amplitude distribution. On the other hand, high amplitude variability on timescales from months to decades in pre-main sequence objects is usually associated with episodic accretion events, attributed to disk instabilities typical of the early stages of young stellar objects (Vorobyov, 2009; Vorobyov et al., 2019).
As we discuss in section 1, different processes can be responsible for luminosity variations in young stars. One of the main issues in this field of research is to determine what the origin of those brightness changes is. Usually, the variability is a result of the contribution of various physical mechanisms, depending on the circumstances and environments of each particular source. In some cases, this contribution can be dominated by one of these mechanisms and then it is possible to associate the morphology of the changes as a function of time with a certain type of variability.
Several authors have quantified the morphology of these time series to create a connection with certain processes, but this classification depends strongly on the type of data that we are analyzing. As an example, Rebull et al. (2014a), Wolk et al. (2015), and related papers within the YSOVAR project framework defined several types of variable stars using the MIR time-series from the Spitzer Space Telescope. The data sets from this telescope have different cadences and times for each SFR analyzed, where the periodic, quasi-periodic, and eruptive variable sources have been classified.
For the VVV survey, NIR irregular variable sources have been split in five categories related mainly to the time-scales of the variations and the overall, most common, state: Eruptive, Faders, Dippers, Short Time-scale Variable (STV) and Low Amplitude Eruptive (LAE). These categories are summarized in Table 2. The classification aims to highlight the main physical process that controls the variability. The scheme was used in Contreras Peña et al. (2017a), Medina et al. (2018), and references therein, in an effort to identify variable sources with VVV time-series. It is necessary to point out that, given the unevenly sampled time-series, some sources present more than one of the discussed features and will remain unclassified. Thus, for the 195 variables from our list (excluding NOVA Cen 2005, source d084_v41, see above) we find 47 irregular variable sources with eruptive characteristics, 25 dippers, 17 faders, 24 LAE, 37 short-term variables, and 45 sources remain unclassified. Examples of these categories are shown in Figure 5 and the classification assigned is listed in the final table of irregular variables (Table 5). However, it is necessary to mention that some stars may have alternative classifications: d045_v4 and d046_v26 could be faders; d083_v7 could be a dipper; d084_v12 could be an STV, because short term scatter has highest amplitude; and d045_v24 and d083_v14 could be eruptive variables. Thus, we added the CCD analysis to the light curve morphological classification, and some spectroscopic follow-up is planned to better reveal their true category.
| Class | Description | N∘ of sources |
|---|---|---|
| Dippers | Shows one or more fading events on a timescale of months or years, followed by a return to normal brightness. | 25 |
| Eruptives | Shows sources with outbursts with amplitude mag and duration longer than a few days and typically at least a year. | 47 |
| Low Amplitude Eruptive | Sources that present outbursts with amplitude lower than 1 mag and duration typically longer than a year. | 24 |
| Short Timescale Variables | Sources where the time series is dominated by fast variability on timescales from days to weeks. They also can show brief bursts in brightness on timescales of weeks. | 37 |
| Faders | The light curve is best described by a monotonic decrease in brightness on a timescale yr, sometimes following a constant brightness initially | 17 |
| Unclassified | Sources without a clear trend. | 45 |
.
5 vs. color-color diagram
Additionally to the photometry described above, we also obtained the - and -bandpass photometry. Again, we used the software to perform PSF photometry in the first epoch (2010) of our VVV observations. The transformation to the standard system was performed using a linear fit between the aperture photometry from CASU and the PSF photometry. The total photometric uncertainty for each measurement is proportional to each individual PSF measurement deviation, and the standard deviation obtained from the linear fit. The final uncertainties were computed as , giving mag at 19-19.5 mag, and mag at 18.5-19 mag. Due to the VVV observational strategy, both - and data were taken in the same night with differences ranging from only a few minutes to not more than a few hours. The standard deviation of the linear fits and the MJD for each observation are listed in Table 3. In the areas of overlap between different tiles, when both measurements were available, the average value was adopted. There are 18 sources that have been identified in two different tiles: 16 in tiles d046 and d084, one in d045-d083 and one in d083-d084. Sources having and magnitudes that were averaged across two tiles are marked in the final catalog. It should be noted that the sources do not have large discrepancies between their magnitudes in the and bands. They are in the order of 0.2 mag in , and 0.1 mag in attributable to a combination of variability and measurement uncertainties.
| Tile | , | Cross-matched | |||
|---|---|---|---|---|---|
| ID | MJD | MJD | mag | mag | sources |
| d045 | 55264 | 55263 | 0.062 | 0.101 | 1,094,833 |
| d046 | 55271 | 55271 | 0.047 | 0.048 | 1,182,601 |
| d083 | 55254 | 55253 | 0.105 | 0.062 | 682,920 |
| d084 | 55262 | 55261 | 0.04 | 0.07 | 837,668 |
As pointed out by Hindson et al. (2012), the G 305 region contains dust clumps spread over the field, which produce extinction towards the stellar sources. A widely used technique to characterize such highly reddened sources is their position in the CCD. Particularly, as disused in Lada & Adams (1992) on the NIR (, ) plane, the stars with intrinsic excess emission, heavily reddened sources, and stars with normal photospheric colors can be distinguished from each other. For further analysis, we use (, ) CCDs for the 2010 epoch. To create the CCD we used the closest epoch in time to the and images. For the tiles d045, d083 and d084 the images were observed with one day of separation, meanwhile for d046 data were taken on the same night as the and photometry. To perform the cross-match between catalogs, we used a tolerance of 0.4 arcseconds in all the selected regions. Table 3 contains the MJD for each image and the quantity of cross-matched sources for each VVV tile. Then, we divide the (, ) plane following the method of Sugitani et al. (2002) and Ojha et al. (2004). The sources are analyzed with respect to the loci followed by main-sequence stars, giant stars, and classical T-Tauri stars defined in Bessell & Brett (1988) and Meyer et al. (1997). Three regions can be distinguished as follows:
-
1.
F-region: We define the region between the reddening vectors of main-sequence stars and giant stars as the F-region. These objects are considered to have at most a small NIR excess, likely corresponding to Class III or Class II YSOs. Some of these could be foreground or background sources.
-
2.
T-region: The T-region is defined to be between the projected reddening vector from the end of the T-Tauri locus (Meyer et al., 1997) and the main-sequence dwarf reddening vector. Sources located here are considered to have a substantial NIR excess and are likely to be Class II objects, also known as T-Tauri stars. Some Herbig Ae/Be sources with small NIR excess are also considered to lie in the T-region.
-
3.
P-region: The region to the right of the reddening vector extending from the end of the T-Tauri locus is called the P-region. The projected sources in this region are more likely Class I objects, sources with thermal emission from the circumstellar envelope, and protostar-like and/or Herbig Ae/Be objects.
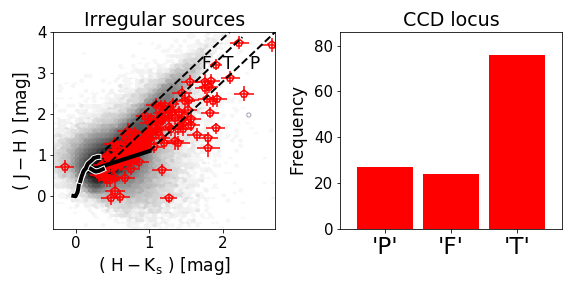
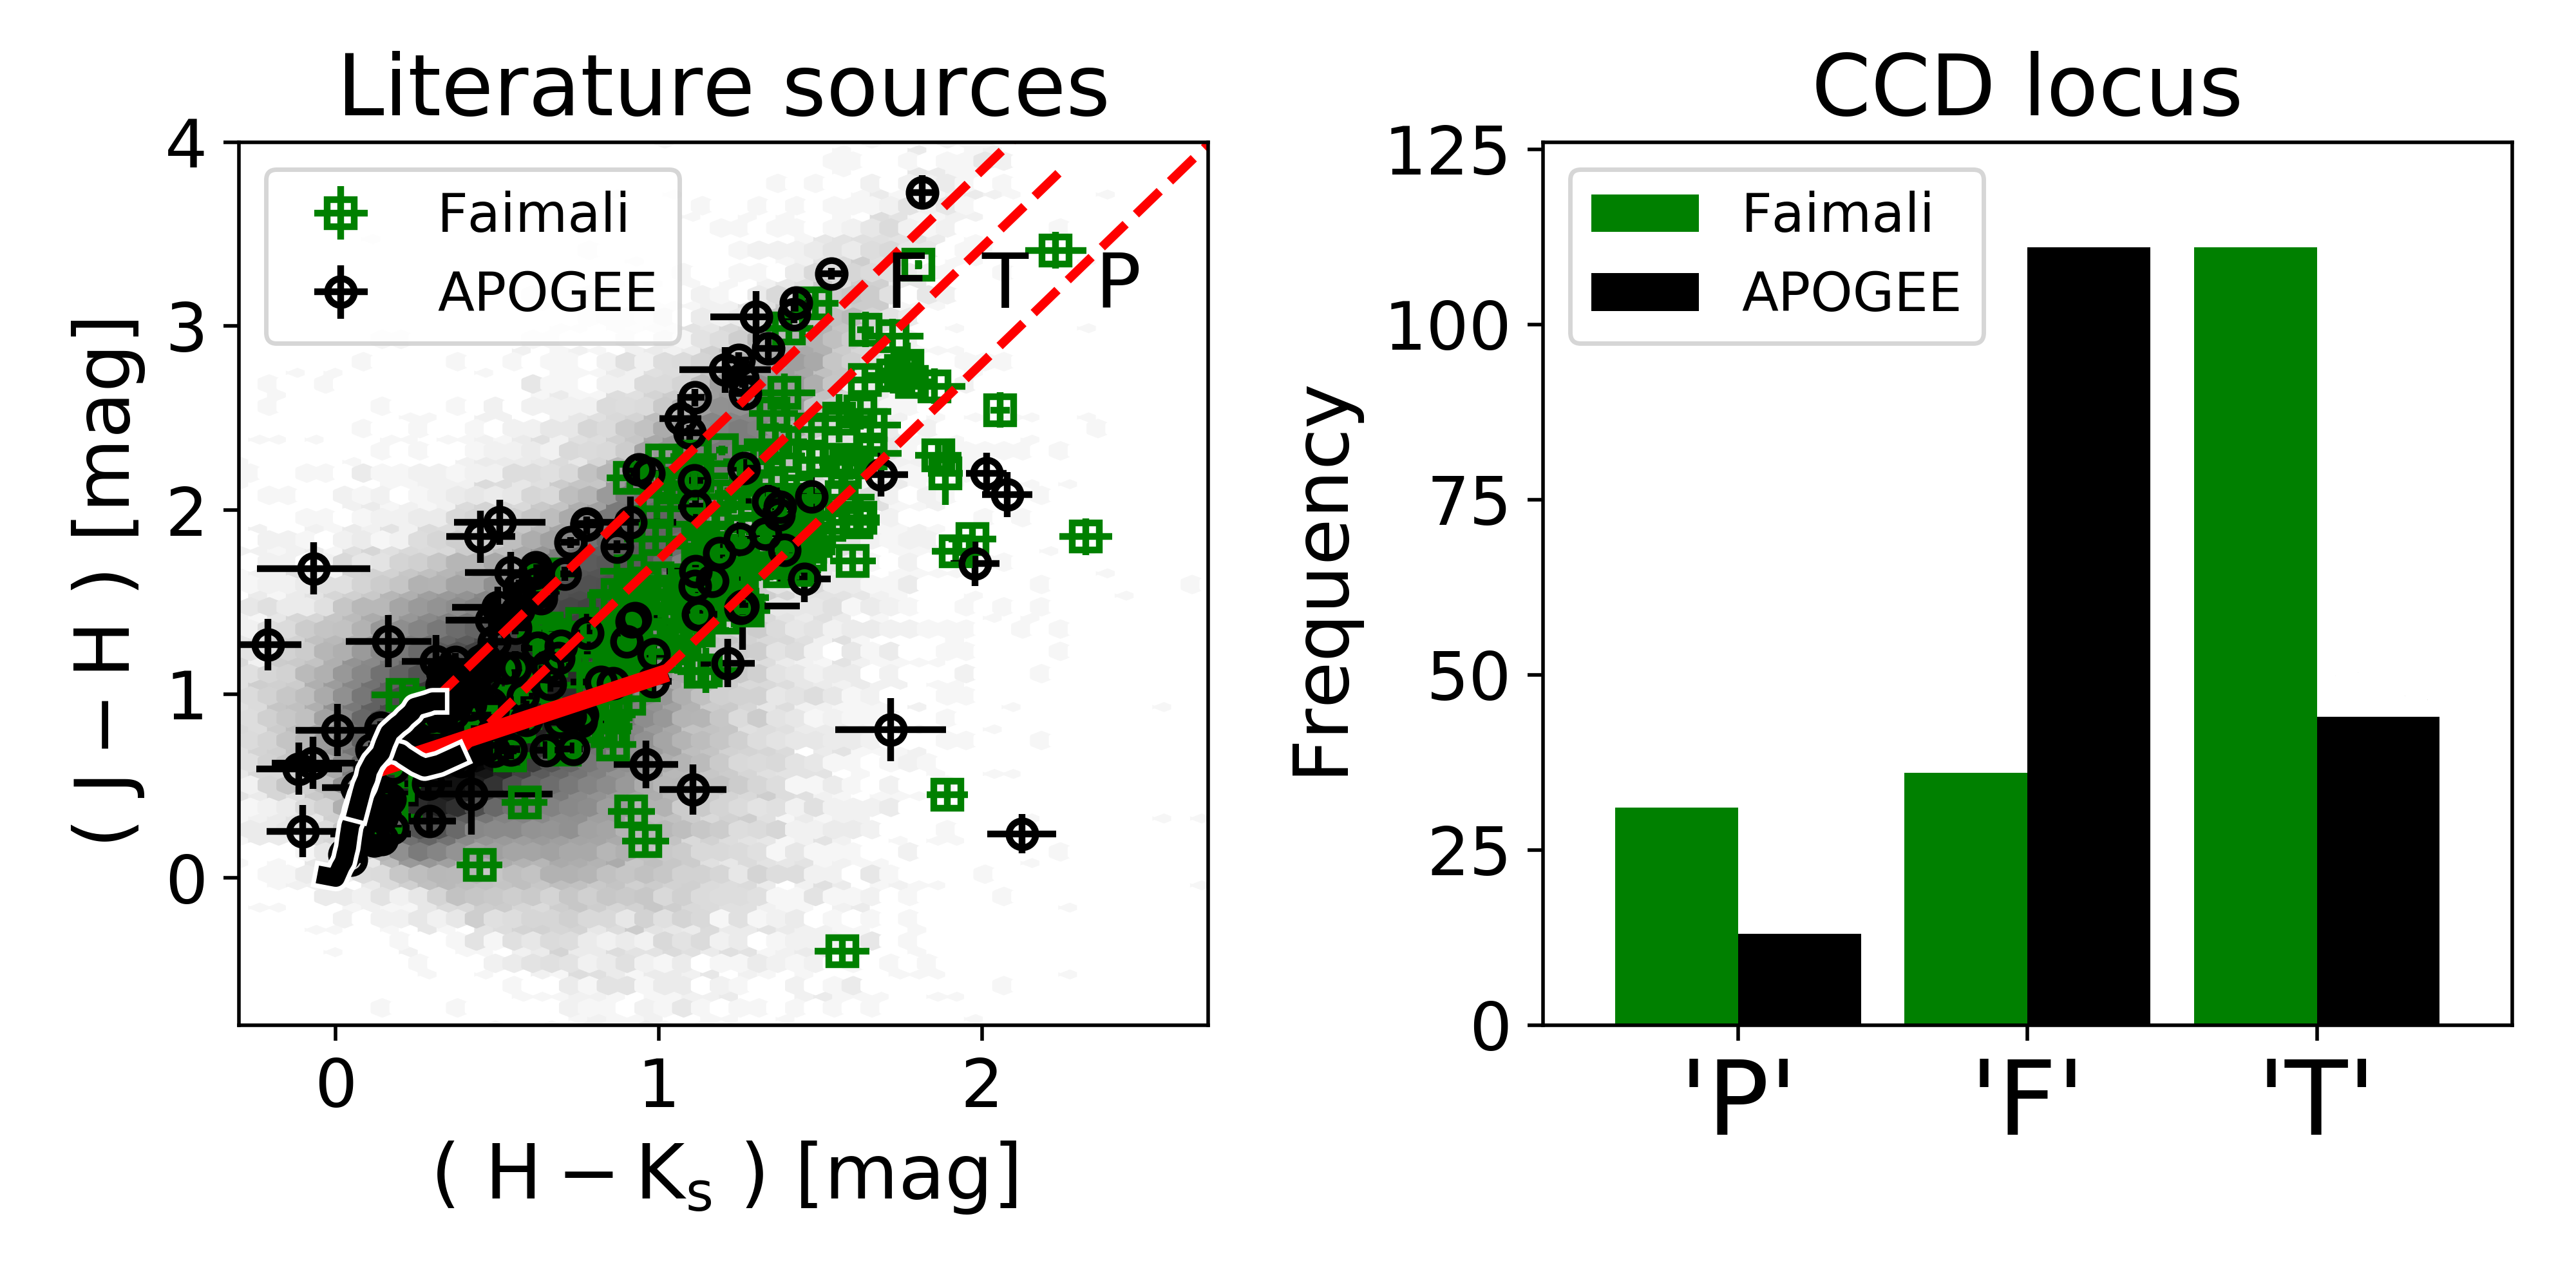
In general, only a subset of all objects has been detected in and bands, but still 130, 179 and 127 of our irregular variables, the Faimali (2013) sample, and the APOGEE sample, respectively, have reliable measurements and can be placed in the CCD (see Fig. 7). Sources have been displayed in a CCD for each selected VVV tile, where the entire population of each tile is plotted in the background. Solid black lines correspond to unreddened main-sequence stars and giant stars sequence (Bessell & Brett, 1988). Solid red line represents the intrinsic T-Tauri locus (Meyer et al., 1997). The reddening vectors using the Rieke & Lebofsky (1985) extinction law and assuming a visual extinction mag for each evolutionary track are also shown.
In total, we were able to classify 116 of our irregular variable sources.
Only a small fraction of them falls inside the F-region between the reddening vectors projected from the intrinsic color of main-sequence stars and giants. The majority are near to the red border of this region and probably are Class III/Class II sources with small NIR excess. The rest of the sample falls redward of the F-region, thus indicating the presence of intrinsic infrared excess emission, a distinctive feature of young sources with circumstellar matter.
T-region sources are located redward of the F-region, but blueward of the reddening line projected from the red end of the T Tauri locus. They are considered to be mostly classical T-Tauri stars (Class II objects) with clear NIR excess. This is consistent with the type of stellar objects that we expect to identify given their IR variable nature. To support this interpretation, we built the membership histogram for all selected sources (top histogram in figure 7). About 60 % of identified irregular sources are located inside the T-region.
Protostellar sources (i.e., Class I YSOs) are expected to lie redward of the reddening vector of the classical T Tauri (CTT) locus, in the so-called P-region, given they are intrinsically red due to their evolutionary state. Some 20 % of the whole sample falls in this region.
A substantial part of the Faimali (2013) YSO sample (63 %) lies in the T-region. The right panel of Figure 7 shows the membership histogram of each category.
Most stars from the APOGEE sample fall in the F-region. Also, in the CCD they populate areas characterized by low values of visual extinction, close to unreddened loci of main sequence stars and giants.
The above membership assignments of the sources will only be considered as a preliminary estimate of their evolutionary stage.
6 MIR photometry and SED class
In order to better analyze the irregular variables, we cross-identified our sample with the GLIMPSE IRAC catalog. IRAC provides the highest spatial resolution of any mid-IR imager for panoramic surveys over wavelengths from 3 to 9 m. The IRAC photometry is much more reliable near the Galactic plane than the WISE photometry, which was severely limited there by detector saturation and especially by source confusion. We also made a cross-identification with 24 m Spitzer/MIPS band, which unfortunately is not available for the vast majority of the point sources detected in GLIMPSE. For this reason, we made an additional cross-match with the WISE catalog, from which we used only W4 photometry.
In order to assess the evolutionary stages of YSOs in our sample, we used the infrared spectral index, . The value of the index depends on the spectral range. The wider the range towards the MIR, the higher the sensitivity to different kinds of disks. Additionally, the calculation of the spectral index is also affected by the reddening (Indebetouw et al., 2005). To estimate values that are minimally affected by the reddening, we use the wavelength range from 4.5 m to 24 m. The interstellar extinction in these bands is smaller than at shorter wavelengths, and the reddening curve is flatter. We obtained following the procedure and using the equations given in Kuhn et al. (2020):
All data from GLIMPSE, MIPS and WISE are given in Table 5.
As in Kuhn et al. (2020), we prefer the estimate based on [4.5] – [24], followed by [4.5] – W4, and finally [4.5] – [8.0]. The morphology of the ([4.5] – [5.8] vs. [5.8] – [8.0]) CCD shows that in our sample, there are no YSOs presenting strong silicate absorption or PAH emission.
From the entire list of 196 variables, there are IRAC, MIPS, and/or WISE data for 116 objects ( 59% of all), allowing us to obtain the index for all of them. The values and the corresponding Class are given in Table 5.
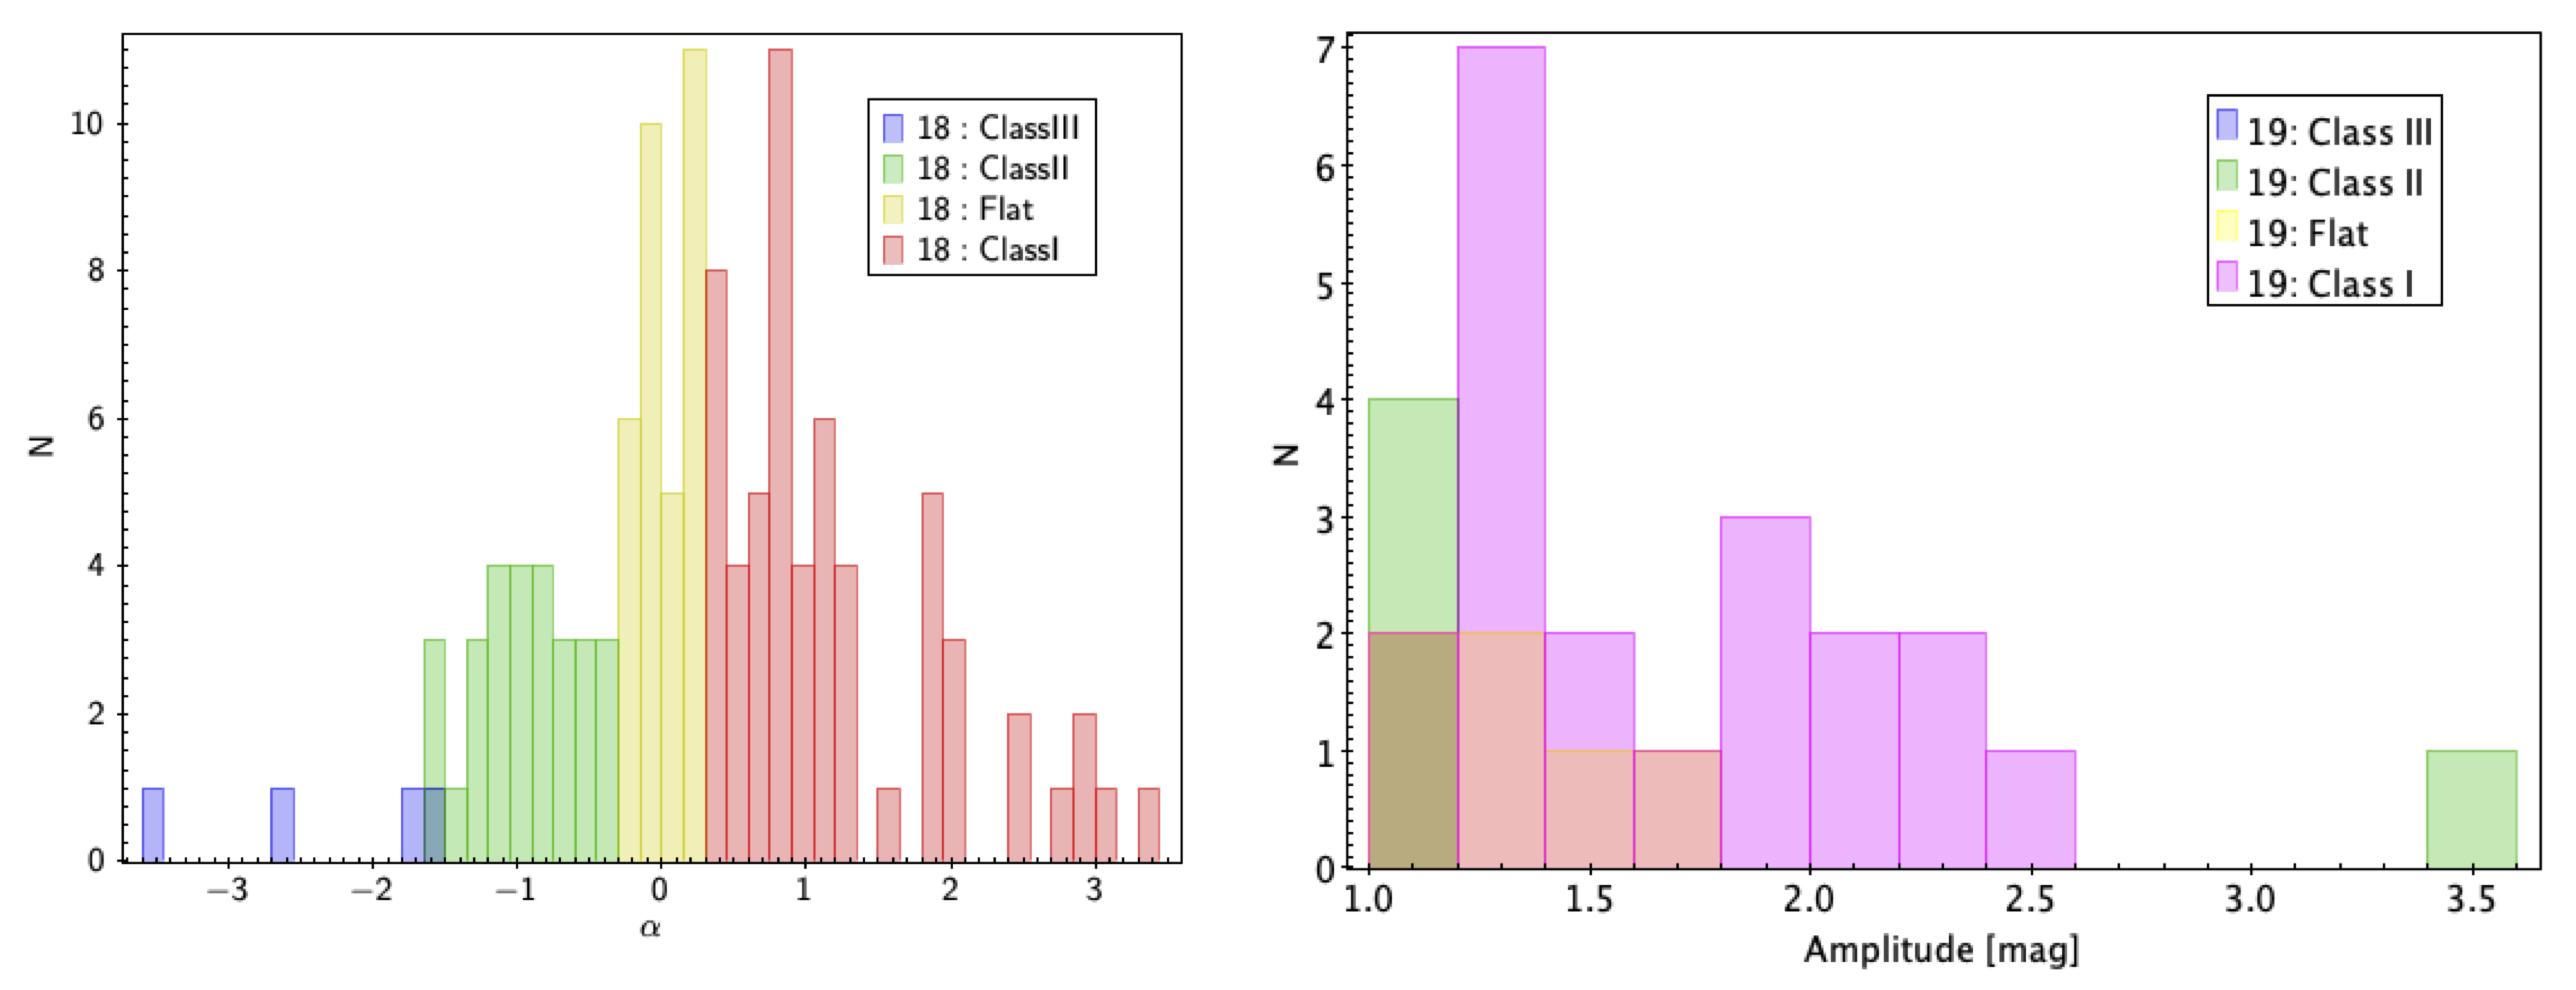
Figure 8 (Left panel) shows the distribution of the spectral indices for YSOs. Subdivision into YSO classes is made using the limits at , and (Greene et al., 1994). Based on these criteria, there are 58 Class I (), 32 Flat spectrum , 28 Class II , and only 4 Class III YSOs.
The shape of the distribution depends on the relative number of the YSO classes. In general, Class II/III YSOs should be more common than Class I/Flat SED YSOs due to the longer lifetimes of the later evolutionary stages (Evans et al., 2009). But our study, based on variability, is initially limited by the amplitude (), which is expected to exclude higher proportions of Class III and Class II YSOs than Class I YSOs. This is clearly visible in Figure 8 (Left Panel). So, we are much more sensitive to the younger YSO population.
Additionally, we analyze the amplitude distribution for the YSOs classified as Eruptive, shown in Figure 8 (Right panel). Not surprisingly, Class III objects are missing in this figure. The Class II YSOs show lower amplitudes of about 1 mag. The Flat spectrum objects are concentrated between 1 and 1.6 mag, and the Class I, as expected, span the whole range from 1 to 2.5 mag. The only exception in this classification is d084-v8, which is classified as Class II, but shows the highest amplitude of 3.52 mag. Most probably, it is a result of a wrong index, obtained only by the WISE W4 magnitude and missing [8.0] and [24] measurements. Also, the NIR classification for this object is missing, because it is too faint and too red, and has no and measurements.
7 APOGEE-2 sample
APOGEE-2 (Majewski et al., 2017) is a second generation multi-object NIR spectrograph (Wilson et al., 2019), mounted on the 2.5 meter du Pont Telescope at Las Campanas Observatory, Chile (Gunn et al., 2006). It is the successor to APOGEE and it is part of the Sloan Digital Sky Survey IV (Blanton et al., 2017). The observed spectral range is 1.51-1.70 m, with resolution R=22500. Approximately 300 stars can be observed per plate, typically assigning about 250 fibers for science targets, 35 for sky, and 15 for telluric stars, with the fiber collision limit of about 70′′. To design the strategy for spectroscopic follow-up, we assigned priorities for observation based on the preliminary classification of the objects: 59 % are stars with infrared variability in band from our search (priority 1); 21 %, (priority 2) are from the Faimali (2013) catalog; 8 % (priority 3) are extremely red sources from Robitaille et al. (2008); 3 % show X-ray emission (Chandra Source Catalog Evans et al., 2010); 7 % are probable members of the clusters VVV CL 021, CL 022, CL 023 and CL 024 (Borissova et al., 2011), and three stars (2 %) are classified as high proper motion candidates (Kurtev et al., 2017). The last three groups were added as “fillers”, during the target selection process. The APOGEE-2 observations of G 305 were carried out on April 14, 2017 (under external CNTAC program No. CN2016B90), with 1 hour exposure time. The data were processed by the APOGEE Stellar Parameter and Chemical Abundances Pipeline (Nidever et al., 2015; García Pérez et al., 2016), which includes basic data reduction, combination of spectra from multiple visits, and measurement of radial velocities, stellar parameters and elemental abundances.333For more details see http://www.sdss.org/dr14/algorithms/
In total, 127 stars were observed with APOGEE-2. Their spectra are analyzed using the TONALLI (L. Adame, in prep.) spectral classification code. In brief, the TONALLI code is based on the Asexual Genetic Algorithm (Cantó et al., 2009) to find the closest match among a synthetic model grid using a multi-dimensional approach based on a set of parameters. The code uses the Phoenix (Allard et al., 2013) atmosphere model grid with ”solar” abundances between and , after pre-selecting “low temperature” star candidates with K. As a result of the best fit, it derives the abundances [Z], [/Fe], , , and radial velocities (RV).
In the case of G 305, 122 stars are classified by the tool as YSOs, but 25 % of them have S/N between 2 and 10 and lower weight (between 0.2 and 0.5) was assigned for their parameters during the analysis. Figure 9 shows the distribution of their fundamental parameters. The measured effective temperature peak is around 4000K, in agreement with Carpenter et al. (2001). There is a peak in around 0.2 but the mean value of =0.02. The distribution has a peak around 0.2, but a second peak around 0.5 can be also identified. The mean of 0.11 reveals that the YSOs in G 305 are slightly super-solar in metal abundance. The radial velocity peak is around 41 km/s.

A cross match with the Gaia DR2 proper motion, parallax, and distance (Bailer-Jones et al., 2018) catalogs found 104 stars in common. The average distance is calculated as kpc. Comparison with radial velocities and distance of the OB stars in the region (Borissova et al., 2019) shows no significant differences from a kinematic point of view between the two stellar populations.
With regard to the variability of these YSOs, Figure 4 shows the distribution of their amplitudes. As can be seen, in general, they have smaller amplitudes compared to the irregular variable sources from our list (marked with red symbols). Nevertheless, all of them have amplitudes between mag – an average of 0.54 mag –, thus showing some kind of variability. We could not find any correlation between fundamental parameters and the amplitude of variability. We calculated the Pearson correlation coefficients of [M/H] vs. Amplitude to be ; [Fe/H] vs. Amplitude to be ; vs. Amplitude to be ; Teff vs. Amplitude to be ; and vs. Amplitude to be . Taking into account the relatively small number of stars, we found these correlation coefficients to be statistically insignificant.
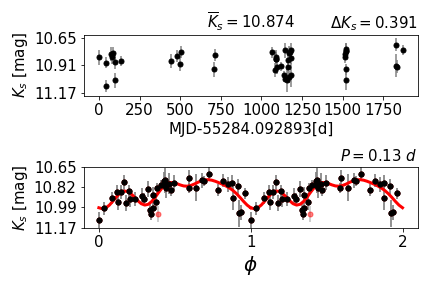
As has been pointed out, three stars (VVVJ 13081183-6317548; VVVJ 13081329-6242491 and 2M13182865-6253076) classified as high proper motion objects (Kurtev et al., 2017) were observed by APOGEE as ”fillers”. Although far from the main topic of the paper, we analyzed them and will briefly mention here. The Gaia DR2 data shows that they can be measured in the optical waveband too and indeed they have large proper motions (Table 4). Comparing the Gaia temperature vs. the Straizys & Kuriliene (1981) spectral type and the Spectroscopic type vs. (measured by APOGEE spectra) calibrations, we derived their spectral types. Although this classification has an uncertainty of 2-3 subtypes, these are identified as K and early M-type stars rather than ultracool dwarfs. From the X-ray emitters, only 2M13121845-6237309 has a tentative period of 0.13 days and its light curve resembles that of a binary star (Figure 10).
8 Spatial distribution around the G 305 SFR
The location of the identified irregular variable sources can be seen on the panoramic view of the G 305 star-forming complex shown in Figure 2. The main data sets considered in this study are marked with different symbols and colors. The false-color view provided by the Spitzer Space Telescope InfraRed Array Camera (IRAC) at mid-infared wavelengths of 3.6m to 8m is in the background. As can be seen, the selected irregular sources extend throughout the whole area. However, the density distribution is different: the sources in tiles d046 and d084 are mostly projected on the red filaments across the image. These trace the polycyclic aromatic hydrocarbons (PAH) emission, excited by surrounding interstellar radiation and become luminescent at wavelengths near 8.0m. The PAH emission is typically found from photo-dissociated regions (e.g. Hollenbach & Tielens, 1997). On the other hand, the sources in the tiles d045 and d083 show a nearly homogeneous distribution. Thus, the distribution of the young sources in G 305 clearly trace the ongoing star-formation zones. Some individual examples are shown in Figure 11, where the sources d045_v18 and d045_v35 are projected in the IRAC bands on green nebulosity, indicating an outburst or jet that is bright at 4.5 m. The right panels show the d084_v6 and d084_v20 sources projected on nebulous regions in 2 MASS images.

The spatial projection of the classified variables can be also illustrated with the smoothed surface color distribution shown in Figure 12. Considering that class I/II objects (comparing with class III) are more likely to show variability due to their instability while evolving towards the main-sequence (Rice et al., 2015; Contreras Peña et al., 2017a) one should expect that they are distributed and concentrated in dust and gas over-densities. This trend is clearly visible in G 305 region.
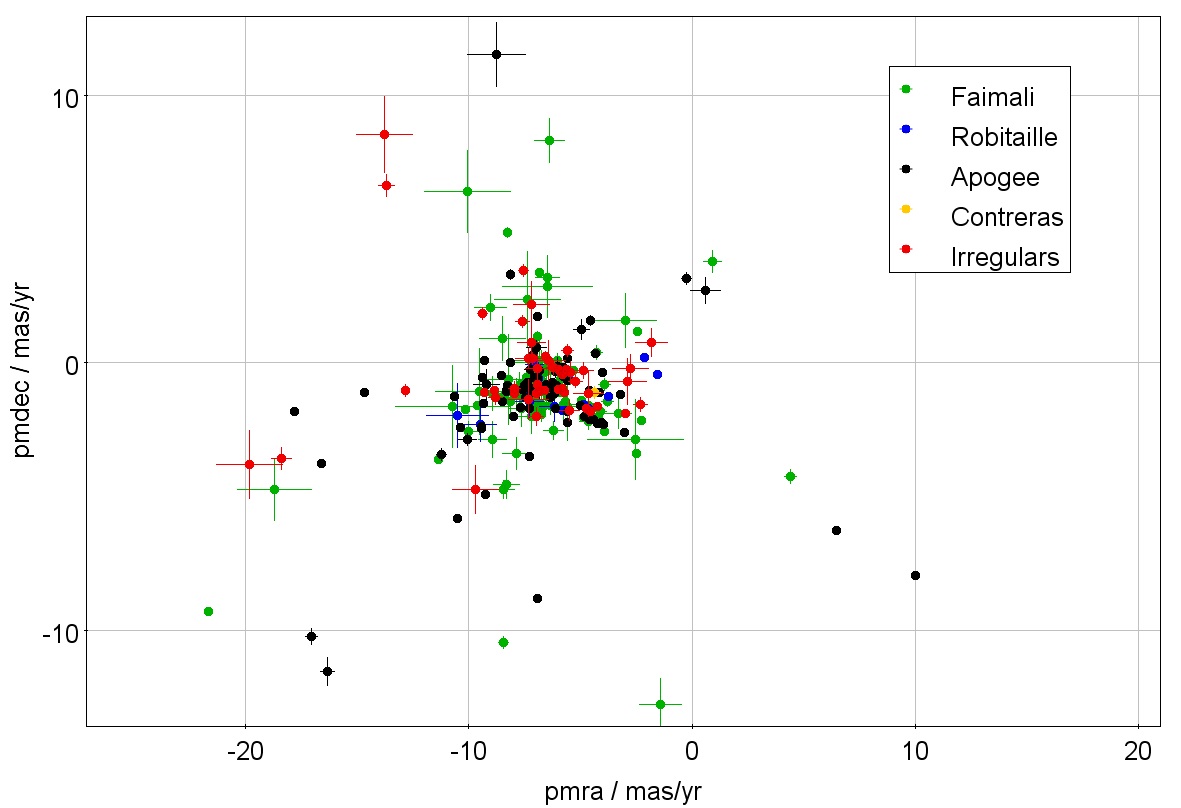
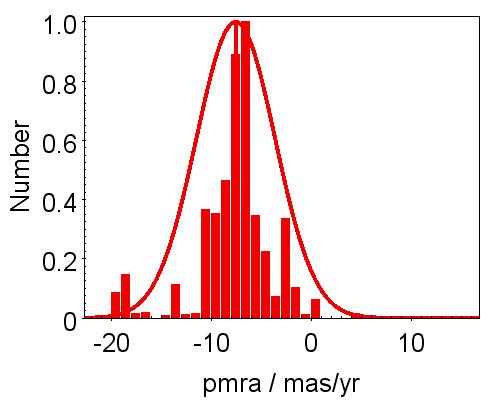
As mentioned before, in this paper we analyzed several catalogs, which contain YSOs or YSO candidates: Faimali (2013), Contreras Peña et al. (2017a), Robitaille et al. (2008), the APOGEE-2 confirmed YSOs, and the irregular variable sources derived from the VVV band analysis, comprising a total of 700 stars. We will consider this catalog as a statistically representative sample of YSOs and candidates in the region. The sample was cross-identified with Gaia DR2, yielding 295 stars with proper motion measurements. As can be seen in Figure 13, their distribution is typical for a structure belonging to the galactic disk. The stars form a compact group centered on and .
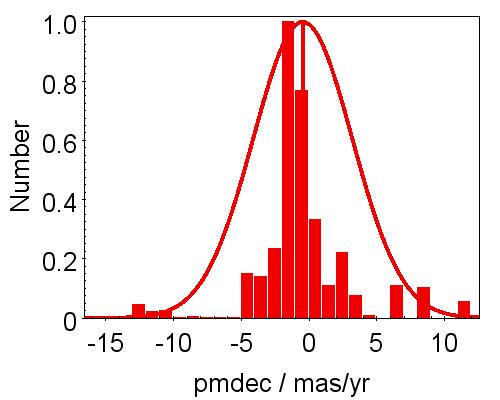
Moreover, the distribution projected on the sky is not random, but in fact most of the sources are concentrated within the central cavity formed by two massive clusters, namely Danks 1 and 2 (Faimali 2013; see also Figure 2, where different catalogs are color-coded). The mean surface density of the YSOs in the region is calculated to be 0.025 YSOs/pc-2, while the central cavity contains 10 times more objects per area (0.238 YSOs/pc-2), clearly tracing the propagation of star formation in the region.
9 Discussion and Summary.
G 305 is a relatively close-by, luminous giant HII region with active star formation. Using the time-series photometry in the bandpass provided by the VVV survey for the sources in this region, we generated and analyzed 3,570,064 unevenly sampled light curves over a 5-year period. The variability indices mag and values are used in order to select variable star candidates. We found 373 high-amplitude variable candidates in the region: 177 sources show periodicity in their variability, while 196 seem to show irregular variations in their brightness. After cross correlation with catalogs of YSOs available in the literature and SIMBAD, 167 stars are identified as new irregular variable stars. Inspection of the light curves indicates that these objects are good YSO candidates. On the basis of the morphology of their light curves, the sources are classified using Medina et al. (2018) scheme: Eruptive, Faders, Dippers, STVs, and LAEs. It is interesting to mention, that from classified variables the biggest group (31%) contains Eruptive sources, confirming that the eruption is a frequently physical mechanisms for the brightness changes.
Additionally, the YSOs from the different catalogues from the literature Robitaille et al. (2008); Faimali (2013); Contreras Peña et al. (2017b) are analyzed. The vs. CCDs are constructed and the position of variable sources on the diagrams are connected with their evolutionary status (Class I, Class I/II and Class III). About 60 % of the identified irregular sources are located at the so-called T-region. This region encompasses variables with large NIR excess, and is usually regarded as the probable location of Class II systems. In order to improve this classification, we cross-identified our sample of 196 non-periodic variables with GLIMPSE, MIPS, and WISE catalogs. There are available data for 116 of them. Using the infrared index, we classified these 116 objects as follows: 58 Class I, 32 flat spectrum, 28 Class II, and only 4 Class III YSOs. Thus, the majority of highly variable YSOs with mid-IR detections are classified as Class I systems, even if they are located in the T- region of the near IR two colour diagram. (Sources lacking mid-IR detections are of course more likely to be Class II or Class III systems). The high proportion of Class I YSOs clearly reflects the ongoing star formation in G 305 region. Comparing with the OB stellar population, we can support the Clark & Porter (2004) suggestion of sequential star formation.
In total, 127 stars were observed with the APOGEE-2 multi-object NIR spectrograph. From them, 122 stars are classified by the TONALLI code as YSOs. The mean of 0.11 suggests that the YSOs in G 305 are slightly super-solar in metal abundance. The radial velocity peak is around 41 km/s. The average distance of kpc is calculated, on the base of Gaia DR2 distance catalog. Thus, we do not find any significant differences from a kinematic point of view between the YSOs and OB stellar population (Borissova et al., 2019) in the region. All stars with APOGEE-2 spectra are variable, with amplitudes between mag in the band.
The spatial distributions of the combined catalog of 700 YSOs in G 305 shows that the distribution is not random, but in fact the YSOs are concentrated within the central cavity formed by the massive clusters Danks 1 and 2. We find the mean surface density of YSOs to be 0.025 YSOs/pc-2, while the central cavity contains 10 times more objects per area (0.238 YSOs/pc-2).
10 Acknowledgments
We thank the referee for carefully reviewing the manuscript and for the valuable suggestions and comments. We gratefully acknowledge data from the ESO Public Survey program ID 179.B-2002 taken with the VISTA telescope, and products from the Cambridge Astronomical Survey Unit (CASU), also on data products from observations made with ESO Telescopes at the La Silla, Paranal Observatory under program ID 177.D-3023, as part of the VST Photometric Hα Survey of the Southern Galactic Plane and Bulge (VPHAS+). This work was funded by ANID – Millennium Science Initiative Program – ICN12_009 awarded to the Millennium Institute of Astrophysics (MAS). N.M. acknowledges support through a Fellowship for National PhD students from ANID, grant number 21181952. J.A.-G. acknowledges support from Fondecyt Regular 1201490. A.B. acknowledges funding by ANID, Millennium Science Initiative, via the Núcleo Milenio de Formación Planetaria (NPF) and from FONDECYT Regular 1190748. A. Roman-Lopes acknowledges financial support provided in Chile by Comisión Nacional de Investigación Científica y Tecnológica (CONICYT) through the FONDECYT project 1170476 and by the QUIMAL project 130001. C. Román-Zúñiga acknowledges support from project CONACYT CB2018 A1-S-9754 and project UNAM-PAPIIT IN112620, Mexico.
Funding for the Sloan Digital Sky Survey IV has been provided by the Alfred P. Sloan Foundation, the U.S. Department of Energy Office of Science, and the Participating Institutions. SDSS-IV acknowledges support and resources from the Center for High-Performance Computing at the University of Utah. The SDSS web site is www.sdss.org.
SDSS-IV is managed by the Astrophysical Research Consortium for the Participating Institutions of the SDSS Collaboration including the Brazilian Participation Group, the Carnegie Institution for Science, Carnegie Mellon University, the Chilean Participation Group, the French Participation Group, Harvard-Smithsonian Center for Astrophysics, Instituto de Astrofísica de Canarias, The Johns Hopkins University, Kavli Institute for the Physics and Mathematics of the Universe (IPMU) / University of Tokyo, the Korean Participation Group, Lawrence Berkeley National Laboratory, Leibniz Institut für Astrophysik Potsdam (AIP), Max-Planck-Institut für Astronomie (MPIA Heidelberg), Max-Planck-Institut für Astrophysik (MPA Garching), Max-Planck-Institut für Extraterrestrische Physik (MPE), National Astronomical Observatories of China, New Mexico State University, New York University, University of Notre Dame, Observatário Nacional / MCTI, The Ohio State University, Pennsylvania State University, Shanghai Astronomical Observatory, United Kingdom Participation Group, Universidad Nacional Autónoma de México, University of Arizona, University of Colorado Boulder, University of Oxford, University of Portsmouth, University of Utah, University of Virginia, University of Washington, University of Wisconsin, Vanderbilt University, and Yale University.
| Name | RV | (mas) | G | BP-BR | Sp type | ||||||||
|---|---|---|---|---|---|---|---|---|---|---|---|---|---|
| VVVJ13081183-6317548 | 197.0492770 | -63.2985550 | 0.4501 | -0.0997 | 4.8207 | 4340 | -70.32 | 3.98930.1396 | -69.4970.163 | -1.7550.165 | 13.91 | 1.59 | K5-7 |
| VVVJ13081329-6242491 | 197.0553602 | -62.71362753 | 0.0518 | -0.0437 | 5.1028 | 3846 | 9.24 | 15.08730.0305 | -106.5120.039 | -115.8610.039 | 13.42 | 2.40 | M3-5 |
| 2M13182865-6253076 | 199.6193776 | -62.88544519 | 0.5706 | -0.0994 | 5.1461 | 4951 | -17.55 | 5.37240.2526 | -80.3350.346 | -26.3410.36 | 12.74 | 1.285 | K3-5 |
| 0ID | Mean | err | Nobs | Ampl | TileID | mag_err4 | err | err | Class | Var Class | Comment | Reference | ||||||||||
|---|---|---|---|---|---|---|---|---|---|---|---|---|---|---|---|---|---|---|---|---|---|---|
| [3.6] | [3.6]err | [4.5] | [4.5]err | [5.8] | [5.8]err | [8.0] | [8.0]err | [24] | [24]err | W1 | W1err | W2 | W2err | W3 | W3err | W4 | W4err | Class() | ||||
| d045_v1 | 194.045408 | -63.311269 | 303.4645635 | -0.4444275 | 16.422 | 0.032 | 42 | 1.444 | 0.414 | d045 | LAE | |||||||||||
| 14.051 | 0.099 | 13.213 | 0.095 | 12.326 | 0.143 | 11.541 | 0.063 | 7.87 | 0.1 | 0.459 | Class I | |||||||||||
| d045_v2 | 194.082928 | -63.608539 | 303.4757633 | -0.7419591 | 12.348 | 0.017 | 51 | 0.742 | 0.157 | d045 | 11.889 | 0.058 | 13.659 | 0.121 | 12.616 | 0.098 | 1.043 | 0.727 | T | Dipper | ||
| 11.176 | 0.075 | 10.888 | 0.073 | 10.551 | 0.089 | 10.378 | 0.074 | 5.51 | 0.07 | 10.766 | 0.03 | 10.49 | 0.027 | 8.738 | 0.184 | 4.854 | 0.104 | 0.176 | Flat | |||
| d045_v3 | 194.089278 | -63.331243 | 303.4838829 | -0.4647675 | 16.027 | 0.022 | 52 | 1.08 | 0.285 | d045 | 15.663 | 0.059 | 17.522 | 0.067 | 1.859 | Fader | in-group | |||||
| 12.548 | 0.075 | 11.149 | 0.057 | 10.346 | 0.148 | |||||||||||||||||
| d045_v4 | 194.101456 | -63.39115 | 303.4881923 | -0.5247683 | 13.912 | 0.014 | 45 | 0.686 | 0.553 | d045 | 13.807 | 0.058 | 17.063 | 0.066 | 3.256 | LAE | Robitaille | |||||
| 9.91 | 0.038 | 8.612 | 0.038 | 7.376 | 0.024 | 6.773 | 0.022 | 10.161 | 0.023 | 8.255 | 0.019 | 5.98 | 0.025 | 3.652 | 0.024 | -0.043 | Flat | |||||
| d045_v5 | 194.242266 | -63.77788 | 303.542943 | -0.9126947 | 14.142 | 0.019 | 50 | 1.038 | 0.319 | d045 | 13.576 | 0.058 | 15.01 | 0.12 | 14.154 | 0.098 | 0.856 | 0.578 | T | Fader | ||
| 13.226 | 0.079 | 12.787 | 0.071 | 12.723 | 0.249 | 12.315 | 0.121 | -1.326 | Class II | |||||||||||||
| d045_v6 | 194.406342 | -63.158305 | 303.6303178 | -0.2949481 | 12.858 | 0.023 | 51 | 1.049 | 0.458 | d045 | 12.432 | 0.057 | 14.098 | 0.12 | 13.134 | 0.098 | 0.964 | 0.702 | T | Eruptive | FIRE | |
| 12.9 | 0.036 | 12.707 | 0.061 | 12.274 | 0.104 | 12.225 | 0.203 | 11.75 | 0.031 | 11.379 | 0.027 | 9.723 | 0.061 | 8.084 | -0.239 | Flat | ||||||
| d045_v7 | 194.475246 | -63.443083 | 303.654274 | -0.5804006 | 14.287 | 0.015 | 53 | 0.8 | 0.447 | d045 | 14.044 | 0.058 | 15.276 | 0.12 | 14.57 | 0.098 | 0.706 | 0.526 | T | Dipper | ||
| 13.293 | 0.064 | 12.937 | 0.121 | 12.996 | 0.329 | 12.562 | 0.301 | -1.621 | Class III | |||||||||||||
| d045_v8 | 194.502338 | -63.006601 | 303.6775207 | -0.1443672 | 13.714 | 0.026 | 46 | 1.265 | 0.609 | d045 | 13.252 | 0.057 | 15.783 | 0.12 | 14.295 | 0.098 | 1.488 | 1.043 | T | Eruptive | ||
| 11.906 | 0.042 | 11.203 | 0.034 | 10.564 | 0.044 | 9.666 | 0.022 | 0.854 | Class I | |||||||||||||
| d045_v9 | 194.502973 | -62.98427 | 303.6783789 | -0.1220508 | 14.545 | 0.013 | 46 | 0.766 | 1.053 | d045 | 14.204 | 0.057 | 15.593 | 0.12 | 14.643 | 0.098 | 0.95 | 0.439 | F | STV | ||
| 13.457 | 0.046 | 12.9 | 0.065 | 12.349 | 0.107 | 11.514 | 0.05 | 0.366 | Class I | |||||||||||||
| d045_v10 | 194.558735 | -62.93687 | 303.7049504 | -0.0753248 | 16.052 | 0.027 | 47 | 1.405 | 0.698 | d045 | STV | Robitaille | ||||||||||
| 11.691 | 0.042 | 10.617 | 0.053 | 9.583 | 0.028 | 8.717 | 0.026 | 12.576 | 0.039 | 10.578 | 0.022 | 8.08 | 0.026 | 5.595 | 0.04 | -0.007 | Flat | |||||
| … And 186 more objects … | ||||||||||||||||||||||
References
- Allard et al. (2013) Allard, F., Homeier, D., Freytag, B., et al. 2013, Memorie della Societa Astronomica Italiana Supplementi, 24, 128
- Alonso-García et al. (2012) Alonso-García, J., Mateo, M., Sen, B., et al. 2012, AJ, 143, 70
- Arnaboldi et al. (2007) Arnaboldi, M., Neeser, M. J., Parker, L. C., et al. 2007, The Messenger, 127, 28
- Audard et al. (2014) Audard, M., Ábrahám, P., Dunham, M. M., et al. 2014, in Protostars and Planets VI, ed. H. Beuther, R. S. Klessen, C. P. Dullemond, & T. Henning, 387
- Aydi et al. (2019) Aydi, E., Strader, J., Chomiuk, L., et al. 2019, The Astronomer’s Telegram, 12975, 1
- Bailer-Jones et al. (2018) Bailer-Jones, C. A. L., Rybizki, J., Fouesneau, M., Mantelet, G., & Andrae, R. 2018, AJ, 156, 58
- Bayo et al. (2008) Bayo, A., Rodrigo, C., Barrado Y Navascués, D., et al. 2008, A&A, 492, 277
- Benjamin et al. (2003) Benjamin, R. A., Churchwell, E., Babler, B. L., et al. 2003, PASP, 115, 953
- Bessell & Brett (1988) Bessell, M. S., & Brett, J. M. 1988, PASP, 100, 1134
- Blanton et al. (2017) Blanton, M. R., Bershady, M. A., Abolfathi, B., et al. 2017, AJ, 154, 28
- Borissova et al. (2011) Borissova, J., Bonatto, C., Kurtev, R., et al. 2011, A&A, 532, A131
- Borissova et al. (2016) Borissova, J., Ramírez Alegría, S., Alonso, J., et al. 2016, AJ, 152, 74
- Borissova et al. (2019) Borissova, J., Roman-Lopes, A., Covey, K., et al. 2019, AJ, 158, 46
- Cantó et al. (2009) Cantó, J., Curiel, S., & Martínez-Gómez, E. 2009, A&A, 501, 1259
- Caratti o Garatti et al. (2017) Caratti o Garatti, A., Stecklum, B., Garcia Lopez, R., et al. 2017, Nature Physics, 13, 276
- Carey et al. (2009) Carey, S. J., Noriega-Crespo, A., Mizuno, D. R., et al. 2009, PASP, 121, 76
- Carpenter et al. (2001) Carpenter, J. M., Hillenbrand, L. A., & Skrutskie, M. F. 2001, The Astronomical Journal, 121, 3160. https://doi.org/10.1086%2F321086
- Chen et al. (2011) Chen, X., Ellingsen, S. P., Shen, Z.-Q., Titmarsh, A., & Gan, C.-G. 2011, ApJS, 196, 9
- Clark & Porter (2004) Clark, J. S., & Porter, J. M. 2004, A&A, 427, 839
- Cody et al. (2014) Cody, A. M., Stauffer, J., Baglin, A., et al. 2014, AJ, 147, 82
- Conti & Crowther (2004) Conti, P. S., & Crowther, P. A. 2004, MNRAS, 355, 899
- Contreras Peña et al. (2017a) Contreras Peña, C., Lucas, P. W., Minniti, D., et al. 2017a, MNRAS, 465, 3011
- Contreras Peña et al. (2017b) Contreras Peña, C., Lucas, P. W., Kurtev, R., et al. 2017b, MNRAS, 465
- Cross et al. (2012) Cross, N. J. G., Collins, R. S., Mann, R. G., et al. 2012, A&A, 548, A119
- Cyganowski et al. (2008) Cyganowski, C. J., Whitney, B. A., Holden, E., et al. 2008, AJ, 136, 2391
- Dalton et al. (2006) Dalton, G. B., Caldwell, M., Ward, A. K., et al. 2006, in Proc. SPIE, Vol. 6269, Society of Photo-Optical Instrumentation Engineers (SPIE) Conference Series, 62690X
- Davies et al. (2011) Davies, B., Hoare, M. G., Lumsden, S. L., et al. 2011, MNRAS, 416, 972
- Drake et al. (2009) Drake, A. J., Djorgovski, S. G., Mahabal, A., et al. 2009, in American Astronomical Society Meeting Abstracts, Vol. 213, American Astronomical Society Meeting Abstracts #213, 470.07
- Evans et al. (2009) Evans, Neal J., I., Dunham, M. M., Jørgensen, J. K., et al. 2009, ApJS, 181, 321
- Evans et al. (2010) Evans, I. N., Primini, F. A., Glotfelty, K. J., et al. 2010, ApJS, 189, 37
- Faimali (2013) Faimali, A. D. 2013, PhD thesis, University of Hertfordshire
- Fazio et al. (2004) Fazio, G. G., Hora, J. L., Allen, L. E., et al. 2004, ApJS, 154, 10
- Frost et al. (2021) Frost, A. J., Oudmaijer, R. D., de Wit, W. J., & Lumsden, S. L. 2021, arXiv e-prints, arXiv:2102.05087
- Gaia Collaboration et al. (2019) Gaia Collaboration, Eyer, L., Rimoldini, L., et al. 2019, A&A, 623, A110
- García Pérez et al. (2016) García Pérez, A. E., Allende Prieto, C., Holtzman, J. A., et al. 2016, AJ, 151, 144
- Greene et al. (1994) Greene, T. P., Wilking, B. A., Andre, P., Young, E. T., & Lada, C. J. 1994, ApJ, 434, 614
- Gunn et al. (2006) Gunn, J. E., Siegmund, W. A., Mannery, E. J., et al. 2006, AJ, 131, 2332
- Guo et al. (2020) Guo, Z., Lucas, P. W., Contreras Peña, C., et al. 2020, MNRAS, 492, 294
- Herbig (1952) Herbig, G. H. 1952, JRASC, 46, 222
- Herbig (1966) —. 1966, Vistas in Astronomy, 8, 109
- Herbig (1989) Herbig, G. H. 1989, in European Southern Observatory Conference and Workshop Proceedings, Vol. 33, European Southern Observatory Conference and Workshop Proceedings, ed. B. Reipurth, 233–246
- Hindson et al. (2012) Hindson, L., Thompson, M. A., Urquhart, J. S., et al. 2012, MNRAS, 421, 3418
- Hollenbach & Tielens (1997) Hollenbach, D. J., & Tielens, A. G. G. M. 1997, ARA&A, 35, 179
- Huijse et al. (2011) Huijse, P., Estevez, P. A., Zegers, P., Principe, J. C., & Protopapas, P. 2011, IEEE Signal Processing Letters, 18, 371
- Hunter (2007) Hunter, J. D. 2007, Computing In Science & Engineering, 9, 90
- Indebetouw et al. (2005) Indebetouw, R., Mathis, J. S., Babler, B. L., et al. 2005, ApJ, 619, 931
- Ivezić et al. (2019) Ivezić, Ž., Kahn, S. M., Tyson, J. A., et al. 2019, ApJ, 873, 111
- Joy (1945) Joy, A. H. 1945, ApJ, 102, 168
- Kaiser et al. (2002) Kaiser, N., Aussel, H., Burke, B. E., et al. 2002, Society of Photo-Optical Instrumentation Engineers (SPIE) Conference Series, Vol. 4836, Pan-STARRS: A Large Synoptic Survey Telescope Array, ed. J. A. Tyson & S. Wolff, 154–164
- Kuhn et al. (2020) Kuhn, M. A., de Souza, R. S., Krone-Martins, A., et al. 2020, arXiv e-prints, arXiv:2011.12961
- Kurtev et al. (2017) Kurtev, R., Gromadzki, M., Beamín, J. C., et al. 2017, MNRAS, 464, 1247
- Lada & Adams (1992) Lada, C. J., & Adams, F. C. 1992, ApJ, 393, 278
- Li et al. (2014) Li, Z. Y., Banerjee, R., Pudritz, R. E., et al. 2014, in Protostars and Planets VI, ed. H. Beuther, R. S. Klessen, C. P. Dullemond, & T. Henning, 173
- Lucas et al. (2017) Lucas, P. W., Smith, L. C., Contreras Peña, C., et al. 2017, MNRAS, 472, 2990
- Majewski et al. (2017) Majewski, S. R., Schiavon, R. P., Frinchaboy, P. M., et al. 2017, AJ, 154, 94
- Marton et al. (2019) Marton, G., Ábrahám, P., Szegedi-Elek, E., et al. 2019, MNRAS, 487, 2522
- McKee & Ostriker (2007) McKee, C. F., & Ostriker, E. C. 2007, ARA&A, 45, 565
- Medina et al. (2018) Medina, N., Borissova, J., Bayo, A., et al. 2018, ApJ, 864, 11
- Meyer et al. (1997) Meyer, M. R., Calvet, N., & Hillenbrand, L. A. 1997, AJ, 114, 288
- Minniti (2018) Minniti, D. 2018, in The Vatican Observatory, Castel Gandolfo: 80th Anniversary Celebration, ed. G. Gionti & J.-B. Kikwaya Eluo, Vol. 51, 63
- Minniti et al. (2010) Minniti, D., Lucas, P. W., Emerson, J. P., et al. 2010, New A, 15, 433
- Molinari et al. (2016) Molinari, S., Schisano, E., Elia, D., et al. 2016, A&A, 591, A149
- Mottram et al. (2011) Mottram, J. C., Hoare, M. G., Davies, B., et al. 2011, ApJ, 730, L33
- Nidever et al. (2015) Nidever, D. L., Holtzman, J. A., Allende Prieto, C., et al. 2015, AJ, 150, 173
- Ojha et al. (2004) Ojha, D. K., Tamura, M., Nakajima, Y., et al. 2004, ApJ, 616, 1042
- Oliphant (2006) Oliphant, T. 2006, Guide to NumPy (MIT), 1–371. https://web.mit.edu/dvp/Public/numpybook.pdf
- Pedregosa et al. (2011) Pedregosa, F., Varoquaux, G., Gramfort, A., et al. 2011, Journal of Machine Learning Research, 12, 2825
- Pestalozzi et al. (2005) Pestalozzi, M. R., Minier, V., & Booth, R. S. 2005, A&A, 432, 737
- Rebull et al. (2014a) Rebull, L. M., Cody, A. M., Covey, K. R., et al. 2014a, AJ, 148, 92
- Rebull et al. (2014b) —. 2014b, AJ, 148, 92
- Rice et al. (2015) Rice, T. S., Reipurth, B., Wolk, S. J., Vaz, L. P., & Cross, N. J. G. 2015, AJ, 150, 132
- Rice et al. (2012) Rice, T. S., Wolk, S. J., & Aspin, C. 2012, ApJ, 755, 65
- Rieke & Lebofsky (1985) Rieke, G. H., & Lebofsky, M. J. 1985, ApJ, 288, 618
- Robitaille et al. (2008) Robitaille, T. P., Meade, M. R., Babler, B. L., et al. 2008, AJ, 136, 2413
- Saito et al. (2012) Saito, R. K., Hempel, M., Minniti, D., et al. 2012, A&A, 537, A107
- Samus (2005) Samus, N. N. 2005, IAU Circ., 8596, 2
- Scargle (1982) Scargle, J. D. 1982, ApJ, 263, 835
- Schechter et al. (1993) Schechter, P. L., Mateo, M., & Saha, A. 1993, PASP, 105, 1342
- Sokolovsky et al. (2017) Sokolovsky, K. V., Gavras, P., Karampelas, A., et al. 2017, MNRAS, 464, 274
- Straizys & Kuriliene (1981) Straizys, V., & Kuriliene, G. 1981, Ap&SS, 80, 353
- Sugitani et al. (2002) Sugitani, K., Tamura, M., Nakajima, Y., et al. 2002, ApJ, 565, L25
- Sutherland et al. (2015) Sutherland, W., Emerson, J., Dalton, G., et al. 2015, A&A, 575, A25
- Taylor (2006) Taylor, M. B. 2006, in Astronomical Society of the Pacific Conference Series, Vol. 351, Astronomical Data Analysis Software and Systems XV, ed. C. Gabriel, C. Arviset, D. Ponz, & S. Enrique, 666
- Teixeira et al. (2018) Teixeira, G. D. C., Kumar, M. S. N., Smith, L., et al. 2018, A&A, 619, A41
- The Astropy Collaboration et al. (2018) The Astropy Collaboration, Price-Whelan, A. M., Sipőcz, B. M., et al. 2018, ArXiv e-prints, arXiv:1801.02634
- Vanderplas et al. (2012) Vanderplas, J., Connolly, A., Ivezić, Ž., & Gray, A. 2012, in Conference on Intelligent Data Understanding (CIDU), 47 –54
- Vorobyov (2009) Vorobyov, E. I. 2009, ApJ, 704, 715
- Vorobyov et al. (2019) Vorobyov, E. I., Skliarevskii, A. M., Elbakyan, V. G., et al. 2019, A&A, 627, A154
- Wenger et al. (2000) Wenger, M., Ochsenbein, F., Egret, D., et al. 2000, A&AS, 143, 9
- Werner et al. (2004) Werner, M. W., Roellig, T. L., Low, F. J., et al. 2004, ApJS, 154, 1
- Wilson et al. (2019) Wilson, J. C., Hearty, F. R., Skrutskie, M. F., et al. 2019, PASP, 131, 055001
- Wolk et al. (2015) Wolk, S. J., Günther, H. M., Poppenhaeger, K., et al. 2015, AJ, 150, 145
- Zechmeister & Kürster (2009) Zechmeister, M., & Kürster, M. 2009, A&A, 496, 577