SGCN:Sparse Graph Convolution Network for Pedestrian Trajectory Prediction
Abstract
Pedestrian trajectory prediction is a key technology in autopilot, which remains to be very challenging due to complex interactions between pedestrians. However, previous works based on dense undirected interaction suffer from modeling superfluous interactions and neglect of trajectory motion tendency, and thus inevitably result in a considerable deviance from the reality. To cope with these issues, we present a Sparse Graph Convolution Network (SGCN) for pedestrian trajectory prediction. Specifically, the SGCN explicitly models the sparse directed interaction with a sparse directed spatial graph to capture adaptive interaction pedestrians. Meanwhile, we use a sparse directed temporal graph to model the motion tendency, thus to facilitate the prediction based on the observed direction. Finally, parameters of a bi-Gaussian distribution for trajectory prediction are estimated by fusing the above two sparse graphs. We evaluate our proposed method on the ETH and UCY datasets, and the experimental results show our method outperforms comparative state-of-the-art methods by in Average Displacement Error (ADE) and in Final Displacement Error (FDE). Notably, visualizations indicate that our method can capture adaptive interactions between pedestrians and their effective motion tendencies.
1 Introduction
Given the observed trajectories of pedestrians, pedestrian trajectory prediction aims to predict a sequence of future location coordinates of pedestrians, which plays a critical role in various applications like autonomous driving [3, 29], video surveillance [28, 45] and visual recognition [9, 27, 16].
Despite the recent advances in the literature, pedestrian trajectory prediction remains to be a very challenging task due to the complex interactions between pedestrians. For example, the motion of a pedestrian is very easy to be disturbed by other pedestrians [11], close friends or colleagues are likely to walk in groups [32], and different pedestrians usually conduct similar social actions [38]. To model the interactions between pedestrians, extensive works [31, 2, 11, 23, 19, 32, 46] have been done in the past few years, in which the weighting-by-distance methods [31, 2, 11, 32] and the attention-based methods [23, 19, 46, 8, 17, 18] have achieved the state-of-the-art results in pedestrian trajectory prediction.
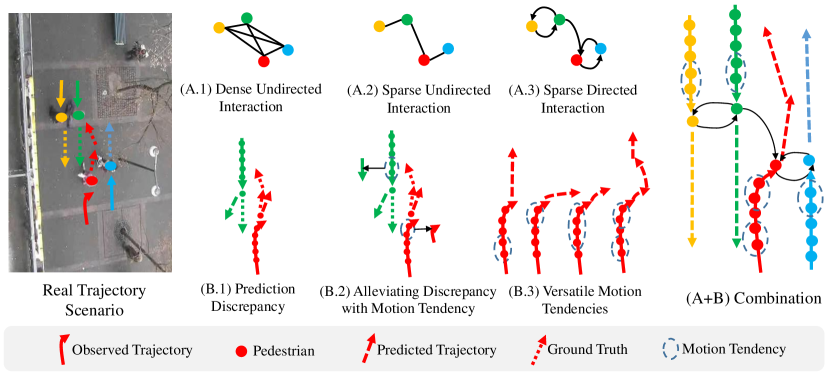
Most of the weighting-by-distance and attention-based methods take a dense interaction model to represent the complex interactions between pedestrians, in which they assume that a pedestrian interacts with all the rest pedestrians. Besides, the weighting-by-distance methods apply the relative distance to model the undirected interaction, in which the interaction between two pedestrians are identical to each other. However, we argue that both the dense interaction and undirected interaction will introduce the superfluous interactions between pedestrians. As shown in Figure 1: (1) two pairs of pedestrians head towards from the opposite direction, while only the trajectory of red pedestrian detours to avoid the collision with green pedestrian; and (2) the trajectories of blue and yellow pedestrians not influence each other. It is obvious that the dense or sparse undirected interaction based methods will fail to deal with the interactions in this case. For example, the dense undirected interaction, as represented by A.1, will generate superfluous interactions between yellow and blue pedestrians, due to the trajectories of yellow and blue pedestrians do not influence each other. Besides, the sparse undirected interaction, as denoted in A.2, generates the superfluous interactions between the green and red pedestrians, because the red pedestrian detours to avoid collision with the green pedestrian, while the green pedestrian walks straight forward. To solve the above problems, it’s better to design a Sparse Directed Interaction, as shown in A.3, which can interact with the adaptive pedestrians in the prediction of pedestrian trajectory.
What’s worse, previous works focus on collision avoidance, which leads to the predicted trajectories tend to generate detour trajectories to avoid the collision for green and red pedestrians, as indicated in B.1, while the green pedestrian deviates from the ground truth. In this case, we propose motion tendency, which is represented by a short-term trajectory enclosed by the blue dotted circle as shown in B.2, the trajectory direction of the green pedestrian is straight forward, and that of the red pedestrian deflects to avoid the collision with the green pedestrian. Based on the assumption that the direction of a trajectory will not change too abruptly, the motion tendency is beneficial to the prediction for green pedestrian. It should be noted that the motion tendency is versatile, as shown in B.3, in which the last one performs better than others, because it can jointly capture the “straight forward” and “temporary deviation” tendencies. Once the effective set of intermediate points can be found, the motion tendency will facilitate pedestrian trajectory prediction.
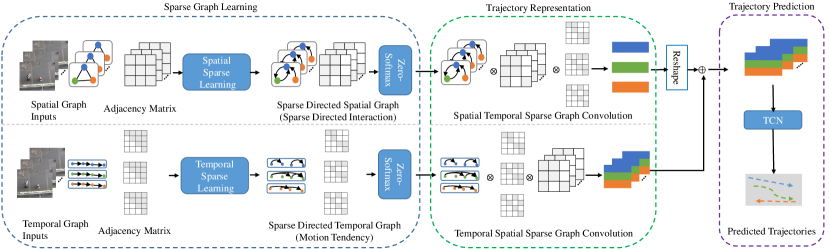
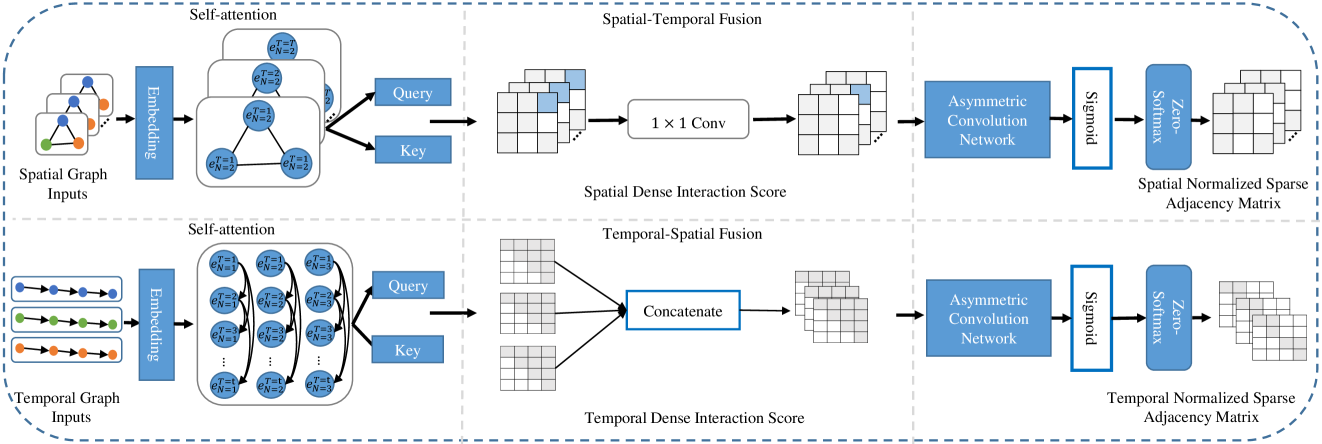
In this paper, we present a novel Sparse Graph Convolution Network (SGCN) which combines the Sparse Directed Interaction and Motion Tendency for pedestrian trajectory prediction. As shown in Figure 1 (A+B), the Sparse Directed Interaction discover the set of pedestrians that effectively influence the trajectory of a particular pedestrian, and the Motion Tendencies improve the future trajectory of interacted pedestrians. In particular, as shown in Figure 2, the Sparse Directed Spatial graph and Sparse Directed Temporal graph are jointly learned to model the Sparse Directed Interaction and the Motion Tendency of trajectory. Specifically, the Sparse Graph Learning, as illustrated in Figure 3, leverages self-attention [40] mechanism to learn the asymmetric dense and directed interaction scores between trajectory points. Then, these interaction scores are fused and fed into asymmetric convolutional networks to obtain high-level interaction features. Finally, a sparse directed spatial and a sparse directed temporal adjacency matrix can be obtained after pruning the superfluous interactions using a constant threshold and a normalization step of our “Zero-Softmax” function. The final asymmetric normalized sparse directed adjacency matrices can represent the sparse directed graph. Once the above two graphs are obtained, we further learn the trajectory representation by a cascade of Graph Convolution Networks [22], and employ the Time Convolution Network [4] to estimate the parameters of the bi-Gaussian distribution, which are used to generate the predicted trajectories.
Extensive experimetal results on the ETH [34] and UCY [24] datasets show that our method outperforms all the comparison state-of-the-art works.
To our best knowledge, this is the first work that explicitly models the Sparse Directed Interaction and Motion Tendency. In summary, our contributions are three-fold: (1) we propose to model the Sparse Directed Interaction and Motion Tendency to improve the predicted trajectories; (2) we design an adaptive method to model the Sparse Directed Interaction and Motion Tendency; and (3) we propose a sparse graph convolution network to learn the trajectory representations, where the advantage of explicit sparsity is demonstrated by the experiments.
2 Related Works
Pedestrian Trajectory Prediction. Thanks to its powerful representational ability, deep learning becomes increasingly prevalent for predicting the pedestrian trajectories. Social-LSTM [1] models the trajectory of each pedestrian with Recurrent Neural Networks (RNNs) [14, 20, 6], and computes the interaction between pedestrians within a certain radius from the pooled hidden states. SGAN [11] predicts multi-modal trajectory using the Generative Adversarial Network (GAN) [10, 48, 5], and proposes a new pooling mechanism to compute interactions based on relative distance between pedestrians. TPHT [30] represents each pedestrian by an LSTM and employs a soft-attention mechanism [42] to model interactions between pedestrians. Moreover, subsequent works leverage the scene features to improve the prediction accuracy. PITF [26] considers the human-scene interaction and human-object interaction. Sophine [37] extracts scene features and social features by a two-way attention mechanism, and computes the weights for all agents with a social-attention. TGFP [25] predicts both coarse and fine locations by using scene information.
Since the graph structure can better fit the scene, another track of works model the human-human interaction using graph. Social-BiGAT [23] models the trajectory of each pedestrian using LSTM, and the interactions by the Graph Attention Network (GAT) [41]. To better represent the interaction between pedestrians, Social-STGCNN [32] directly models the trajectory as a graph, where the edges weighted by the pedestrian relative distance represent interactions between pedestrians. RSGB [38] notes there are strong interactions between some distant pedestrian pairs, hence invites sociologists to manually divide the pedestrians into different groups according to specific physical rules and sociological actions. STAR [46] models the spatial interaction and temporal dependencies by the Transformer [40] framework.
In brief, previous works model the interactions for either the neighborhood within a fixed physical range, or unexceptionally all pedestrians. Presumably, this may result in discrepancies on the predictions due to superfluous interactions. In contrast, we propose a Sparse Directed Interaction, which is capable of finding the adaptive pedestrians involved in the interaction, thus to alleviate such problem. Besides, our method also captures the effective Motion Tendency, which is helpful to improve the accuracy of predicted trajectory.
Graph Convolution Networks. Graph convolution networks (GCNs) are suitable for handling non-Euclidean data. The existing GCN models can be divided into two categories: 1) the spectrum domain GCNs [22, 7] design the convolution operation based on Graph Fourier Transform. It requires the adjacency matrix to be symmetric due to the eigen decomposition of Laplacian matrix; 2) the GCNs in spatial domain directly conduct convolution on the edge, which is applicable on asymmetric adjacency matrices. For example, GraphSage [12] aggregates the nodes in three different ways and fuses adjacent nodes in different orders to extract node features. GAT [41] models the interaction between nodes using an attention mechanism. In order to deal with the spatio-temporal data, STGCN [43] extends the spatial GCN to spatio-temporal GCN for skeleton-based action recognition, which aggregates the nodes from a local spatio-temporal scope. Our SGCN differs from all the above GCNs, since it aggregates the nodes based on a learned sparse adjacency matrix, which means the set of nodes to be aggregated is dynamically determined.
Self-Attention Mechanism. The core idea of the Transformer [40], \ie, self-attention, has been demonstrated successfully in place of RNNs [20, 6] on a series of sequence modeling tasks in natural language processing, such as text generation [44], machine translation [35], etc. Self-attention decouples the attention into the query, key and value which can capture long-range dependencies, and takes advantage of parallel computation compared with RNNs. To represent the relationship between every pair of elements of the input sequence, self-attention computes attention scores by a matrix multiplication between the query and key.
In our method, we only compute a single layer attention scores to model Sparse Directed Interaction and Motion Tendency. Compared to the most recent work [46], which predicts future trajectories by stacking Transformer block (computation and memory expensive [15]), our method is parameter-efficient and achieves better performance.
3 Our Method
Pedestrian trajectory prediction aims to predict future location coordinates of pedestrians. Given a series of observed video frames over time , we can obtain the spatial (2D-Cartesian) coordinates of all pedestrians with a tracking algorithm. Based on these trajectories, our objective is to predict the pedestrian coordinates within a future time .
As discussed above, the existing works suffer from superfluous interactions by dense undirected graphs. Meanwhile, they also neglect the exploitable Motion Tendency clue. To mitigate these limitations, we propose a Sparse Graph Convolutional Network (SGCN) for trajectory prediction, which mainly involves Sparse Graph Learning and bi-Gaussian distribution parameter estimation based on the trajectory representations. The overall architecture of the proposed network is represented in Figure 2. First, the Sparse Directed Interaction (SDI) and Motion Tendency (MT) are learned from the spatial and temporal graph inputs using self-attention mechanism and asymmetric convolution networks, respectively. Then, subsequent sparse spatial and temporal Graph Convolution Networks extract the interaction and tendency features from the asymmetric adjacency matrices representing sparse directed spatial graph (i.e., SDI) and sparse directed temporal graph (i.e., MT). Finally, the learned trajectory representations are fed into a Time Convolution Network (TCN) to predict the parameters of a bi-Gaussian distribution, which generates the predicted trajectory.
3.1 Sparse Graph Learning
Graph Inputs. Given input trajectories , where denotes the dimension of spatial coordinate, we construct a spatial graph and a temporal graph as illustrated in Figure 3. The spatial graph at time step represents locations of pedestrians, while temporal graph for pedestrian represents the corresponding trajectory. and represent nodes of and , respectively, and the attribute of is the coordinate of the -th pedestrian at time step . and represent edges of and , respectively, where indicate whether the nodes or nodes are connected (denoted as 1) or disconnected (denoted as 0), respectively. Since there is no prior-knowledge on the connections of nodes, the elements in are initialized as 1, while is initialized as upper triangular matrix filled with because of the temporal dependency, namely the current state is independent to future states.
Sparse Directed Spatial Graph. To increase the sparsity of the spatial graph inputs, \ie, identify the exact set of pedestrians involved in interactions in the spatial graph, we first adopt the self-attention mechanism [40] to compute the asymmetric attention score matrix, namely the dense spatial interaction between pedestrians, as follows:
| (1) |
where denotes linear transformation, are the graph embeddings, and are the query and key of the self-attention mechanism, respectively. , , are weights of the linear transformations, and is a scaled factor [40] to ensure numerical stability.
Since is computed at every time step independently, it does not contain any temporal dependency information of the trajectories. Hence, we stack the dense interactions from every time step as , and then fuse these stacked interactions with convolution along the temporal channel, resulting in spatial-temporal dense interactions .
A slice of at each time step is an asymmetric square matrix, where its -th element represents the influence of node to node . Then, the initiative and passive relations represented in the rows and columns of the matrix respectively can be combined to obtain high-level interaction features. Specifically, a cascade of asymmetric convolution kernels [39] are applied on the rows and columns of , respectively, i.e.,
| (2) |
where and are the row-based and column-based asymmetric convolution feature maps at the -th layer, respectively, is the activated feature map, and denotes a non-linear activation function. and are the convolution kernels of sizes and (i.e., row and column vectors), respectively. Note, is initialized as , and all the convolution operations are padded with zeros in order to keep the output size as same as the input size. Thus, the activated feature map obtained from the last convolution layer is the high-level interaction feature of size .
We proceed to generate the sparse interaction mask by element-wise threshold on with a hyper-parameter . When , the -th element of is set to , otherwise , i.e.,
| (3) |
where is the indicator function, which outputs if the corresponding inequality holds, otherwise . The is Sigmoid activation function. To ensure the nodes are self-connected, we add an identity matrix to the interaction mask, and then fuse it with the spatial-temporal dense interaction by element-wise multiplication, resulting in a sparse adjacency matrix , i.e.,
| (4) |
where denotes element-wise multiplication.
Some previous works (e.g., [22]) suggest the normalization of adjacency matrix is essential for GCN to function properly. Nevertheless, the related works in the vertex domain directly adopt Softmax function for adjacency matrix normalization, which leads to a side-effect that the sparse matrix will be back to dense matrix because Softmax outputs non-zero values for zero inputs. In this case, the pedestrians that do not interact with each other are forced to interact with each other again. To avoid this problem, we design a “Zero-Softmax“ function to to keep the sparsity and the experimental results of ablation study represent the “Zero-Softmax“ can further improve the performance. Specifically, given a flattened matrix ,
| (5) |
where is a neglectable small constant to ensure numerical stability, and is the dimension of the input vector. Upon this, we can obtain the normalized sparse adjacency matrix . Thus, a spatial-temporal sparse directed graph representing the Sparse Directed Interactions is eventually obtained from the spatial graph inputs. The whole process is illustrated in Figure 3.
Sparse Directed Temporal Graph. Following a similar way with the sparse directed spatial graph, we can also obtain the effective Motion Tendency, namely the normalized adjacency matrix from the temporal graph inputs, except for two differences.
First, a position encoding tensor [40] is added to , i.e., , because trajectory points in different order indicate different Motion Tendencies. Notably, the dense temporal interaction is also an upper triangular matrix like due to temporal dependency.
The second difference lies in the temporal-spatial fusion step as illustrated in Figure 3, where we can not perform convolution on obtained by stacking , because the number of pedestrians is variable for different scenes. To simplify operation, we directly view the as the temporal-spatial dense interaction.
Thus, we eventually obtain a temporal-spatial sparse directed graph representing the Motion Tendency from the temporal graph inputs.
| Model | Year | ETH | HOTEL | UNIV | ZARA1 | ZARA2 | AVG |
|---|---|---|---|---|---|---|---|
| Vanilla LSTM [1] | 2016 | 1.09/2.41 | 0.86/1.91 | 0.61/1.31 | 0.41/0.88 | 0.52/1.11 | 0.70/1.52 |
| Social LSTM [1] | 2016 | 1.09/2.35 | 0.79/1.76 | 0.67/1.40 | 0.47/1.00 | 0.56/1.17 | 0.72/1.54 |
| SGAN [11] | 2018 | 0.87/1.62 | 0.67/1.37 | 0.76/1.52 | 0.35/0.68 | 0.42/0.84 | 0.61/1.21 |
| Sophie [37] | 2019 | 0.70/1.43 | 0.76/1.67 | 0.54/1.24 | 0.30/0.63 | 0.38/0.78 | 0.51/1.15 |
| PITF [26] | 2019 | 0.73/1.65 | 0.30/0.59 | 0.60/1.27 | 0.38/0.81 | 0.31/0.68 | 0.46/1.00 |
| GAT [23] | 2019 | 0.68/1.29 | 0.68/1.40 | 0.57/1.29 | 0.29/0.60 | 0.37/0.75 | 0.52/1.07 |
| Social-BIGAT [23] | 2019 | 0.69/1.29 | 0.49/1.01 | 0.55/1.32 | 0.30/0.62 | 0.36/0.75 | 0.48/1.00 |
| Social-STGCNN [32] | 2020 | 0.64/1.11 | 0.49/0.85 | 0.44/0.79 | 0.34/0.53 | 0.30/0.48 | 0.44/0.75 |
| RSBG w/o context [38] | 2020 | 0.80/1.53 | 0.33/0.64 | 0.59/1.25 | 0.40/0.86 | 0.30/0.65 | 0.48/0.99 |
| STAR [46] | 2020 | 0.56/1.11 | 0.26/0.50 | 0.52/1.15 | 0.41/0.90 | 0.31/0.71 | 0.41/0.87 |
| SGCN (Ours) | - | 0.63/1.03 | 0.32/0.55 | 0.37/0.70 | 0.29/0.53 | 0.25/0.45 | 0.37/0.65 |
3.2 Trajectory Representation and Prediction
GCNs can aggregate the nodes of sparse graphs representing (SDI) and (MT), and learn the trajectory representation. As illustrated in Figure 2, we use two GCNs to learn the trajectory representation, where in one branch is fed to the network ahead of , while in the other branch they are fed in the reverse order. Thus, the first branch produces interaction-tendency feature , while the other branch produces tendency-interaction feature , i.e.,
| (6) |
where ,, and are GCN weights, and represents the -th layer of GCN. is initialized as , and is initialized as . The trajectory representation is the sum of the last GCN outputs and .
Trajectory Prediction and Loss Function. We follow Social-LSTM [1] to assume that the trajectory coordinates at time step of pedestrian follow a bi-variate Gaussian distribution , where is the mean, is the standard deviation, and is the correlation coefficient. Given the final trajectory representation , we can predict the parameters of the bi-Gaussian distribution with a TCN [4] on the time dimension following Social-STGCNN [32]. Note, TCN is chosen because it does not suffer from gradient vanishing and high computational cost like traditional RNNs [14, 20, 6]. Hence, the method can be trained by minimizing the negative log-likelihood loss as
| (7) |
where denotes all trainable parameters in the method.
4 Experiments and Analysis
Evaluation Datasets. To validate the efficacy of our proposed method, we use two public pedestrian trajectory datasets, i.e., ETH [34] and UCY [24], which are the most widely used benchmarks for the trajectory prediction task. In particular, ETH dataset contains the ETH and HOTEL scenes, while the UCY dataset contains three different scenes including UNIV, ZARA1, and ZARA2. We use the “leave-one-out” [38] method for training and evaluation. We follow existing works that observing 8 frames (3.2 seconds) trajectories and predicting the next 12 frames (4.8 seconds).
Evaluation Metrics. We employ two metrics, namely Average Displacement Error (ADE) [36] and Final Displacement Error (FDE) [1] to evaluate the prediction result. ADE measures the average L-2 distance between all the predicted trajectory points obtained from the method and all ground-truth future trajectory points, while FDE measures the L-2 distance between the final predicted destination obtained from the method and final destination of the ground-truth future trajectory point.
Experimental Settings. In our experiments, the embedding dimension of self-attention and the dimension of graph embedding are both set to . The number of self-attention layer is . The asymmetric convolution network comprises convolution layers with kernel size . The spatial-temporal GCN and temporal-spatial GCN cascade 1 layer, respectively. And the TCN cascade 4 layers. The threshold value is empirically set to 0.5. PRelu [13] is adopted as the nonlinear activation . The proposed method is trained using the Adam [21] optimizer for epochs with data batches of size . The initial learning rate is set to , which is decayed by a factor with an interval of epochs. During the inference phase, samples are drawn from the learned bi-variate Gaussian distribution and the closest sample to ground-truth is used to compute the ADE and FDE metrics. Our method is implemented on PyTorch [33]. The code has been published222code available at https://github.com/shuaishiliu/SGCN.
| Variants | ETH | HOTEL | UNIV | ZARA1 | ZARA2 | AVG |
|---|---|---|---|---|---|---|
| SGCN w/o MT | 0.92/1.23 | 0.69/1.53 | 0.61/1.80 | 0.52/0.60 | 0.40/0.80 | 0.62/1.19 |
| SGCN w/o ZS | 0.73/1.39 | 0.34/0.59 | 0.38/0.75 | 0.34/0.65 | 0.26/0.45 | 0.41/0.76 |
| SGCN w/o SDI | 0.81/1.66 | 0.67/1.42 | 0.79/1.78 | 0.59/0.72 | 0.44/0.82 | 0.66/1.28 |
| SGCN (Ours) | 0.63/1.03 | 0.32/0.55 | 0.37/0.70 | 0.29/0.53 | 0.25/0.45 | 0.37/0.65 |
| Variants | ETH | HOTEL | UNIV | ZARA1 | ZARA2 | AVG |
|---|---|---|---|---|---|---|
| 0.91/1.82 | 0.36/0.62 | 0.41/0.83 | 0.43/0.83 | 0.34/0.65 | 0.49/0.95 | |
| 0.69/1.11 | 0.32/0.57 | 0.41/0.78 | 0.31/0.53 | 0.27/0.45 | 0.40/0.68 | |
| 0.66/1.07 | 0.38/0.46 | 0.54/0.77 | 0.30/0.52 | 0.25/0.47 | 0.42/0.65 | |
| 0.66/1.16 | 0.38/0.58 | 0.58/0.79 | 0.40/0.47 | 0.27/0.51 | 0.45/0.70 | |
| SGCN (Ours) | 0.63/1.03 | 0.32/0.55 | 0.37/0.70 | 0.29/0.53 | 0.25/0.45 | 0.37/0.65 |
4.1 Comparison with State-of-the-Arts
We compare our method with nine state-of-the-art methods, including Vanilla LSTM [1], Social-LSTM [1], SGAN [11], Sophie [37], PITF [26], Social-BiGAT [23], Social-STGCNN [32], RSGB [38], and STAR [47], in the past four years. The results are shown in Table 1, which are evaluated by using the ADE and FDE metrics. The results indicate that our method significantly outperforms all the competing methods on both the ETH and UCY datasets. Especially for the ADE metric, our method surpasses the previous best method STAR [47] by 9% averaging on ETH and UCY datasets. For the FDE metric, our method is better than the previous best method Social-STGCNN [32] by a margin of 13% averaging on the ETH and UCY datasets. To our best knowledge, the under-lying reason is that our method can remove the interference from the superfluous interactions by leveraging Sparse Directed Interaction, and the Motion Tendency is leveraged to improve the prediction.
Interestingly, our method outperforms all the dense interaction based methods, such as SGAN [11], Sophie [37], GAT [23], Social-BiGAT [23], Social-STGCNN [32], and STAR [47], on the UNIV sequence which mainly contains dense crowd scenes. We speculate that the dense interaction based methods may capture superfluous interaction objects, which will cause prediction discrepancies. What’s different, our method is capable of removing the superfluous interactions by Sparse Directed Interaction, which is benefit to obtain a better performance.
4.2 Ablation Study
Firstly, we conduct ablative experiments on both ETH and UCY datasets, so as to isolate the contribution of each component to the final performance. Secondly, we set different values of threshold to evaluate the effectiveness of the proposed sparse graph with different sparsity. The detailed experiments are introduced in the following paragraphs.
Contribution of Each Component. As illustrated in Table 2, we evaluate three different variants of our method, in which: (1) SGCN w/o MT denotes the Motion Tendency is removed in our method, in which it merely models the Sparse Directed Interaction; (2) SGCN w/o ZS indicates that the Zero-Softmax is replaced by Softmax for sparse adjacency matrix normalization; and (3) SGCN w/o SDI represents that the Sparse Directed Interaction is removed in our method, in which it merely models the Motion Tendency. From the results, we can see that removing any component from our model will result in a large performance reduction. In particular, the results of SGCN w/o MT show performance degradation in ADE and in FDE, which clearly validate the contribution of the Motion Tendency to the final performance of pedestrian trajectory prediction. Besides, the results of SGCN w/o SDI show performance degradation in ADE and in FDE, which indicate that the sparse directed interaction is also important for the pedestrian trajectory prediction .
Effectiveness of Sparse Graph. As illustrated in Table 3, we evaluate five different variants of our method, in which: (1) : it means there is no interaction between each pair of pedestrians by setting ; (2) : it leads to very sparse directed interaction by setting ; (3) : it leads to relatively dense directed interaction by setting ; (4) : it leads to dense interactions by setting ; and (5) SGCN: it responds to our full method by setting . The experimental results are presented in Table 3. We find that the overall performances of our method reaches a peak when , which means enforcing sparsity to a certain extent is effective enough. Besides, achieves the lowest performance, implying the necessity of modeling interactions between pedestrians. Furthermore, the results of and are better than that of , which indicates that the sparse interaction indeed can lead to performance improvement.
4.3 Visualization
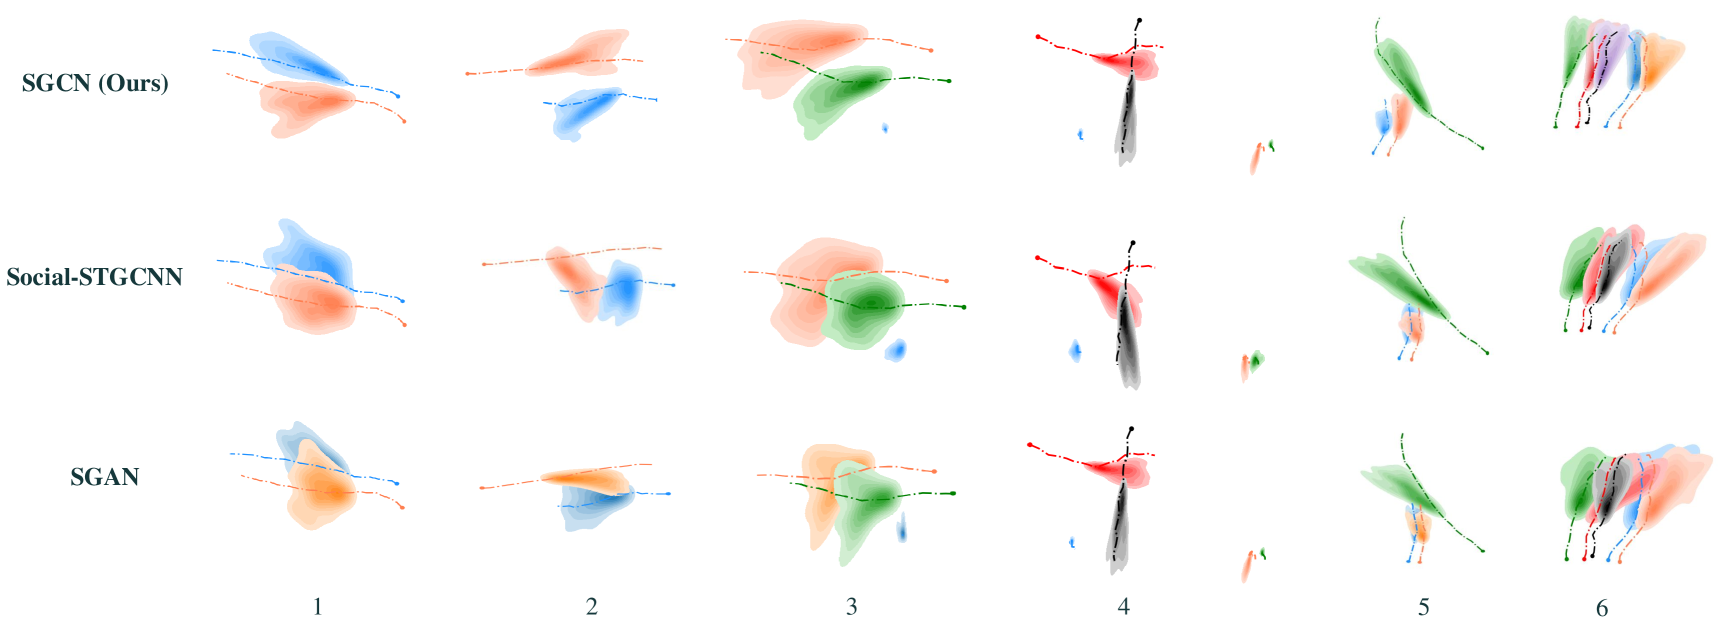
Trajectory Prediction Visualization. We visualize several common interaction scenes in Figure 4, where the solid dot at the end of each trajectory denotes the start. More scene visualizations will be presented in the supplementary materials. We compare our method with Social-STGCNN [32] and SGAN [11], because both of them learn a parameterized distribution of future trajectories.
Specifically, the scenarios and depict two pedestrians walking in parallel in the same or opposite direction, respectively. In these cases, the pedestrians are not likely to collide. The visualization reveals that our predicted distribution has a better tendency along the ground-truth, while both the Social-GCNN and SGAN generate larger overlap which implies potential collisions, and thus deviate from the ground-truth. The scenarios and show two pedestrians heading towards another one that stays still, and one pedestrian meets another pedestrian in a perpendicular direction, respectively. The Social-STGCNN and SGAN again both suffer from the overlap issue, indicating high possibility of collision, while there are less overlaps in our predicted distribution. Particularly, the green pedestrian stands still in scenario , thus our predicted distribution has smaller variance, indicating our method captures the fact that the still pedestrian is not influenced by other pedestrians in scenario . The scenarios and represent the meeting of more than one pedestrian, where our results considerably match the ground-truth, while the results of Social-STGCNN and SGAN have serious overlap and diverge from the ground-truth.
To summarize, both Social-STGCNN and SGAN predict overlapping distributions and deviate from the ground-truth, while our predicted distributions exhibit less overlapping and have a better tendency along the ground-truth. For the overlaps, the reason maybe that Social-STGCNN and SGAN model the dense interaction which inevitably introduces superfluous interactions to disturb the normal trajectory and generate a large detour to avoid collision. In contrast, SGCN models the sparse directed interaction and motion tendency together and leads to a better prediction distribution.
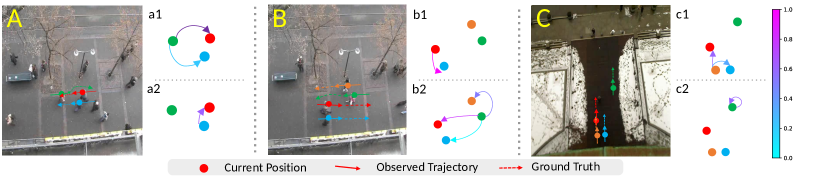
Sparse Directed Interaction Visualization. The Sparse Directed Interaction is visualized in Figure 5, from which we find that our method is able to capture effective interaction objects on different interaction scenes. The graphs (a2), (b1), (c1) and (c2) illustrate the sparse directed interactions that one node is only influenced by part of other nodes. For instance, the graph (a2) represents the sparse directed interaction between the blue node and red node, and it conforms the scene of A, where the trajectory of blue node is only influenced by the red node according to the ground-truth. Furthermore, we find our method can capture interaction objects dynamically, except the sparse directed interaction given by graphs (a2), (b1), (c1) and (c2). The graphs (a1) and (b2) show the green node interacts with all marked nodes.
5 Conclusion
In this paper, we present a sparse graph convolution network for trajectory prediction, which leverages the Sparse Directed Interaction and Motion Tendency. According to the extensive experimental evaluations, our method achieves better performances than previous methods. Moreover, our method can predict trajectories more accurately even under some complex scenes, such as a group of pedestrians walking in parallel. These improvements can be attributed to the abilities of identifying the Sparse Directed Interactions and Motion Tendencies of our method.
6 Acknowledgment
This work was supported partly by National Key R&D Program of China Grant 2018AAA0101400, NSFC Grants 62088102, 61773312, and 61976171, Young Elite Scientists Sponsorship Program by CAST Grant 2018QNRC001, and Natural Science Foundation of Shaanxi Grant 2020JQ-069.
References
- [1] Alexandre Alahi, Kratarth Goel, Vignesh Ramanathan, Alexandre Robicquet, Li Fei-Fei, and Silvio Savarese. Social lstm: Human trajectory prediction in crowded spaces. In CVPR, pages 961–971, 2016.
- [2] Alexandre Alahi, Vignesh Ramanathan, and Li Fei-Fei. Socially-aware large-scale crowd forecasting. In CVPR, pages 2203–2210, 2014.
- [3] Haoyu Bai, Shaojun Cai, Nan Ye, David Hsu, and Wee Sun Lee. Intention-aware online pomdp planning for autonomous driving in a crowd. In ICRA, pages 454–460, 2015.
- [4] Shaojie Bai, J Zico Kolter, and Vladlen Koltun. An empirical evaluation of generic convolutional and recurrent networks for sequence modeling. arXiv preprint arXiv:1803.01271, 2018.
- [5] Andrew Brock, Jeff Donahue, and Karen Simonyan. Large scale gan training for high fidelity natural image synthesis. In ICLR, 2018.
- [6] Junyoung Chung, Caglar Gulcehre, Kyunghyun Cho, and Yoshua Bengio. Gated feedback recurrent neural networks. In ICML, pages 2067–2075, 2015.
- [7] Michaël Defferrard, Xavier Bresson, and Pierre Vandergheynst. Convolutional neural networks on graphs with fast localized spectral filtering. In NeurIPS, pages 3844–3852, 2016.
- [8] Bin Ding, Chengjiang Long, Ling Zhang, and Chunxia Xiao. Argan: Attentive recurrent generative adversarial network for shadow detection and removal. In ICCV, pages 10213–10222, 2019.
- [9] Jeffrey Donahue, Lisa Anne Hendricks, Sergio Guadarrama, Marcus Rohrbach, Subhashini Venugopalan, Kate Saenko, and Trevor Darrell. Long-term recurrent convolutional networks for visual recognition and description. In CVPR, pages 2625–2634, 2015.
- [10] Ian Goodfellow, Jean Pouget-Abadie, Mehdi Mirza, Bing Xu, David Warde-Farley, Sherjil Ozair, Aaron Courville, and Yoshua Bengio. Generative adversarial nets. In NeurIPS, pages 2672–2680, 2014.
- [11] Agrim Gupta, Justin Johnson, Li Fei-Fei, Silvio Savarese, and Alexandre Alahi. Social gan: Socially acceptable trajectories with generative adversarial networks. In CVPR, pages 2255–2264, 2018.
- [12] Will Hamilton, Zhitao Ying, and Jure Leskovec. Inductive representation learning on large graphs. In NeurIPS, pages 1024–1034, 2017.
- [13] K. He, X. Zhang, S. Ren, and J. Sun. Delving deep into rectifiers: Surpassing human-level performance on imagenet classification. In ICCV, pages 1026–1034, 2015.
- [14] Sepp Hochreiter and Jürgen Schmidhuber. Long short-term memory. Neural Computation, 9(8):1735–1780, 1997.
- [15] Lu Hou, Zhiqi Huang, Lifeng Shang, Xin Jiang, Xiao Chen, and Qun Liu. Dynabert: Dynamic bert with adaptive width and depth. In NeurIPS, 2020.
- [16] Tao Hu, Chengjiang Long, and Chunxia Xiao. A novel visual representation on text using diverse conditional gan for visual recognition. TIP, 30:3499–3512, 2021.
- [17] Ashraful Islam, Chengjiang Long, Arslan Basharat, and Anthony Hoogs. Doa-gan: Dual-order attentive generative adversarial network for image copy-move forgery detection and localization. In CVPR, 2020.
- [18] Ashraful Islam, Chengjiang Long, and Richard Radke. A hybrid attention mechanism for weakly-supervised temporal action localization. In AAAI, 2021.
- [19] Boris Ivanovic and Marco Pavone. The trajectron: Probabilistic multi-agent trajectory modeling with dynamic spatiotemporal graphs. In ICCV, pages 2375–2384, 2019.
- [20] Rafal Jozefowicz, Wojciech Zaremba, and Ilya Sutskever. An empirical exploration of recurrent network architectures. In ICML, pages 2342–2350, 2015.
- [21] Diederik P Kingma and Jimmy Ba. Adam: A method for stochastic optimization. In ICLR, 2015.
- [22] Thomas N Kipf and Max Welling. Semi-supervised classification with graph convolutional networks. In ICLR, 2016.
- [23] Vineet Kosaraju, Amir Sadeghian, Roberto Martín-Martín, Ian Reid, Hamid Rezatofighi, and Silvio Savarese. Social-bigat: Multimodal trajectory forecasting using bicycle-gan and graph attention networks. In NeurIPS, pages 137–146, 2019.
- [24] Alon Lerner, Yiorgos Chrysanthou, and Dani Lischinski. Crowds by example. In Computer Graphics Forum, pages 655–664, 2007.
- [25] Junwei Liang, Lu Jiang, Kevin Murphy, Ting Yu, and Alexander Hauptmann. The garden of forking paths: Towards multi-future trajectory prediction. In CVPR, pages 10508–10518, 2020.
- [26] Junwei Liang, Lu Jiang, Juan Carlos Niebles, Alexander G Hauptmann, and Li Fei-Fei. Peeking into the future: Predicting future person activities and locations in videos. In CVPR, pages 5725–5734, 2019.
- [27] Chengjiang Long and Gang Hua. Correlational gaussian processes for cross-domain visual recognition. In CVPR, pages 118–126, 2017.
- [28] Matthias Luber, Johannes A Stork, Gian Diego Tipaldi, and Kai O Arras. People tracking with human motion predictions from social forces. In ICRA, pages 464–469, 2010.
- [29] Yuanfu Luo, Panpan Cai, Aniket Bera, David Hsu, Wee Sun Lee, and Dinesh Manocha. Porca: Modeling and planning for autonomous driving among many pedestrians. RAL, 3(4):3418–3425, 2018.
- [30] Yuexin Ma, Xinge Zhu, Sibo Zhang, Ruigang Yang, Wenping Wang, and Dinesh Manocha. Trafficpredict: Trajectory prediction for heterogeneous traffic-agents. In AAAI, pages 6120–6127, 2019.
- [31] Ramin Mehran, Alexis Oyama, and Mubarak Shah. Abnormal crowd behavior detection using social force model. In CVPR, pages 935–942, 2009.
- [32] Abduallah Mohamed, Kun Qian, Mohamed Elhoseiny, and Christian Claudel. Social-stgcnn: A social spatio-temporal graph convolutional neural network for human trajectory prediction. In CVPR, pages 14424–14432, 2020.
- [33] Adam Paszke, Sam Gross, Francisco Massa, Adam Lerer, James Bradbury, Gregory Chanan, Trevor Killeen, Zeming Lin, Natalia Gimelshein, Luca Antiga, et al. Pytorch: An imperative style, high-performance deep learning library. In NeurIPS, pages 8026–8037, 2019.
- [34] Stefano Pellegrini, Andreas Ess, Konrad Schindler, and Luc Van Gool. You’ll never walk alone: Modeling social behavior for multi-target tracking. In ICCV, pages 261–268, 2009.
- [35] Alec Radford, Karthik Narasimhan, Tim Salimans, and Ilya Sutskever. Improving language understanding by generative pre-training, 2018.
- [36] Pongsathorn Raksincharoensak, Takahiro Hasegawa, and Masao Nagai. Motion planning and control of autonomous driving intelligence system based on risk potential optimization framework. IJAE, 7(AVEC14):53–60, 2016.
- [37] Amir Sadeghian, Vineet Kosaraju, Ali Sadeghian, Noriaki Hirose, Hamid Rezatofighi, and Silvio Savarese. Sophie: An attentive gan for predicting paths compliant to social and physical constraints. In CVPR, pages 1349–1358, 2019.
- [38] Jianhua Sun, Qinhong Jiang, and Cewu Lu. Recursive social behavior graph for trajectory prediction. In CVPR, pages 660–669, 2020.
- [39] Christian Szegedy, Vincent Vanhoucke, Sergey Ioffe, Jon Shlens, and Zbigniew Wojna. Rethinking the inception architecture for computer vision. In CVPR, pages 2818–2826, 2016.
- [40] Ashish Vaswani, Noam Shazeer, Niki Parmar, Jakob Uszkoreit, Llion Jones, Aidan N Gomez, Łukasz Kaiser, and Illia Polosukhin. Attention is all you need. In NeurIPS, pages 5998–6008, 2017.
- [41] Petar Veličković, Guillem Cucurull, Arantxa Casanova, Adriana Romero, Pietro Liò, and Yoshua Bengio. Graph attention networks. In ICLR, 2018.
- [42] Anirudh Vemula, Katharina Muelling, and Jean Oh. Social attention: Modeling attention in human crowds. In ICRA, pages 1–7, 2018.
- [43] Sijie Yan, Yuanjun Xiong, and Dahua Lin. Spatial temporal graph convolutional networks for skeleton-based action recognition. In AAAI, pages 7444–7452, 2018.
- [44] Zhilin Yang, Zihang Dai, Yiming Yang, Jaime Carbonell, Russ R Salakhutdinov, and Quoc V Le. Xlnet: Generalized autoregressive pretraining for language understanding. In NeurIPS, pages 5753–5763, 2019.
- [45] Masahiro Yasuno, Noboru Yasuda, and Masayoshi Aoki. Pedestrian detection and tracking in far infrared images. In CVPR, pages 125–125, 2004.
- [46] Cunjun Yu, Xiao Ma, Jiawei Ren, Haiyu Zhao, and Shuai Yi. Spatio-temporal graph transformer networks for pedestrian trajectory prediction. In ECCV, pages 507–523, 2020.
- [47] Cunjun Yu, Xiao Ma, Jiawei Ren, Haiyu Zhao, and Shuai Yi. Spatio-temporal graph transformer networks for pedestrian trajectory prediction. In ECCV, 2020.
- [48] Jun-Yan Zhu, Taesung Park, Phillip Isola, and Alexei A Efros. Unpaired image-to-image translation using cycle-consistent adversarial networks. In ICCV, pages 2223–2232, 2017.