Overscreening and Underscreening in Solid-Electrolyte Grain Boundary Space-Charge Layers
Abstract
Polycrystalline solids can exhibit material properties that differ significantly from those of equivalent single-crystal samples, in part, because of a spontaneous redistribution of mobile point defects into so-called space-charge regions adjacent to grain boundaries. The general analytical form of these space-charge regions is known only in the dilute limit, where defect–defect correlations can be neglected. Using kinetic Monte Carlo simulations of a three-dimensional Coulomb lattice gas, we show that grain-boundary space-charge regions in non-dilute solid electrolytes exhibit overscreening—damped oscillatory space-charge profiles—and underscreening—decay lengths that are longer than the corresponding Debye length and that increase with increasing defect–defect interaction strength. Overscreening and underscreening are known phenomena in concentrated liquid electrolytes, and the observation of functionally analogous behaviour in solid electrolyte space-charge regions suggests that the same underlying physics drives behaviour in both classes of systems. We therefore expect theoretical approaches developed to study non-dilute liquid electrolytes to be equally applicable to future studies of solid electrolytes.
Predicting the equilibrium distribution of charged ions within crystalline solids at, or near, structural discontinuities such as grain boundaries or heterointerfaces is a long-standing problem in solid-state physics [1, 2, 3, 4, 5, 6]. Within these near-interface regions, the concentration of individual ionic species can deviate significantly from their formal bulk values, giving rise to so-called “space-charge” regions. The spatial profiles of space-charge regions is particularly significant in solid electrolytes [7, 8], such as those used in solid-oxide fuel cells and all–solid-state lithium ion batteries [9, 10, 5, 6]. In these cases a local decrease in the concentration of the charge-carrying mobile ionic species within a space-charge region is expected to contribute to interfacial resistance and decreased device performance [7, 11, 12].
The classic treatment of space-charge formation in solid electrolytes considers the distribution of mobile ions in terms of charge-carrying point defects—typically interstitials or vacancies—that behave as an ideal gas interacting only through mean-field electrostatics [7]. For this simple model, the equilibrium defect distribution perpendicular to the grain-boundary interface can be found by solving the one-dimensional Poisson–Boltzmann equation. For low space-charge potentials 111The low–space-charge potential limit is formally given by , where is the “space-charge potential” at the interface, is the charge of the mobile defect species, is the Boltzmann constant, and is the temperature., the approximate linearised Poisson–Boltzmann equation can be used, which has a general analytical solution; the resulting space-charge profiles decay exponentially towards the asymptotic bulk defect concentration with a characteristic decay length equal to the Debye length, ;
| (1) |
where is the vacuum permittivity, is the relative permittivity of the solid, is the Boltzmann constant, is the temperature, are the charged species’ valences, is the elementary charge, and are the bulk charged defect concentrations. For high space-charge potentials the full non-linear Poisson–Boltzmann equation must be solved, either numerically or by making further approximations to obtain an approximate analytical result [14]. Space-charge profiles for high space-charge potentials again decay monotonically, exhibiting superexponential decay close to the grain-boundary, converging to exponential decay with decay length at larger distances.
This ideal-gas plus mean-field–electrostatics model of space-charge behaviour is valid only in the dilute limit of low defect density or high relative permittivity, i.e. weak electrostatic coupling. To address this limitation, a number of more complex one-dimensional models have been proposed that aim to describe space-charge behaviour under non-dilute conditions [15, 16, 14, 17, 10, 18]. These models extend the simple model described above by including additional non-ideal local or non-local defect chemical potential terms. The equilibrium space-charge profile is then computed by minimising the global free energy as a function of the one-dimensional defect concentration. These extended models can give complex non-exponential or even non-monotonic space-charge profiles, although the exact functional form of the resulting profile depends on the choice of non-ideal chemical potential terms and their parameterisation.
As is the case for the classic space-charge model, these non-dilute space-charge models solve a one-dimensional problem defined in terms of the mobile-defect density perpendicular to the interfacial plane. Each point in this one-dimensional density can be considered a planar average from some corresponding implicit three-dimensional defect distribution; the full three-dimensional distribution of mobile defects within the solid-electrolyte host, however, is never explicitly calculated. As a consequence, defect–defect correlations, which become increasingly important with increasing defect concentration or decreasing relative permittivity, are not explicitly computed. Instead, the effect of these correlations is approximated through the choice of non-ideal defect chemical potential terms used in each model.
Here, we follow a different approach to modelling solid-electrolyte space-charge profiles. Instead of solving an effective one-dimensional problem, we consider an explicit three-dimensional Hamiltonian for point charges in a system with a single grain boundary. We then sample the configuration space of this model, using kinetic Monte Carlo, and construct space-charge profiles as time-averages over specific simulation trajectories. Because this approach treats defect–defect interactions explicitly in three-dimensional space, any defect–defect correlations emerge directly from the simulation trajectories, avoiding the need to describe these correlations through analytical free-energy terms.
We find that in non-dilute solid electrolytes (high defect concentrations) or for strong defect–defect interactions (low relative permittivities) grain-boundary–adjacent space-charge profiles have a qualitatively different functional form to the monotonic decay predicted by classic space-charge theory. We observe damped oscillatory space-charge profiles that can be well described by a simple analytical function. We also observe space-charge decay lengths that are significantly larger than the corresponding Debye length, and that increase with increasing defect concentration or defect–defect interaction strength (decreasing relative permittivity), giving the opposite behaviour to that predicted by dilute-limit models. The deviation of space-charge decay length from the Debye length is shown to follow a universal scaling law as a function of electrostatic coupling strength. We note that analogous phenomena have been previously reported for concentrated liquid electrolytes, which suggests that the same underlying physics drives emergent behaviour in solid electrolytes as in their liquid counterparts. Finally, we comment on the implications of these results for a possible unified theoretical framework for understanding non-dilute electrolyte behaviour in both liquids and solids.
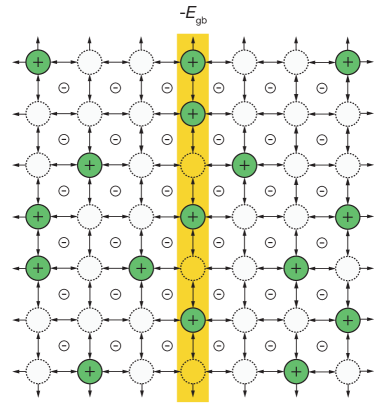
Methods: Our computational model consists of a 3D-periodic simple-cubic lattice of sites, populated by a fixed number, , of mobile point defects with charge (Fig. 1). To ensure our model has net zero charge, we include a uniform array of point charges located at the cube-centre–interstitial positions, with . The mobile defects and their counter-charges interact through point-charge electrostatics, which we scale by a relative permittivity . This Coulomb lattice-gas model has historically been well studied as a bulk system [19], particularly in the context of the classical one-component plasma [20, 21]. To model the segregation of mobile defects to a grain boundary, we assign one plane of sites an on-site occupation energy of ; this term represents the difference in standard chemical potential or “segregation energy” for defects in the grain boundary core relative to the bulk. All sites outside the grain-boundary core have on-site energies of zero.
Our kinetic Monte Carlo simulations were performed using the kmc_fmm code, which implements the accurate and optimally scaling electrostatic solver described in Ref. 23 using the ppmd framework [24]. All simulations were performed using a simple-cubic lattice of sites, with three-dimensional periodic boundary conditions. The nearest-neighbour mobile-site spacing is , which approximates the typical lattice spacing of a solid electrolyte. For all simulations, we set the on-site occupation energy for the grain-boundary plane as . Simulations were run at . Each individual simulation was initialised with a random distribution of mobile charges and run for a total of 1,500,000 steps. The initial 500,000 steps were discarded to allow for equilibration, and space-charge profiles were computed as a time-average over the subsequent 1,000,000 steps. For each combination of relative permittivity, , and bulk concentration, , we performed between 30 and 100 simulations, to obtain statistically converged space-charge profiles. To characterise and quantify the simulated space-charge profiles we performed maximum likelihood sampling, parameter posterior sampling, and Bayesian model selection for competing functional forms using the uravu Python package [25]. The posterior distributions and Bayesian evidence for specific functional models were found by nested sampling [26], implemented in uravu using the dynesty package [27]. Further details are given in the Supporting Information.
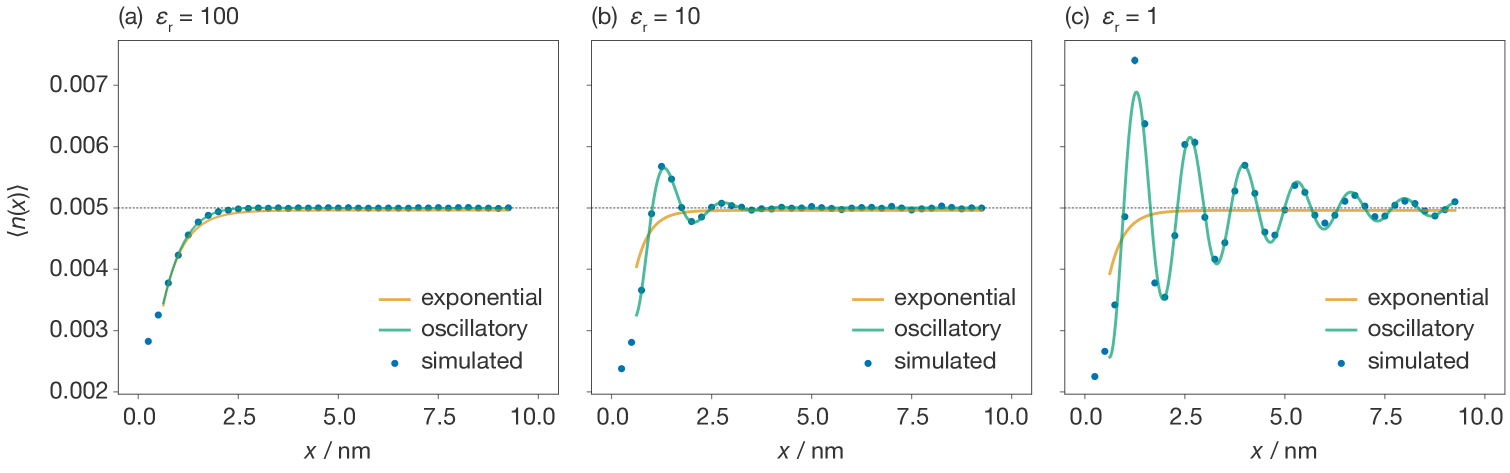
Results: We first consider simulated space-charge profiles obtained for , where is the bulk per-site number density of mobile defects, and (Fig. 2), which spans the range of relative permittivities for typical solid electrolytes [10]. At higher values of the electrostatic interaction between the mobile defects is more effectively screened, and each model will more closely approximate the non-interacting (dilute) ideal lattice-gas limit. Conversely, as is decreased the electrostatic interactions between mobile defects become stronger and non-ideal defect–defect correlations are expected to become more significant.
For the highest permittivity considered here () we obtain a monotonically decaying space-charge profile (Fig. 2(a)) that is qualitatively consistent with the dilute-limit behaviour predicted by the classic Poisson–Boltzmann model. More precisely, the simulated space-charge profile is well described by an exponentially decaying function
| (2) |
where is the planar-average defect number density, is the bulk defect number density, and , with the observed characteristic screening length. At lower permittivities the simulated space-charge profiles are no longer monotonic (Fig. 2(b)), and are therefore not even qualitatively well-described by Eqn. 2. We instead observe oscillatory behaviour that decays into the bulk. Further decreases in cause both the magnitude of these oscillations and the distance over which they decay to increase (Fig. 2(c)).
The appearance of oscillations at higher defect–defect interaction strengths (decreasing ) mirrors the behaviour of non-dilute liquid electrolytes and ionic liquids, which exhibit similar oscillatory charge profiles at electrified interfaces, where this phenomenon is termed “overscreening” [28]. Oscillatory local order has also been observed in previous bulk Coulomb lattice-gas and one-component plasma simulations [20, 21, 29]. By analogy to the analytically-known behaviour of liquid systems [30, 31], we propose a damped oscillatory ansatz for the space-charge profiles in this low-permittivity regime:
| (3) |
As shown in Figs. 2(b) and 2(c), this oscillatory functional form gives a significantly better description of these space-charge profiles at low permittivities than the dilute-limit monotonic (purely exponential) model 222The possibility of solid electrolytes exhibiting oscillatory charge-profiles was previously highlighted by Gray-Weale [55], although this earlier analysis did not resolve the decay behaviour of these oscillations..
The simulated space-charge profiles presented in Fig. 2 also show increasing space-charge widths—i.e. increased screening lengths—with decreasing relative permittivities. This is the opposite behaviour to that predicted by the classic space-charge treatment, wherein the Debye length decreases with decreasing (Eqn. 1). The observation of a screening length that is larger than the classical Debye length again mirrors the behaviour of concentrated liquid electrolytes, where this phenomenon is termed “underscreening” [30, 31, 33].
In ionic liquids and concentrated liquid electrolytes, underscreening has been found to follow scaling laws of the form
| (4) |
where is the observed screening length of the system, is the diameter of the charged species, and is a fixed scaling factor [34, 35, 36, 37]. For our Coulomb lattice-gas model there is no direct analogue for . We instead analyse our simulation data by plotting versus , where is a dimensionless parameter that describes the strength of electrostatic coupling in a given system. , where is the Bjerrum length, and is a Wigner–Seitz defect-sphere radius [38, 20, 21]. Further discussion of the choice of an appropriate scaling parameter is provided in the SI.
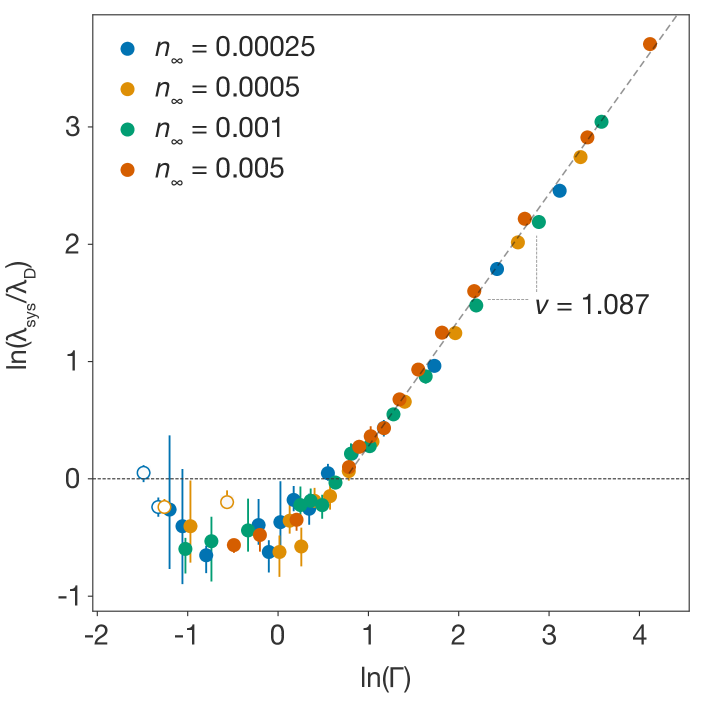
Fig. 3 shows versus plotted for simulations at four bulk concentrations: , , , and . For each simulation, we use Bayesian model selection to select which model—purely exponential or damped oscillatory—is best supported by the simulated space-charge–profile data, and assign . For , we find analogous scaling behaviour to that reported for liquid systems [30, 37, 39, 36], i.e. , with (95% CI). For a given bulk concentration of mobile defects, higher values of correspond to stronger defect–defect interactions, i.e. decreased . In this regime, as defect–defect interactions increase in magnitude the observed screening length increasingly positively deviates from the Debye length. For we observe a region where the observed screening length is smaller than the Debye length. Again, this behaviour has been reported for liquid systems in studies that focus on the application of different closure relationships to the Ornstein–Zernike equation [40, 39, 34, 41, 36, 42, 43, 44, 45, 46]. At the lowest values of (, obtained for and ) we recover the low-potential dilute-limit result that the simulated screening length is equal to the Debye length; . We note that the same scaling behaviour is observed for all four simulated concentrations, suggesting a universal scaling law operates in solid electrolytes that contain a single mobile defect species.
Summary and Discussion: We have performed kinetic Monte Carlo simulations of populations of mobile point defects on a three-dimensional lattice, interacting via point-charge electrostatics, as a simple model for space-charge formation at solid-electrolyte grain-boundaries, for a range of bulk defect concentrations and relative permittivities. For dilute, weakly coupled systems (low particle concentration and high ) we recover the behaviour predicted by classic treatments of space-charge behaviour, i.e. the linearised Poisson–Boltzmann model—the space-charge profile decays exponentially to the asymptotic bulk value with a decay length equal to the Debye length . In non-dilute, strongly coupled systems (high particle concentration or low ) we observe damped oscillatory space-charge profiles—overscreening—and space-charge decay lengths that are larger than the corresponding Debye length—underscreening.
Overscreening and underscreening are known phenomena for non-dilute liquid systems of charged particles (concentrated liquid electrolytes and ionic liquids) [28, 47, 48, 49, 35, 31, 30, 50, 51, 52, 53, 54]. Our simulations predict not only that overscreening and underscreening also occur in non-dilute solid electrolytes, but that these phenomena have the same functional behaviour in solids as in analogous liquid systems. Space-charge profiles in systems that exhibit overscreening are well described by a damped oscillatory function and the degree of underscreening, given by the ratio of the observed space-charge decay length to the classic Debye length, follows an apparently universal scaling law above some critical effective defect–defect interaction strength. We also predict an intermediate regime, where the simulated space-charge decay length is smaller than the classic Debye length. Again, this mirrors previous results obtained for the decay of radial distribution functions in non-dilute liquid systems [39, 36, 34, 46]. Our results also suggest an approximate empirical threshold for when the dilute-limit classic space-charge treatment may be reliably used to quantitatively model space-charge behaviour in solid electrolytes of .
The strong correspondence between our results for space-charge formation at a grain boundary in a model solid electrolyte and those previously reported for liquid electrolytes at an electrified interface suggests that the same underlying physics is responsible for these analogous emergent phenomena in both liquid and solid electrolytes.
This suggests that many of the theoretical methods that have been developed previously by researchers seeking to better understand the behaviour of liquid electrolytes, or analogous models such as the one-component plasma [20, 21], may be equally applicable to developing an improved understanding of the emergent behaviour of ensembles of mobile charged defects in solid electrolytes.
Acknowledgements
J. M. D. acknowledges support from the EPSRC (grant number 2119790). J. M. D. and B. J. M. acknowledge the support of the Faraday Institution through the Multi-Scale Modelling project (grant no. FIRG003).
S. W. C. and B. J. M. acknowledge the support of the Faraday Institution through the CATMAT project (grant number FIRG016).
B. J. M. acknowledges support from the Royal Society (UF130329 & URF\R\191006).
W. R. S., M. J. W., and A. B. W. acknowledge funding from the European Union’s Horizon 2020 programme, via the Energy Oriented Centre of Excellence (EoCoE-II), under grant agreement number 676629. The authors thank Dr. Ian R. Thompson for useful discussions.
We are grateful to the UK Materials and Molecular Modelling Hub for computational resources, which is partially funded by EPSRC (EP/P020194/1). This research made use of the Balena High Performance Computing (HPC) Service at the University of Bath.
Supporting Information
Discussion of Fig. 2 when replotted on a semi-logarithmic scale; discussion of the choice of non-dimensional coupling parameter used in Fig. 3; further details of the Bayesian analysis of the simulated space-charge profiles and subsequent parameter estimation.
Data availability: A dataset containing the full set of time-averaged simulation data that support the findings presented here, and the analysis code used to generate Fig. 2 and Fig. 3 is available as Ref. 22 under the CC BY 4.0 and MIT licences.
References
- Frenkel [1946] J. Frenkel, Kinetic Theory of Liquids (Oxford University Press, New York, 1946).
- Eshelby et al. [1958] J. D. Eshelby, C. W. A. Newey, P. L. Pratt, and A. B. Lidiard, Charged dislocations and the strength of ionic crystals, Phil. Mag. 3, 75 (1958).
- Kliewer and Koehler [1965] K. L. Kliewer and J. S. Koehler, Space charge in ionic crystals. I. general approach with application to NaCl, Phys. Rev. 140, A1226 (1965).
- Poeppel and Blakely [1969] R. B. Poeppel and J. M. Blakely, Origin of equilibrium space charge potentials in ionic crystals, Surf. Sci. 15, 507 (1969).
- Cheng et al. [2020] Z. Cheng, M. Liu, S. Ganapathy, C. Li, Z. Li, X. Zhang, P. He, H. Zhou, and M. Wagemaker, Revealing the impact of space-charge layers on the Li-ion transport in all-solid-state batteries, Joule 4, 1311 (2020).
- Swift et al. [2021] M. W. Swift, J. W. Swift, and Y. Qi, Modeling the electrical double layer at solid-state electrochemical interfaces, Nature Comput. Sci. 1, 212 (2021).
- Maier [1995] J. Maier, Ionic conduction in space charge regions, Prog. Sol. Stat. Chem. 23, 171 (1995).
- Xu et al. [2020] X. Xu, Y. Liu, J. Wang, D. Isheim, V. P. Dravid, C. Phatak, and S. M. Haile, Variability and origins of grain boundary electric potential detected by electron holography and atom-probe tomography, Nature Mater. 19, 887 (2020).
- Adepalli et al. [2017] K. K. Adepalli, J. Yang, J. Maier, H. L. Tuller, and B. Yildiz, Tunable oxygen diffusion and electronic conduction in SrTiO3 by dislocation-induced space charge fields, Adv. Func. Mater. 27, 1700243 (2017).
- de Klerk and Wagemaker [2018] N. J. J. de Klerk and M. Wagemaker, Space-charge layers in all-solid-state batteries; important or negligible?, ACS Appl. Energy Mater. 1, 5609 (2018).
- Helgee et al. [2012] E. E. Helgee, A. Lindman, and G. Wahnström, Origin of space charge in grain boundaries of proton-conducting BaZrO3, Fuel Cells 13, 19 (2012).
- Uthayakumar et al. [2020] A. Uthayakumar, A. Pandiyan, S. Mathiyalagan, A. K. Keshri, and S. B. K. Moorthy, The effect of space charge on blocking grain boundary resistance in an yttrium-doped barium zirconate electrolyte for solid oxide fuel cells, J. Phys. Chem. C 124, 5591 (2020).
- Note [1] The low–space-charge potential limit is formally given by , where is the “space-charge potential” at the interface, is the charge of the mobile defect species, is the Boltzmann constant, and is the temperature.
- Tong et al. [2020] X. Tong, D. S. Mebane, and R. A. De Souza, Analyzing the grain-boundary resistance of oxide-ion conducting electrolytes: Poisson–Cahn vs Poisson–Boltzmann theories, J. Amer. Ceram. Soc. 103, 5 (2020).
- Mebane [2015] D. S. Mebane, A variational approach to surface cation segregation in mixed conducting perovskites, Comp. Mater. Sci. 103, 231 (2015).
- Patsahan et al. [2019] T. Patsahan, G. Bokun, D. di Caprio, M. Holovko, and V. Vikhrenko, The effect of short-range interaction and correlations on the charge and electric field distribution in a model solid electrolyte, Sol. Stat. Ionics 335, 156 (2019).
- Mebane and De Souza [2015] D. S. Mebane and R. A. De Souza, A generalised space-charge theory for extended defects in oxygen-ion conducting electrolytes: from dilute to concentrated solid solutions, Energy Environ. Sci. 8, 2935 (2015).
- Bondevik et al. [2020] T. Bondevik, J. M. Polfus, and T. Norby, Disagreements between space charge models and grain boundary impedance data in yttrium-substituted barium zirconate, Sol. Stat. Ionics 353, 115369 (2020).
- Walker and Gillan [1983] A. B. Walker and M. J. Gillan, Thermodynamics of the Coulomb lattice gas, J. Phys. C: Sol. Stat. Phys. 16, 3025 (1983).
- Brush et al. [1966] S. G. Brush, H. L. Sahlin, and E. Teller, Monte Carlo study of a one-component plasma. I, J. Chem. Phys. 45, 2102 (1966).
- Baus and Hansen [1980] M. Baus and J.-P. Hansen, Statistical mechanics of simple Coulomb systems, Phys. Rep. 59, 1 (1980).
- J. M. Dean, S. W. Coles, W. R. Saunders, A. R. McCluskey, M. J. Wolf, A. B. Walker, and B. J. Morgan [2021] J. M. Dean, S. W. Coles, W. R. Saunders, A. R. McCluskey, M. J. Wolf, A. B. Walker, and B. J. Morgan, Supporting dataset for “Overscreening and underscreening in solid-electrolyte grain boundary space-charge layers” (2021), https://github.com/j-m-dean/data_overscreening_and_underscreening (accessed 2021-03-31) doi:10.5281/zenodo.4647844.
- Saunders et al. [2020] W. R. Saunders, J. Grant, E. H. Müller, and I. Thompson, Fast electrostatic solvers for kinetic Monte Carlo simulations, J. Comp. Phys. 410, 109379 (2020).
- Saunders et al. [2018] W. R. Saunders, J. Grant, and E. H. Müller, A domain specific language for performance portable molecular dynamics algorithms, Comp. Phys. Commun. 224, 119 (2018).
- McCluskey and Snow [2020] A. R. McCluskey and T. Snow, uravu: Making Bayesian modelling easy(er), J. Open Sour. Soft. 5, 2214 (2020).
- Skilling [2004] J. Skilling, Nested sampling, in AIP Conf. Proc. (AIP, 2004).
- Speagle [2020] J. S. Speagle, dynesty: a dynamic nested sampling package for estimating Bayesian posteriors and evidences, Month. Not. Roy. Astronom. Soc. 493, 3132 (2020).
- Bazant et al. [2011] M. Z. Bazant, B. D. Storey, and A. A. Kornyshev, Double layer in ionic liquids: Overscreening versus crowding, Phys. Rev. Lett. 106, 046102 (2011).
- Petersen and Dieterich [1992] J. Petersen and W. Dieterich, Effects of Coulomb interaction and disorder in a stochastic lattice gas, Phil. Mag. B 65, 231 (1992).
- Lee et al. [2017a] A. A. Lee, C. S. Perez-Martinez, A. M. Smith, and S. Perkin, Scaling analysis of the screening length in concentrated electrolytes, Phys. Rev. Lett. 119, 026002 (2017a).
- Lee et al. [2017b] A. A. Lee, C. S. Perez-Martinez, A. M. Smith, and S. Perkin, Underscreening in concentrated electrolytes, Faraday Discuss. 199, 239 (2017b).
- Note [2] The possibility of solid electrolytes exhibiting oscillatory charge-profiles was previously highlighted by Gray-Weale [55], although this earlier analysis did not resolve the decay behaviour of these oscillations.
- Limmer [2015] D. T. Limmer, Interfacial ordering and accompanying divergent capacitance at ionic liquid–metal interfaces, Phys. Rev. Lett. 115, 256102 (2015).
- Attard [1993] P. Attard, Asymptotic analysis of primitive model electrolytes and the electrical double layer, Phys. Rev. E 48, 3604 (1993).
- Smith et al. [2016] A. M. Smith, A. A. Lee, and S. Perkin, The electrostatic screening length in concentrated electrolytes increases with concentration, J. Phys. Chem. Lett. 7, 2157 (2016).
- Adar et al. [2019] R. M. Adar, S. A. Safran, H. Diamant, and D. Andelman, Screening length for finite-size ions in concentrated electrolytes, Phys. Rev. E 100, 042615 (2019).
- Coles et al. [2020] S. W. Coles, C. Park, R. Nikam, M. Kanduč, J. Dzubiella, and B. Rotenberg, Correlation length in concentrated electrolytes: Insights from all-atom molecular dynamics simulations, J. Phys. Chem. B 124, 1778 (2020).
- Carley [1963] D. D. Carley, Computations of radial distribution functions for a classical electron gas, Phys. Rev. 131, 1406 (1963).
- Rotenberg et al. [2018] B. Rotenberg, O. Bernard, and J.-P. Hansen, Underscreening in ionic liquids: a first principles analysis, J. Phys.: Condens. Matter 30, 054005 (2018).
- Ornstein and Zernike [1914] L. Ornstein and F. Zernike, Accidental deviations of density and opalescence at the critical point of a single substance, Proc. Akad. Sci. (Amsterdam) 17, 793 (1914).
- Coupette et al. [2018] F. Coupette, A. A. Lee, and A. Härtel, Screening lengths in ionic fluids, Phys. Rev. Lett. 121, 075501 (2018).
- Kirkwood [1936] J. G. Kirkwood, Statistical mechanics of liquid solutions., Chem. Rev. 19, 275 (1936).
- Ennis et al. [1995] J. Ennis, R. Kjellander, and D. J. Mitchell, Dressed ion theory for bulk symmetric electrolytes in the restricted primitive model, J. Chem. Phys. 102, 975 (1995).
- Kjellander [2019] R. Kjellander, The intimate relationship between the dielectric response and the decay of intermolecular correlations and surface forces in electrolytes, Soft Matt. 15, 5866 (2019).
- Kjellander [2018] R. Kjellander, Focus Article: Oscillatory and long-range monotonic exponential decays of electrostatic interactions in ionic liquids and other electrolytes: The significance of dielectric permittivity and renormalized charges, J. Chem. Phys. 148, 193701 (2018).
- Cats et al. [2020] P. Cats, R. Evans, A. Härtel, and R. van Roij, Primitive model electrolytes in the near and far field: Decay lengths from DFT and simulations (2020), arXiv:2012.02713 [cond-mat.soft] .
- Fedorov and Kornyshev [2014] M. V. Fedorov and A. A. Kornyshev, Ionic liquids at electrified interfaces, Chem. Rev. 114, 2978 (2014).
- Kornyshev [2007] A. A. Kornyshev, Double-layer in ionic liquids: Paradigm change?, J. Phys. Chem. B 111, 5545 (2007).
- Perkin et al. [2010] S. Perkin, T. Albrecht, and J. Klein, Layering and shear properties of an ionic liquid, 1-ethyl-3-methylimidazolium ethylsulfate, confined to nano-films between mica surfaces, Phys. Chem. Chem. Phys. 12, 1243 (2010).
- Gebbie et al. [2013] M. A. Gebbie, M. Valtiner, X. Banquy, E. T. Fox, W. A. Henderson, and J. N. Israelachvili, Ionic liquids behave as dilute electrolyte solutions, Proc. Nat. Acad. Sci. 110, 9674 (2013).
- Gebbie et al. [2015] M. A. Gebbie, H. A. Dobbs, M. Valtiner, and J. N. Israelachvili, Long-range electrostatic screening in ionic liquids, Proc. Nat. Acad. Sci. 112, 7432 (2015).
- Evans and Sluckin [1980] R. Evans and T. Sluckin, A density functional theory for inhomogeneous charged fluids, Mol. Phys. 40, 413 (1980).
- de Carvalho and Evans [1994] R. L. de Carvalho and R. Evans, The decay of correlations in ionic fluids, Mol. Phys. 83, 619 (1994).
- Evans et al. [1993] R. Evans, J. Henderson, D. Hoyle, A. Parry, and Z. Sabeur, Asymptotic decay of liquid structure: oscillatory liquid-vapour density profiles and the Fisher–Widom line, Mol. Phys. 80, 755 (1993).
- Gray-Weale [2007] A. Gray-Weale, Screening and strain in superionic conductors, Faraday Discuss. 134, 297 (2007).