Evolution of the spin of late-type galaxies caused by galaxy-galaxy interactions
Abstract
We use N-body/hydrodynamic simulations to study the evolution
of the spin of a Milky Way-like galaxy through interactions.
We perform a controlled experiment of co-planner
galaxy-galaxy encounters and study the evolution of disk spins
of interacting galaxies.
Specifically, we consider the cases
where the late-type target galaxy
encounters an equally massive companion
galaxy, which has either a late or an early-type morphology,
with the closest approach distance of about 50 kpc,
in prograde or retrograde sense.
By examining the time change of the circular velocity of
the disk material of the target galaxy from each case,
we find that the target galaxy tends to lose the spin through
prograde collisions but hardly through retrograde collisions,
regardless of the companion galaxy type.
The decrease of the spin results mainly from the deflection
of the orbit of the disk material by tidal disruption.
Although there is some disk material which gains the circular velocity
through hydrodynamic as well as gravitational interactions
or by transferring material from the companion galaxy,
it turns out that the amount of the material is generally
insufficient to increase the overall galactic spin
under the conditions we set.
It is found that the spin angular momentum of the target galaxy disk
decreases by 15 - 20% after a prograde collision.
We conclude that the accumulated effects of galaxy-galaxy interactions
will play an important role in determining the total angular momentum
of late-type galaxies at current stage.
Subject headings:
galaxies: spiral — galaxies: kinematics and dynamics — galaxies: evolution — galaxies: interactions — methods: numerical1. INTRODUCTION
The spin of galaxies is an important quantity to understand the evolution of galaxies over cosmic time. Starting from the tidal torque theory (Hoyle, 1949; Peebles, 1969; White, 1984), it has been proposed that galaxies acquire angular momentum via the tidal field from surrounding galaxies. In the Lambda Cold Dark Matter () paradigm, galaxies are first formed in dark matter (DM) halo and evolved through continuous merging and interacting with nearby galaxies while gaining or losing mass and angular momentum. In particular, it is vital to understand how the angular momentum of late-type galaxies (LTGs) are being evolved over cosmic time, because the LTGs are considered as building blocks under the hierarchical merging scenario. For example, the existence of a relatively new population of rotation-supported early-type galaxies (ETGs) can not be fully explained without understanding the role of LTG spin evolution (Emsellem et al., 2011; Cappellari, 2016; Graham et al., 2018).
Previous studies have shown that the spin of galaxies is also correlated with environments such as distance to the neighbour, axes of large-scale structure, 2D correlation, and clustering (Porciani et al., 2002; Davis & Natarajan, 2009; Tempel et al., 2013; Casuso & Beckman, 2015; Codis et al., 2015; Lee et al., 2018b). More recent studies have demonstrated how the angular momentum acquired through merging can affect the galaxy evolution (Brook et al., 2012; Cloet-Osselaer et al., 2014; Rodriguez-Gomez et al., 2017).
There has also been some effort to measure any correlations between the spins in pairs of spiral galaxies. For example, Cervantes-Sodi et al. (2010) have estimated the spin parameter for 3624 LTGs (target galaxies) at low redshift, identified using the Sloan Digital Sky Survey (SDSS). They have discovered a statistically significant correlation between the spin magnitudes of neighbouring galaxies. Specifically, they have found that the values of the spin parameter of the late-type target galaxies decrease as a companion galaxy (the nearest neighbour of a comparable size) approaches, regardless of the companion morphology, although the decrease of the spin parameter appeared more clearly when the companion is a late-type rather than an early-type (refer to their Figures 3 and 4). Particularly noteworthy is that the decrease of the spin parameter begins to operate as soon as the (projected) separation between the pair becomes smaller than the virial radius of the companion, implying interactions could have caused the decrease.
More recently, using the data of Mapping Nearby Galaxies at APO (MaNGA), Lee et al. (2018a) have estimated the spin parameter for 1830 low-redshift galaxies from the analysis of two-dimensional stellar spectra. They divided the galaxies into four groups by the morphological type of the target as well as the companion (the nearest influential neighbour). As shown in their Figure 7, in the case of late-type targets having an early-type companion (“L-e”), the spin parameter of the target galaxies has been found to be decreased clearly when the pair separation becomes less than the virial radius of the companion. (In the case of late-type targets having a late-type companion, “L-l”, such decrease has not been found clearly in the spin of the targets. However, it should be noted that the number of close pairs in this case is smaller than that in L-e case.)
The aforementioned observational studies that have shown some interesting correlations between the spins in pair of galaxies (Cervantes-Sodi et al. 2010; Lee et al. 2018a) motivated us to explore the evolution of the spin of galaxies by using numerical simulations. With the aim of finding physical mechanism for changing the angular momentum of galaxies, we have been performing a series of -body/hydrodynamic simulations of interactions between galaxies in a variety of environments. (We generally refer to “angular momentum” as “spin angular momentum”, if not specified.)
In this paper, we present the results of our first set of simulations concerning the evolution of the spin of a Milky Way-like LTG (target galaxy) that experiences an interaction with a neighbour (companion galaxy). Specifically, we have conducted simulations of co-planner galaxy-galaxy interactions, where the target galaxy encounters an equally massive companion galaxy, which has either a late- or an early-type morphology, in prograde or retrograde sense. We also have performed a simulations of the target galaxy evolving in isolation for comparison. The simple configuration for this work is intended to focus on examining the effects that the different companion morphology (late-type vs. early-type) and the encounter geometry (prograde vs. retrograde) might have on the spin evolution of the target galaxy, in comparison with that of the isolated target galaxy. As motivated by observations, this work aims at examining what happened on the spin of the target galaxy. We expect the results of this first set of simulations to serve as a basis for our more extended follow-up studies and also for other related works.
The outline of this paper is as follows. We begin in Section 2 with an overview of the galaxy models and the simulation code used for this work. We then describe the initial conditions of our simulations. In Section 3, we present the results of our simulations focusing on the structural and the kinematic evolution of the target galaxy from each of our runs. Finally in Section 4, we summarise and discuss our findings. We also highlight the limitations and the implications of our results.
2. Model Description
2.1. Galaxy Models
For this numerical study, we use two galaxy models - a LTG model “L” and an ETG model “EH”. Model L is the same model used in our previous work (Hwang et al. 2018; hereafter Paper I). Model EH is similar to model EH in paper I but has half the mass of the previous model. Thus models L and EH in this work have the same mass. Both models L and EH are generated by using the ZENO111http://www.ifa.hawaii.edu/barnes/software.html software package (Barnes 2011; see also Hwang et al. 2013 for the generation procedure). As the detailed description of the models is presented in Paper I (see also Hwang et al. 2013), here we briefly outline their key properties.
| Model | ||||||||||||||
|---|---|---|---|---|---|---|---|---|---|---|---|---|---|---|
| L | 127.0 | 214.0 | 5.2 | 0.8 | 1 | 120.0 | … | 0.13 | … | 122 880 | 32 768 | 24 567 | 655 360 | … |
| EH | 127.0 | 250.0 | … | … | 7.0 | 118.8 | 1.2 | … | 0.01 | … | … | 172 032 | 655 360 | 49 152 |
-
Masses are in units of and the virial radius is in units of kpc.
-
a
is the sum of the masses of all particles.
-
b
We use the virial radius as , which is defined as the radius within which the average density is 200 times the critical density.
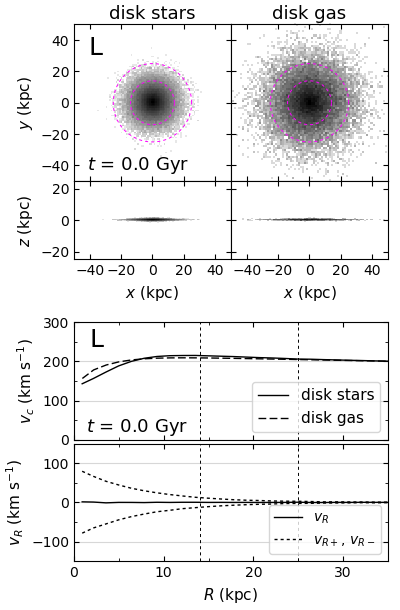
Model L resembles the Milky Way Galaxy in size and mass, with the total mass of = and the virial radius of = 214 kpc (Table 1). The model consists of four components - a stellar disk, a gas disk, a stellar bulge, and a DM halo. The star and gas disks have the masses of = and = , respectively (McMillan 2011; Kubryk et al. 2015). The disk gas fraction in mass, = /, is thus about 0.13. Both disks follow an exponential surface density profile and a sech2 vertical profile (Equation (1) in paper I). The radial scale lengths of the stellar and gaseous disks are = 3.5 kpc and = 8.75 kpc, respectively, and the vertical scale length of both disks is = = 0.35 kpc (refer to Hwang et al. 2013 for the justifications of the parameter values). The number of particles distributed on the star and gas disks are = 122 880 and = 32 768, respectively. Both disks are initialized with an either clockwise or counterclockwise directional spin, as necessary. The disk gas particles are set to rotate with the local circular velocities. On the other hand, the disk star particles are given to have the radial and vertical dispersions in addition to the local circular velocities as described in Barnes & Hibbard (2009). In Figure 1, we show the initial distribution of the disk star and gas particles of model L and the circular and radial velocity ( and , respectively) profiles of the disk star and gas particles. (Hereafter, we refer to the azimuthal and the radial velocities in the cylindrical coordinate system as the circular and the radial velocities ( and ), respectively. The positive directions of and are set to the direction of the initial disk rotation and the radially outward direction, respectively.) The temperature of the disk gas particles are set uniformly to T = 10 000 K. The bulge component has the total mass of = . It follows the Hernquist profile (Hernquist 1990) with truncation at large radii as presented in Paper I (Equation (2)). The number of particles of the bulge component is = 24 567. The DM halo component follows a Navarro et al. (1996) model with an exponential taper at large radii (Equation (3) in Paper I). The total mass of the DM halo is = and the number of particles is = 655 360. The DM halo and the bulge components are dispersion-supported with no appreciable rotation (Barnes & Hibbard 2009; von Neumann 1951).
The ETG model EH has the total mass of = (which is equal to that of model L, as intended) and the virial radius of = 250 kpc. The model possesses three components, a stellar bulge, a DM halo, and a gaseous halo, with the masses of = , = , and = (Anderson & Bregman 2010), respectively. The gas fraction in the halo is = / = 0.01. The bulge and the DM halo components follow the Hernquist model (Hernquist 1990) and a Navarro et al. (1996) model, respectively, and are dispersion-supported as in model L. The gas halo follows a nonsingular isothermal profile with a taper (Equation (3) in paper I). The temperature of the halo gas particles are determined by the hydrostatic equilibrium (refer to Figure 2 of Paper I). The initial velocity of the halo gas is set to zero. The number of particles distributed in each component is = 172 032, = 655 360, and = 49 152, respectively.
2.2. Simulation Code
To perform the numerical simulations, we make use of an early version of GADGET-3 -body/smoothed particle hydrodynamics (SPH) code (originally described in Springel 2005). Here we briefly describe the simulation code and refer interested readers to Springel & Hernquist (2003) and our previous papers for more details (paper I; Hwang & Park 2015).
The code computes the gravitational force using a tree algorithm (Barnes & Hut 1986) and the hydrodynamic force adopting a SPH method in the entropy conservative formulation (Springel & Hernquist 2002; Gingold & Monaghan 1977). The radiative cooling and heating are modeled considering the primordial mixture of hydrogen and helium by photoionization (Katz et al. 1996). Star formation and the associated supernova feedback in the interstellar medium (ISM) are implemented adopting the sub-resolution multiphase model of Springel & Hernquist (2003). A thermal instability operates for gas exceeding a threshold density and the ISM is treated as a statistical mixture of cold clouds and ambient hot medium. Stars form in dense regions consuming the cold clouds, and the consumption timescale is chosen to match the observations (Kennicutt 1998). Among the newly formed stars, massive stars (with the mass greater than 8 ) die instantly as supernovae and release energy as heat to the ambient diffuse gas. Some cold clouds are also evaporated inside the supernova bubbles returning material to the ambient medium.
We set the code parameters governing star formation and feedback to the standard values of the multiphase model (Springel & Hernquist 2003). Some of the key values are as follows. The star formation time-scale and the mass fraction of massive stars among the newly formed stars are = 2.14 Gyr and , respectively. The “supernova temperature” is and the temperature of cold clouds are K. The parameter value for supernova evaporation is .
The gravitational softening lengths for the particles of the star and gas disks, bulge, and DM and gas halos are set to 0.14, 0.11, 0.14, 0.30, and 0.11 kpc, respectively. These gravitational softening lengths are determined by considering the equivalence of the maximum acceleration experienced by a single particle in each component.
| Run | Target (spina ) | Companion (spin) | Interactionb |
|---|---|---|---|
| L | L (CW) | … | … |
| LLp | L (CW) | L (CW) | prograde |
| LLr | L (CCW) | L (CW) | retrograde |
| LEHp | L (CW) | EH | prograde |
| LEHr | L (CCW) | EH | retrograde |
-
a
The direction of the spin of the disk of a LTG, when viewed from the positive -axis. “CW” and “CCW” stand for clockwise and counterclockwise, respectively.
-
b
Whether a target galaxy experiences a collision with a companion galaxy as prograde or retrograde (see text for the details).
2.3. Initial conditions for our simulations
In order to study the spin evolution of a Milky Way-like LTG in different situations, we perform five numerical simulations (Table 2)222Additionally, we have performed “run LLr2”. In this run, the late-type target galaxy encounters the late-type companion galaxy in retrograde sense, while both galaxies spin in counterclockwise direction. We present the results of this run in Appendix A.: Run L is the simplest one where the LTG model L (target galaxy) evolves in isolation. In runs LLp and LLr, model L (target) encounters another model L (companion) in prograde and retrograde sense, respectively. Similarly, in runs LEHp and LEHr, model L (target) encounters the ETG model EH (companion) in prograde and retrograde sense, respectively. We construct the initial conditions of our simulations as below.
First, for the isolated case of run L, model L is initialized in the - plane (i.e., the midplane of the disk lies on the - plane), being placed the center of the model at the origin as shown in Figure 1 (top two rows). (We generally refer to “disk” as the total disk consisting of both stars and gas, if not specified such as “star disk” or “gas disk”.) The disk of model L in this run is set with a clockwise directional spin as viewed from the positive -axis, and with zero (systemic) velocity.
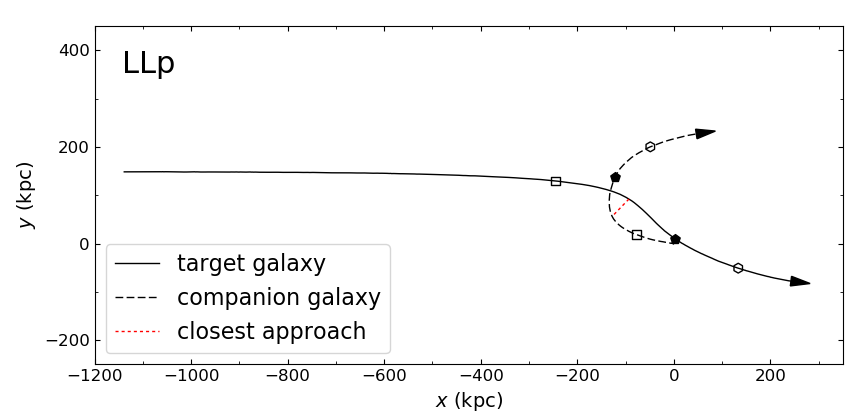
Next, for runs LLp and LLr, the two LTG-LTG encounter simulations, model L as the target galaxy is initially placed at ()=(1140 kpc, 150 kpc, 0) and another model L as the companion galaxy is positioned at the origin as presented in Figure 2. The initial velocity () of the target and the companion galaxies are set to and , respectively. These initial positions and velocities of the models are chosen so that the two galaxies encounter most closely at = 4.5 Gyr since the start of each run with the distance of about 50 kpc. The closest approach distance of 50 kpc is chosen to see some encounters that are not too weak or not too strong. For galaxies at low redshift and not in high-density regions like galaxy clusters, which are relevant to this study, distant encounters occur more frequently than very close encounters do. Although distant encounters are frequent, the effects of a single distant encounter on the evolution of a target galaxy would be weak. On the other hand, the effects of a single very close encounter would be significant, but such an encounter is rare. (Once it happens, the galaxies involved would merge quickly.) Thus, considering both frequency and effects of galaxy-galaxy interactions, choosing encounters at an “intermediate” strength would be reasonable for our work. In the initial conditions of runs LLp and LLr, the midplanes of the disks of both target and companion galaxies are located on the plane. The only difference between the two initial conditions is the direction of the spin of the target galaxy: For run LLp, the disk of the target galaxy is set with a clockwise directional spin; whereas, for run LLr, it is set with a counterclockwise directional spin. In both runs, the disk of the companion galaxy is set with a clockwise directional spin.
Finally, for runs LEHp and LEHr, the two LTG-ETG encounter runs, the initial positions and velocities of the target and the companion galaxies are set with the same values as in runs LLp and LLr. The direction of the spin of the target galaxy in run LEHp(LEHr) is also set to clockwise(counterclockwise), as in run LLp(LLr). The only difference between the initial conditions of run LEHp(LEHr) and run LLp(LLr) is the morphological type of the companion galaxy, which is an early-type in runs LEHp and LEHr but a late-type in runs LLp and LLr.
3. Simulation results
With the initial conditions described in Section 2.3, we have performed five numerical simulations for 7 Gyr since the start of each run (Table 2). Here we present the results of our simulations. In the first subsection, we describe the general evolution of each run, focusing on the change in structure and star formation activity in the target galaxy. Then we examine the kinematics and the spin angular momentum of the target galaxy in the following subsections.
3.1. General Evolution
3.1.1 Run L
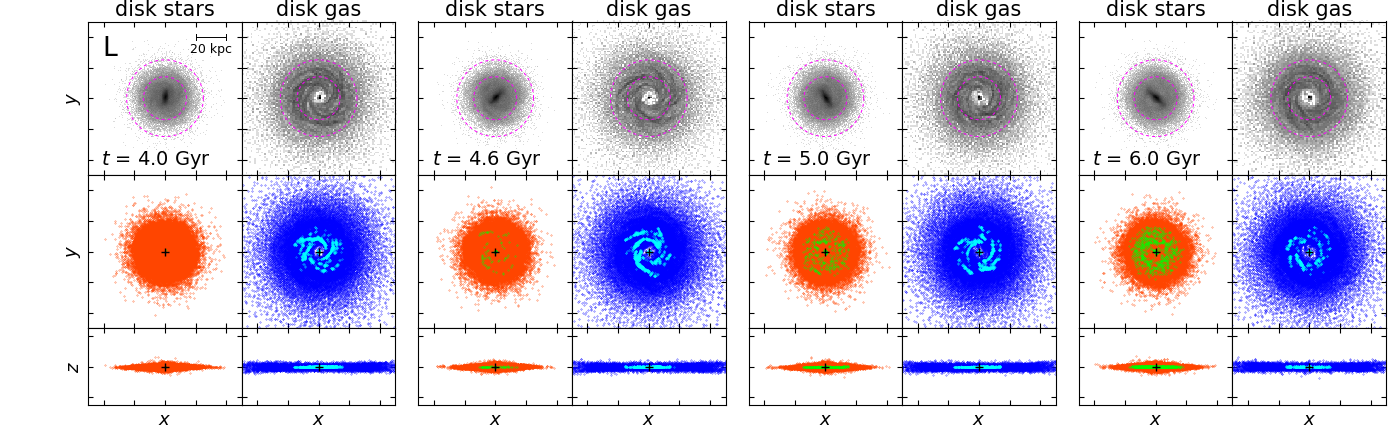
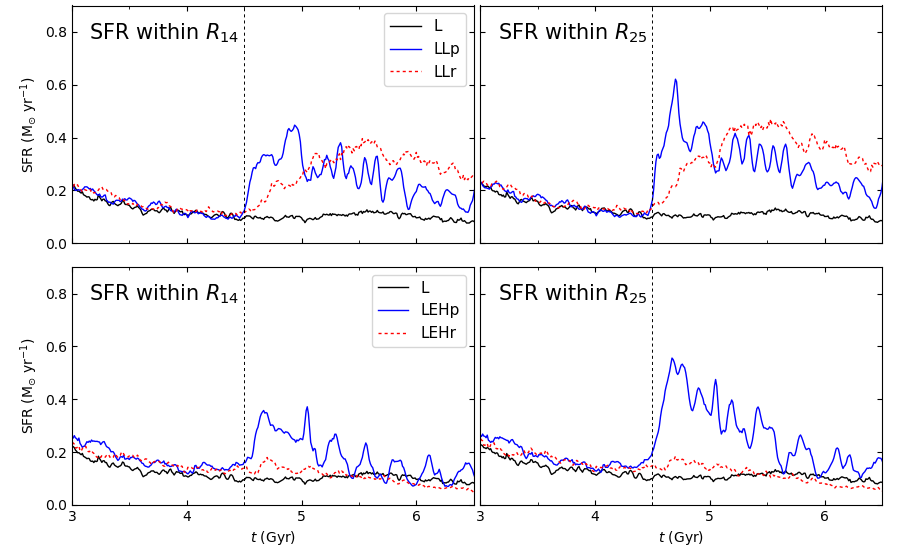
Figure 3 presents the distribution of the disk particles of the target galaxy from run L at four epochs. The target galaxy in this run evolves in isolation. As seen in the top row, a central bar and multiple spiral patterns develop in the star and gas disks as time passes. In the bottom two rows, star-forming gas particles are distinguished from non-star-forming gas particles by cyan and blue points, respectively. Most of star-forming gas appears in the relatively inner region of the disk, within the galactocentric (cylindrical) radius of = 14 kpc (), marked with a magenta dotted circle (the inner one). is the radius within which 90 % of the disk stars were initially distributed in the model; it is also four times the initial radial scale length of the stellar disk. We will use as a reference radius throughout this paper, for the purpose of indicating the region where most initial disk stars were located. We will also use another reference radius = 25 kpc (; the outer dotted circle in the figure); it is half of the closest approach distance in the galaxy-galaxy encounter runs.
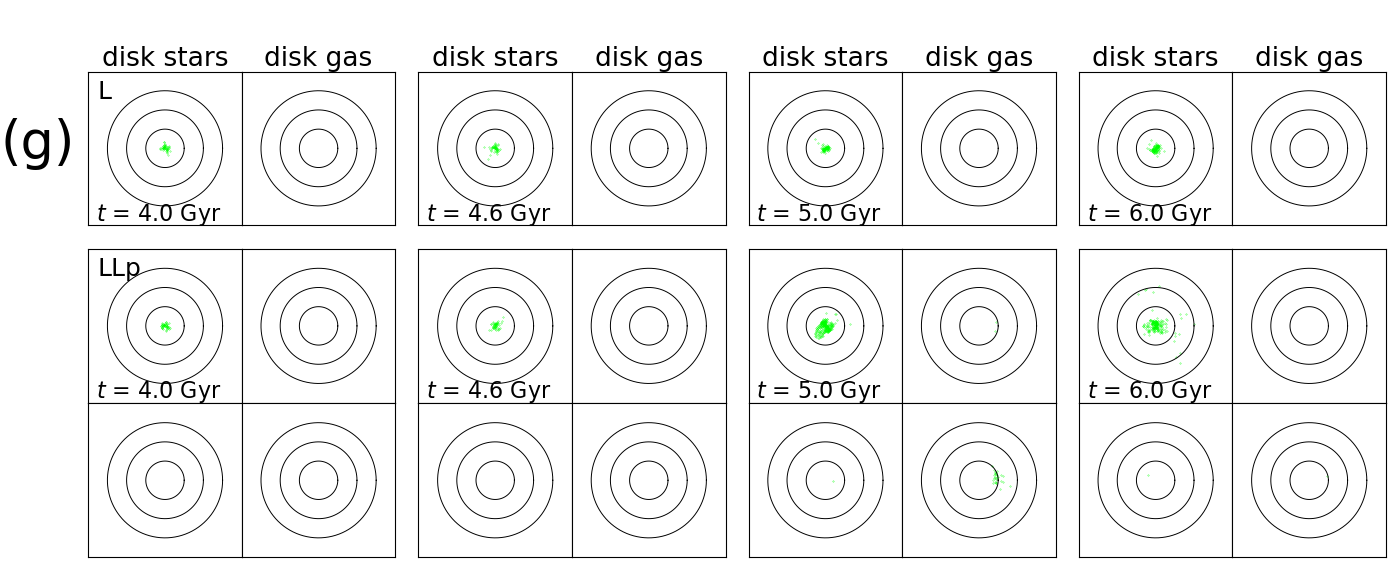
As star-forming gas subsequently turns into stars, the gaseous disk dissipates and the stellar disk grows in mass. Among those stars formed out of the star-forming gas, the stars formed after = 4.5 Gyr are displayed with green points (hereafter,“young” (disk) stars), whereas those stars added onto the disk before = 4.5 Gyr as well as the stars initially set as the disk stars are plotted with orange points (hereafter, “old” (disk) stars). The reason we divide the young and old stars based on whether they were formed after = 4.5 Gyr or not is to compare the distribution of the young stars in the isolated target galaxy with those in the target galaxies from the galaxy-galaxy encounter runs in the following subsections. We present in Figure 4 the sum of the SFRs of the individual star-forming gas particles within and . The SFR within (and also that within ) does not greatly change, but generally decreases slowly as time passes, due to the accumulated effects of the cold gas consumption by star formation.
3.1.2 Run LLp
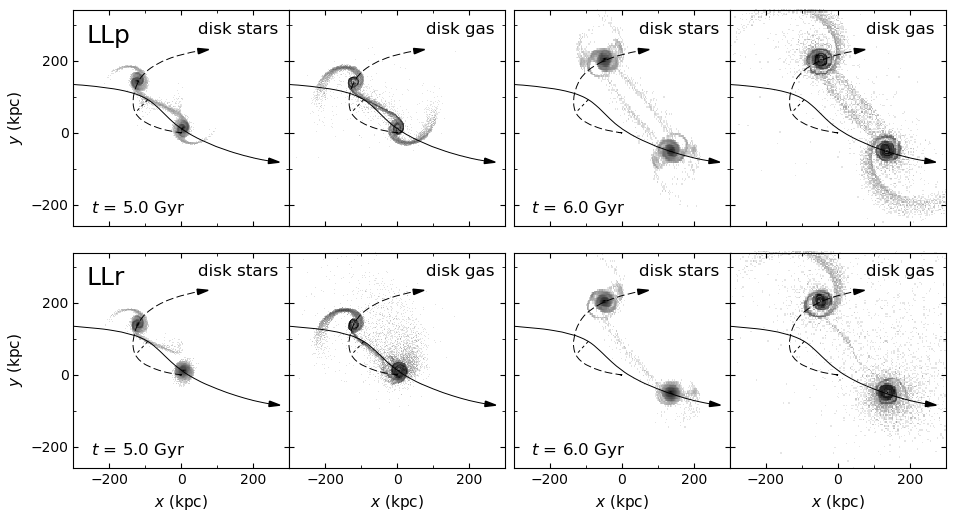
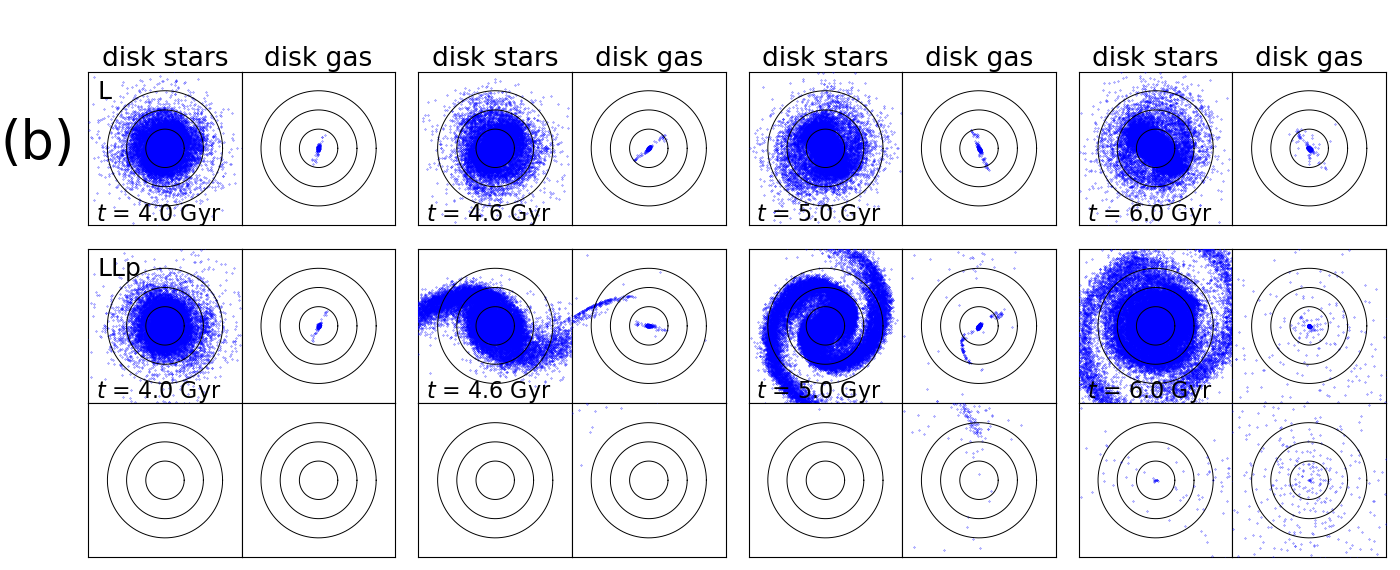
Figure 5 (top row) shows the large-scale configuration of the disks of both target and companion galaxies from run LLp, with their orbital trajectories overlaid. The closest approach between the two LTGs occurs at = 4.5 Gyr with the distance of about 50 kpc. When the target galaxy collides with the companion galaxy, it experiences the encounter as prograde, since the orbit of the companion is prograde with respect to the clockwise directional spin of the target. (By the same token, the companion galaxy, which is spinning in clockwise direction, also experiences the encounter with the target as prograde.) Thus, as seen in the large-scale snapshots taken after the collision, substantial bridges and counter-tails are pulled out of the stellar and gas disks of the target(companion) galaxy due to the tidal force imposed by the companion(target) galaxy. There is some mass exchange between the galaxies: Some disk star and gas particles, among those initially set as the disk particles of the companion, transfer to the target through the stellar and gas bridges formed out of the companion, and vice versa.
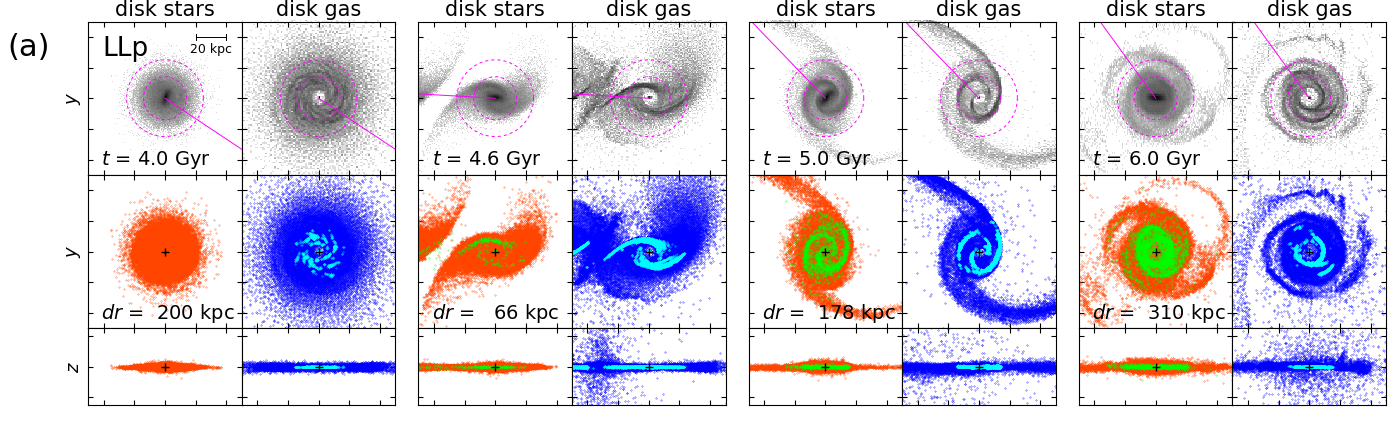
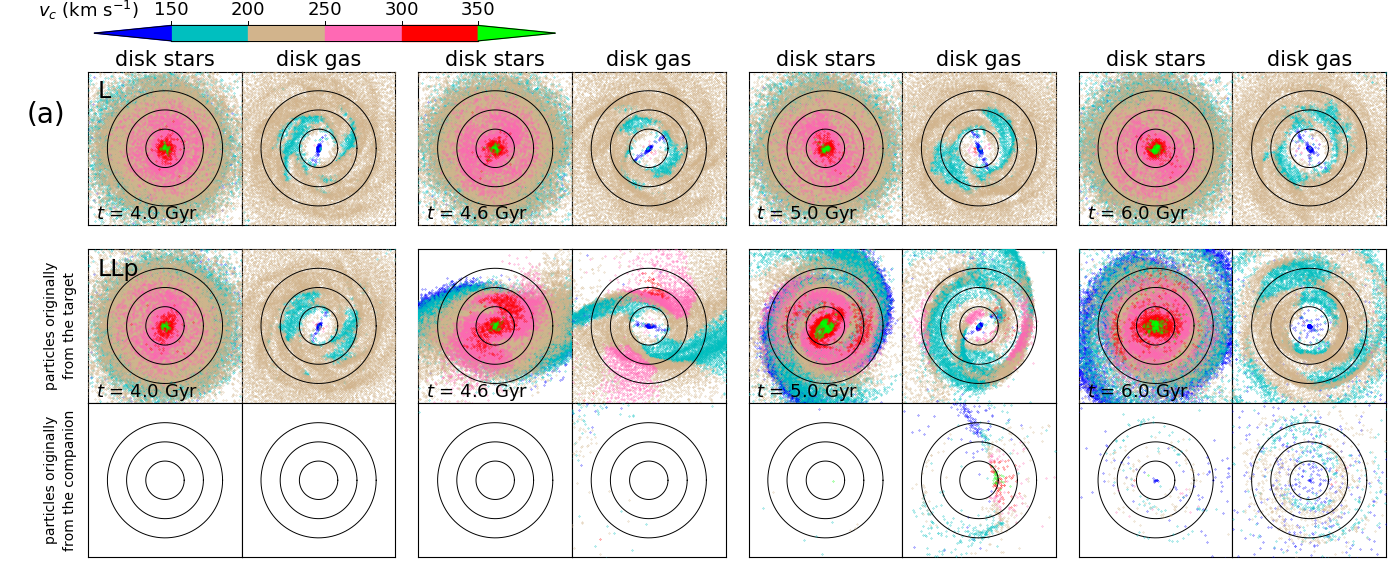
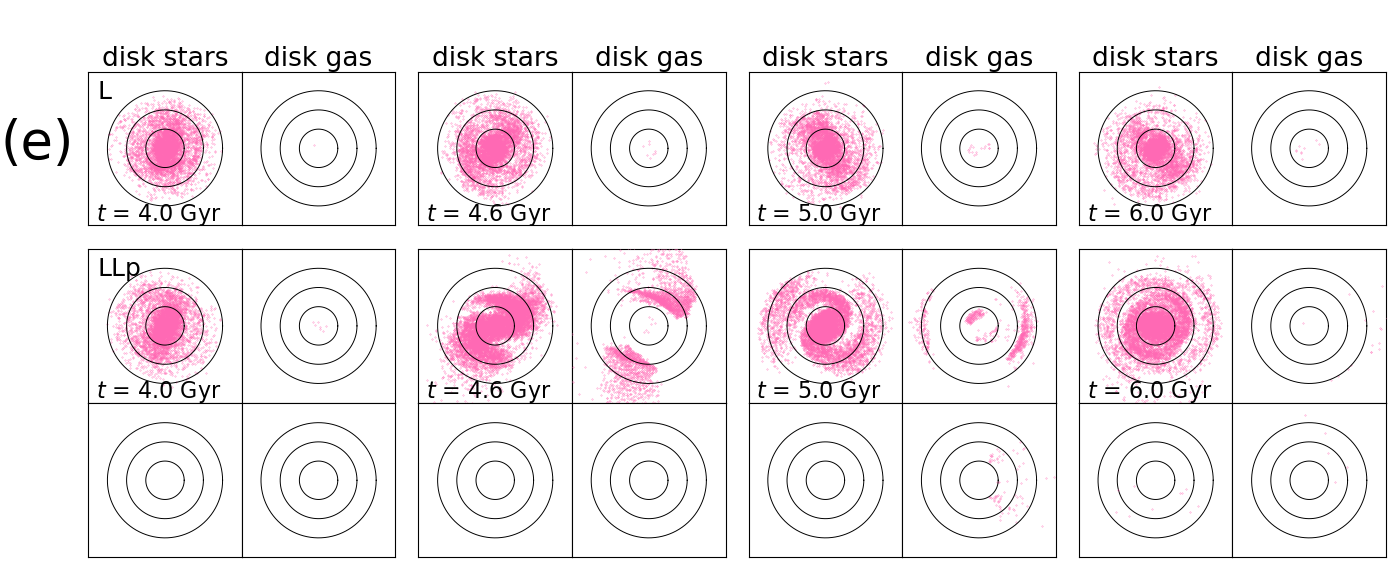
Focusing on the evolution of the target galaxy, Figure 6(a) provides more close-up views of the star and gas disks. The snapshots at = 4 Gyr (i.e., 0.5 Gyr before the collision) appear to be similar to those from run L (without a collision) at the same epoch. However, the snapshots taken after the collision show big differences compared with those from run L at the corresponding epochs: At the onset of the collision, the star and gas disks of the target galaxy start to be pulled radially outward due to the tidal force. Here the tidal force not only stretches the target along the line connecting the target and the companion, but also compresses the target along the perpendicular direction. Besides, since gas interacts not only gravitationally but also hydrodynamically, the leading side of the gas disk of the target galaxy is shock-compressed by the collision with the gas disk of the companion galaxy. As seen in the snapshots at = 4.6 Gyr (shortly after the collision), a lot of star-forming gas turns up along the interaction-induced arms through the prograde collision. By = 5 Gyr, substantial bridges and tails have developed out of both stellar and gas disks of the target galaxy. The higher gas density at the leading side of the gas disk and of the gas bridge results from the shock generated through the collision. Until = 6 Gyr since the time of the collision, a lot more young stars have been added onto the disk, than in the isolated target galaxy from run L. As shown in Figure 4, the SFR in the target galaxy increases abruptly right after the collision, indicating that the strong star formation activity is triggered by the prograde collision. The SFR within (considering the wider region) reaches the maximum after a few hundreds of mega years since the collision, and then starts to drop (but still much higher than that in run L until = 6 Gyr) as gas is consumed by the burst of star formation.
3.1.3 Run LLr
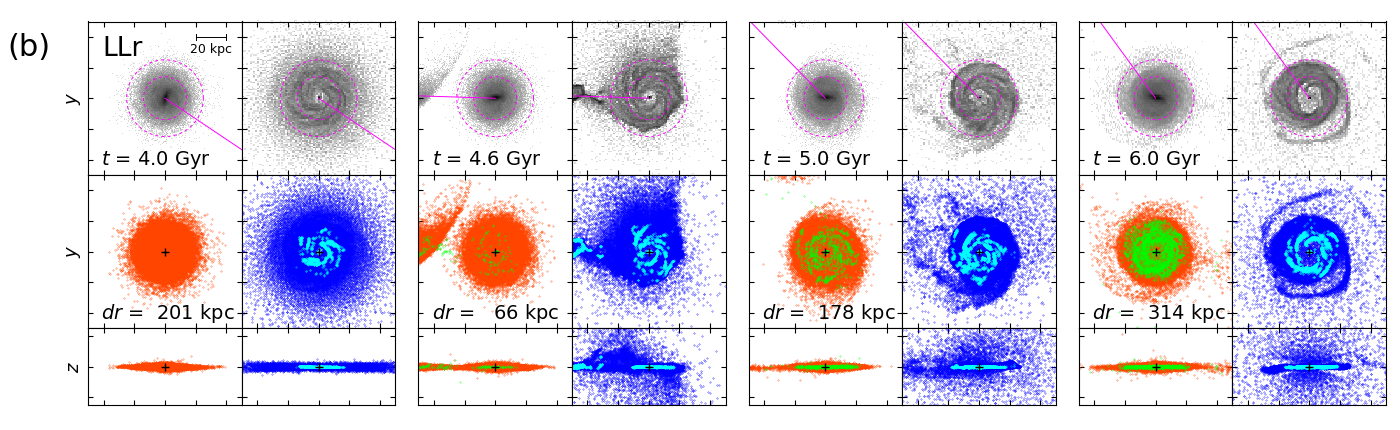
The results from run LLr are presented in Figures 5 (bottom row) and 6(b). When the collision occurs at = 4.5 Gyr, the target galaxy spinning counterclockwise direction experiences the collision as retrograde. (On the other hand, the companion galaxy spinning clockwise direction experiences it as prograde.) Due to the retrograde passage of the companion in this run (with respect to the spin of the target), tidal perturbations on the target by the companion act for a shorter time than in the case of the prograde collision (run LLp). Accordingly, the target galaxy here does not develop strong bridges and tails as seen in the large-scale snapshots. During the collision, some disk material which initially belonged to the companion is captured by the target galaxy.
Looking at the target galaxy more closely (Figure 6(b)), the amount of star-forming gas increases shortly after the collision (at 4.6 Gyr), more than in the isolated target galaxy from run L, but not as greatly as in the target galaxy from run LLp. It can also be checked from the SFR presented in Figure 4. The SFR (within ) of the target galaxy in this run LLr increases after the collision, but less drastically than that in run LLp. Because of the less drastic increase of the star formation activity, cold gas in the target galaxy is consumed less quickly than in run LLp. This helps the target galaxy to maintain relatively active star formation until later times; the gas particles captured by the target galaxy during the collision also contribute to it. (The amount of gas captured by the target galaxy in run LLr is greater than that in run LLp, because in this particular case of run LLp the shock boundary generated between the two gas disks by the prograde collision hinders the flow of gas for a while. In general, the amount and the orbit of the material captured by one galaxy from the other are very sensitive to various factors such as the relative orbit of the pair, the physical properties of each galaxy, and so on. A detailed discussion on this subject is beyond the scope of this paper.)
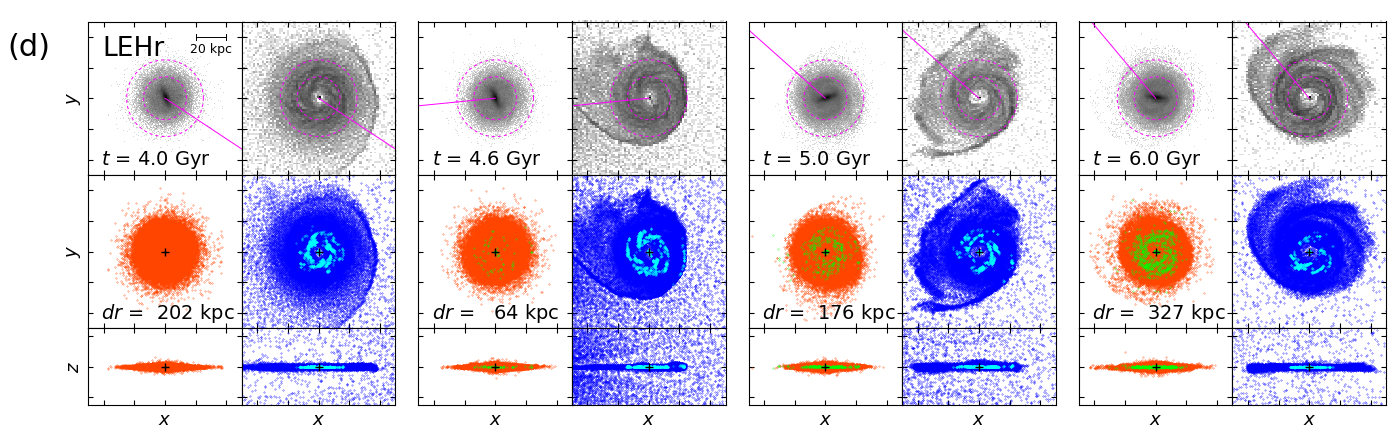
3.1.4 Runs LEHp and LEHr
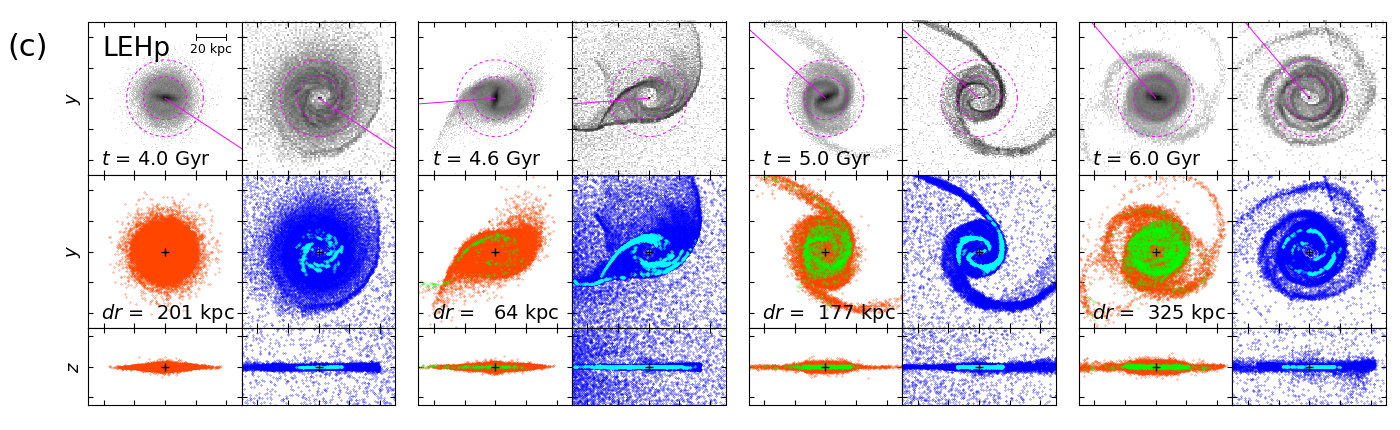
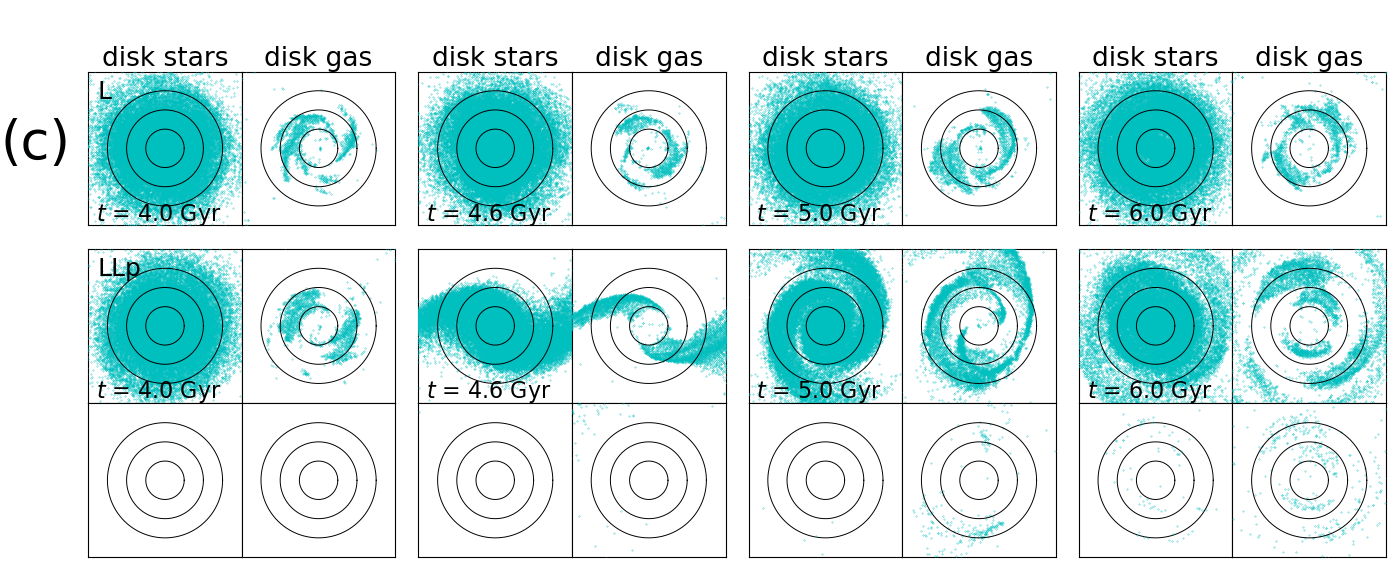
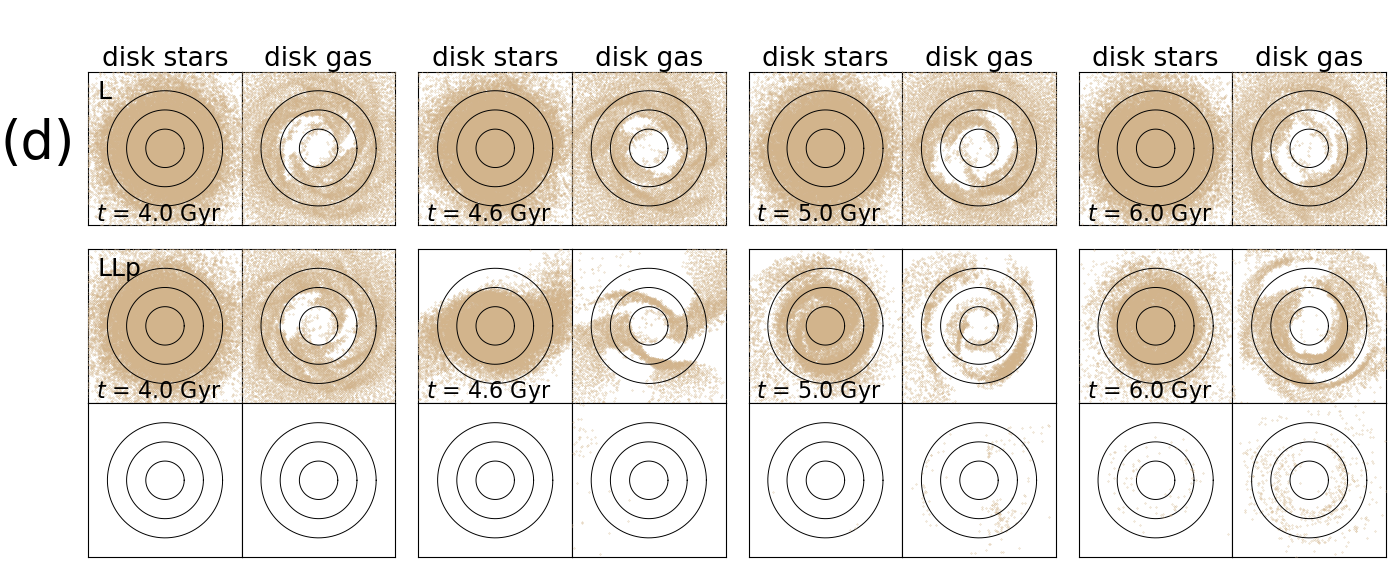
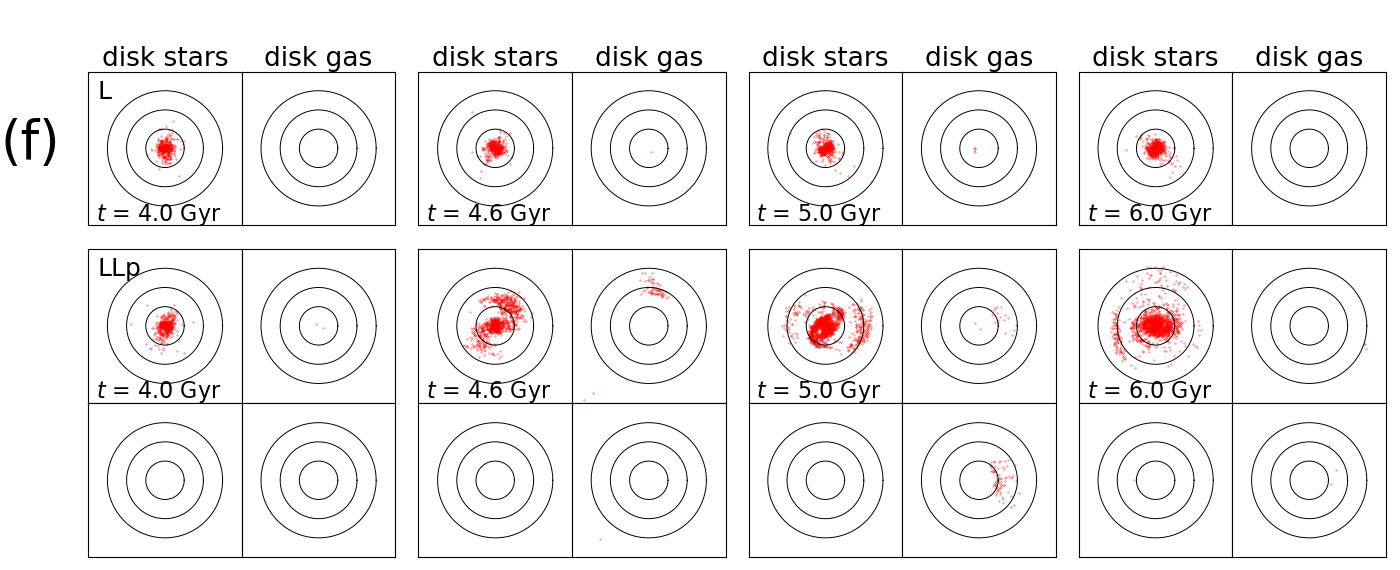
The snapshots from runs LEHp and LEHr are presented in Figure 6(c) and (d), respectively. In run LEHp(LEHr), the target galaxy spinning in clockwise(counterclockwise) direction experiences the collision with the early-type companion as prograde(retrograde). As seen in the snapshots, the distribution of the old disk stars (which are mainly affected by the gravitational force) in the target galaxy from run LEHp(LEHr) at each epoch is generally similar to that from run LLp(LLr) at the corresponding epoch, as expected. However, the distributions of the disk gas (which is influenced by both gravitational and hydrodynamic forces) and of the young stars (which are formed after the collision) are somewhat different from those from run LLp(LLr). The different hydrodynamic interactions between the disk gas of the target and either the halo gas of the companion (in runs LEHp and LEHr) or the disk gas of the companion (in runs LLp and LLr) may have caused the different distributions.
In run LEHp (Figure 6(c)), at Gyr (0.5 Gyr before the closest approach), the gas disk of the target galaxy already starts to form a bow-like front as it comes under the influence of the extended gas halo of the companion galaxy. At Gyr, shortly after the closest approach, the gas at the leading side of the disk is shock-compressed by the collision (c.f. run EH-L in Hwang & Park 2015). In addition, some disk gas is stripped by ram pressure (as seen at the rear side of the disk) or ionized and then scattered, as it moves against the diffuse hot halo gas of the companion. As displayed in Figure 4, the SFR (within of the target galaxy in run LEHp increases greatly by the prograde collision and then slows down afterwards due the cold gas consumption.
In the case of the retrograde collision (Figure 6(d)), the target galaxy in run LEHr does not develop bridges and tails out of the star and gas disks after the collision. The SFR of the target galaxy (Figure 4) increases during the collision but only slightly, compared with that of the target galaxy without a collision (run L). At later times ( 5.5 Gyr), the SFR in this run becomes even lower than that of the isolated target galaxy. It is because some cold gas is removed not only by star formation but also by ram pressure and/or ionization in run LEHr.
3.2. Kinematics
Here we discuss the kinematics of the disk star and gas particles of the target galaxy from our five runs. First we examine the time change of the circular and radial velocities of the disk particles in the following four subsections. Then we look into the evolution of the spin angular momentum of the disk material in the last subsection.
3.2.1 Run L
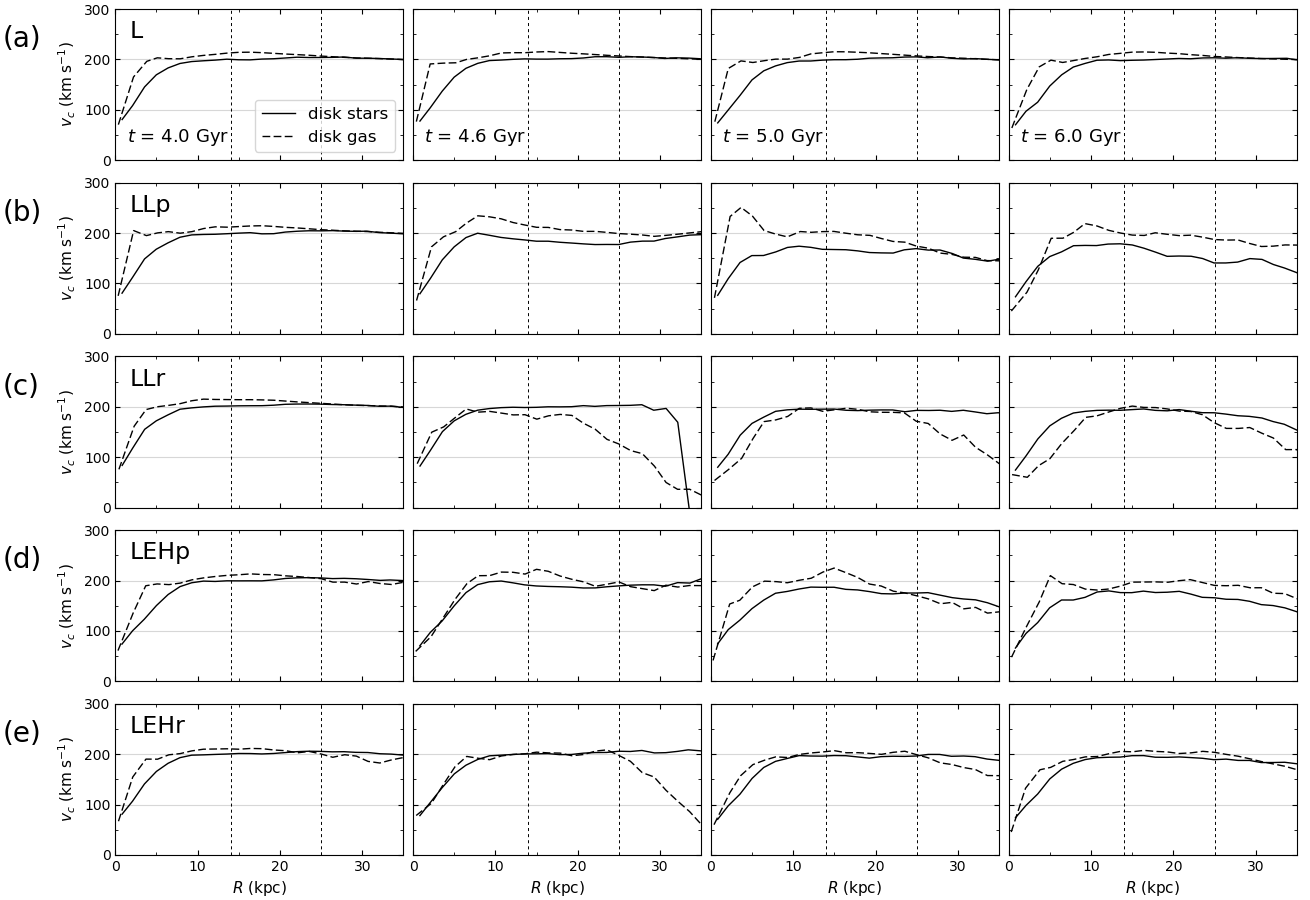
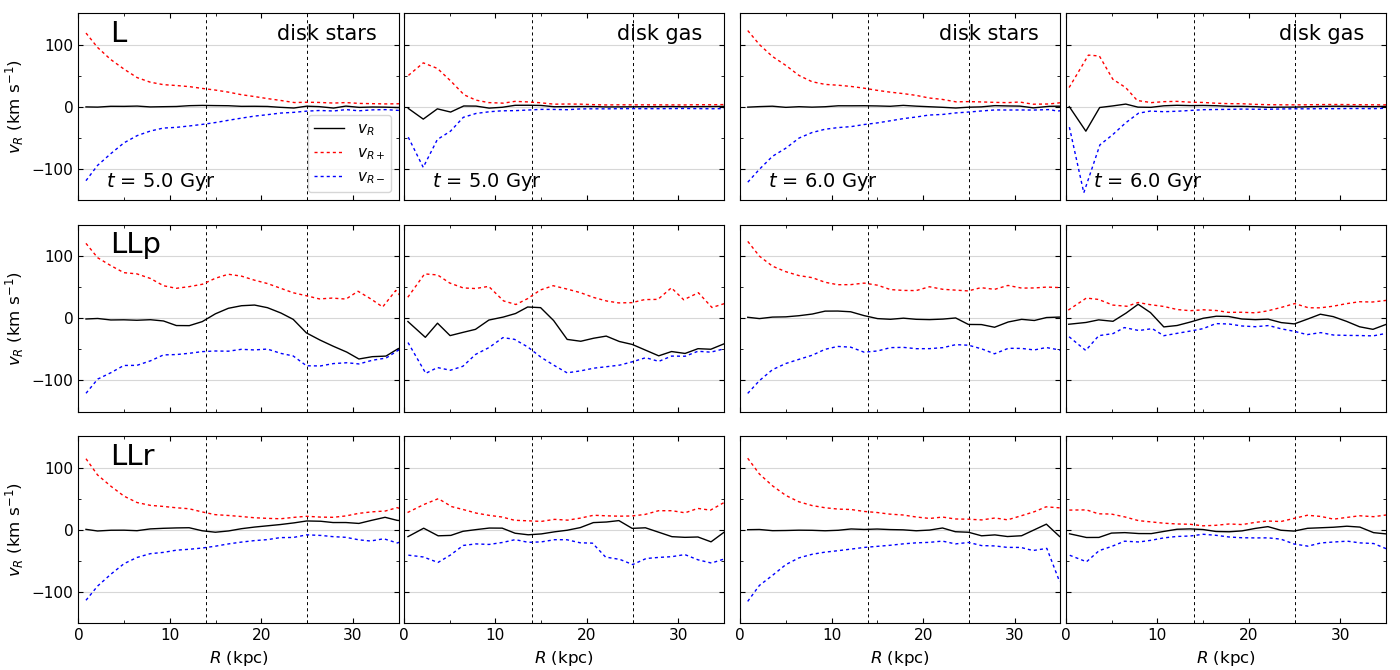
Figures 7(a) and 8 (top row) present the profiles of the circular and radial velocities ( and , respectively) of the disk particles of the target galaxy while evolving in isolation. As seen in the figures, the profiles of the stars and gas deviate somewhat from the initial ones via secular evolution (see Figure 1 for the initial profiles) - i.e., as a bar and spiral arms develop on the disk and star formation with the associated feedback comes into play. Although some changes appear in the velocity profiles as time passes, more for gas than for stars, in the relatively inner region of the disk (where star and structure formation occur more actively), the deviations are generally not significant throughout the run. (In general, the circular velocity profile of young disk stars could be different from that of (old) disk stars. For example, when they have just been formed, the profile may follow that of gas rather than that of stars. We do not display the profile of young stars separately in the figure, because their contribution to the overall (mass weighted) stellar velocity profile is not significant in our runs. It should also be noted that their contribution in luminosity could be more significant than in mass.)
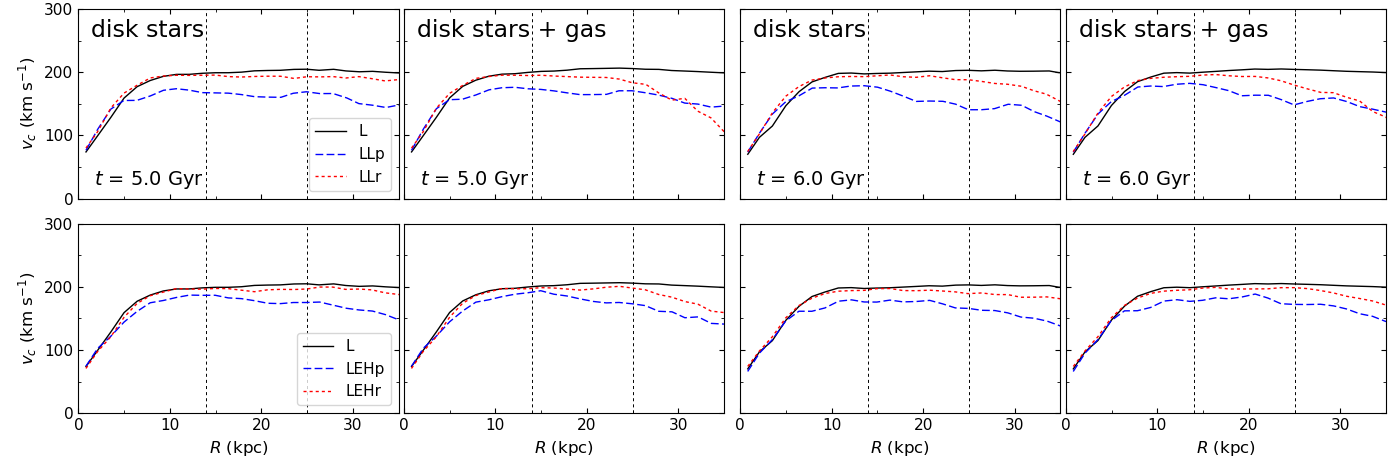
In Figure 9, we compare the circular velocity profile of the disk stars and that of the entire disk material (stars + gas) at 5 and 6 Gyr (black solid curves). They appear to be quite similar to each other as expected, since stars in the target galaxy make up a large portion of the mass of the total disk.
Examining the values of of the individual disk particles (top rows of (a)(g) in Figure 10), stellar particles having relatively high values of (out of the six bins as indicated by the color bar) appear dominantly in the inner region of the disk around the bar and the arms where the density of stars is high as well. Whereas, stars having lower values of are spread more widely over the disk. It should be noted that many stars whose values of falling in different bins overlap spatially. (E.g., stars lying in the innermost region of the disk have diverse values of , ranging from all of the six bins.) On the other hand, gas particles having lower values of are found in the inner region of the disk and those having different values of hardly overlap spatially. This is because, unlike stars, dynamically cold gas responds very quickly to the potential perturbations arisen by the galactic structures such as bar and spiral arm (Roberts 1969; Oh et al. 2008). Hence shocks can easily occur on the gas disk causing the gas to lose angular momentum (Kim & Kim 2014; Kim et al. 2014). For instance, the shocks driven by the asymmetric bar-potential can generate torques through which gas loses the angular momentum and moves radially inward; the spiral shocks can also work to remove the angular momentum of the gas facing with the “pile up” of material.
3.2.2 Run LLp
Figures 7(b) and 8 (middle row) show the profiles of and , respectively, of the disk particles of the target galaxy experiencing a prograde collision with a late-type companion. First, examining the profiles of the disk stars in the region within 333We consider/compare the profile of from each of our runs only in the region within throughout this paper - i.e., up to half the closest approach distance in the galaxy-galaxy encounter runs. That is because the outer part of the disk, further than , of the target galaxy in some of our runs (particularly in runs LLp and LEHp) is severely disturbed through the interaction. (half the closest approach distance), there is a clear tendency for stars to lose but gain both and after the prograde collision. The decrease in circular motions for stars is mainly due to the deflection of the orbits by tidal disruption: (Although there are some particles transferring from the companion to the target, we have found that their contribution is not significant in shaping the overall velocity profiles.) As shown in Figure 10 (bottom two rows of (a)(g)), when the stellar disk of the target galaxy is pulled out by the tidal force, producing a bridge on the near-side (to the companion) and a counter-tail on the far-side, stars located in the outermost part of the disk are pulled first radially outward and then those in the next outermost part follow, while the disk rotates and moves. This may have caused the phase coherence of the stellar orbits along the arms, making the distribution of as appeared in the figure. (Note that many stars with different values of overlap spatially, as in run L.) Since the stellar disk is strongly disturbed by the prograde collision and generate a substantial bridge and tail lasting a couple of giga years, the tendency of losing circular motion and gaining both radially inward and outward motions for stars (compared with those of before or without the collision) is maintained until Gyr.
Next, as for the disk gas particles of the target galaxy, the circular and radial velocity profiles appear to vary more complicatedly after the collision, compared with those of stars: First of all, the amplitude of the circular velocity profile of gas does not generally decrease after the collision, but it rather fluctuates, sometimes making some inner peak(s) - e. g., as at Gyr near kpc (which will be discussed below). In addition, the amplitudes of the profiles of both and increase at Gyr, until not long after the collision, and then slow down at Gyr. During the collision, as shown in Figure 10 (see also Figure 6(a)), the gas disk of the target galaxy is pulled out by the gravitational tide, starting from the outskirt of the disk. Besides, the gas disk is also shock-compressed by the collision with the gas disk of the companion, starting from the leading side of the disk, while it rotates and moves. As stated previously, since dynamically cold gas responds very quickly to the density perturbations generated on the disk, gas particles having different values of hardly overlap spatially, in contrast with the case of stars. Locally, some disk gas particles can gain the circular velocities through the collision, under the influence of the collisional compression and the shocks generated on the disk in addition to that of gravity. For example, the gas particles of the target galaxy at Gyr lying along the asymmetric inner arm around 3 kpc (those shown in pink in the middle row sixth panel from the left in Figure 10(a)) gain circular velocities, resulting in the peak around the radius in the profile of . Interestingly, at Gyr, the gas particles transferring to the target galaxy through the bridge (formed out of the gas disk of the companion) reaching the region near 5 kpc (measuring from the center of the target; those shown in green and red in the bottom row sixth panel from the left in Figure 10(a)) have particularly high circular velocities. It has occurred because the direction of progress of the gas bridge happens to be aligned with the direction of the local circular velocity in the target galaxy. In this particular case, however, the amount of the transferring gas is revealed to be not enough to make a significant contribution to the profile of .
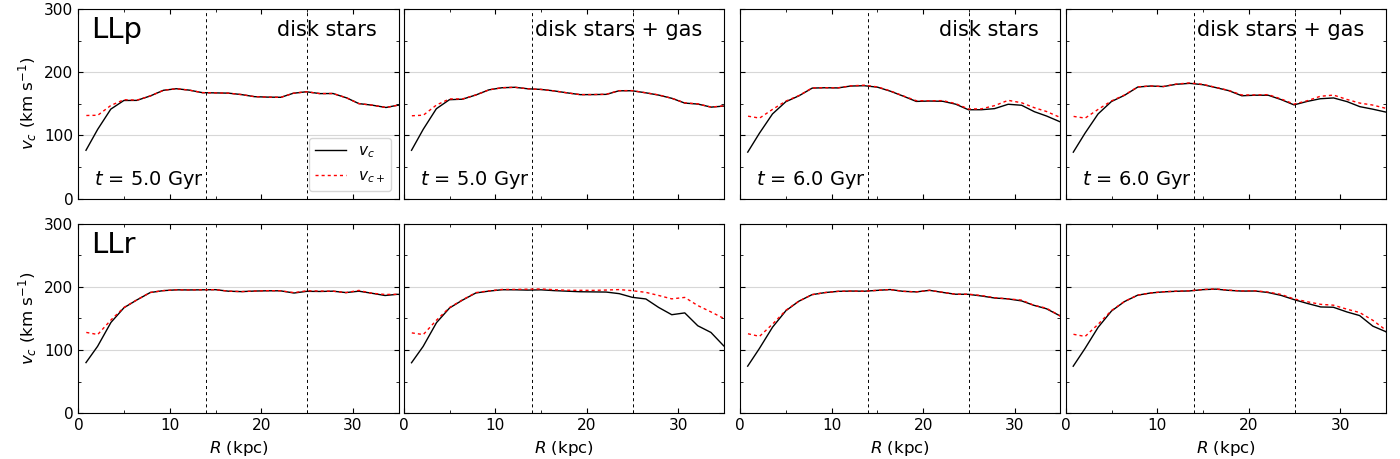
We compare in Figure 9 (top row) the circular velocity profiles of the disk star particles and of the all disk particles of the target galaxy at 5 and 6 Gyr (blue dashed curves). The profile of the all disk particles generally follows that of the stars only, as in run L. It is because stars are dominant in mass on the disk and the encounter is not so strong as to make the system to be out of equilibrium. It is also clearly shown that both profiles of the stars and the star + gas from this run are well below those from run L after the collision, except in the central region. In addition, we examine how the circular velocity profile changes when excluding counter-rotating disk particles. Figure 11 displays that the profiles of of the stars and of the stars + gas (excluding counter-rotating ones) are quite similar to the profiles of after the prograde collision, except at the central region. (Note that some difference between the profiles of and also appears at the central region of the isolated target galaxy, as similarly as those in run LLr (bottom row)).
3.2.3 Run LLr
When the target galaxy experiences a retrograde collision with a late-type companion, the profile of (Figure 7(c)) of the disk stars within remains relatively unchanged after the collision. The amplitudes of both profiles of and of the stars (bottom row of Figure 8) also do not change much through the retrograde collision. As for the disk gas within , the profiles of , , and change somewhat after the collision (except during or shortly after the collision), but not as greatly as in run LLp. Figure 9 (top row) also shows that the circular velocity profiles of the stars and of the star + gas from this run do not differ much from those from run L at 5 and 6 Gyr. Figure 11 (bottom row) presents the profiles of and of the disk particles. The two profiles within are generally similar, except at the central region of the disk.
This result indicates that the retrograde collision considered here has not been able to drive significant dynamical response in the target galaxy, in contrast with the case of the prograde collision, despite of the equally close encounter. Therefore, it can be inferred that when a pair of galaxies are observed to be close to each other, the effects on the kinematics of a system by the interaction with its neighbour could be too weak to be measured, depending on the geometry of the encounter.
3.2.4 Runs LEHp and LEHr
Let’s first consider run LEHp, where the target galaxy interacts with an early-type companion in prograde sense. As shown in Figures 7(d) and 9, the profile of of the disk stars of the target galaxy evolves somewhat similarly to that from run LLp, after the collision - i. e., stars generally lose after the collision. Since the gravitational pull exerted upon the target galaxy depends on the mass of the companion, and which is the same in runs LEHp and LLp, the stellar orbits in the target galaxy from both runs are influenced in a similar way through the prograde collision.
For the disk gas of the target galaxy from run LEHp, the profile of becomes somewhat bumpy, without a marked decrease, after the collision. This trend has also been found in that of the gas from run LLp. However, the specific shape of the profile from this run evolves differently from that from run LLp after the collision. This may have been caused by the different hydrodynamic interactions in these runs.
Finally for run LEHr (Figures 7(e) and 9), where the target galaxy experiences a retrograde collision with an early-type companion, the profile of of the disk stars of the target galaxy remains almost unchanged after the collision, similarly as that from run LLr. The velocity profile of the gas varies after the collision but only slightly. As pointed out in Section 3.2.3, it means that the dynamics of the target galaxy in this run, as well as in run LLr, is not affected significantly by the retrograde collision, except the outskirts of the disk.
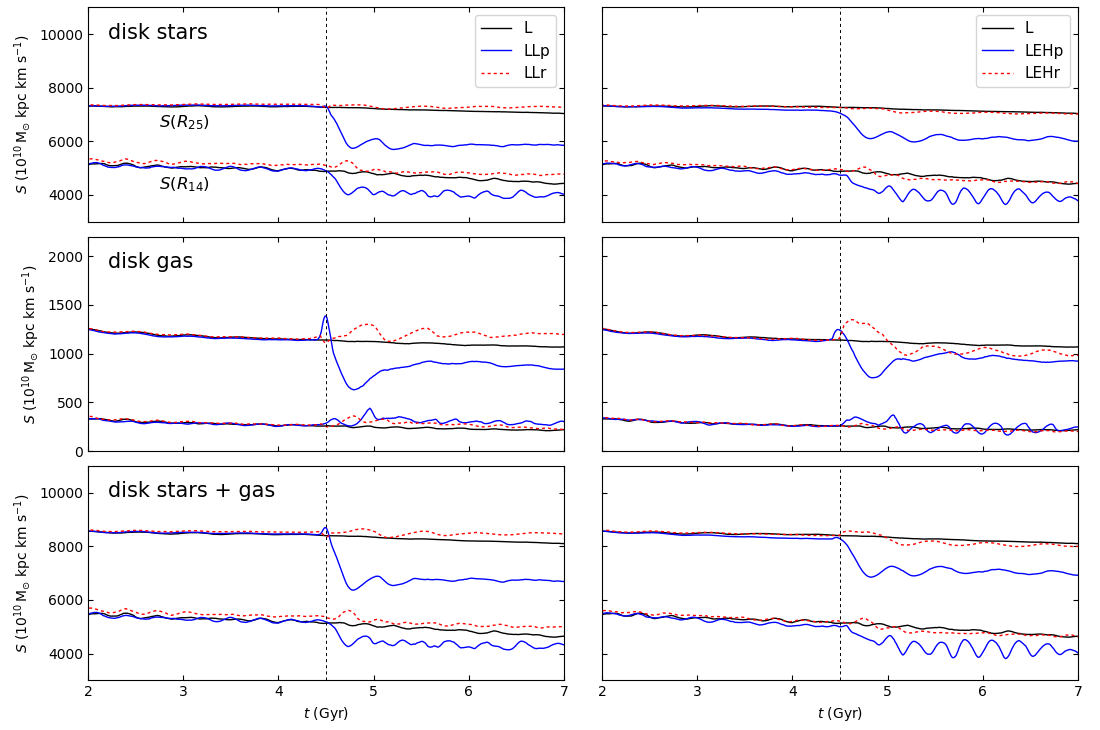
3.2.5 Angular Momentum
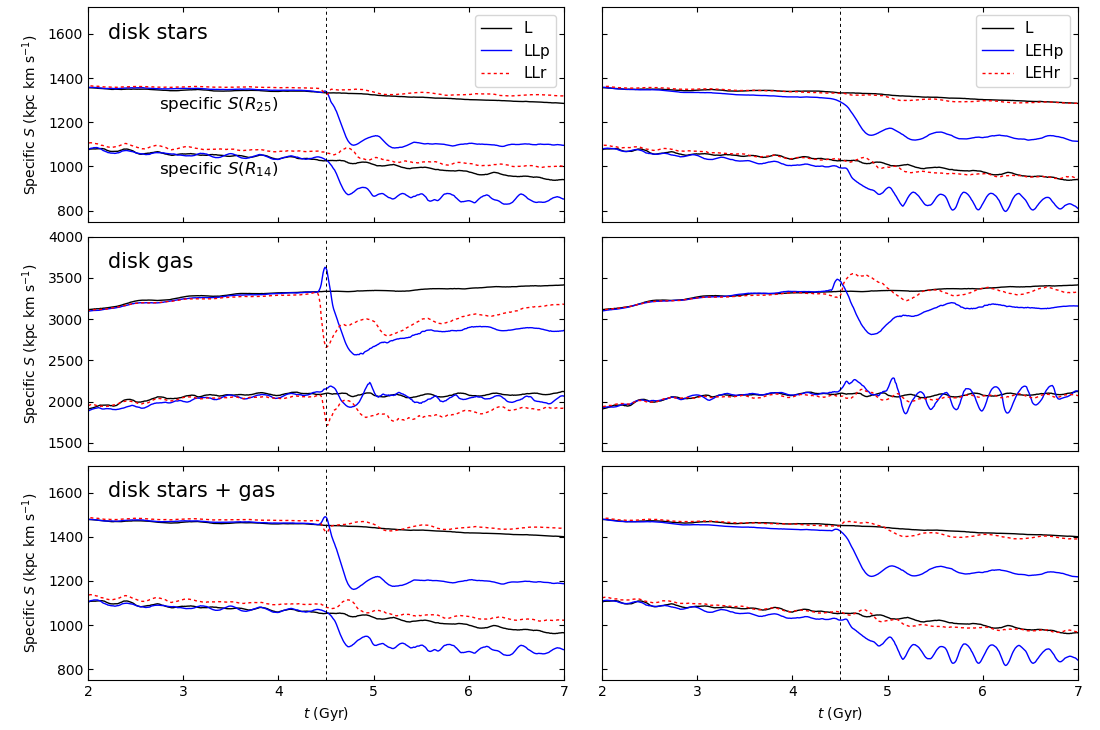
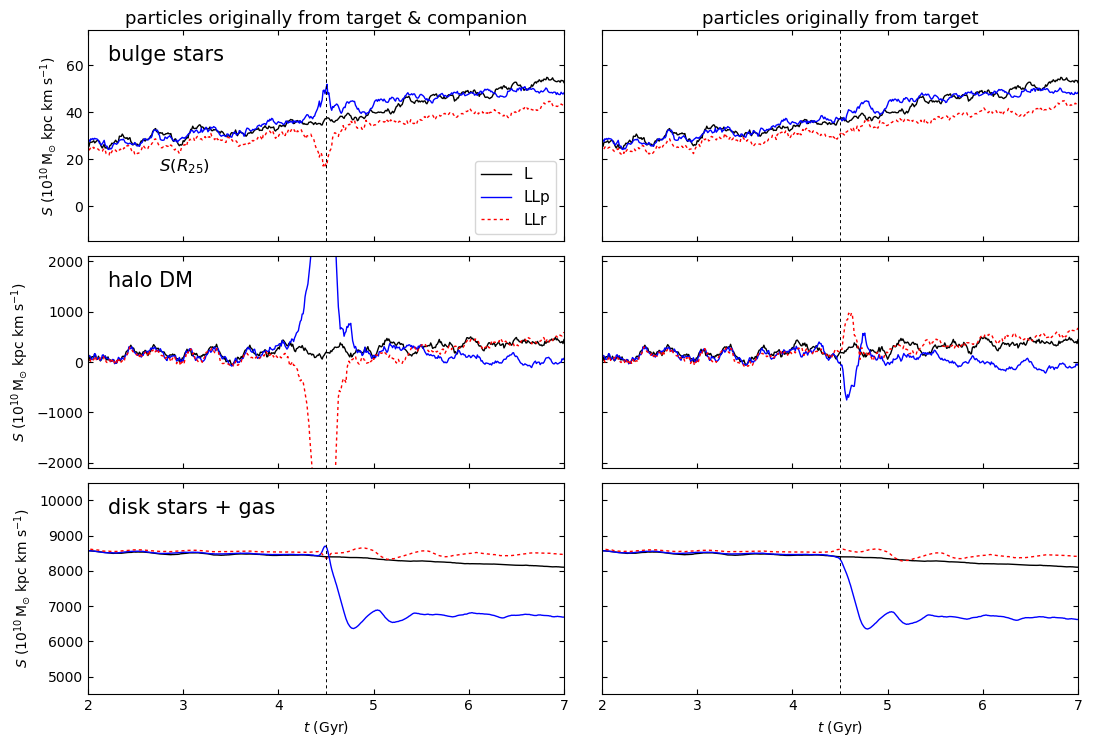
We calculate the spin angular momentum of the target galaxy disk from all of our runs. For the estimation of (), we consider the disk particles of the target galaxy enclosed within a cylindrical region of a radius (with 20 kpc). We present in Figure 12 the evolutions of () and (). It is shown that of the star disk and of the star gas disk of the target galaxy decrease drastically after the prograde collision (runs LLp and LEHp), but not after the retrograde collision (runs LLr and LEHr). Specifically, the value of () of the star gas disk at 5.5 Gyr (i.e., 1 Gyr after the collision) is about 20 %(15 %) smaller in run LLp(LEHp) than that at 3.5 Gyr (1 Gyr before the collision). In Figure 13, we also present the specific angular momentum of the disk of the target galaxy, by dividing by the total mass of the enclosed particles in each case. The specific angular momentum of the disk also decreases clearly after the prograde collision, similarly to the angular momentum. This phenomenon can be interpreted as follows: Initially, in the center-of-mass (CM) frame, two galaxies are far apart and approach linearly each other. After the encounter, those galaxies rotate about the CM with the orbital angular momentum , and the total angular momentum of this system is given by the vector sum of and of those galaxies. The sum is additive in magnitude in the prograde case, but subtractive in the retrograde case. This results in the decrease of of the target galaxy disk in the prograde case while the increase of that in the retrograde case. This justifies our result showing the different behavior of in the prograde case against the retrograde case. The contribution of the tidal effects on the target galaxy disk discussed in the previous sections decreases further, in such a way that the decrease of in the prograde case is enhanced and the increase of in the retrograde case is reduced. The change of is biggest right after the encounter, and one can see such a drastic change of as shown in Figure 12. There could be also the tidal effects due to the bulge and the DM halo reducing of the galaxy disks in both of the prograde and retrograde cases, but those contributions are not significant. We will discuss such subdominant effects briefly in Appendix B.
4. Summary and Discussion
Influenced by observational studies that found some correlations between the spin magnitudes in pairs of galaxies (Cervantes-Sodi et al. 2010; Lee et al. 2018a), we have carried out this numerical study in order to examine how the spin of LTGs is affected by interactions, in a more direct way. As the first in a series of (planned) work, we have constructed four simulations of co-planner encounters between a late-type target galaxy (model L) and an equally massive companion galaxy, whose morphology is either a late- or an early-type (model L or EH, respectively), in prograde or retrograde sense. They are the LLp, LLr, LEHp, and LEHr runs. We have also set up one simulation of the evolution of the target galaxy in isolation, run L, for comparison.
By analysing the circular velocities of the disk particles of the target galaxy (up to ) over time from each of our five runs, we have obtained the following results:
1. Disk stars of the late-type target galaxy tend to lose the circular velocities (and to gain both positive and negative radial velocities) through the prograde collision in runs LLp and LEHp, regardless of the type of the companion. It is mainly due to the deflection of the orbits caused by the tidal disruption. Since the masses of the late- and the early-type companions (having the identical DM halo component) are the same, the individual disk stars (which are mainly affected by gravitational force) of the target galaxy in these runs dynamically evolve in a similar way through the collision.
2. Disk gas of the target galaxy dose not generally lose the circular velocity through the prograde collision in runs LLp and LEHp. The circular velocity of the gas vary in a more complicated fashion, than those of the stars, due to the combined effects of the gravitational and the hydrodynamic interactions.
3. In case of the retrograde collision (runs LLr and LEHr), the circular velocities of the disk stars of the target galaxy remain almost unchanged after the collision, as similarly as those in the isolated target galaxy (run L). The circular velocity of the gas changes after the retrograde collision, but not as greatly as in runs LLp and LEHp, except during/near the collision. It indicates that the retrograde collision in these runs does not drive a significant dynamical response in the target galaxy, irrespective of the type of the companion.
Since stars in our target galaxy make up a large portion of the mass of the total disk, as does in many well observed LTGs, the circular velocity profile of the entire disk material (stars + gas) generally follows that of the stars in all of our runs. It is also because the encounters considered here are not so strong as to make the systems to be out of equilibrium. Taken together, our simulation results indicate that the overall spin of a LTG can decrease through a prograde collision, but hardly through a retrograde collision, regradless of the morphology of the companion. It was also demonstrated in the time change of the spin angular momentum of the disk of the target galaxy. We have found that the angular momentum clearly decreases after the prograde collision, but not after the retrograde collision. This is due to the combined contributions of the tidal effect on the target disk and the spin-orbits interactions (followed by the total angular momentum conservation) of the two galaxies. Specifically, the spin angular momentum (within ) decreased by 20% and 15% after the prograde collision in runs LLp and LEHp, respectively. We can thus infer that, for a sample of LTGs which are observed to have a close neighbour of a comparable mass, the tendency of decrease of the spin of the LTGs (as the separation distance decreases) would be more clearly measured when the sample includes many LTGs that experiences and/or have experienced one or more prograde collisions.
The results from this work may not be generalized to different cases. For example, in case where a late-type target galaxy interacts with a companion galaxy of a highly unequal mass, a significant net amount of material can transfer from one galaxy to the other. Let us recall that, in run LLp at 5 Gyr, there were some gas particles transferring from the companion to the target through the narrow bridge, having much higher circular velocities than surrounding particles. Their higher circular velocities could be made because the direction of progress of the bridge happened to be aligned with the direction of the local circular velocity. The amount of the transferring material in run LLp was not enough to make a meaningful impact in shaping the circular velocity profile of the entire disk material. However, in different situations such as interactions between unequal mass galaxies, a sufficient amount of material might be able to transfer to the target galaxy with high circular velocities, resulting in a peak in the circular velocity profile at the corresponding radius.
Another example, when a gas-rich late-type target galaxy interacts strongly with another gas-rich galaxy, hydrodynamic effects of the interaction may play a much more influential role than in our runs. In this case, the amplitude of the circular velocity profile of the overall disk material of the target galaxy might not simply decrease after the collision, unlike in our runs LLp and LEHp (where tidal disruption plays a bigger role to decrease the amplitude), but changes in a very complex fashion depending on the particular circumstance of each case.
We end this work by emphasizing the significance of
interactions with neighbouring galaxies
in determining
the spin of LTGs at current stage,
as demonstrated by our runs LLp and LEHp.
Since most galaxies experience multiple interactions
over the course of their lifetime,
the accumulated effects of galaxy-galaxy interactions
at later stages after the acquisition of the
internal angular momentum
will play a crucial role in the evolution of
the total angular momentum of galaxies.
We will continue studying this subject
in our future work,
considering more diverse interactions
including the cases stated above
and also major and minor
mergers for a more in-depth understanding of
the evolution of galactic spin
in various environments.
We thank the referee Santi Roca-Fàbrega and the anonymous referee very much for insightful comments and helpful suggestions which improved this paper significantly. J.-S. H. is grateful to Juhan Kim and Yonghwi Kim for helpful discussions. We appreciate Joshua E. Barnes making the ZENO code available and Volker Springel for providing us with GADGET-3. We thank the Korea Institute for Advanced Study for providing computing resources (Higgs Server and KIAS Center for Advanced Computation Linux Cluster System) for this study. This work was supported by Basic Science Research Program through the National Research Foundation of Korea (NRF) funded by the Ministry of Education under the Grant Nos. NRF-2018R1D1A1B07048156 (J.-S. Hwang) and NRF-2018R1D1A1B07050701 (J.-S. Hwang), and NRF-2020R1I1A1A01072816 (S.-h. Nam), and also funded by the Ministry of Science and ICT under the Grant No. 2020R1A2C3009918 (S.-h. Nam).
APPENDIX A
Run LLr2
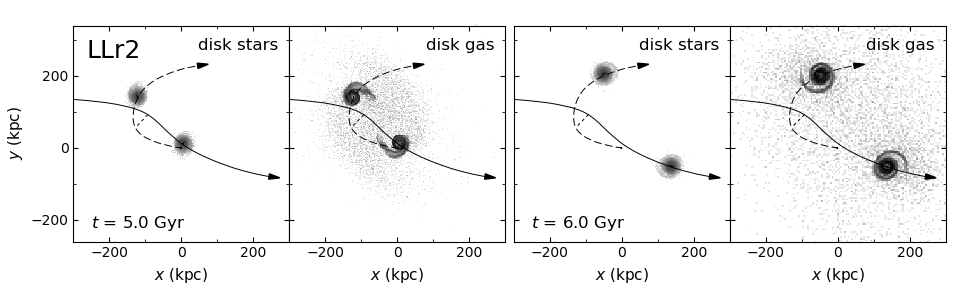
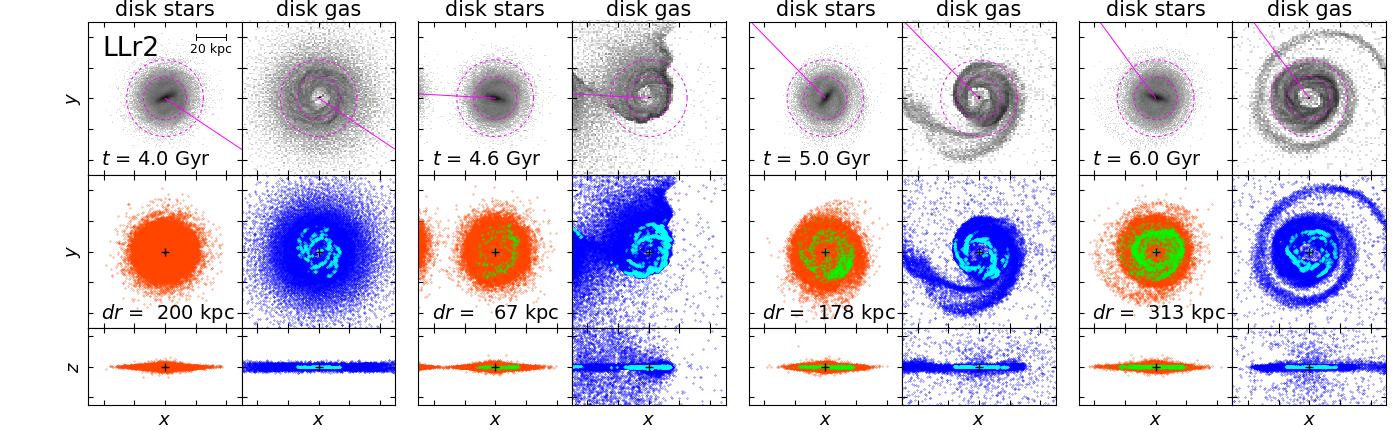
We have performed one more simulation, “run LLr2”. The only difference between the initial conditions of this run and run LLr is the direction of the initial spin of the companion galaxy - i. e., it is set with a counterclockwise direction in run LLr2. Therefore, when the target and the companion meet most closely, both galaxies experience the encounter with the other as retrograde.
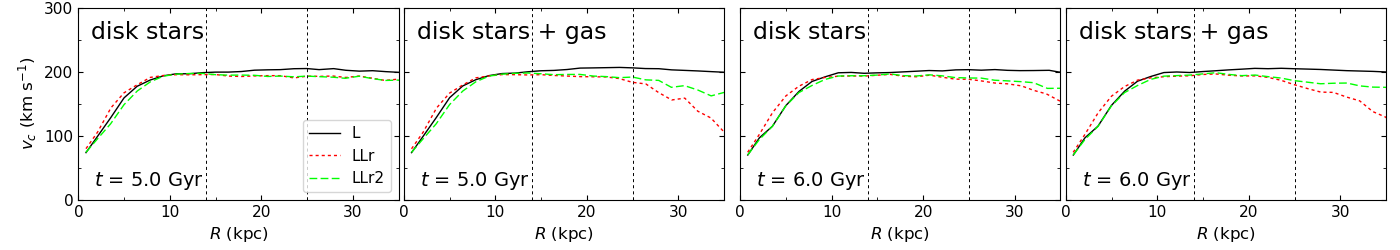
We present the snapshots (Figures 14, and 15) and the circular velocity profiles (Figure 16) from run LLr2. Both target and the companion galaxies do not develop substantial bridges and tails after the retrograde encounter as expected. The overall circular velocity of the disk material of the target galaxy does not decrease much after the collision as shown in Figure 16. The total spin angular momentum becomes doubles in this case so that the change of the spin angular momentum is milder than that of run LLr (where the spin sum is subtractive due to the opposite spin directions) as one can see from the figure.
APPENDIX B
Angular moment of various components
In Figure 17 we present
the spin angular momentum
of the various components of the target galaxy
from run L, LLp, and LLr.
The figure indicates that most of the spin angular momentum
of the target galaxy’s disk is not transferred to
different components of the target galaxy;
it is likely to be transferred to the orbital angular momentum
of the two interacting galaxies.
In order to have full access to the mechanism of
angular momentum transfer of interacting galaxies,
more extensive analysis are need to be done.
References
- Anderson & Bregman (2010) Anderson, M. E., & Bregman, J. N. 2010, Do Hot Halos Around Galaxies Contain the Missing Baryons?, ApJ, 714, 320
- Barnes (2011) Barnes, J. E. 2011, ZENO: -body and SPH Simulation Codes, Astrophysics Source Code Library, record ascl:1102.027
- Barnes & Hibbard (2009) Barnes, J. E., & Hibbard, J. E. 2009, Identikit 1: A Modeling Tool for Interacting Disk Galaxies, AJ, 137, 3071
- Barnes & Hut (1986) Barnes, J., & Hut, P. 1986, A Hierarchical Force-calculation Algorithm, Nature, 324, 446
- Brook et al. (2012) Brook, C. B., Stinson, G., Gibson, B. K., et al. 2012, Hierarchical Formation of Bulgeless Galaxies - II. Redistribution of Angular Momentum via Galactic Fountains, MNRAS, 419, 771
- Cappellari (2016) Cappellari, M. 2016, Structure and Kinematics of Early-type Galaxies from Integral Field Spectroscopy, ARA&A, 54, 597
- Casuso & Beckman (2015) Casuso, E., & Beckman, J. E. 2015, On the Origin of the Angular Momentum of Galaxies: Cosmological Tidal Torques Supplemented by the Coriolis Force, MNRAS, 449, 2910
- Cervantes-Sodi et al. (2010) Cervantes-Sodi, B., Hernandez, X., & Park, C. 2010, Clues on the Origin of Galactic Angular Momentum from Looking at Galaxy Pairs, MNRAS, 402, 1807
- Cloet-Osselaer et al. (2014) Cloet-Osselaer, A., De Rijcke, S., Vandenbroucke, B., et al. 2014, Numerical Simulations of Dwarf Galaxy Merger Trees, MNRAS, 442, 2909
- Codis et al. (2015) Codis, S., Pichon, C., & Pogosyan, D. 2015, Spin Alignments within the Cosmic Web: a Theory of Constrained Tidal Torques near Filaments, MNRAS, 452, 3369
- Davis & Natarajan (2009) Davis, A. J., & Natarajan, P. 2009, Angular Momentum and Clustering Properties of Early Dark Matter Haloes, MNRAS, 393, 1498
- Emsellem et al. (2011) Emsellem, E., Cappellari, M., Krajnović, D., et al. 2011, The ATLAS3D Project - III. A Census of the Stellar Angular Momentum within the Effective Radius of Early-type Galaxies: Unveiling the Distribution of Fast and Slow Rotators, MNRAS, 414, 888
- Gingold & Monaghan (1977) Gingold R. A., & Monaghan J. J. 1977, Smoothed Particle Hydrodynamics: Theory and Application to Non-spherical Stars, MNRAS, 181, 375
- Graham et al. (2018) Graham, M. T., Cappellari, M., Li, H., et al. 2018, SDSS-IV MaNGA: Stellar Angular Momentum of about 2300 Galaxies: Unveiling the Bimodality of Massive Galaxy Properties, MNRAS, 477, 4711
- Hernquist (1990) Hernquist, L. 1990, An Analytical Model for Spherical Galaxies and Bulges, ApJ, 356, 359
- Hoyle (1949) Hoyle, F. 1949, On the Cosmological Problem, MNRAS, 109, 365
- Hwang et al. (2013) Hwang, J.-S., Park, C., & Choi, J.-H. 2013, The Initial Conditions and Evolution of Isolated Galaxy Models: Effects of the Hot Gas Halo, JKAS, 46, 1
- Hwang & Park (2015) Hwang, J.-S., & Park, C. 2015, Effects of Hot Halo Gas on Star Formation and Mass Transfer During Distant Galaxy-Galaxy Encounters, ApJ, 805, 131
- Hwang et al. (2018) Hwang, J.-S., Park, C., Banerjee, A., & Hwang, H. S. 2018, Evolution of Late-type Galaxies in a Cluster Environment: Effects of High-speed Multiple Encounters with Early-type Galaxies, ApJ, 856, 160
- Katz et al. (1996) Katz, N., Weinberg, D. H., & Hernquist, L. 1996, Cosmological Simulations with TreeSPH, ApJS, 105, 19
- Kennicutt (1998) Kennicutt, R. C. Jr. 1998, The Global Schmidt Law in Star-forming Galaxies, ApJ, 498, 541
- Kim et al. (2014) Kim, W.-T., Kim, Y., & Kim, J.-G. 2014, Nature of the Wiggle Instability of Galactic Spiral Shocks, ApJ, 789, 68
- Kim & Kim (2014) Kim, Y., & Kim, W.-T. 2014, Gaseous Spiral Structure and Mass Drift in Spiral Galaxies, MNRAS, 440, 208
- Kubryk et al. (2015) Kubryk, M., Prantzos, N., & Athanassoula, E. 2015, Evolution of the Milky Way with radial motions of stars and gas. I. The solar neighbourhood and the thin and thick disks, A&A, 580, 126
- Lee et al. (2018a) Lee, J. C., Hwang, H. S., & Chung, H. 2018a, A Study of Environmental Effects on Galaxy Spin using MaNGA Data, MNRAS, 477, 1567
- Lee et al. (2018b) Lee, J., Kim, S., Jeong, H., et al. 2018b, Wobbling Galaxy Spin Axes in Dense Environments, ApJ, 864, 69
- McMillan (2011) McMillan, P. J. 2011, Mass models of the Milky Way, MNRAS, 414, 2446
- Navarro et al. (1996) Navarro, J. F., Frenk, C. S., & White, S. D. M. 1996, The Structure of Cold Dark Matter Halos, ApJ, 462, 563
- Oh et al. (2008) Oh, S. H., Kim, W.-T., & Lee, H. M. 2008, Physical Properties of Tidal Features in Interacting Disk Galaxies, ApJ, 683, 94
- Peebles (1969) Peebles, P. J. E. 1969, Origin of the Angular Momentum of Galaxies, ApJ, 155, 393
- Porciani et al. (2002) Porciani, C., Dekel, A., & Hoffman, Y. 2002, Testing Tidal-Torque Theory - I. Spin Amplitude and Direction, MNRAS, 332, 325
- Roberts (1969) Roberts, W. W. 1969, Large-Scale Shock Formation in Spiral Galaxies and its Implications on Star Formation ApJ, 158, 123
- Rodriguez-Gomez et al. (2017) Rodriguez-Gomez, V., Sales, L. V., Genel, S., et al. 2017, The Role of Mergers and Halo Spin in Shaping Galaxy Morphology, MNRAS, 467, 3083
- Springel (2005) Springel, V. 2005, The Cosmological Simulation Code GADGET-2, MNRAS, 364, 1105
- Springel & Hernquist (2002) Springel, V., & Hernquist, L. 2002, Cosmological Smoothed Particle Hydrodynamics Simulations: The Entropy Equation, MNRAS, 333, 649
- Springel & Hernquist (2003) Springel, V., & Hernquist, L. 2003, Cosmological Smoothed Particle Hydrodynamics Simulations: A Hybrid Multiphase Model for Star Formation, MNRAS, 339, 289
- Tempel et al. (2013) Tempel, E., Stoica, R. S., & Saar, E. 2013, Evidence for Spin Alignment of Spiral and Elliptical/S0 Galaxies in Filaments, MNRAS, 428, 1827
- von Neumann (1951) von Neumann, J. 1951, in Monte Carlo Method. National Bureau of Standards Applied Mathematics Series 12 (Washington, DC: US Government Printing Office), 36
- White (1984) White, S. D. M. 1990, Angular Momentum growth in Protogalaxies, ApJ, 286, 38