Chemical bonding and Born charge in 1T-HfS2
Abstract
We combine infrared absorption and Raman scattering spectroscopies to explore the properties of the heavy transition metal dichalcogenide 1T-HfS2. We employ the LO-TO splitting of the vibrational mode along with a reevaluation of mode mass, unit cell volume, and dielectric constant to reveal the Born effective charge. We find = 5.3, in excellent agreement with complementary first principles calculations. In addition to resolving controversy over the nature of chemical bonding in this system, we decompose Born charge into polarizability and local charge. We find = 5.07 Å3 and = 5.2, respectively. Polar displacement-induced charge transfer from sulfur to hafnium is responsible for the enhanced Born charge compared to the nominal 4+ in hafnium. 1T-HfS2 is thus an ionic crystal with strong and dynamic covalent effects. Taken together, our work places the vibrational properties of 1T-HfS2 on a firm foundation and opens the door to understanding the properties of tubes and sheets.
Introduction
While 3 transition metal oxides and chalcogenides display strong electronic correlations, narrow band widths, and robust magnetism, 4 and 5 systems are recognized for strong spin–orbit coupling, increased hybridization, and more diffuse orbitals. As a result, materials that contain 4- and 5 centers often have enhanced or emergent properties Kim2008 ; Birol2015 ; Zwartsenberg2020 ; Cao2018 ; Cao2000 ; Chen2020 ; Singleton2016 ; ONeal2019 ; Ma2018 . Transition metal dichalcogenides such as MoTe2, IrTe2, HfSe2, and PtSe2 are of great interest for their unconventional chemical bonding and hybridization, topology, multiferroicity, and tendency toward complex dimerization patterns Yao2018 ; Zhu2017 ; ChenChen2017 ; Ideta2018 ; Pascut2014 ; Jiang2020 ; Heine2020 ; Koz2020 . Within this class of materials, 1T-HfS2 has attracted particular attention as an analog of HfO2 - a highly polarizable gate dielectric Cheema2020 ; HfO2020 .
1T-HfS2 is a layered material with a (#164) space group at 300 K Iwasaki1982 . Each Hf4+ ion has site symmetry and is located at the center of a S2- octahedron. The van der Waals gap is 3.69 Å, and the sheet thickness is 2.89 Å. Photoemission studies reveal an indirect band gap of 2.85 eV between and M/L, which varies slightly from the 2 optical gap traving2001combined . 1T-HfS2 forms a high performance transistor with excellent current saturation Kanazawa2016 . The carrier mobility is on the order of 1800 cm2V-1s-1 - much higher than MoS2 and thickness dependent as well Xu2015 ; Najmaei2018 . Group theory predicts that at the point 1T-HfS2 has vibrational modes with symmetries of + + + . The + modes are Raman-active, and the + modes are infrared-active Iwasaki1982 ; Roubi1988 . Despite many years of work, there are a surprising number of unresolved questions about 1T-HfS2 - even in single crystal form. In the field of vibrational spectroscopy, there is controversy about mode assignments, the role of resonance in creating hybrid modes, the presence or absence of surface phonons, and the use of this data to reveal the Born effective charge (). As an example, Born effective charges between 3.46 and 5.5 have been reported by various experimental Uchida1978 ; Lucovsky1973 and theoretical Chen2016 groups. Evidence for the degree of ionicity (or covalency) is both interesting and important because 5 orbitals tend to be more diffuse than those of their 3 counterparts. Within this picture, 1T-HfS2 has the potential to sport significant covalency. High pressure Raman scattering spectroscopy reveals a first-order phase transition near 11 GPa and different ’s (and thus mode Gruneisen parameters) for the hybrid and fundamental modes Ibanez2018 . At the same time, variable temperature Raman scattering spectroscopy shows a systematic blueshift of the spectral features down to 100 K, except for the large mode near 330 cm-1 which redshifts Najmaei2018 ; Ibanez2018 . In few- and single-layer form, 1T-HfS2 is suitable for high-performance transistors Kanazawa2016 ; Fu2017 ; Zhang2019 , displays a direct gap (rather than indirect as in the bulk) Kang2015 , exhibits photocatalytic behavior appropriate for water splitting Singh2016 , reveals applications in photodetection photodetectorHf2018 , is susceptible to strain effects Wu2017 , and is useful in N, C, and P surface adsorption Berwanger2020 . This system can be integrated into van der Waals heterostructures and grown vertically as well Zheng2016 ; Zhang2019 ; Lei2019 .
In order to explore the vibrational properties of 1T-HfS2, we measured the infrared absorption and Raman scattering response and employed the results to evaluate Born effective charge. We find that = 5.3, in excellent agreement with our complementary first principles calculations. In order to understand how relates to the nominal 4+ charge of the Hf center, we employ a Wannier function analysis to project out the different orbital contributions. This analysis reveals that the sulfur orbital transfers charge to the cation and that this contribution enhances the Born charge beyond the nominal value. Decomposing into polarizability and local charge, we find that there is strong ionicity as well as significant covalency in this system. Both are quite different than in 2H-MoS2 - probably on account of spin-orbit coupling. We also identify two weak structural distortions near 210 and 60 K evidenced by subtle frequency shifts of the and vibrational modes as well as changes in the phonon lifetimes. Taken together, these findings resolve controversy over the nature of chemical bonding in 1T-HfS2 and clarify the role of the 5 center in the process.
Results and Discussion
First-principles predictions of charge and bonding
Figure 1(a) displays the projected density of states of 1T-HfS2 computed using density functional theory and atom centered local projectors Kresse1999 . The bands can be assigned Hf and S character easily, and the degree of hybridization between the atoms is not dominant (albeit nonzero). This reveals the strong ionic nature of this system: The valence band is composed mainly of S- orbitals whereas the conduction band is predominantly Hf- in character. We find a band gap of 2.05 eV using the HSE06 functional. This is consistent with the small electronegativity of the Hf (1.3 on the Pauling scale) compared to that of S (2.6 on the Pauling scale).
Despite the apparent ionicity of the density of states, the dynamical Born effective charges in 1T-HfS2 are anomalous. We find an in-plane value for the Hf ions as . By contrast, the out-of-plane value for Hf is only 2.0. This reveals that either (i) the Hf ions are strongly polarizable, or (ii) the small degree of covalency is strongly dependent on ionic displacements ghosez1998 .
Figure 1(b) displays the phonon dispersions of 1T-HfS2. While the spectrum is highly dispersive within the plane (for instance, in the -M direction) it is much less so in the out-of-plane direction (for instance, along -A). This difference is a natural consequence of the layered crystal structure and is the origin of the spikes in the phonon density of states [right panel, Fig. 1(b)]. One aspect of these predictions that will be important for later discussion is the mode order around the fundamental. Notice that the feature is predicted to be below the mode, whereas the mode is predicted to be above the fundamental. These features are labeled in Fig. 1(b). Theoretical phonon frequencies are in excellent agreement with our measured results [Table 1].
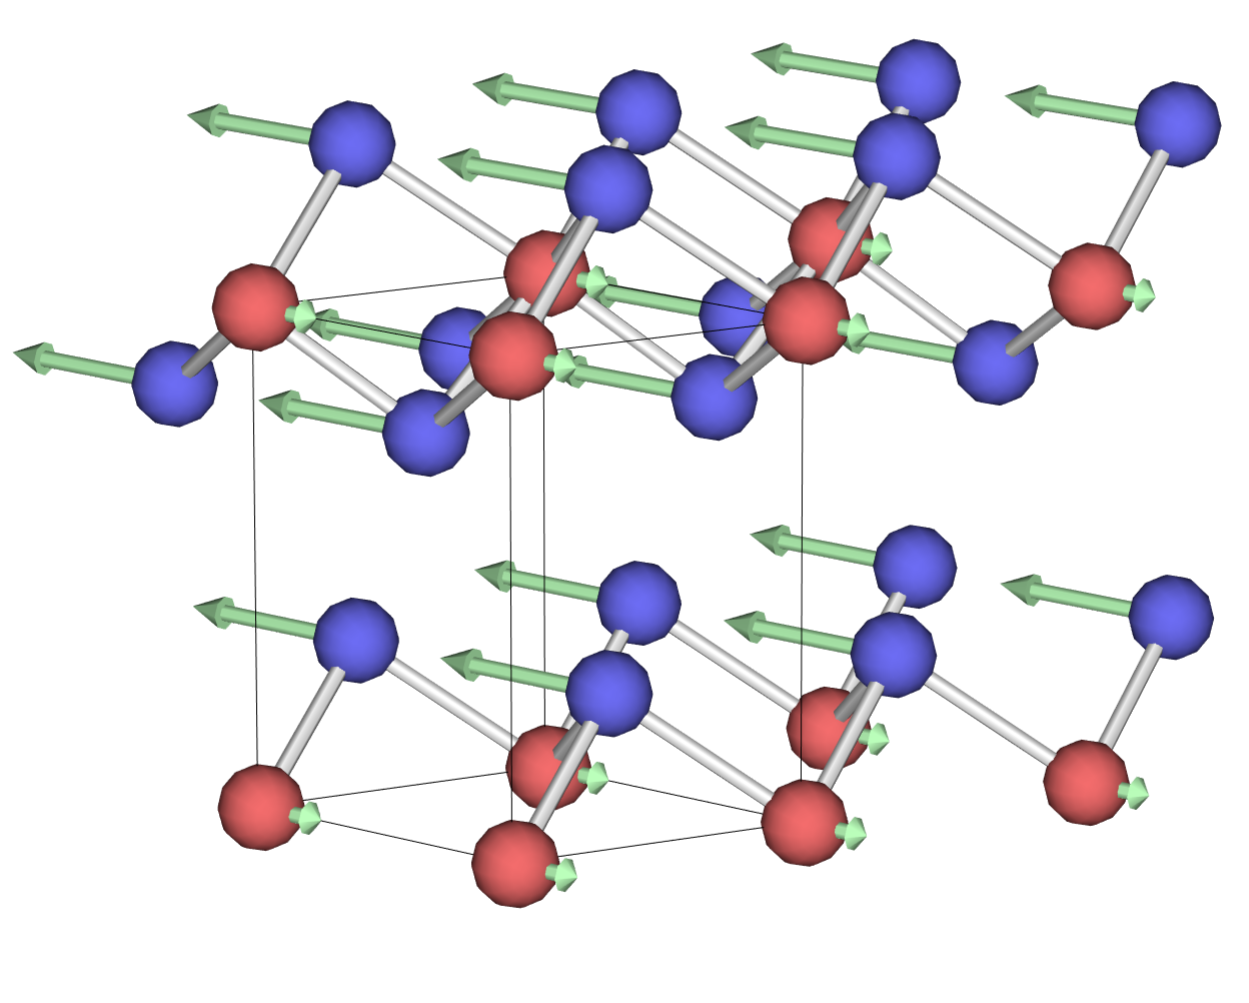
Lattice dynamics can be used to gain information about the chemical bonding in crystals. In 1T-HfS2, the optical mode is due to the in-plane vibrations of the Hf cations against the S anions [Fig. 1(c)]. The frequency difference between the longitudinal and transverse optical modes (the LO-TO splitting) depends on the permittivity, as well as the dynamical charges of the ions. Formally, the LO-TO splitting stems from a non-analytic term added to the dynamical matrices of ionic insulators at the zone center baroni2001phonons :
| (1) |
Here the are atomic indices and are cartesian directions. is the Born effective charge and is the wavevector. With this extra term present in the dynamical matrix, the two-fold degeneracy of the optical modes is lifted:
| (2) |
where is the displacement vector of mode. By considering the fact that is always equal to because of charge neutrality, and the symmetry imposed form of the displacement pattern, we can write this equation for as:
| (3) |
where the is the effective mass, determined by:
| (4) |
In this case, the effective mass is . A general expression for effective mass is provided in Supplementary Information. We use this result along with Equation 3 to analyze the experimental Born effective charge below. Gaussian units are employed.
Infrared properties of 1T-HfS2
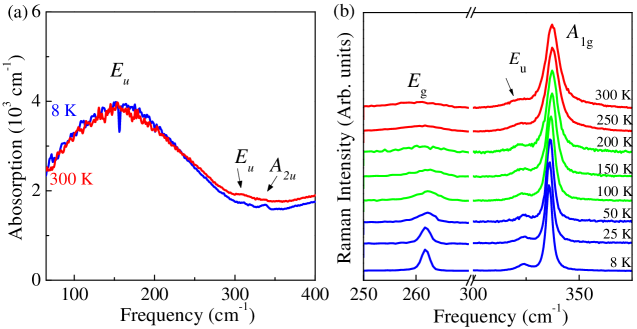
Figure 2(a) summarizes the infrared response of single crystalline 1T-HfS2. We assign the vibrational modes, symmetries, and displacement patterns based upon prior literature as well as our complementary lattice dynamics calculations [Table I] Ibanez2018 ; Najmaei2018 ; Roubi1988 ; Cingolani1987 . There are two fundamental infrared-active phonons. The symmetry mode is extremely broad and centered at 155 cm-1. It is ascribed to an in-plane, out-of-phase motion of the sulfur layers against the hafnium. As we will discuss below, the maximum corresponds to the transverse optical () phonon frequency. In the bulk form peaks in absorption always correspond to the component of the mode. The mode at 336 cm-1 is much weaker and narrower. This feature is due to an out-of-plane + in-phase sulfur layer stretching, and although it is polarized in the direction, it appears in nascent form here probably due to surface flakiness or slight misalignment. In any case, it is very small. There is also a minute structure near 310 cm-1 which, as we shall see below, corresponds to the weakly activated longitudinal optical () frequency of the mode. Of course, each polar phonon has separate and components, and the frequency is always higher than that of the frequency due to the polarizability of the surrounding medium. Displacement patterns for each phonon are shown in Fig. 1(c) and summarized in Table 1.
Figure 2(a) also displays the infrared response of 1T-HfS2 as a function of temperature. What is striking about these results is the overall lack of temperature-induced change over the 300 - 8 K range - in both peak position and intensity. Traditionally, modeling of frequency vs. temperature effects provides important information on anharmonicity in a solid as well as the various force constants. The idea is to bring together frequency vs. temperature plots along with one of several different equations that depend upon the situation. The absence of mode hardening with decreasing temperature suggests, however, that anharmonic effects in 1T-HfS2 are modest and that energy scales are high. Oscillator strength sum rules are obeyed, as expected. Below 100 K, there is a small resonance in the form of a dip that develops on top of the 155 cm-1 symmetry phonon. This structure is one of the spectroscopic signatures of a weak local lattice distortion. Because evidence for the effect is stronger in the Raman response, we will defer this discussion until later. Partial sum rules on the vibrational mode are obeyed, as expected.
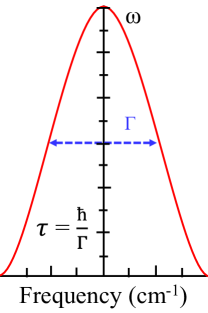
Another way to reveal temperature effects is to examine phonon lifetimes [Fig. 2(b)]. These values, which are expressions of the Heisenberg uncertainty principle, can be calculated from the linewidth of each vibrational mode as , where is the full width at half maximum and is the reduced Planck’s constant Wooten1972 . We find that the phonon lifetime of the mode is 0.03 ps - exceptionally short compared to that of the mode. The lifetime of the mode is nearly insensitive to temperature as well, meaning that this mode dissipates energy very well - even at low temperature. In other words, is large because there are many scattering events. On the other hand, the lifetime of the 336 cm-1 feature is on the order of 0.4 ps. Overall, these phonon lifetimes are shorter than those of 2H-MoS2 ( = 5.5 and 2.3 ps for the and A2u modes, respectively) as well as those of polar semiconductors like GaAs, ZnSe, and GaN (which tend to be between 2 and 10 ps) Sun2013 . Likewise, silicon has a phonon lifetime between 1.6 and 2 ps depending on the carrier (hole) density Letcher2007 . This means that carrier-phonon scattering is of greater importance in 1T-HfS2 than in 2H-MoS2 or the traditional semiconductors. Employing a characteristic phonon velocity of 4700 m/s Kang2015 , we find mean free paths in 1T-HfS2 of 143 pm and 1740 pm for the and modes, respectively. The mean free path for the mode is slightly smaller than all of the characteristic length scales in the system including the 369 pm van der Waals gap, the 289 pm sheet thickness, and the 253 pm Hf–S bond length whereas the mean free path for the mode is 4 or 5 times larger than these characteristic length scales.
Revealing the Born effective charge via infrared spectroscopy
The Born effective charge of transition metal dichalcogenides has been of sustained interest Iwasaki1982 ; Uchida1978 ; Lucovsky1973 ; Sun2013 ; Sun2009 . This is because Born charge can be calculated from first principles as summarized in the previous section and revealed directly from spectroscopic data by taking into account the relationship between the longitudinal and transverse optic phonon frequencies as indicated in Equation 3.
As a reminder, and are the longitudinal and transverse optic phonon frequencies, is the speed of light, is the number of formula units in the unit cell, is the volume of the 1T-HfS2 formula unit, is the electronic charge, is the permittivity of free space, () is the dielectric constant after the phonons, and is the effective mass. Employing Equation 4, we find = 47.02 u for 1T-HfS2. We also use = 310 cm-1, = 155 cm-1, () = 6.20, = 1, and = 66.44 Å3. In the absence of a robust experimentally determined volume, we used a theoretically predicted valueLucovsky1973 . is extremely sensitive to the value of and the choice of (). Employing these numbers, we find = 5.3.
Interestingly, prior studies have led to a variety of Born effective charges for HfS2 with values from 3.46 to 5.5 Uchida1978 ; Lucovsky1973 ; Chen2016 . These findings are summarized in Table 2. The variations in are due to differences in , cell volume, and (to a lesser extent) as well as variability and . Our value of 5.3 is consistent with the large - splitting which signals robust ionicity. By comparison, transition metal dichalcogenides like 2H-MoS2 have much smaller LO-TO splitting and = 1.11 in the -plane Sun2009 ; Wieting1971 .
Born effective charge can be decomposed into polarizability () and local effective charge () as:
| (5) |
and
| (6) |
Here, is the depolarization constant. For two-dimensional systems, = 1/3 Carr1985 ; Kittel2004 . We find = 5.07 and = 5.2 from our experimental value of the Born charge in the plane. These values compare well with those obtained from our theoretical value of : = 6.85 and = 6.2. These results along with literature values are summarized in Table 3.
Polarizability entails the sum of all cationic and anionic electron cloud volume contributions whereas local effective charge is related to short range interactions indicative of ionic displacement and chemical bonding. These values reveal the nature of chemical bonding. Typically, covalent systems such as silicon have close to zero whereas ionic materials have larger local effective charges. For example, = 0.15 for MoS2 Sun2009 , = 1.14 for MnO Sun2011 , and = 0.8 for NaCl Ashcroft1976 . Higher effective and ionic charge in MnO is consistent with the distinction of a Reststrahlen band. 1T-HfS2 clearly has the largest local charge in this series.
Origin of anomalous Born effective charge
In a completely ionic crystal where electrons are attached to ions and displaced along with them by the same exact amount, the dynamical Born effective charge is equal to the formal ionic charge - which would have given for Hf. 1T-HfS2 is closer to this limit due to the low electronegativity of the cation (1.3 in the Pauling scale). This is lower than any 3 transition metal, including Mo which has an electronegativity of 2.2. The electronegativity of S is 2.6, so the Mo-S bonds in MoS2 are highly covalent. Nevertheless, we note that the Born effective charge of Hf in the in-plane direction is more than 50% larger than the nominal charge of +4. This anomalous Born charge signals either (i) covalency between the cations and anions or (ii) cation polarizability ghosez1998 . Uchida explored the issue in terms of static and dynamic charge Uchida1978 . We can address the question more robustly with contemporary tools.
Maximally localized Wannier functions can be utilized to explain the origin of anomalous Born effective charges Ghosez2000 . The macroscopic electronic polarization can be expressed in terms of the center of localized Wannier functions as
| (7) |
where is the Wannier function and the sum is over the filled Wannier orbitals. By displacing the Hf atoms in the in-plane and out-of-plane directions, it is possible to calculate the shift of the center of each Wannier function, and hence get a orbital-by-orbital or band-by-band decomposition of the Born effective charges.
Table 4 shows the band-by-band contributions to the Born effective charges of Hf. It turns out the despite the large electronegativity difference between Hf and S, covalency of Hf-S bonds is the dominant reason behind the anomalous Born effective charge in this compound: the Wannier centers of the electrons in the S-3 bands displace significantly when the Hf ion is displaced. On the other hand, the Hf-5 electrons are displaced almost exactly as much as the Hf ion core itself. Thus, S-3 orbitals contribute most to the difference between Born effective and nominal charge.
Taking a closer look at the electrons in the S-3 orbitals, Fig. S5 shows one of the Wannier functions with and without the Hf ion displacement. In line with the strongly ionic density of states, the S- electrons are mostly localized on S, with small lobes on Hf indicating hybridization. When Hf atoms are displaced in an in-plane direction, one of the three Hf-S bonds is shortened while the other two are elongated. The shortened bond causes the Wannier function to be tilted, and its center shifted towards the Hf atom, shown in Fig. S5(b). This explains why S-3 orbitals will contribute a positive polarization value when Hf atoms are moving in-plane. On the other hand, when Hf atoms move in the out-of-plane direction, the shape of the hybridized electron density on the Hf atom changes, showing a significant qualitative change in the hybridization, as well as a shift in the S-3 Wannier centers parallel to the Hf displacement. This leads to a negative dynamic contribution of S-3 to the out-of-plane Hf effective charge. Though only one S-3 orbital is shown here, the others are similar.
As a comparison, the Born effective charge of Mo in 2H-MoS2 is 1.1 - 1.2 in the in-plane direction Sun2009 , and theoretical results suggest a sign reversal of the cation Born charge Nicholas2017 . This is likely because of a much stronger covalency in MoS2 than in HfS2, which results in more electrons transferred from S anions onto Mo cations when Mo ions are displaced. Note that there is a antibonding orbital in Mo-S bonds near the Fermi level because Mo’s 4 band is partially filled, and this orbital can result in large electron transfer in a way similar to -backbonding in organic chemistry Nicholas2017 . Our DFT calculation confirms the partially filled band structure as shown in the Supplementary Information.
Raman scattering spectroscopy reveals weak structural crossovers in 1T-HfS2
Figure 4(a) summarizes the Raman scattering response of 1T-HfS2 as a function of temperature. We assigned the spectral features based upon our lattice dynamics calculations and prior literature [Table 1] Ibanez2018 ; Roubi1988 ; Cingolani1987 . The two Raman-active fundamentals at 259 and 336 cm-1 are even symmetry vibrational modes. We attribute these features to symmetry (in-plane, out-of-phase sulfur layer shearing) and the symmetry (out-of-plane opposing sulfur motions leading to layer breathing), respectively. There is also a weak overtone mode near 650 cm-1 that is slightly less than twice the frequency of the fundamental. This feature has also been referred to as a second order mode Roubi1988 . There are several hybrid features as well. For instance, the () mode appears weakly in the Raman spectrum near 132 cm-1 due to an in-plane motion of the sulfur against the hafnium. Finally, the shoulder near 325 cm-1 has been the subject of some controversy in the literature. It was previously described as an in-plane shearing (), an out-of-plane sulfur translation (A2u), or even a surface phonon Najmaei2018 ; Ibanez2018 ; Roubi1988 ; Cingolani1987 . Based upon prior pressure studies, the position of this phonon diverges from that of the A1g mode near 325 cm-1 as pressure is increased Ibanez2018 . If this feature was a surface phonon it would likely track parallel to the much larger mode. Because it does not, it is unlikely to be a surface phonon. With the help of prior literature as well as the common position with the mode in the infrared studies, we assign this structure as an symmetry phonon Najmaei2018 ; Ibanez2018 ; Roubi1988 ; Cingolani1987 . Additional justification for this assignment comes from our phonon density of states calculations and the predicted order of the hybrid modes around the fundamental [Fig. 1(b)]. We do not see the hybrid mode in our spectra - even at low temperature, although different laser wavelengths should reveal it Roubi1988 .
Figures 4(b) and (c) display close-up views of the and symmetry Raman-active fundamentals as a function of temperature in contour form. While there is little frequency sensitivity in either feature (due to the high energy scales in this system), there are noticeable linewidth effects. Focusing on the behavior of the layer expansion mode in Fig. 4(b), we see that the linewidth narrows considerably with decreasing temperature, with slight broadening across 60 K and 210 K. There is also a slight redshift across . Analysis of the sulfur-layer stretching mode in Fig. 4(c), again shows linewidth narrowing as base temperature is approached, also with noticeable broadening across the two crossover regimes. A slight redshift below is again present. We attribute the 60 and 210 K transitions in 1T-HfS2 to local lattice distortions involving a slight motion of the S centers with respect to the Hf ions so as to change the bond lengths and angles a little while maintaining the same overall space group.
Using these linewidth trends and the technique described previously, we calculated phonon lifetimes for the Raman-active vibrational modes of 1T-HfS2 [Fig. 4(d)]. As a reminder, the and modes are the fundamentals. The lifetime of the phonon rises steadily with decreasing temperature. The behavior of the symmetry mode is different. It rises gradually below and dramatically across . This suggests that carrier-phonon scattering is reduced with decreasing temperature. Overall the lifetimes of the Raman-active even symmetry modes are similar to those of the infrared-active phonon modes in 1T-HfS2 [Fig. 2(b)] - with the exception of the symmetry vibrational mode which is very lossy and therefore sports an extremely short lifetime. This is one surprising feature in 1T-HfS2 that is not replicated in more traditional systems like 2H-MoS2.
Toward chemical bonding in nanoscale analogs of 1T-HfS2
Overall, there has been surprisingly little discussion of chemical bonding and structural phase transitions in transition metal dichalcogenides in the literature. Much of the focus has instead been on oxides - particularly ferroelectrics - where questions of charge, polarizability, hybridization, and dynamic covalency are considered to be “solved problems”. The mechanism of polar displacement-induced charge transfer is, however, under-explored and may be responsible for enhanced Born charge compared to the nominal charge in oxides as well. This is not the case in transition metal dichalcogenides or complex chalcogenides, and there is much discrepancy in the literature - with estimates of simple quantities like Born charge varying by as much as 40% and almost no attention paid to the role of spin-orbit coupling in heavy chalcogenides. This work places the properties of 1T-HfS2 on a firm foundation for understanding (and even actuating) functionality under external stimuli. It also illustrates a broader approach to exploring chemical bonding in the chalcogenides and opens the door to examination of nanoscale analogs such as tubes, particles, and sheets as well as effects of - and -type doping and intercalation.
Methods
1T-HfS2 single crystals were grown via chemical vapor transport by 2D Semiconductors, Inc. Prior to traditional infrared and Raman scattering measurements, the sample was surface-exfoliated to remove surface impurities and then mounted on a round pin-hole aperture exposing the -plane. Far infrared studies were performed using a Bruker IFS 113V Fourier-infrared spectrometer equipped with a bolometer detector covering the 20-700 cm-1 frequency range with 2 cm-1 resolution. The measured transmittance was converted to absorption as ()= -ln(()), where d is the thickness (in this case, approximately 8.4 10-4 cm). Raman scattering spectroscopy was carried out using a LabRAM HR Evolution Raman spectrometer (50-750 cm-1) using an excitation wavelength of 532 nm at a power of 0.1 mW with an 1800 line/mm grating. An open flow cryostat was used to control temperature between 4 and 300 K. Traditional peak fitting techniques were employed as appropriate.
First principles calculations were performed using the projector augmented wave approach as implemented in the Vienna Ab-initio Simulation Package (vasp)Blochl1994 ; Kresse1996 ; Kresse1999 . Both the Born effective charges and the high frequency dielectric constant are determined from the response to finite electric fields. The high-frequency dielectric constant ), which only contains the electronic contribution, is obtained by differentiating the polarization with respect to the external electric field with clamped ions:
| (8) |
where the polarization is calculated using the implementation of the the Perturbation Expression After Discretization (PEAD) approach in the VASP package PEAD1 ; PEAD2 . Electric fields of 2 meVÅ, 2 meVÅ, and 10 meVÅ are applied separately along , , and axes to calculate the derivatives. Similarly, the Born effective charge is calculated through the derivatives of the polarization with respect to the ionic displacements. At this step, using the Hellman-Feynman forces enables the use of the more computationally efficient formula
| (9) |
Here is the electric enthalpy which is the sum of the Kohn-Sham energy and the energy gain due to the interaction between the polarization and the external electric field: . The Hellman-Feynman force is given by . solely depends on the ground state wavefunction, and hence is easier to calculate than the polarization. As a reliability check, density functional perturbation theory (DFPT) Baroni1987 combined with multiple functionals (including PBEsolPBEsol and revised-TPSS meta-GGAmetaGGA ) with spin-coupling is also performed to get the Born effective charge, which can be found in the Supplementary Information. Both approaches provide similar results for the dielectric constant and Born effective charge. We chose the latter method for its compatibility with Hatree-Fock method, and as a result, the hybrid functionals.
All the first-principles calculations are performed in the primitive 3 atom unit cell with a k-point grid and cut-off energy of 500 eV. The lattice constants and vectors are taken from the experimental literature, but the internal coordinates of the S ions are obtained through structural optimization of forces. The energy tolerance for self-consistency is set to to get a well-converged wavefunction. To reproduce the experimental bandgap more closely, HSE hybrid functional is employed heyd2003hybrid . In the case of 1T-HfS2, a energy band gap of 2.05 eV can be achieved by using the screening parameter of 0.2, which is the so-called HSE06 approximation. Reports of the band gap of HfS2 span values from 1.96 eV (from optical absorption) greenaway1965preparation to 2.85 eV (from combined angle-resolved and inverse photoemission) traving2001combined . Note that band structures calculated using PBEsol or meta-GGA functionals both underestimate the band gap by at least a factor of two, which influences the prediction accuracy of electric field response. A comparison between different functionals is presented in the Supplementary Information. Since Hf is a heavy element with strong spin-orbital coupling (SOC) yagmurcukardes2019raman , DFT calculations that take SOC into account were also performed, but no significant change of Born effective charges and phonon frequencies are observed. A detailed comparison of all theoretical results is provided in the Supplementary Information.
To further explain the origin of Born effective charge, we employed the maximum localized Wannier function (MLWF) Marzari1997 ; Marzari2012 to project the band-by-band contribution. The Wannier90 software package is used for this analysis MOSTOFI20142309 .
Acknowledgements
Research at the University of Tennessee is supported by the U.S. Department of Energy, Office of Basic Energy Sciences, Materials Science Division under award DE-FG02-01ER45885. The work at the University of Minnesota is supported primarily by the National Science Foundation through the University of Minnesota MRSEC under Award Number DMR-2011401. We acknowledge the Minnesota Supercomputing Institute (MSI) at the University of Minnesota for providing resources that contributed to the research results reported within this paper. We thank S. Najmaei and I. Boulares at the U. S. Army Research Lab for the 1T-HfS2 crystal and useful conversations.
Contributions
This project was conceived by JLM and SNN. Raman scattering and infrared absorption measurements were conducted by SNN and data were analyzed by SNN and JLM. Theoretical studies and density functional calculations were carried out by SL and TB. all authors discussed data. The manuscript was written by SNN, SL, TB, and JLM. All authors read and commented on the manuscript.
Competing interests
The authors declare no competing interests.
I Figures
II Tables
| Theoretical | Symmetry | Infrared | Raman | Mode Displacement |
| 152 | () | 155 | 132 | in-plane, out-of-phase motion |
| of sulfur against hafnium | ||||
| 259 | - | 259 | in-plane, out-of-phase | |
| sulfur layer shearing | ||||
| 300 | () | 310 | 325 | in-plane, out-of-phase motion |
| of sulfur against hafnium | ||||
| 316 | - | 336 | out-of-plane, out-of-phase | |
| sulfur layer breathing | ||||
| 321 | A2u | 336 | - | out-of-plane, in-phase |
| stretch of sulfur layer | ||||
| + | 475 | combination mode | ||
| 2() | 650 | overtone mode |
| () (cm-1) | () (cm-1) | () | (u) | () | Z () | Reference |
|---|---|---|---|---|---|---|
| 300 | 152 | 6.33 | - | - | 3.46 | Chen et. al. Chen2016 |
| 318 | 166 | 6.20 | 23.59 | 69.46 | 3.90 | Lucovsky et. al. Lucovsky1973 |
| 321 | 166 | 6.20 | - | - | 5.50 | Uchida et. al. Uchida1978 |
| 310 | 155 | 6.20 | 47.02 | 66.44 | 5.3 | This work (experiment) |
| 300 | 152 | 8.09 | 47.02 | 66.44 | 6.4 | This work (theory) |
| Z () | () | Z∗ () | Reference |
| - | 2.2 | 0.86 | Iwasaki et. al. Iwasaki1982 |
| 3.46 | - | - | Chen et. al. Chen2016 |
| 3.90 | - | - | Lucovsky et. al. Lucovsky1973 |
| 5.50 | - | 2.60 | Uchida et. al. Uchida1978 |
| 5.3 | 5.07 | 5.2 | This work (experiment) |
| 6.4 | 6.85 | 6.2 | This work (theory) |
| Core charge | Hf:5 | S:3 | S:3 | total | |
|---|---|---|---|---|---|
| +10 | -6.08 | +0.30 | +2.34 | 6.56 | |
| +10 | -6.20 | 0.01 | -1.86 | 1.93 |
References
- (1) Kim, B. J., et al. Novel Jeff=1/2 mott state induced by relativistic spin-orbit coupling in Sr2IrO4. Phys. Rev. Lett. 101, 076402 (2008).
- (2) Birol, T. & Haule, K. Jeff=1 /2 Mott-insulating state in Rh and Ir fluorides. Phys. Rev. Lett. 114, 096403 (2015).
- (3) Zwartsenberg, B., et al. Spin-orbit-controlled metal–insulator transition in Sr2IrO4. Nat. Phys. 16, 290–294 (2020).
- (4) Cao, G., et al. Electrical control of structural and physical properties via strong spin-orbit interactions in Sr2IrO4. Phys. Rev. Lett. 120, 017201 (2018).
- (5) Cao, G., et al. Charge density wave formation accompanying ferromagnetic ordering in quasi-one-dimensional BaIrO3. J. Phys. C 113, 657–662 (2000).
- (6) Chen, Q., et al. Realization of the orbital-selective Mott state at the molecular level in Ba3LaRu 2O9. Phys. Rev. Mater. 4, 064409 (2020).
- (7) Singleton, J., et al. Magnetic properties of Sr3NiIrO6 and Sr3CoIrO6: Magnetic hysteresis with coercive fields of up to 55 T. Phys. Rev. B 94, 224408 (2016).
- (8) O’ Neal, K. R., et al. Spin – lattice and electron – phonon coupling in 3d / 5d hybrid Sr3NiIrO6. npj Quant. Mater. 48, 1–6 (2019).
- (9) Ma, Y., Kou, L., Huang, B., Dai, Y., & Heine, T. Two-dimensional ferroelastic topological insulators in single-layer Janus transition metal dichalcogenides MSSe (M=Mo, W). Phys. Rev. B 98, 085420 (2018).
- (10) Yao, Q., Zhang, L., Bampoulis, P., & Zandvliet, H. J. Nanoscale investigation of defects and oxidation of HfSe2. J. Phys. Chem. C 122, 25498–25505 (2018).
- (11) Zhu, H., et al. Defects and surface structural stability of MoTe2 under vacuum annealing. ACS Nano 11, 11005–11014 (2017).
- (12) Chen, C., et al. Surface phases of the transition-metal dichalcogenide IrTe2. Phys. Rev. B 95, 094118 (2017).
- (13) Ideta, S., et al. Ultrafast dissolution and creation of bonds in IrTe2 induced by photodoping. Sci. Adv. 4, aar3867 (2019).
- (14) Pascut, G. L., et al. Dimerization-induced cross-layer quasi-two-dimensionality in metallic IrTe2. Phys. Rev. Lett. 112, 086402 (2014).
- (15) Jiang, K., et al. New pressure stabilization structure in two-dimensional PtSe2. J. Phys. Chem. Lett. 11, 73427349 (2020).
- (16) Kempt, R., Kuc, A., & Heine, T. Two-dimensional noble-metal chalcogenides and phosphochalcogenides. Angew. Chem. Int. Ed. 59, 9242–9254 (2020).
- (17) Kozhakhmetov, A., et al. Scalable BEOL compatible 2D tungsten diselenide. 2D Mater. 7, 015029 (2020).
- (18) Cheema, S.S., et al. Enhanced ferroelectricity in ultrathin films grown directly on silicon. Nature 580, 478–482 (2020).
- (19) Lee, H-J., et al. Scale-free ferroelectricity induced by flat phonon bands in HfO2. Science 67, 1–10 (2020).
- (20) Iwasaki, T., Kuroda, N., & Nishina, Y. Anisotropy of lattice dynamical properties of ZrS2 and HfS2. J. Phys. Soc. Japan 51, 2233–22440 (1982).
- (21) Traving, M., et al. Combined photoemission and inverse photoemission study of HfS2. Phys. Rev. B 63, 035107 (2001).
- (22) Kanazawa, T., et al. Few-layer HfS2 transistors. Sci. Rep. 6, 22277 (2016).
- (23) Xu, K., et al. Ultrasensitive phototransistors based on few-layered HfS2. Adv. Mater. 27, 7881–7887 (2015).
- (24) Najmaei, S., et al. Cross-plane carrier transport in van der Waals layered materials. Small 14, 1–11 (2018).
- (25) Roubi, L. & Garlone, G. Resonance Raman spectrum of HfS2 and ZrS2. Phys. Rev. B 37, 6808–6812 (1988).
- (26) Uchida, S.-i. & Tanaka, S. Optical phonon modes and localized effective charges of transition-metal dichalcogenides. J. Phys. Soc. Japan 45, 153–161 (1978).
- (27) Lucovsky, G., White, R. M., Benda, J. A., & Revelli, J. F. Infrared-reflectance spectra of layered group-IV and group-VI transition-metal dichalcogenides. Phys. Rev. B 7, 3859–3870 (1973).
- (28) Chen, J. Phonons in bulk and monolayer HfS2 and possibility of phonon-mediated superconductivity: A first-principles study. Solid State Commun. 237-238, 14–18 (2016).
- (29) Ibáñez, J., et al. High-pressure Raman scattering in bulk HfS2: comparison of density functional theory methods in layered MS2 compounds (M = Hf, Mo) under compression. Sci. Rep. 8, 1–10 (2018).
- (30) Fu, L., et al. van der Waals epitaxial growth of atomic layered HfS2 crystals for ultrasensitive near-infrared phototransistors. Adv. Mater. 29, 1700439 (2017).
- (31) Zhang, W., Netsu, S., Kanazawa, T., Amemiya, T., & Miyamoto, Y. Effect of increasing gate capacitance on the performance of a p-MoS2/HfS2 van der Waals heterostructure tunneling field-effect transistor. Japn. J. Appl. Phys. 58, SBBH02 (2019).
- (32) Kang, J., Sahin, H., & Peeters, F. M. Mechanical properties of monolayer sulphides: a comparative study between MoS2, HfS2, and TiS3. Phys. Chem. Chem. Phys. 17, 27742–27749 (2015).
- (33) Singh, D., Gupta, S. K., Sonvane, Y., Kumar, A., & Ahuja, R. 2D-HfS2 as an efficient photocatalyst for water splitting. Catal. Sci. and Technol. 6, 6605–6614 (2016).
- (34) Wang, D., et al. Selective direct growth of atomic layered HfS2 on hexagonal boron nitride for high performance photodetectors. Chem. Mater. 30, 3819–3826 (2018).
- (35) Wu, N., et al. Strain effect on the electronic properties of 1T-HfS2 monolayer. Physica E 93, 1–5 (2017).
- (36) Berwanger, M., Ahuja, R., & Piquini, P. C. HfS2 and TiS2 monolayers with adsorbed C, N, P atoms: A first principles study. Catalysts 10, catal10010094 (2020).
- (37) Zheng, B., et al. Vertically oriented few-layered HfS2 nanosheets: Growth mechanism and optical properties. 2D Mater. 3, 035024 (2016).
- (38) Lei, C., et al. Broken-gap type-III band alignment in WTe2/HfS2 van der Waals heterostructure. J. Phys. Chem. C 123, 23089–23095 (2019).
- (39) Kresse, G. & Joubert, D. From ultrasoft pseudopotentials to the projector augmented-wave method. Phys. Rev. B 59, 1758–1775 (1999).
- (40) Ghosez, P., Michenaud, J.-P., & Gonze, X. The physics of dynamical atomic charges: the case of ABO3 compounds. Phys. Rev. B 58, 6224–6240 (1998).
- (41) Baroni, S., De Gironcoli, S., Dal Corso, A., & Giannozzi, P. Phonons and related crystal properties from density-functional perturbation theory. Rev. Mod. Phys. 73, 515–562 (2001).
- (42) Cingolani, A., Lugará, M., Scamarcio, G., & Lévy, F. The Raman scattering in hafnium disulfide. Solid State Commun. 62, 121–123 (1987).
- (43) Wooten, F. Optical properties of solids (Academic Press, 1972).
- (44) Sun, Q. C., et al. Spectroscopic determination of phonon lifetimes in rhenium-doped MoS2 nanoparticles. Nano Lett. 13, 2803–2808 (2013).
- (45) Letcher, J., Kang, K., Cahill, D. G., & Diott, D. D. Effects of high carrier densities on phonon and carrier lifetimes in Si by time-resolved anti-Stokes Raman scattering. Appl. Phys. Lett. 90, 252104 (2007).
- (46) Sun, Q. C., Xu, X., Vergara, L. I., Rosentsveig, R., & Musfeldt, J. L. Dynamical charge and structural starin in inorganic fullerenelike MoS2 nanoparticles. Phys. Rev. B 79, 205405 (2009).
- (47) Wieting, T. J. & Verble, J. L. Infrared and Raman studies of long-wavelength optical phonons in hexagonal MoS2. Phys. Rev. B 3, 4286–4292 (1971).
- (48) Carr, G. L., Perkowitz, S., & Tanner, D. B. Infrared and millimeter waves, vol. 13 (Academic Press, 1985).
- (49) Kittel, C. Introduction to Solid State Physics. 8th ed. (Wiley, 2004).
- (50) Sun, Q. C., Xu, X., Baker, S. N., Christianson, A. D., & Musfeldt, J. L. Experimental determination of ionicity in MnO nanoparticles. Chem. Mater. 23, 2956–2960 (2011).
- (51) Ashcroft, N. W. & Mermin, D. Solid State Physics (Thomson Learning, 1976).
- (52) Ghosez, P. & Gonze, X. Band-by-band decompositions of the born effective charges. J. Condens. Matter Phys. 12, 9179–9188 (2000).
- (53) Pike, N. A., et al. Origin of the counterintuitive dynamic charge in the transition metal dichalcogenides. Phys. Rev. B 95, 201106 (2017).
- (54) Blöchl, P. E. Projector augmented-wave method. Phys. Rev. B 50, 17953 (1994).
- (55) Kresse, G. & Furthmüller, J. Efficient iterative schemes for ab initio total-energy calculations using plane-wave basis set. Phys. Rev. B 54, 11169–11186 (1996).
- (56) Nunes, R. W. & Gonze, X. Berry-phase treatment of the homogeneous electric field perturbation in insulators. Phys. Rev. B 63, 155107 (2001).
- (57) Souza, I., Íñiguez, J., & Vanderbilt, D. First-principles approach to insulators in finite electric fields. Phys. Rev. Lett. 89, 117602 (2002).
- (58) Baroni, S., Giannozzi, P., & Testa, A. Green’s-function approach to linear response in solids. Phys. Rev. Lett. 58, 1861–1864 (1987).
- (59) Csonka, G. I., et al. Assessing the performance of recent density functionals for bulk solids. Phys. Rev. B 79, 155107 (2009).
- (60) Sun, J., et al. Self-consistent meta-generalized gradient approximation within the projector-augmented-wave method. Phys. Rev. B 84, 035117 (2011).
- (61) Heyd, J., Scuseria, G. E., & Ernzerhof, M. Hybrid functionals based on a screened coulomb potential. J. Chem. Phys. 118, 8207–8215 (2003).
- (62) Greenaway, D. L. & Nitsche, R. Preparation and optical properties of group IV–VI2 chalcogenides having the CdI2 structure. J. Phys. Chem. Solids 26, 1445–1458 (1965).
- (63) Yagmurcukardes, M., Ozen, S., Iyikanat, F., Peeters, F. M., & Sahin, H. Raman fingerprint of stacking order in HfS2- Ca(OH)2 heterobilayer. Phys. Rev. B 99, 205405 (2019).
- (64) Marzari, N. & Vanderbilt, D. Maximally localized generalized Wannier functions for composite energy bands. Phys. Rev. B 56, 12847–12865 (1997).
- (65) Marzari, N., Fe, P., Yates, J. R., & Vanderbilt, D. Maximally localized Wannier functions : Theory and applications. Rev. Mod. Phys. 84, 1419–1475 (2012).
- (66) Mostofi, A. A., et al. An updated version of wannier90: A tool for obtaining maximally-localised wannier functions. Comput. Phys. Commun. 185, 2309 – 2310 (2014).
Supplementary Information for “Chemical bonding and Born charge in 1T-HfS2”
S. N. Neal
S. Li
T. Birol
Janice L. Musfeldt
S0 Supplementary discussion
Supplementary Fig. 1 displays a close-up view of both the infrared (a) and Raman (b) spectra for 1-HfS2. Notice, the peak position of the infrared-active mode around 155 cm-1 remains consistent in both shape, width, and peak position from 300 K to 8 K [Supplementary Fig. 1(a)]. The symmetric nature of the large phonon points to a homogeneous system, and therefore a high quality crystal. Supplementary Fig. 1(b) shows the slight red shift ( 1 cm-1) of the mode around 340 cm-1 as temperature decreases from 300 K to 8 K. The other Raman-active features shown ( and ) also show a slight redshift to base temperature, with the peaks sharpening at the lowest temperatures.
Supplementary Table 1 displays the FWHM values, as well as the calculated phonon lifetime values of 1T-HfS2 (8-300 K) for both fundamental Raman-active phonons (, ) discussed in the text. Recall that phonon lifetime is calculated as , where is the full width at half maximum and is the reduced Planck’s constant Wooten1972 . Supplementary Fig. 2 shows a general schematic detailing the relationship between FWHM (), frequency (), and phonon lifetime ().
| Eg | A1g | |||
|---|---|---|---|---|
| Temperature (K) | FWHM () (cm-1) | Lifetime () (ps) | FWHM () (cm-1) | Lifetime () (ps) |
| 8 | 260.90, 262.68 | 2.98 | 334.20, 337.64 | 1.54 |
| 25 | 260.74, 262.92 | 2.44 | 333.96, 338.10 | 1.28 |
| 50 | 259.55, 264.29 | 1.12 | 334.33, 338.47 | 1.28 |
| 100 | 259.17, 265.37 | 0.86 | 334.35, 338.98 | 1.15 |
| 150 | 258.58, 266.39 | 0.68 | 334.58, 339.82 | 1.01 |
| 200 | 256.08, 266.37 | 0.52 | 333.44, 341.02 | 0.70 |
| 250 | 255.17, 266.19 | 0.48 | 333.42, 341.10 | 0.69 |
| 300 | 252.48, 266.46 | 0.38 | 333.37, 341.77 | 0.63 |
S2 Supplementary methods
Supplementary Table 2 lists the first-principles calculation results for the dielectric properties of 1T-HfS2 obtained via methods outlined in the main text. By comparing the first 3 columns and second 3 columns, we can see that for the same functional and structures, the dielectric constant and Born effective charges are barely influenced by the method employed to calculate the response to external electrical field. More importantly, although the interlayer interactions are hard to reproduce accurately from first-principles due to issues with the van der Waals interaction, the DFT-relaxed structure does not affect the Born charge or susceptibility results significantly. The effect of spin-orbit coupling is also small enough to be neglected, except on the bandgap.
Despite the similarities in the results for PBEsol, the hybrid functional HSE06 gives out a very different prediction of band gap which is much closer to the experimental one. The dielectric constant from HSE is also very different from the other ones, likely due to the larger bandgap.
| PBEsol | PBEsol (structure relaxed) | PBEsol (with spin-orbital coupling | PBEsol | PBEsol (structure relaxed) | PBEsol (with SOC and structure relaxed) | meta-GGA | DFT-D3 | HSE06 | |
| Method | Density functional perturbation theory (DFPT) | DFPT | DFPT | Finite electric field(FE) | FE | FE | FE | FE | FE |
| Band gap (eV) | 0.95 | 0.95 | 1.59 | 0.95 | 0.95 | 1.53 | 1.05 | 0.95 | 2.05 |
| 10.67 | 10.91 | 10.83 | 10.53 | 10.90 | 11.07 | 9.94 | 10.54 | 8.09 | |
| 5.38 | 5.35 | 5.40 | 5.37 | 5.35 | 5.38 | 5.16 | 5.38 | 4.61 | |
| 6.79 | 6.82 | 6.85 | 6.77 | 6.82 | 6.87 | 6.71 | 6.77 | 6.38 | |
| 1.88 | 1.87 | 1.89 | 1.88 | 1.87 | 1.87 | 1.92 | 1.88 | 1.96 |
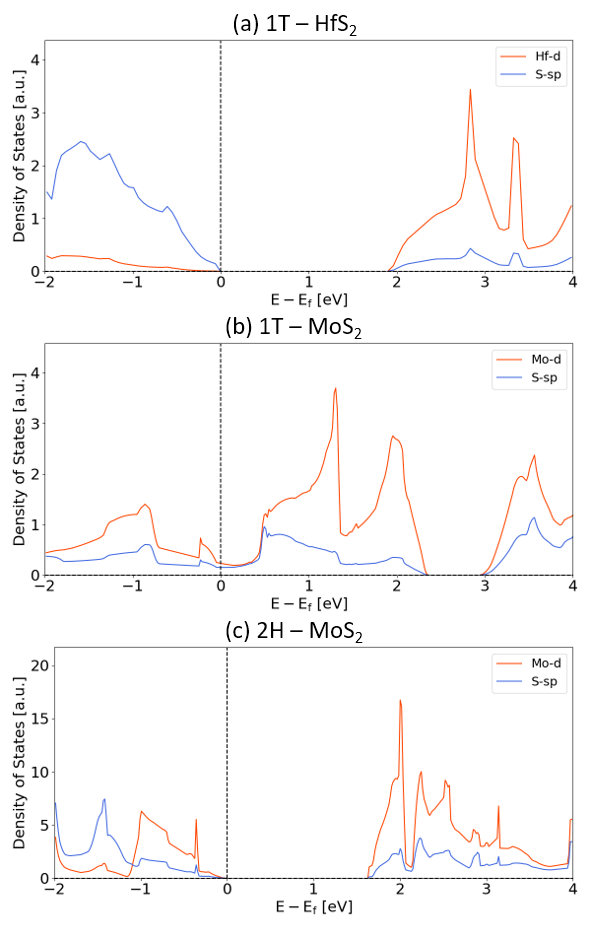
The projected density states of HfS2 is very different from that of MoS2, because MoS2 has a partially-filled Mo-4 orbital. In both 1T-MoS2 [metallic, Supplementary Fig. 3(b)] and 2H-MoS2 [insulating, Supplementary Fig. 3(c)], bands near the Fermi level consist mostly of cation states. The mixing of both the valence and conduction band Mo- states with S- orbitals is nevertheless significant. This is unlike HfS2 [Supplementary Fig. 3(a)], where the valence band is mostly of S character, and mixing between Hf and S states is smaller.
The experimentally determined space group of HfS2 is (#164), which is in the trigonal crystal system. There are 2 phonon modes in total, of which one is optical and the other one is acoustic. The optical mode is split into two due to the LO-TO splitting. The form of the dynamical matrix eigenvectors for both the acoustic and the optical mode is set by symmetry to be:
| (S10) |
such that and denote acoustic and optical modes, respectively. Figure S4 shows a schematic of the optical mode. Normalizing the eigenvectors gives:
| (S11) |
Writing the dynamical matrix on the basis of the two components of the mode results in a diagonal matrix with the dynamical matrix eigenvalues on the diagonals. This is the analytical contribution to the dynamical matrix, which gives the TO frequencies. In order to obtain the LO frequencies one needs to add the so-called nonanalytical contribution to the dynamical matrix as well baroni2001phonons :
| (S12) |
where the are atomic indices and are directional indices. Here, Gaussian units are used. The limit is taken as the wavevector approaches zero from the direction of the polarization induced by the LO mode. The splitting between the transverse and longitudinal modes along a crystal axis, for example the [100] direction, can be evaluated in terms of the normalized dynamical matrix eigenvectors as
| (S13) |
Here is the polarization induced by a unit displacement by the dynamical matrix eigenvalue . In this sense it is like a mode effective charge, however due to normalization of the dynamical matrix eigenvector (not the displacement) it has different units than :
| (S14) |
where is the component of the dynamical matrix eigenvector. In this case, the eigenvector is the normalized one for the mode, which is shown in the first row of Equation S10.
In the specific (diatomic) case of HFS2, we have , thus the effective mode would be:
| (S15) | ||||
Here the is the effective mass, which has the relationship:
| (S16) |
which gives for 1T-HfS2.
In the end, the Born effective charge can be simplified using this effective mass from Equation S13:
| (S17) |
HfS2 is an ionic crystal with a relatively simple band structure: the conduction band is mainly of Hf- character, and the valence band is mainly of S- character. This simplifies the Wannierization process as the bands of interest are not entangled with each other. As shown in Supplementary Fig. 5, the band structure reconstructed from the Wannier based tight binding model matches with the DFT one perfectly (except at very high energies).
In the main text, only one S- orbital (oriented along the z-direction) is shown. The other two S- orbitals are similar to the orbital in the sense that they also hybridize with the nearest neighbor Hf cation [Supplementary Fig. 6]. The 3 other - orbitals centered on the other S anion are not shown here, since they are symmetry equivalent to those in Supplementary Fig. 6.
References
- (1) Wooten, F. Optical properties of solids (Academic Press, 1972).
- (2) Baroni, S., De Gironcoli, S., Dal Corso, A., and Giannozzi, P. Phonons and related crystal properties from density-functional perturbation theory. Rev. Mod. Phys. 73, 515-562 (2001).