Bench-top Cooling of a Microwave Mode using an Optically Pumped Spin Refrigerator
Abstract
We experimentally demonstrate the temporary removal of thermal photons from a microwave mode at 1.45 GHz through its interaction with the spin-polarized triplet states of photo-excited pentacene molecules doped within a p-terphenyl crystal at room temperature. The crystal functions electromagnetically as a narrow-band cryogenic load, removing photons from the otherwise room-temperature mode via stimulated absorption. The noise temperature of the microwave mode dropped to K (as directly inferred by noise-power measurements) while the metal walls of the cavity enclosing the mode remained at room temperature. Simulations based on the same system’s behavior as a maser (which could be characterized more accurately) indicate the possibility of the mode’s temperature sinking to 10 K (corresponding to 140 microwave photons).These observations, when combined with engineering improvements to deepen the cooling, identify the system as a narrow-band yet extremely convenient platform —free of cryogenics, vacuum chambers and strong magnets— for realizing low-noise detectors, quantum memory and quantum-enhanced machines (such as heat engines) based on strong spin-photon coupling and entanglement at microwave frequencies.
On a warm planet, electromagnetic noise associated with thermal (black–body) radiation is the ubiquitous bugbear of quantum measurements[1] –especially at microwave frequencies, where a quantum of energy pales in comparison with . In a single electromagnetic mode of frequency , the mean occupation number of thermal photons is , equating to 6,200 for a microwave mode at 1 GHz at room temperature. These photons show up as noise on any signal extracted from the mode via a coupler and can limit the speed at which an EPR/NMR spectrum or MRI scan is taken. It is thus extremely challenging to attain the single-photon limit at microwave (or lower) frequencies with sources[2, 3, 4], sensors[5, 6] and/or detectors[7, 8] as is necessary to implement quantum Hanbury-Brown & Twiss interferometry[9, 10] or other more complex protocols exploiting entanglement.
The most familiar way of removing thermal photons and their associated noise is to cool the microwave circuitry down to cryogenic temperatures by housing it inside a dilution refrigerator. Such refrigerators are however bulky, mechanically fragile, and energy-guzzling (dissipating typically kilowatts during operation); these attributes alas exclude many applications. The alternative pursued here is similar to the use, in radiometry, of a cryogenic load connected (to the rest of the microwave circuitry) through a low-loss waveguide[11]. Albeit only possible over a narrow band of frequencies, the cryogenic load is here replaced by a room-temperature yet “spin-cold” quantum system capable of absorbing photons through stimulated absorption[2]. Mode-cooling is only achieved within the linewidth of the exploited quantum transition, but this cooling still enables useful applications. Our method, which exploits a cavity of high magnetic Purcell factor[12], is thus similar in spirit to recent, cryogenic implementations of radiative cooling [13, 14], but where the cold reservoir is a spin-bath.
Several decades ago, it was demonstrated how Rydberg atoms could remove thermal photons from millimeter-wave cavities (operating at 100 GHz or higher) via stimulated absorption [15, 16, 17, 18, 19, 20, 21]. The vacuum equipment needed to do this was still quite bulky, however. Compared to our work at 1.45 GHz presented here, the cavity modes cooled enjoyed a “head-start” by containing far fewer thermal photons ( at room temperature[20]) in the first place.
In this letter, we demonstrate a compact refrigerator capable of operating at room temperature and pressure in zero applied magnetic field (“ZF”). It exploits pentacene molecules doped within a crystal of p-terphenyl that are spin-polarized through photo-excitation. The crystal with a doping concentration of 0.1% is placed in the bore of a dielectric ring made of crystalline strontium titanate [“STO”, see Fig. 1(c)] housed within a cylindrical copper enclosure. The ring + enclosure support a compact TE01δ microwave cavity mode whose lines of a.c. magnetic flux density penetrate the crystal [see Fig. 1(b)], enabling effective photon spin coupling between the microwave mode and the pentacene molecules.
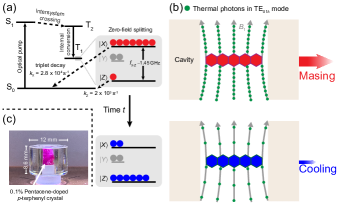
The lowest photo-excited triplet state of pentacene in p-terphenyl has been extensively investigated for its use in dynamic nuclear polarization (triplet-DNP)[22], room-temperature masers[23, 12, 24, 25, 26], quantum memory [27] and photovoltaics[28]. These previous studies have focused on pentacene’s spin-polarization immediately after photo-excitation. We instead exploit its opposite polarization at later times for the express purpose of mode-cooling. Fig. 1(a) shows how the triplet state is generated: a pentacene molecule is first excited from its singlet ground state (S0) to its first excited singlet state (S1). Then, through intersystem crossing (ISC), it transfers to its first-excited triplet state (T[29], and thereupon undergoes rapid internal conversion down to the lowest triplet state (T1) while preserving its ISC-acquired spin polarization. In zero applied magnetic field, T1 comprises three separated sub-levels: , and , with initial populations 0.76 : 0.16 : 0.08[30]. Initially, due to sizable population inversion between the and sub-levels, thermal photons already occupying the cavity mode are multiplied up through stimulated emission across the X-Z transition, resulting in maser oscillation [see the upper half of Fig. 1(b)]. Because the decay rate of ( s-1) is considerably slower than that of ( s-1) and the spin-lattice relaxation between them is slow compared to these rates[31], the sub-level becomes, after masing has ceased, significantly over-populated relative to ; see the bottom of Fig. 1(a). An extremely spin-cold two-level system across is thus temporarily formed. As shown conceptually in the lower half of Fig. 1(b), this system will act to attenuate (i.e. remove photons from) the electromagnetic mode through stimulated absorption. Mimicking Gordon and Townes’ original acronym, we refer to this refrigeration process as “masar" cooling.
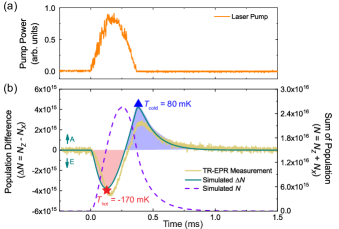
To verify the concept, we first quantified the achievable spin temperature, , of the system using zero-field time-resolved electron paramagnetic resonance (TR-EPR) performed at room temperature, with the pentacene-doped p-terphenyl crystal pumped by a long-pulse dye laser. Details of this technique and how our crystal was grown have been reported elsewhere[31]. Here, the spin temperature is determined by the relative instantaneous populations of the and sub-levels [2]:
| (1) |
where 1.4495 GHz is the frequency of the X-Z transition (at ZF), the population difference , and the total population .
Fig. 2(a) displays the time profile of a typical 590-nm pump pulse, with the dye laser set to a low output such that no masing occurs; it lasts 300 s and integrates to 250 mJ in energy. As displayed in Fig. 2(b), the measured signal, proportional to , is strongly emissive for the first 250 s but then becomes strongly absorptive for the next 500 s.This dramatic cross-over behavior, as was remarked upon almost four decades ago[30], is well fitted by the model reported in ref. 31. Using it, the time profile of can be accurately simulated, as shown in Fig. 2(b). By substituting the simulated values of and into Eq. (1), one calculates that the maximum excursions of the polarization in the emissive and absorptive epochs correspond to Boltzmann-equivalent spin temperatures of -170 mK (red star) and 80 mK (blue triangle), respectively.
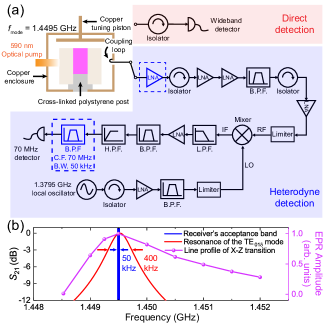
We have probed the extent to which the coldness of the X-Z transition can, in practice, be transferred to a target microwave mode by measuring the instantaneous power extracted from the mode by a metal loop threaded by a small fraction of the mode’s a.c. magnetic flux. The power so extracted from this coupling “port” is to first approximation proportional to the number of photons occupying the mode. The port’s reflection coefficient, , was adjusted (by changing the loop size) to zero (critical coupling) in the absence of pumping. Our exact experimental set-up, incorporating a high-gain heterodyne receiver, is shown in Fig. 1(c) and Fig. 3; our Supplementary Material provides additional technical details covering how the noise flow is modeled and calibrated[32]. At , the TE01δ mode of our STO-loaded cavity had a measured linewidth at critical coupling of 400 kHz, inside of which the receiver’s own measurement bandwidth of 50 kHz lay (see Fig. 3b).
Our principal results are shown in Fig. 4. The baseline at 0 dB in Fig. 4(a) includes both amplified noise received from the non-pumped cavity and the heterodyne receiver’s self-generated noise. Excursions in the cavity’s output power above this level reflect masing action; though note that, in Fig. 4(a), the peaks of the blue trace are compressed due to saturation of the later-stage amplifiers (and a protective diode limiter) in the heterodyne receiver. Dips below it arise from noise-power reduction of the microwave mode, reflecting masar cooling. Here, it is crucial to avoid mistaking the fool’s gold of a “deep fade” (which will spontaneously occur at random times when observing narrow-band noise) from genuine cause-and-effect cooling. We suppress deep fades by averaging the recorded instantaneous power over 11 separate (statistically independent) measurements performed in quick succession; the resultant average, shown in dark blue in Fig. 4(a) more faithfully indicates the cooling response.
Fig. 4(a) displays that, during masing, deep notches in the out-coupled power are detected by the heterodyne receiver. We interpret them not as cooling but instead as being caused by collective coupling between the polarized pentacene spins (regarding the X-Z transition as a two-level system) and the TE01δ mode’s microwave photons, causing the mode to split[27]. Temporarily, this splitting in frequency space is sufficient for the two arms of the spin-photon polariton to straddle the receiver’s channel bandwidth (50 kHz), rendering them silent. Confronted by this phenomenon, the limited dynamical range (80 dB) and bandwidth of our receiver drove us to measure the out-coupled power directly with a separate wide-bandwidth log detector, shown in Fig. 3; this allowed the TE01δ mode’s energy to be monitored accurately during periods of strong maser bursts; traces from this detector are shown in Fig. 4(d) and (e). The discernible Rabi oscillations in the three bursts have time-dependent frequencies ranging from to 500 kHz because the number of pentacene spins available to interact with the microwave photons varies in response to the optical pump’s time profile convolved with pentacene’s own spin dynamics (see Supplementary Material for details[32]). Oscillations faster than 500 kHz in the maser burst “I” are not resolved due to coarse sampling (owing to the limited memory depth of the oscilloscope used). Nevertheless, these traces show that the splitting of the TE01δ mode can certainly exceed 100 kHz, beyond the 50-kHz bandwidth of our heterodyne receiver’s band-pass filter.
Cooling of the microwave mode is demonstrated by the received noise power dipping below its ambient (room-temperature) level after each maser burst, i.e. the cooling epochs A to C shown in Fig. 4(a). The maximum reduction in noise power was found to be dB by fitting and we here invoke a noise model based on the “wave approach”[2, 33]; see Supplementary Material for the error and noise analysis[32]. Through this model, the relation between the mode’s noise temperature (thus average photon population), , and the reduction in noise power measured at the heterodyne receiver’s output, , can be accurately calibrated; the curve is drawn in Fig. 4(c). As shown in Fig. 4(a), the maximum reduction in noise power observed (occurring after the first maser burst) indicates that drops from room temperature K to K. This degree of cooling comes close to the limits of our instrumentation: due primarily to the input noise of the heterodyne receiver’s first LNA , a dip in the noise power corresponding to K cannot be discerned above the receiver’s noise floor at dB.
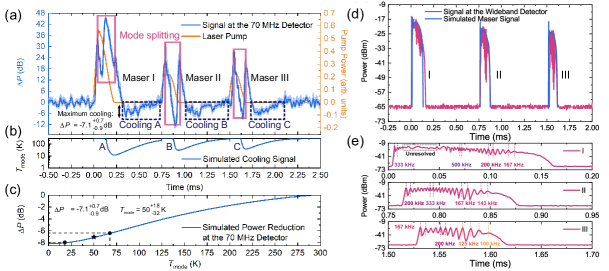
The evolution of can also be estimated, via modeling, from the instantaneous out-coupled power as measured by the wideband detector [top of Fig. 3(a)], whose signal faithfully reflects the number of photons as a function of time , in the cavity during each maser burst [see Fig. 4(d)]. We point out that, similar to the heterodyne detection of extremely weak maser bursts from Rydberg atoms[34], the measured maser signals [shown in Fig. 4(a)] from our receiver suffer both temporal delay and spread on account of its narrowest band-pass (SAW) filter. The actual duration of the maser bursts is indicated in Fig. 4(d) and (e) where the longest burst lasts about 160 s. The required modeling involves solving semi-classical rate equations; see Supplementary Material[32]. This approach cannot simulate the Rabi oscillations observed experimentally during epochs of masing, but can accurately predict the power envelop of each maser burst [see Fig. 4(d)]. Using the same values of fitted parameters, the same model can be used to predict the population dynamics and hence during each cooling epoch [see Fig. 4(b)]. To accomplish this, the relationships and [27] are used; is the out-coupled maser power shown in Fig. 4(d), MHz is the cavity decay rate (corresponding to the cavity decay time 400 ns) and is the coupling coefficient of the cavity.
Fig. 4(b) implies the cooling effect occurs almost immediately after the cessation of maser oscillation, when becomes over-populated and the rate of stimulated absorption from to exceeds the rates of cavity decay (i.e. the rate of thermal photons filling in the cavity) and spin-lattice relaxation. The duration of cooling (625 s) is limited by the need to satisfy , which is controlled by the lifetime of (500 s) relative to that of , the former being one order of magnitude longer[31]. The depth of the cooling depends on the rate of stimulated absorption, which is proportional to the population difference (equal to ) between and , and follows its own time evolution; see Supplementary Material[32]. According to the simulation, the lowest reached was around 10 K, corresponding to photons in the microwave mode. This is close to the 95% lower confidence limit of (i.e. K) inferred from our calibration curve relating to .
In conclusion, our work demonstrates that the photo-excited triplet state of pentacene doped in p-terphenyl can be exploited to realize a spin refrigerator that cools, by the stimulated absorption of thermal photons, an electromagnetic mode of a microwave cavity from room temperature down to a few tens of kelvin (if not lower). The cooling performance can certainly be improved upon through engineering, e.g. increasing the crystal’s magnetic filling factor, and through material science, i.e. identifying (then growing) crystals exhibiting greater absorptive spin polarization. The approach reported here opens up a new bench-top, room-temperature route to investigating quantum entanglement[35] and to the realization of quantum heat engines[36, 37]. A cold cavity mode so-prepared could be exploited to boost measurement sensitivity in (pulsed) EPR/NMR experiments[38], radiatively cool a secondary system[13, 14], or to reduce errors in quantum gate operations[39].
Acknowledgements.
We thank Ben Gaskell of Gaskell Quartz Ltd (London) for making the strontium titanate ring used. This worked was supported by the U.K. Engineering and Physical Sciences Research Council through grants EP/K037390/1 and EP/M020398/1. H.W. acknowledges financial support from China Scholarship Council (CSC) and Imperial College London for a CSC-Imperial PhD scholarship.References
- Shih [2011] Y. Shih, An Introduction to Quantum Optics: Photon and Biphoton Physics (CRC Press, 2011).
- Siegman [1964] A. E. Siegman, Microwave Solid-State Masers (McGraw-Hill, 1964).
- Benmessai et al. [2008] K. Benmessai, D. L. Creedon, M. E. Tobar, P.-Y. Bourgeois, Y. Kersalé, and V. Giordano, Phys. Rev. Lett. 100, 233901 (2008).
- Gordon et al. [1955] J. P. Gordon, H. J. Zeiger, and C. H. Townes, Phys. Rev. 99, 1264 (1955).
- Meystre [2013] P. Meystre, Ann. Phys. 525, 215 (2013).
- Cox et al. [2018] K. C. Cox, D. H. Meyer, F. K. Fatemi, and P. D. Kunz, Phys. Rev. Lett. 121, 110502 (2018).
- Inomata et al. [2016] K. Inomata, Z. Lin, K. Koshino, W. D. Oliver, J.-S. Tsai, T. Yamamoto, and Y. Nakamura, Nat. Commun. 7, 12303 (2016).
- Wrachtrup and Finkler [2016] J. Wrachtrup and A. Finkler, J. Magn. Reson. 269, 225 (2016).
- Hanbury-Brown and Twiss [1956] R. Hanbury-Brown and R. Q. Twiss, Nature (London) 177, 27 (1956).
- Knill et al. [2001] E. Knill, R. Laflamme, and G. Milburn, Nature 409, 46 (2001).
- Gervasi et al. [1995] M. Gervasi, G. Bonelli, G. Sironi, C. F., A. Passerini, and S. Casani, Rev. Sci. Instr. 66, 4798 (1995).
- Breeze et al. [2015] J. D. Breeze, K.-J. Tan, B. Richards, J. Sathian, M. Oxborrow, and N. M. Alford, Nat. Commun. 6, 6215 (2015).
- Albanese et al. [2020] B. Albanese, S. Probst, V. Ranjan, C. W. Zollitsch, M. Pechal, A. Wallraff, J. J. Morton, D. Vion, D. Esteve, E. Flurin, et al., Nat. Phys. 16, 751 (2020).
- Xu et al. [2020] M. Xu, X. Han, C.-L. Zou, W. Fu, Y. Xu, C. Zhong, L. Jiang, and H. X. Tang, Phys. Rev. Lett. 124, 033602 (2020).
- Gallagher and Cooke [1979] T. Gallagher and W. Cooke, Phys. Rev. Lett. 42, 835 (1979).
- Figger et al. [1980] H. Figger, G. Leuchs, R. Straubinger, and H. Walther, Opt. Commun. 33, 37 (1980).
- Beiting et al. [1979] E. Beiting, G. Hildebrandt, F. Kellert, G. Foltz, K. Smith, F. Dunning, and R. Stebbings, J. Chem. Phys. 70, 3551 (1979).
- Koch et al. [1980] P. Koch, H. Hieronymus, A. Van Raan, and W. Raith, Phys. Lett. A 75, 273 (1980).
- Spencer et al. [1982] W. P. Spencer, A. G. Vaidyanathan, D. Kleppner, and T. W. Ducas, Phys. Rev. A 25, 380 (1982).
- Raimond et al. [1982] J. Raimond, P. Goy, M. Gross, C. Fabre, and S. Haroche, Phys. Rev. Lett. 49, 117 (1982).
- Haroche and Raimond [1985] S. Haroche and J. Raimond, Adv. At. Mol. Phys. 20, 347 (1985).
- Iinuma et al. [2000] M. Iinuma, Y. Takahashi, I. Shaké, M. Oda, A. Masaike, T. Yabuzaki, and H. M. Shimizu, Phys. Rev. Lett. 84, 171 (2000).
- Oxborrow et al. [2012] M. Oxborrow, J. D. Breeze, and N. M. Alford, Nature (London) 488, 353 (2012).
- Salvadori et al. [2017] E. Salvadori, J. D. Breeze, K.-J. Tan, J. Sathian, B. Richards, M. W. Fung, G. Wolfowicz, M. Oxborrow, N. M. Alford, and C. W. Kay, Sci. Rep. 7, 1 (2017).
- Wu et al. [2020a] H. Wu, S. Mirkhanov, W. Ng, K.-C. Chen, Y. Xiong, and M. Oxborrow, Opt. Express 28, 29691 (2020a).
- Wu et al. [2020b] H. Wu, X. Xie, W. Ng, S. Mehanna, Y. Li, M. Attwood, and M. Oxborrow, Phys. Rev. Appl. 14, 064017 (2020b).
- Breeze et al. [2017] J. D. Breeze, E. Salvadori, J. Sathian, N. M. Alford, and C. W. Kay, npj Quantum Inf. 3, 40 (2017).
- Lubert-Perquel et al. [2018] D. Lubert-Perquel, E. Salvadori, M. Dyson, P. N. Stavrinou, R. Montis, H. Nagashima, Y. Kobori, S. Heutz, and C. W. Kay, Nat. Commun. 9, 4222 (2018).
- Bogatko et al. [2016] S. Bogatko, P. D. Haynes, J. Sathian, J. Wade, J.-S. Kim, K.-J. Tan, J. D. Breeze, E. Salvadori, A. Horsfield, and M. Oxborrow, J. Phys. Chem. C 120, 8251 (2016).
- Sloop et al. [1981] D. J. Sloop, H.-L. Yu, T.-S. Lin, and S. Weissman, J. Chem. Phys. 75, 3746 (1981).
- Wu et al. [2019] H. Wu, W. Ng, S. Mirkhanov, A. Amirzhan, S. Nitnara, and M. Oxborrow, J. Phys. Chem. C 123, 24275 (2019).
- [32] See Supplementary Material at [url] for details of experimental method, model of pentacene’s spin dynamics and noise analysis, which includes Refs. [40, 26, 34, 41, 42, 43, 30, 31, 44, 45, 2, 24, 46, 47, 33, 48, 49, 50], .
- Đorđević et al. [2017] V. Đorđević, Z. Marinković, G. Crupi, O. Pronić-Rančić, V. Marković, and A. Caddemi, Int. J. Numer. Model. 30, e2138 (2017).
- Moi et al. [1980] L. Moi, C. Fabre, P. Goy, M. Gross, S. Haroche, P. Encrenaz, G. Beaudin, and B. Lazareff, Opt. Commun. 33, 47 (1980).
- Haroche and Raimond [2006] S. Haroche and J.-M. Raimond, Exploring the Quantum: Atoms, Cavities, and Photons (Oxford University Press, 2006).
- Scovil and Schulz-DuBois [1959] H. E. Scovil and E. O. Schulz-DuBois, Phys. Rev. Lett. 2, 262 (1959).
- Klatzow et al. [2019] J. Klatzow, J. N. Becker, P. M. Ledingham, C. Weinzetl, K. T. Kaczmarek, D. J. Saunders, J. Nunn, I. A. Walmsley, R. Uzdin, and E. Poem, Phys. Rev. Lett. 122, 110601 (2019).
- Mollier et al. [1973] J. C. Mollier, J. Hardin, and J. Uebersfeld, Rev. Sci. Instrum. 44, 1763 (1973).
- Henschel et al. [2010] K. Henschel, J. Majer, J. Schmiedmayer, and H. Ritsch, Phys. Rev. A 82, 033810 (2010).
- Oxborrow [2007] M. Oxborrow, IEEE Trans. Micro. 55, 1209 (2007).
- Pollnau et al. [1994] M. Pollnau, T. Graf, J. Balmer, W. Lüthy, and H. Weber, Phys. Rev. A 49, 3990 (1994).
- Patterson et al. [1984] F. G. Patterson, H. W. H. Lee, W. L. Wilson, and M. D. Fayer, Chem. Phys. 84, 51 (1984).
- Takeda et al. [2002] K. Takeda, K. Takegoshi, and T. Terao, J. Chem. Phys. 117, 4940 (2002).
- Nelson et al. [1981] K. A. Nelson, D. Lutz, M. Fayer, and L. Madison, Phys. Rev. B 24, 3261 (1981).
- Deeg et al. [1985] F. W. Deeg, L. Madison, and M. Fayer, Chem. Phys. 94, 265 (1985).
- Yang et al. [2000] T.-C. Yang, D. J. Sloop, S. Weissman, and T.-S. Lin, J. Chem. Phys. 113, 11194 (2000).
- Penfield [1962] P. Penfield, IRE Trans. Circuit Theory March, 84 (1962).
- [48] PMA2-33LN+ datasheet and .s2p file, Mini-Circuits (2019).
- Kraus [1986] J. D. Kraus, Radio astronomy (Cygnus-Quasar Books, Powell, OH, 1986).
- Oxborrow [2017] M. Oxborrow, Maser assembly (2017), US Patent 9,608,396.