An issue of determination of the centrality in nucleus-nucleus collisions
Abstract
The accuracy of measuring the total energy of the spectators in the FHCal calorimeter, depending on the fluctuations in the number of nucleons and the hadron shower is obtained. It is shown that, from the point of view of statistics, the process of registering photoelectrons in a photomultiplier (PM) is similar to the process of registering spectator nucleons in a calorimeter. The measurements of single photoelectrons in the PM are in good agreement with the obtained formula for the relative variance of the charge detected by the PM.
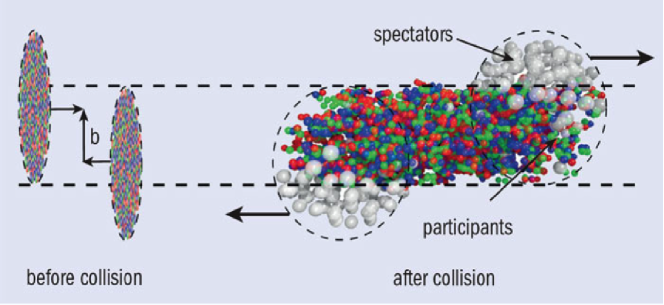
The purpose of this work is to evaluate the accuracy of determining the centrality by measurement of the total energy E of spectator nucleons in the FHCal calorimeter, taking into account fluctuations of the number of spectator nucleons and fluctuations of energy release during registration of a hadron shower in a calorimeter. Nucleus-nucleus collision calorimeter registers in each event simultaneously a different number of spectator nucleons (see Fig. 1). In this case, the kinetic energy of nucleons with good accuracy is equal to beam energy. Such conditions cannot be created for carrying out calibration measurements of the FHCal calorimeter, close to the experiment. From the point of view of statistics, there is a process similar to the process of registering spectator nucleons in a calorimeter, this is the process of registering photoelectrons in a photomultiplier (PM). Calibration measurements are possible for this process. A short flash of light with a duration of 50 ns leads to the instantaneous birth of a different number of photoelectrons on the photocathode of the PM, in each event. In this case, each photoelectron forms an independent avalanche process in the dinode system of the PM, similar to the formation of showers in the FHCal calorimeter. Paper [1] gives an estimate of the accuracy of determining the centrality parameter by measurement of the total energy E of spectator nucleons in the FHCal calorimeter.
The total energy release E in the calorimeter is expressed as the sum of the random energy releases of the spectator nucleons in the calorimeter . This process is stochastic, in which the same energy release can be obtained for a different number of spectator nucleons. The total energy release E in the calorimeter can be represented as the product of two random variables and - the sample average energy release, in the form:
| (1) |
The relative error of the values and , depending on two (u, v) independent random variables, can be expressed as [2]:
| (2) |
In our case, the relative error is expressed as follows:
| (3) |
Relative variance of the sample average energy release decreases with increasing compared to the relative variance of a single shower as follows [2]:
| (4) |
The error is determined by the Poisson statistics and is equal to . Relative error of measurement of the nucleon energy in the FHCal calorimeter [1] is , where the value a = 0.56. As a result, the expression for the relative error , can be written as follows:
| (5) |
In the experiment, it is necessary to determine the number of spectator nucleons in each event. The total energy release in the calorimeter can, in the first approximation, be expressed in terms of the estimated number of spectator nucleons in the form , given that the kinetic energy of the nucleons with good accuracy is of the beam energy. Then the relative variance of the number of spectator nucleons can be expressed in terms of the total energy and the sample average energy release of the nucleon in the calorimeter based on the following expression:
| (6) |
In our case, the relative error is expressed similarly to (2) as follows:
| (7) |
As a result, the expression for the relative error , given the expression (4), can be written as follows:
| (8) |
In work [3] for the relative variance of the total energy E and the number of spectator nucleons, the following expressions are obtained:
| (9) |
The unexpected conclusion follows from this formula that for large , large energy release in the calorimeter, relative measurement errors and do not depend on the estimated and are determined by the relative error of measuring the energy of a single nucleon.
This is a consequence of the fact that the derivation of formula (9) in [3] is based on an incorrect notation of the stochastic process, where the measured energy of a single nucleon is taken, instead of the sample average energy release.
The process of registration of single photo-electrons of the PM is similar, from the point of view of statistics, to the process of registration of spectator nucleons in a calorimeter. Photons form photoelectrons in the PM photocathode with a probability equal to the quantum efficiency of the photocathode . After the formation of the photo-electron, an avalanche-shaped charge gain occurs in the dinode system of the PM. The process of formation of photo-electrons is stochastic. The amplification process in the PM is also stochastic. Each photoelectron is amplified in a PM with a different gain. The registered charge Q consists of the sum of of random amplification processes. The total charge Q in a single event can be expressed in simplified form as the product of two random variables and the average gain of the PM as follows:
| (10) |
where e is the charge of the electron, is the gain for the - th photo-electron. The relative fluctuation of the detected charge depends on the fluctuation of the number of photo-electrons and the fluctuation of the PM gain when registering a single photoelectron , as follows [4, 5]:
| (11) |
where is the variance, is the average charge for a single photo-electron.
The process of formation of the average number of photoelectrons from the light flash of an LED is stochastic and is described by Poisson statistics. The probability of registering n photoelectrons is . The charge registered by the PM is composed of the sum of random amplification processes. In paper [6], a method for calibrating the PM by measuring single photoelectrons is proposed. The spectrum of charges registered by the PM is described as the sum of signals from background processes and signals from photo-electrons as follows [6]:
| (12) | |||
where and are the mean and variance of the pedestal when measuring the detected charge of the PM in the absence of primary photo-electrons (n = 0), the parameters w and describe the contribution of background processes, - the step function, and are the mean and variance of the signal from a single photoelectron, - offset of the pedestal associated with the background, – the normalized number of events.
The total number of parameters describing the function is eight. When registering a large number of photoelectrons , the Poisson statistics transfer to the Gaussian statistics and the average charge and the charge variance from the light signal will be equal to and , respectively. It follows that the relative charge variance for large is equal to:
| (13) |
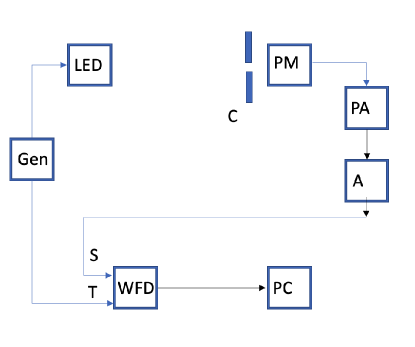
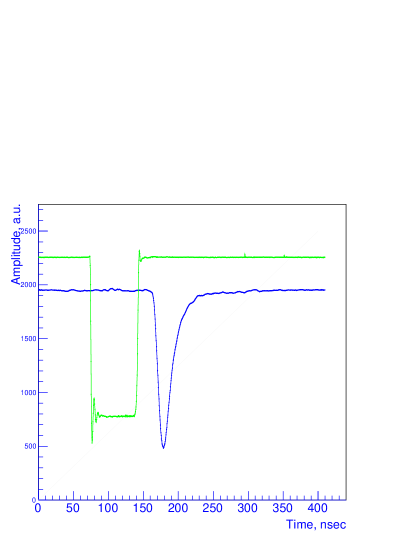
The scheme for measuring single photoelectrons using a fast LED and a pulse generator is shown in Figure 2a. Figure 2b shows a typical PM signal from a single photoelectron from the output of the amplifier and the generator signal for starting the LED. The LED was started from a rectangular signal with an amplitude of 2.95 and 3.25 volts and a duration of 60 seconds from the generator. With the help of a diaphragm, the attenuation of the light flux was selected for measuring single photoelectrons. Measurements of the pulse shape of single photoelectrons of the PM were carried out using 12-bit 16-channel ADC converter CAEN DT5742 (WFD-waveform digitizer) [7]. The device operated at a frequency of 2.5 GHz with the measurement of the signal amplitude at 1024 points with an interval of 0.4 seconds.
The results of the fit of the measured charge from single photoelectrons with the amplitudes of the LED start signal equal to 2.95 and 3.25 V and a duration of 60 nsec are shown in Figures 3a and 3b, respectively. The components of the spectrum of the detected charges : the background and contributions from one, two, three, etc. photoelectrons are also shown in Figure 3.
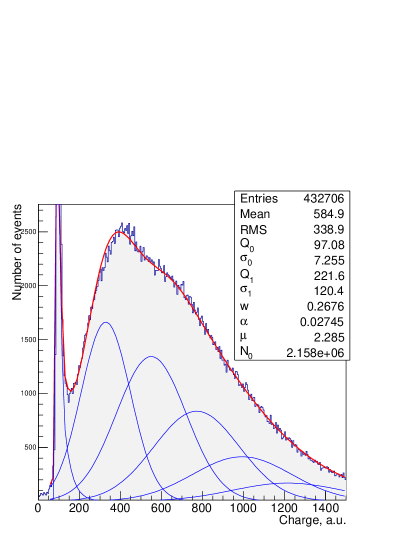
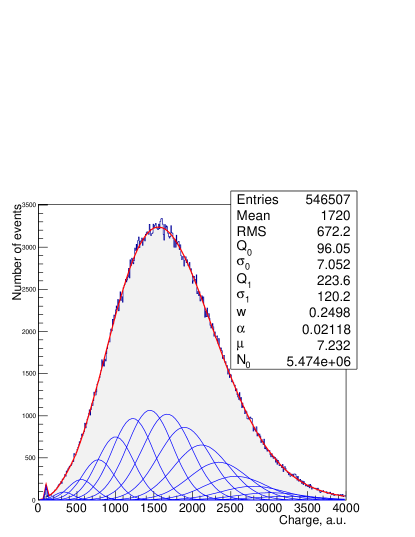
A comparison of the measured charge spectra (Figs. 3a and 3b) from single photoelectrons demonstrates the statement about the transition of the Poisson statistics to the Gaussian statistics with an increase in the average number of photoelectrons registered by the PM from a light flash. An estimate of the relative variance of the measured charge from the distribution shown in Figure 3b, with an average of , gives a value equal to . The estimate of the relative charge variance by formula (13) at gives , which is in good agreement with the experiment.
Paper [6] presents the results of charge measurements for the average number of photoelectrons equal to . From this spectrum, we can estimate the relative charge variance, which is . The relative variance of the charge calculated by formula (13) is . This also agrees well with the experiment.
Estimation of the value of the relative variance of the charge by formula (9) from [3] at , gives and does not agree () with the measured value of 0.43. With an increase in the average number of photoelectrons registered by the PM, this difference will only increase.
Conclusions
The accuracy of measuring the total energy of the spectators in the FHCal calorimeter, depending on the fluctuations in the number of nucleons and the hadron shower is obtained. It is shown that, from the point of view of statistics, the process of registering photoelectrons in a photomultiplier (PM) is similar to the process of registering spectator nucleons in a calorimeter. The measurements of single photoelectrons in the PM agree well with the obtained formula for the relative variance of the charge detected by the PM, and do not agree with the formula obtained in [3].
Acknowledgments
In conclusion, I would like to express my gratitude for the useful discussions and comments to A. Ivashkin, F. Guber, A. Kurepin, I. Tkachev. The work was carried out using the equipment of the collective user center ”Accelerator Center for Neutron Studies of the Structure of Matter and Nuclear Medicine of the INR RAS” with the support of the Ministry of Education and Science of the Russian Federation under Grant Agreement No. 14.621.21.0014 of 28.08.2017, unique identifier RFMEFI62117X0014.
References
- [1] M.B. Golubeva et al. Forward Hadron Calorimeter (FHCal). Technical Design Report for the MPD Experiment, Tech. Rep., JINR, Dubna, 2017, URL http://mpd.jinr.ru/wp-content/uploads/2017/08/MPD-TDR-FHCal-v9-1.pdf.
- [2] Philip Bevington, D. Keith Robinson; Data reduction and error analysis for the physical sciences, McGraw-Hill, Inc 2003
- [3] A.B. Kurepin,A.G. Litvinenko, E.I. Litvinenko https://arxiv.org/abs/1901.06508, Physics of Atomic Nuclei, 2020, Vol. 83, No. 9, pp. 1359-1362.
- [4] J.B. Birks, The Theory and Practice of Scintiilation Counters, New York, Pegamon, 1967.
- [5] P. Dorenbos, J.T.M. Hass, C.W.E. Eijk, IEEE Trans. Nucl. Scie. 1995. V. 42. No 6. P. 2190.
- [6] E.H. Bellamy, G. Bellettiny, J. Budagov et al., Nucl. Instruments and Methods in Physics Research, 1994, v. A339, p. 468-476
- [7] CAEN DT5742, 16 channel 12 bit waveform digitizer, http://www.caen.it