On the Structure of Star-Polymer Networks
Abstract.
Using the bond fluctuation model we study polymer networks obtained by endlinking of symmetric 4-arm star polymers. We consider two types of systems. Solutions of one type (A) of star polymers and solution of two types (A,B) of star polymer where A-type polymers can only crosslink with B-type polymers. We find that network defects in networks are dominated by short dangling loops close to overlap concentration . networks develop a more perfect network structure, since loop sizes involving an odd number of stars are impossible, and thus, the most frequent dangling loop with largest impact on the phantom modulus is absent. The analysis of the pair-correlation and scattering function reveals that there is an amorphous packing of and type stars with a homogenization of and concentrations upon cross-linking at intermediate length scales in contrast to the previously suggested crystalline like order of and components at . This result is corroborated by the coincidence of the probabilities of the shortest loop structures (which is impossible upon the previously suggested packing of stars) in both types of networks. Furthermore, we derive the vector order parameters associated with the most frequent network structures based on the phantom model. In particular for networks we can show that there is a dominating cyclic defect with a clearly separated order parameter that could be used to analyze cyclic network defects.
1. Introduction
Polymer networks are not fully understood because of the frozen-in disorder in the connectivity of chains, which is the result of a random crosslinking process. The construction of networks obtained from well defined precursor molecules and crosslinking processes is a possible route to gain deeper understanding of the resulting polymer structures. The research on such model networks is driven by applications where well defined network structures composed of functional macromolecules are needed.
Recently, T. Sakai et al. synthesized a novel class of hydrogels made of 4-arm star polymers with tetra-Nhydroxysuccinimide-glutarate-terminated PEG (A-type) and tetraamine-terminated PEG (B-type) as precursor molecules, “Tetra-PEG-gels” [22]. Due to the different functional end-groups, crosslinking occurs exclusively between A- and B-type molecules. The obtained networks show a remarkably high mechanical strength and no excess light scattering for networks cross-linked close to overlap concentration . It was suggested [22, 18, 19] that these samples exhibit an extremely homogeneous network structure.
In the present work, we applied Monte Carlo simulations using the bond fluctuation model (BFM) to study in detail two model systems: homopolymer star networks (all reactive groups are same type ) and copolymer star networks (stoichiometric mixture of and type stars that form bonds exclusively) of four arm star-polymers of equal arm length . The goal of our work is to clarify the reasons for the improved network structure in the above mentioned experimental studies. In order to eliminate structural changes as function of conversion, the crosslinking process was stopped at approximately the same extent of reaction (95%) for all simulations. Therefore, significant differences in network structure of and networks can only arise from changes among the active material or from a different spatial packing of the star polymers.
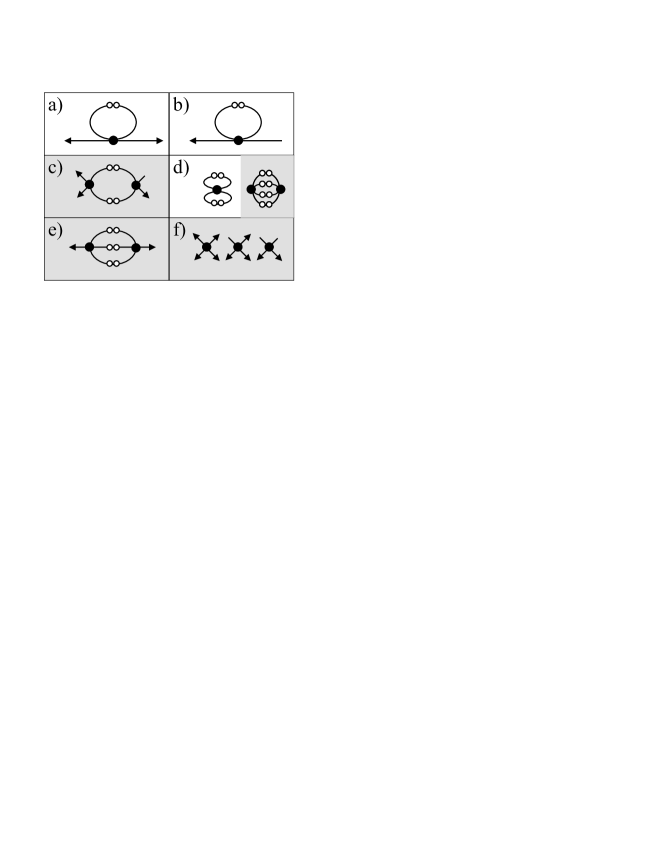
To consider both possibilities, we analyze the spatial order of star polymers by pair-correlation and scattering functions before and after cross-linking. Additionally, we analyze the predominant cyclic structures that reduce network modulus. Figure 1.1, for instance, shows loop structures that are either completely inactive as the “self-loop” at a) or the full star at b). Other structures lead to a reduced contribution [6] of the attached network chains to phantom modulus as the double link at c) or the triple link at e), or can lead to an increased amount of sol as shown at d). In the present work, we focus on exploring the structural properties of tetra-peg star networks of Ref. [22] and discuss a possibility to detect structural defects using the concept of segmental order parameters.
2. Simulation Methods and Systems
We use the bond-fluctuation model (BFM) [3, 7] to simulate star polymer solutions, network formation, and to determine the properties of the obtained networks after crosslinking is terminated. This method was chosen, since it is is known to reproduce conformational properties and dynamics of dense polymer systems [2, 25], semi-dilute solutions [20] and polymer networks [24, 16, 23, 11, 12]. In this method, each monomer is represented by a cube occupying eight lattice sites on a cubic lattice. The bonds between monomers are restricted to a set of 108 bond vectors which ensure cut-avoidance of polymer strands by checking for excluded volume. Monomer motion is modeled by random jumps to one of the six nearest lattice positions. A move is accepted, if the bonds connecting to the new position are still among the set of 108 bond vectors and if no monomers overlap. All samples were created in simulation boxes of size with periodic bondary conditions. Athermal solvent is treated implicitly by empty lattice sites.
| 4 | 0.116 | 0.268 | 1900 | 2 | 0.931 |
| 4 | 0.125 | 0.289 | 256 | - | - |
| 4 | 0.140 | 0.325 | 2300 | 9 | 0.940 |
| 4 | 0.250 | 0.579 | 512 | - | - |
| 4 | 0.375 | 0.868 | 6144 | 18 | 0.942 |
| 4 | 0.500 | 1.157 | 8192 | 16 | 0.944 |
| 8 | 0.023 | 0.104 | 1536 | 23 | 0.896 |
| 8 | 0.047 | 0.207 | 3072 | 13 | 0.930 |
| 8 | 0.063 | 0.276 | 4096 | 16 | 0.930 |
| 8 | 0.109 | 0.484 | 7168 | 12 | 0.942 |
| 8 | 0.188 | 0.829 | 1536 | 5 | 0.942 |
| 8 | 0.375 | 1.658 | 3072 | 8 | 0.945 |
| 8 | 0.500 | 2.211 | 4096 | 6 | 0.944 |
| 16 | 0.016 | 0.124 | 8 | - | - |
| 16 | 0.023 | 0.186 | 96 | - | - |
| 16 | 0.031 | 0.247 | 1024 | 1 | 0.938 |
| 16 | 0.047 | 0.371 | 1536 | 1 | 0.937 |
| 16 | 0.063 | 0.495 | 2048 | 7 | 0.940 |
| 16 | 0.125 | 0.990 | 4096 | 6 | 0.940 |
| 16 | 0.188 | 1.485 | 768 | - | - |
| 16 | 0.250 | 1.979 | 8192 | 12 | 0.943 |
| 16 | 0.375 | 2.969 | 1536 | 0 | 0.942 |
| 16 | 0.500 | 3.958 | 2048 | 2 | 0.949 |
| 32 | 0.008 | 0.108 | 16 | - | - |
| 32 | 0.016 | 0.215 | 32 | - | - |
| 32 | 0.023 | 0.323 | 3072 | 13 | 0.932 |
| 32 | 0.031 | 0.431 | 4096 | 7 | 0.940 |
| 32 | 0.039 | 0.539 | 5120 | 6 | 0.939 |
| 32 | 0.047 | 0.646 | 96 | - | - |
| 32 | 0.063 | 0.862 | 128 | 0 | 0.944 |
| 32 | 0.094 | 1.292 | 1536 | 1 | 0.944 |
| 32 | 0.125 | 1.723 | 2048 | 5 | 0.944 |
| 32 | 0.188 | 2.585 | 3072 | 0 | 0.947 |
| 32 | 0.250 | 3.446 | 4096 | 9 | 0.944 |
| 32 | 0.375 | 5.169 | 768 | - | - |
| 32 | 0.500 | 6.892 | 8192 | 7 | 0.945 |
| 64 | 0.016 | 0.370 | 128 | - | - |
| 64 | 0.023 | 0.555 | 192 | - | - |
| 64 | 0.031 | 0.741 | 256 | - | - |
| 64 | 0.047 | 1.111 | 384 | - | - |
| 64 | 0.125 | 2.962 | 1024 | 1 | 0.946 |
| 64 | 0.188 | 4.443 | 1536 | 1 | 0.943 |
| 64 | 0.250 | 5.924 | 2048 | 0 | 0.947 |
| 64 | 0.375 | 8.886 | 3072 | 1 | 0.946 |
| 64 | 0.500 | 11.85 | 4096 | 0 | 0.947 |
| 32 | 0.016 | 0.215 | 2048 | 178 | 0.594 |
| 32 | 0.023 | 0.323 | 3072 | 70 | 0.705 |
| 32 | 0.031 | 0.431 | 4096 | 43 | 0.755 |
| 32 | 0.063 | 0.862 | 1024 | 2 | 0.858 |
| 32 | 0.094 | 1.292 | 1536 | 4 | 0.878 |
| 32 | 0.125 | 1.723 | 2048 | 3 | 0.888 |
| 32 | 0.188 | 2.585 | 3072 | 0 | 0.901 |
| 32 | 0.250 | 3.446 | 4096 | 1 | 0.908 |
| 32 | 0.500 | 5.169 | 8192 | 5 | 0.921 |
Monodisperse solutions of star polymers with 4 arms were created as described in table 1 and 2. The monomer volume fractions span the range from dilute solutions up to concentrated systems at comparable to polymer melts [20]. Each star contains a ring of 4 monomers as core with arm monomers attached. The polymer solutions were relaxed over a period of several relaxation times of the stars as checked by mean square displacements of full star polymers and end-to-end vector auto-correlation of star arms. Reaction took place (i.e. a permanent bond is introduced) whenever two previously unreacted chain ends of type (for -type networks) or one of type and one of type (for -type networks ) hit each other during the course of their motion at minimum separation on the lattice. This criterion was used in order to avoid the formation of bonds that can no longer move111For instance, the formation of bond (3,1,0) from the origin, if a neighboring bond (1,-3,0) starts from position (1,2,0). Reaction was stopped at about 95% of maximum possible extent of reaction in order to eliminate structural changes as function of conversion. The properties of the solutions before cross-linking and of the networks after cross-linking are evaluated in the following sections.
3. Solutions of Star Polymers
In the following, we denote the number concentration of monomers as . We define the overlap concentration of a monodisperse polymer solution geometrically as
| (3.1) |
Here, denotes the root mean square average bond length, the degree of polymerization, the radius of gyration of dilute polymers, and the exponent for long chains in athermal solvent. For ideal -arm stars we have and thus, . We focus on being the scaling variable for semi-dilute solutions, since we expect the same number of neighboring molecules for a given polymer at same , and thus, identical amounts of cyclic network defects or, if existing, a similar spatial ordering or packing of the stars. The amount of linear or branched dangling material is similar among all networks, since the reactions were stopped at the same extent of reaction (95%) and the networks are stoichiometric mixtures of stars with identical architecture but different reactive groups.
Below , the chain conformations are comparable to an isolated coil in athermal solvent [5]. Semi-dilute solutions with can be considered as divided into space-filling correlation volumes , called blobs, of polymer concentration containing monomers each. The blob size decreases with concentration as . Since the total coil conformation can be considered as random walk of blobs of size , the square chain size for is expected to decrease as
| (3.2) |
with . Note that and that the above result was originally derived for linear chains [5]. It can be expected to hold for 4-arm stars of our study, since additional regimes proposed by Daoud [4] require a larger number of arms.
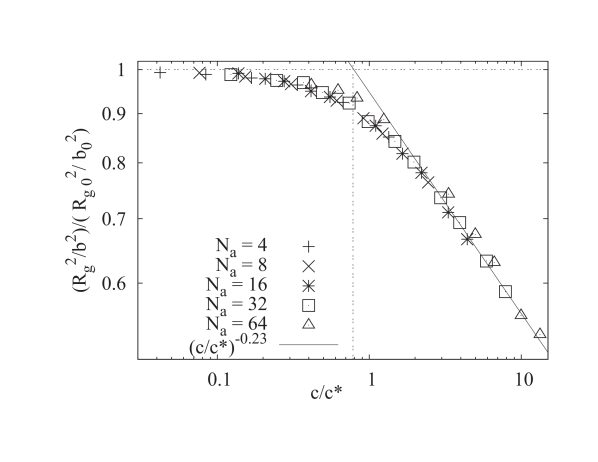
Equation (3.2) is compared with the simulation data at Figure 3.1. For analysis, the concentration dependence of the mean square bond length , cf. Ref. [20], is corrected by computing for each particular concentration . The data collapses roughly on a single curve with a cross-over region of about one decade when plotting normalized chain size as function of . Note that using a sphere of for defining is nearly quantitative when comparing the intersection point of the scaling of for and for in Figure 3.1. Therefore, we use as defined in equation 3.1 as reference for the analysis below. We conclude that 4-arm flexible star polymers obey concentration scaling as derived for linear polymers.
4. Spatial order of star polymers
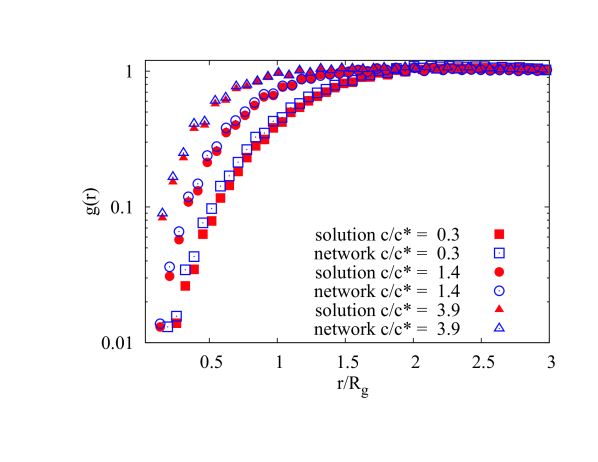
Star polymers, in particular with short arms, might repel each other to a larger extent as linear chains. This could lead to some spatial order similar to a hard-sphere like packing as proposed in Ref. [22]. In Fig.4.1 we display the the pair correlation function of all stars centers. Our results show the formation of a depletion zone of center monomers of other stars around the center of a given star, which remains almost unmodified upon cross-linking. The shape of this depletion zone does not correspond with results of hard-core fluids that typically show a sharp depletion with an oszillating correlation function at distances larger than particle diameter [26]. In contrast, it is rather consistent with the correlation hole as typically observed in polymer solutions or dense melts [25]. Cross-linking leads only to a weak decrease of the depletion width due to attractive forces along the bonds among connected stars. The formation of additional peaks indicating long range spatial order cannot be observed.
The collective structure factor as obtained in typical scattering experiments is the Fourier-transform of the pair correlation function
| (4.1) |
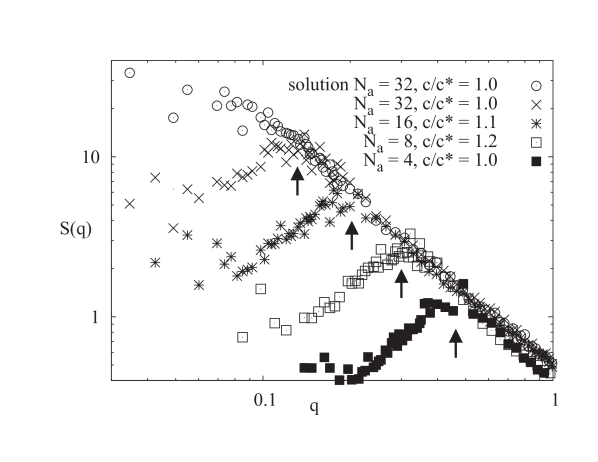
From the analysis of the pair correlation function at Fig. 4.1 it is already obvious that the non-selevtive (with respect to and stars) structure factors including all star polymers are almost indistinguishable before and after cross-linking (data not shown). The situation is different for the selective structure factors as computed for all monomers of only one species of stars inside the networks, see Figure 4.2. The data shows a peak at the average distance of the over-next star that is located about four arm lengths apart from a given star center. No higher order peaks can be resolved, which indicates the absence of long-range order. We note that the selective scattering data of solutions coincides with the corresponding network data of Figure 4.2 for as shown for . For the solution data show an Ornstein-Zernike type crossover and display higher scattering as compared to network data. We explain this observation by the fact that network formation at large conversion induces reduced density fluctuations of vs. type stars at intermediate lengths. Note that this observation is not in contrast to the usually observed excess scattering in polymer networks at equilibrium swelling or as function of the swelling ratio [1, 12], since here, we analyze the scattering of networks at preparation conditions. Note that the selective structure factor for is clearly above the overall structure factor of both types of stars (not included in Figure 4.2). Based on our simulation results we conclude that this cross-linking induced order is much weaker than the repulsion among stars inside the sample and thus, does not lead to the formation of lattice-like structures.
In summary, we can only confirm soft repulsion among stars but do not find any indication of a spatial ordering beyond a weak reduction of density fluctuations of different type of stars inside the network as compared to solutions. Therefore, we now focus on network connectivity.
5. Loop defects inside the network structure
An ideal model network of any functionality can be imagined by considering an infinitely branching structure like a Bethe lattice of same functionality, as used to derive the phantom modulus [21]. An ideal network structure of functionality four, for instance, can also be visualized by a diamond lattice like connectivity [22]. As compared to such ideal connectivities, the random crosslinking process always leads to the formation of various defects as short loops, dangling network strands, or more complex inactive structures. Any of these defects diminishes the elastic modulus of the networks. However, for networks of functionality at high conversion it is known that the fraction of complex inactive structures is decreasing exponentially with size [10]. The amount of linear dangling material is nearly constant for star polymers, if all samples were crosslinked up to the same conversion close to completion. Therefore, the remaining main difference in the connectivity of star networks close to at high conversion must be with respect to the formation of short cyclic structures.
The simplest loop-like defects and stars with dangling strands are sketched in Fig. 1.1. Below we use the following notation to distinguish different star connectivities (cf. Figure 1.1): is used to denote stars that are part of ring structures containing each molecules. If is missing, it is equal to 1. is used to denote single (“ideal”) connections to different stars. Thus, the structures of Fig. 1.1 are denoted as a) , b) , c) both stars are , d) left star is and both stars on the right , e) the left star is , while the star on the right , f) from left to right , , . Note that conformations are written in italics, while the total fraction of monomers in loops of molecules is denoted as .
For a simple approximative treatment of short loop structures in networks we use the results of Ref. [9] and refer the reader to this work for more details. There, the following approximations are made: equal reactivity among the functional groups, homogeneous samples, no effects of excluded volume on the spatial arrangment of reactive groups and no effects of smaller loops onto the formation of larger ones. Then, the rate of ring formation of short loops in irreversible linear polymerization reactions can be approximated as :
| (5.1) |
Here, is the extent of reaction and the amount of rings containing molecules. For computation, one reaction partner is considered to be at the origin. The concentration is the concentration of the second reaction partner at the origin whereby this molecule is a minimum of molecules along the connective structure apart. is the concentration at the origin of all other reactive groups not being connections apart. For overlapping molecules one typically has with the initial concentration of not-attached “external” reactive groups.
For network forming reactions, is replaced by a branching term for networks and for networks [9] that counts the average number of reactive sites attached or molecules apart. Since for our series of simulations and , the term reduces to indicating that only even ring sizes can be realized in networks.
The concentration of attached groups is estimated using the blob picture for chain conformations in semi-dilute solutions: a chain performs a random walk of concentration blobs of size with monomers per blob and blobs per chain. The return probability for this random walk is given by
| (5.2) |
Since in the athermal case and for stars we find for a single reactive site
| (5.3) |
For networks we have and we can integrate equation (5.1) using the approximation to obtain
| (5.4) |
as prediction for the fraction of rings of size in star polymer networks. For networks, the prefactor changes from 0.12 to for even , since only half of all reactive groups are possible reaction partners.
Note that is not the limiting concentration for network formation. Network formation is still possible at concentrations at which at least 1 out of bonds connects to at least one other molecule. Let denote the number of reactive groups attached to other stars in the pervaded volume of a given star. Then, is roughly the probability to connect to a different star. Since each star has attempts to connect we obtain from that . Since connections are possible within the range around the star center, this leads to a limiting polymer concentration of
| (5.5) |
for networks, which is about one order of magnitude below for .
For and ignoring the effect of fluctuations, the return probability of equation (5.3) becomes concentration independent and thus,
| (5.6) |
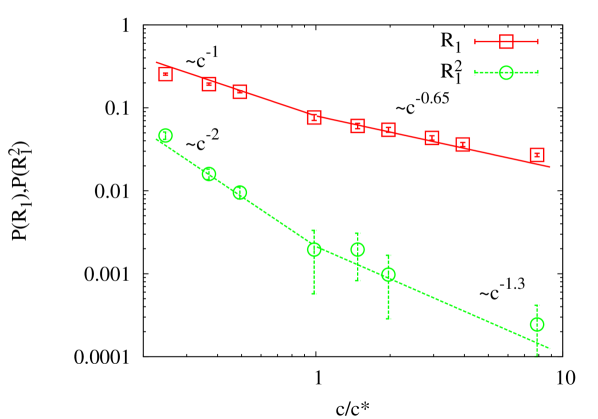
Figure 5.1 shows the concentration dependence of the number fractions of self-loops among all bonds (which is the number fraction of bonds “wasted” in dangling loops) and the number fraction of stars forming two self loops . We find at , since there are distinguishable ways to form the first and only one for the second, and there are bonds per star (different normations). In order to show this dependence, we fitted the more accurate data by equation 5.4 and computed from this fit the predictions for the . Note that this kind of procedure is only possible, if the over all loop fraction is small as compared to the remainder of the network structure. For larger loop fractions one has to use a more detailed approach that also explains the deviations for at low concentrations [17]. The data at the lowest concentration shows a stronger than predicted dependence on concentration. This can be explained by concentration fluctuations of molecules and the rapid reaction in our simulations, because isolated stars can only form structures without collisions with other stars until full conversion. The data at corresponds to a very limited number of sol molecules with absolute counts of on order unity (cf. Table 2). Therefore, the missing two data points are due to samples, for which no could be detected.
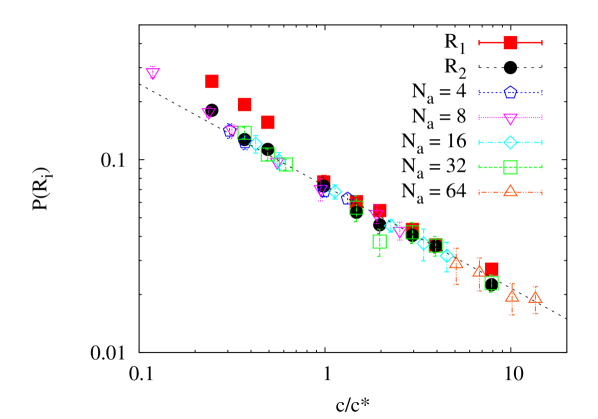
From equation (5.4) it can be found that independent of concentration, thus for the parameters of our simulations. The density of one type of reactive groups in networks is half the density as the groups in networks at same concentration, which doubles the probability for ring formation in networks. Thus, the dangling ring data for networks is expected to collapse onto the double link data of networks. The same holds for of networks, if the data is multiplied by a factor of two and corrected for the amount of bonds between stars , which cannot form rings , because they are incorporated into rings . The good agreement among all data can be seen from the collapse of all and data in Figure 5.2 for . Below we note that connected pairs, triples etc … of stars (as neccesary for loops ) behave like increasingly larger molecules with decreasing . Therefore, a simple scaling as function of the overlap concentration of individual stars does no longer work.
A best fit (dashed line) of the data in Figure 5.2 yields , which is a slighly smaller power than the predicted 0.65. The absolute amount of loops is about 30% less than predicted from equation (5.4) at . The corrections to scaling are due to the neglect of changes in the shape of the correlation hole of the stars and a corresponding shift of the average positions of the end monomers by using the above simple scaling approach. Furthermore, at the approximation no longer works.
The above results can be used to understand the different stability of and networks by considering the different impact of loops and onto the network structure. When comparing with we find that for 50% of the polymer is fully removed of the active network, while the remaining network strand is doubled in length. When comparing with we find that still all polymer is active, while the effective functionality of the cross-link is only reduced by one. This clear difference can be seen by the strong impact of concentration onto the weight fraction of the active material at table 2, while the data of the network at table 1 is almost independent of concentration for the parameters of our study.
Altogether we find that and networks show exactly the same scaling for the amounts of short loops at after correcting for the concentrations of reactive groups. We note that the observed behaviour for short loops is not in agreement with assuming a diamond lattice like network structure close to The most important difference between both types of networks is the absence of loops (self-loops) in networks. The frequent occurence of this type of defects in networks, however, leads to a substantial decrease in the volume fraction of active material in networks as compared to networks.
6. Segmental order parameters and network defects
Computer simulations allow to measure directly vector and tensor order parameters in a polymer network [23]. In this section we explore the relations between defects in network structure and segmental order parameter. Since the vector order parameter requires much less sampling time as compared to the tensor order parameter [23], we restrict our discussions to the vector order parameter in the following.
Let denote in this section the number of monomers between two connected star centers. The vector order parameter of segment along this chain is defined via the long time limit of the autocorrelation function
| (6.1) |
with being the normalized segment vector and denotes the actual segment vector with monomer index . For ideal chains of segments with the ends fixed at distance we have for each
| (6.2) |
Thus, for set of ideal chains with the ends fixed according to a Gaussian end-to-end distribution we obtain for the ensembe average of all chains and order parameters (as indicated by square brackets )
| (6.3) |
Here, we note that the effect of excluded volume on the vector order parameter is entirely determined by the change in chain extension in contrast to the tensor order parameter [8]. Most samples of our simulation series are in the vicinity of and are built of weakly entangled stars. Therefore, we will use the phantom model to obtain a simplified theoretical prediction for the order parameter of different network structures. This prediction can only be applied close to or slightly below .
Our calculations are based on the following simplifications: The phantom model can be reduced to the affine model, by computing the corresponding combined chain with fixed ends that describe the deformations of the network strands [21]. To this end we assume a network structure similar to the Bethe lattice except of one single defect. The vector order parameter is then computed analogous to the derivation of phantom modulus. Details are shown in the Appendix for connectivities and the double links of connectivity . Similar to these examples we also computed combined chains and order parameters of the most abundant network structures. The results are summarized at Table 3. In order to highlight the importance of the particular structure, we also included the measured fraction of polymer with the particular combined chains in the different structures222For instance in the structure there is only 50% of the star not dangling; but since each of the two connected stars also contribute one arm that is part of the combined chain, there is a fraction of 12% of network polymer that is part of the combined chain indicated at position n, while there is 6% polymer in dangling rings. The connectivity in networks was included for illustrating the fact that the loop itself cannot be detected, since it is part of the dangling material. The strand attached to this loop has some potential for analysis due to an order parameter of , which is, however, clearly harder to distinguish of as the order parameter of . at concentration . Note that we neglected corrections for the amount of active material for simplicity, since at or above almost all exisiting connections in networks at high conversion are part of the active material (cf. table 1: about 94% of star arms is active, whereby 95% of arms are connected).
| connectivity | pos | % | % | ||
|---|---|---|---|---|---|
| 57 | 58 | ||||
| r | 5.5 | 11 | |||
| -”- | n | 5.5 | 11 | ||
| 11 | 11 | ||||
| r | 0.8 | 1.5 | |||
| -”- | n | 0.4 | 0.75 | ||
| r | 6 | - | - | ||
| -”- | n | 12 | - | ||
| 1 | 1 |
The results show that in particular for networks there is a single clearly distinct (a factor of 2 different) order parameter for the most abundant non-ideal network structure close to , while the other most abundant defects ( and ideal connections of ) have nearly non-distinguishable order parameter as compared to the ideal connections. Note that all other structures missing at the above table contribute each on order 1% or less to the fraction of polymer and thus, lead to a slight smearing out of the full order parameter distribution. Thus, the structure in star networks is by far the most promising candidate for investigating cyclic defects in polymer networks using NMR.
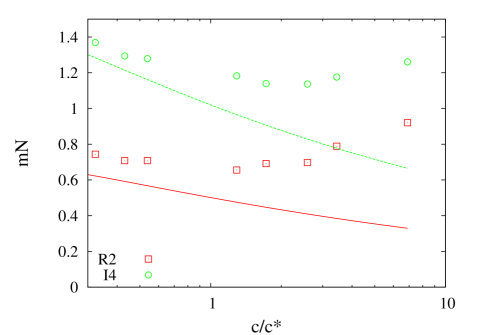
In the Appendix we additionally computed the effect of concentrations onto the vector order parameters. In Fig. 6.1 we compare the order parameter as directly obtained in our simulations with their values predicted for stars and in rings of stars . The data is multiplied by in order to remove the chain length dependence of the phantom model. The limiting behaviour without short loops is obtained by formally taking the limit (cf. table 3). At and below we find reasonable agreement between predictions and simulation data. Note that both phantom model computations for subsequent cross-linking and the extra excluded volume along the strands after cross-linking extend the average chain conformation by roughly 10%. For increasing concentrations, , we find increasing disagreement between data and theory. This difference can be explained by the effect of entanglements, which lead to a scaling of as shown in Ref. [13]. Thus, for the largest concentrations there should be an increase of the order parameter as compared to the phantom prediction by somewhat larger than a factor of two in agreement with the simulation data. However, a sound analysis of the concentration dependence of entanglements would require much larger chain lengths and overlap numbers, since most data of the present study is at the onset of entanglement effects. Note that the partial compensation of entanglements and swelling effects leads to almost unmodified order parameters for stars at slightly larger than one. The effect of entanglements is much more pronounced (due to the smaller order parameters at for the loops at , which leads to an apparent exponent on the order of order in the transition regime. This observation is in agreement with recent experimental data [14, 15] and will be elaborated with more detail in a forthcomming publication using networks of clearly larger chain length.
7. Conclusions
We analyzed the structure of polymer networks obtained from star polymer solutions for concentrations ranging from dilute to melt. AB-type networks of symmetric composition, where crosslinking can occur only between unlike species are compared with A-type networks, where crosslinking takes place between all molecules (including self-links within a given star). The analysis of the pair correlation function showed no essential increase of the spatial order of stars in both types of networks upon cross-linking beyond a weak nearest neighbor correlation. On intermediate distances of the order of a few number of stars, concentration fluctuations among and networks are suppressed. Long range order could not be detected.
Network connectivity was analyzed in terms of the formation of short ring structures (defects) that diminish the elastic response of the network and might be detected in NMR-experiments. For -type networks, double links between two neighboring stars, see Fig. 1.1, are most abundant and their fraction is about 11% at . This shows that -type networks are far from perfect in terms of connectivity. The coincidence of the double links data of networks and the dangling loops and double links of networks after correcting the differences among both types of samples indicates that effects of spatial order are ignorable for networks. The absence of structures leads to the formation of networks with a significantly increased amount of active material as compared to networks at same conditions. We argue that this is the major difference between the two types of networks and is responsible for an substantial increase in active material and, hence, for the increased mechanical strength.
Our study reveals that in particular for networks there is only one dominating (at concentrations close to ) short loop structure, , which has a clearly distinct segmental order parameter as compared to most of the remaining network structure. Therefore, this particular type of loops might lead to a distiguished signal in solid-state NMR experiments as has been recently observed [15]. We observe an apparent concentration dependence of the order parameters that is clearly affected by entanglement effects at . At or slightly below , the phantom model achieves a reasonable prediction for the vector order parameter.
8. Acknowledgement
The authors thank the ZIH Dresden for a generous grant of computing time. ML thanks the DFG for funding project LA2735/2-1. The authors thank Ron Dockhorn and Marco Werner for stimulating discussions and for assistance with the simulation tools.
9. Appendix
Let us assume that the network has ideal connectivity (no finite loops, all junctions of functionality as used in section 7.2.2 of [21] for deriving phantom modulus). If one strand is being removed of this perfect network, the fluctuations of the cross-links previously attached to this strand can be modeled by virtual chains of
| (9.1) |
monomers that are attached to the non-fluctuating elastic background. When re-inserting the chain in between, we arrive at a combined chain of
| (9.2) |
monomers that is fixed at both ends. Note that of this chain equals .
Similarily one can show that removing two links leads to cross-link fluctations as given by
| (9.3) |
Inserting a double link in between two such cross-links leads to a combined chain of
| (9.4) |
monomers, since the double link is equivalent to a chain of monomers. However, each strand of the double link still contains monomers and the corresponding order parameter is reduced by an additional factor of 2, because the average vector between the ends of this strand is divided into twice as many sections. Thus, for we obtain as for an ideal bond, but instead of for an ideal connection. Note that the double link leads to increased fluctuations of the cross-links attached (which reflect the local reduction of modulus) and thus, affects the combined chains of the surrounding strands. To show this effect, the combined chains and corresponding order parameters of the directly connected surrounding chains were also computed and given at table 3 (the chains at position n).
For applying the above computations to our simulation data, we have to include the effect of concentration and distributions of functionalities as function of concentration. Cross-linking at different concentration affects first the equilibrium size of a network strand. As discussed above,
| (9.5) |
One simple way to express the modified fluctuations of swollen chains is to consider that these fluctuations are always equivalent in amplitue to the size of the chains, since we discuss only samples at cross-linking conditions. Thus, the virtual chains show the same “concentration dependence” as the real chains. Therefore,
| (9.6) |
for the combined chains of the phantom model. In consequence, conformational changes upon cross-linking at different concentrations do not affect the ratios (cf. table 3) between the order parameters of different structures, if the surrounding network structure remains comparable.
Cross-linking at different concentrations also leads to a modification of the weight average number of independent active connections. We require the connectivity distribution to compute the weight average, since the functionality of the connected neighbour is selected proportional to its number of connections. Furthermore, only active connections must be taken into account, since non-active parts of the network do not contribute to the vector order parameter at . Using the weight average functionality we implicitly assume that there are no correlations between neighbouring functionalities, which is clearly not the case (a double link always connects stars with reduced functionality). But the results of a second study reveal [17], that the effect of these correlations is ignorable in the vicinity of .
For the networks of our study, the fraction of active junctions (as given by star centers) and the fraction of active connections among all existing connections is for . Thus, for we neglect a distinction between active and non-active material and consider all existing connections as active. Note that both quantities rapidly drop at concentrations clearly below and that the above approximation implicitly removes the small changes in the average length of active strands by fixing it to . Next, we only distinguish between junctions (star centers) of three and four connections, as justified by the data for networks at in table 3, and approximate that any double link reduces the functionality of two junctions from four to three at Using this approximation and the best fit for loop formation we find for the weight fraction of three functional junctions approximately
| (9.7) |
and consequently with
| (9.8) |
the weight average functionality
| (9.9) |
This weight average functionality replaces at equations (9.1) and (9.3) and leads to increased average cross-link fluctuations inside the sample for smaller concentrations. Thus, the contribution of the virtual chains to the combined chains has an additional concentration dependence different to equation (9.6). This additional concentration dependence leads to a shift of the ratios among the different order parameters as function of concentrations, if the fraction of is different for the particular structures.
Summarizing the above computations and approximations we find for strands of monomers between two stars of type that
| (9.10) |
while for the double links inside we obtain
| (9.11) |
These results are inserted in equation (9.6) to compute the prediction for the order parameter as function of concentration in Figure 6.1.
References
- [1] J. Bastide and S.J. Candau. Structure of Gels as Investigated by Means of Static Scattering Techniques, chapter 5, pages 143–210. John Wiley, 1996.
- [2] K. Binder. Monte Carlo and molecular dynamics simulations in polymer science. Oxford University Press Oxford, 1995.
- [3] I. Carmesin and K. Kremer. The Bond Fluctuation Method - A New Effective Algorithm For The Dynamics Of Polymers In All Spatial Dimensions. Macromolecules, 21(9):2819–2823, 1988.
- [4] M. Daoud and J.P. Cotton. Star shaped polymers: a model for the conformation and its concentration dependence. Journal de Physique, 43(3):531–538, 1982.
- [5] P.G. de Gennes. Scaling Concepts In Polymer Physics. Cornell University Press, New York, NY, United States of America, 1991.
- [6] P.J. Flory, M. Gordon, and N.G. McCrum. Statistical thermodynamics of random networks [and discussion]. Proceedings of the Royal Society of London. Series A, Mathematical and Physical Sciences, 351(1666):351–380, 1976.
- [7] H.P. Deutsch and K. Binder. Interdiffusion And Self-Diffusion In Polymer Mixtures - A Monte-Carlo Study. Journal Of Chemical Physics, 94(3):2294–2304, 1991.
- [8] J. L. Valentín J.-U. Sommer, W. Chassé and K. Saalwächter. Effect of excluded volume on segmental orientation correlations in polymer chains. Phys. Rev. E, 78:051803, Nov 2008.
- [9] M. Lang, D. Göritz, and S. Kreitmeier. Intramolecular Reactions in Randomly End-Linked Polymer Networks and Linear (Co) polymerizations. Macromolecules, 38(6):2515–2523, 2005.
- [10] M. Lang, D. Göritz, and S. Kreitmeier. Network defects and visco-elasticity. In Constitutive models for rubber IV: proceedings of the 4th European Conference for Constitutive Models for Rubber, ECCMR 2005, Stockholm, Sweden, 27-29 June 2005, page 349. AA Balkema, 2005.
- [11] M. Lang, S. Kreitmeier, and D. Göritz. Trapped Entanglements in Polymer Networks. Rubber chemistry and technology, 80(5):873–894, 2007.
- [12] M. Lang and J.-U. Sommer. On the origin of the scattering of gels and swollen polymer networks. In CONSTITUTIVE MODELS FOR RUBBER-PROCEEDINGS-, volume 5, page 147. Balkema, 2008.
- [13] M. Lang and J.-U. Sommer. Analysis of Entanglement Length and Segmental Order Parameter in Polymer Networks. Physical Review Letters, 104:177801, 2010.
- [14] F. Lange. Untersuchung der Mikrostruktur von Hydrogelen mittels Protonen-NMR. Master’s thesis, MLU Halle, December 2010.
- [15] F. Lange, K. Schwenke, M. Kurakazu, Y. Akagi, U. Chung, M. Lang, J.-U. Sommer, T. Sakai, and K. Saalwachter. Network Structural Defects in Tetra-PEG Hydrogels: A Combined Proton Multiple-Quantum NMR and Monte-Carlo Study. Macromolecules, accepted.
- [16] S. Lay, J.-U. Sommer, and A. Blumen. Comparison of structural properties of different polymer network types as obtained by computer simulation. The Journal of Chemical Physics, 110:12173, 1999.
- [17] K. Schwenke M. Lang and J.-U. Sommer. Rate Theory of Cyclic Structures in Polymer Model Networks. submitted.
- [18] T. Matsunaga, T. Sakai, Y. Akagi, U. Chung, and M. Shibayama. SANS and SLS Studies on Tetra-Arm PEG Gels in As-Prepared and Swollen States. Macromolecules, 42(16):6245–6252, 2009.
- [19] T. Matsunaga, T. Sakai, Y. Akagi, U.I. Chung, and M. Shibayama. Structure Characterization of Tetra-PEG Gel by Small-Angle Neutron Scattering. Macromolecules, 42:1344–1351, 2009.
- [20] W. Paul, K. Binder, D.W. Heermann, and K. Kremer. Crossover scaling in semidilute polymer solutions: a Monte Carlo test. J. Phys. II France, 1:37–60, 1991.
- [21] M. Rubinstein and R. Colby. Polymer Physics. Oxford University Press, New York, NY, United States of America, 2003.
- [22] T. Sakai, T. Matsunaga, Y. Yamamoto, C. Ito, R. Yoshida, S. Suzuki, N. Sasaki, M. Shibayama, and U. Chung. Design and Fabrication of a High-Strength Hydrogel with Ideally Homogeneous Network Structure from Tetrahedron-like Macromonomers. Macromolecules, 41(14):5379–5384, 2008.
- [23] J.-U. Sommer and K. Saalwächter. Segmental order in end-linked polymer networks: A Monte Carlo study. The European Physical Journal E: Soft Matter and Biological Physics, 18(2):167–182, 2005.
- [24] J.-U. Sommer, M. Schulz, and H.L. Trautenberg. Dynamic Properties Of Randomly Cross-Linked Polymer Melts - A Monte-Carlo Study. 1. Diffusion Dynamics. Journal Of Chemical Physics, 98(9):7515–7520, 1993.
- [25] J.P. Wittmer, P. Beckrich, H. Meyer, A. Cavallo, A. Johner, and J. Baschnagel. Intramolecular long-range correlations in polymer melts: The segmental size distribution and its moments. Physical Review E, 76(1):11803, 2007.
- [26] J.L. Yarnell, M.J. Katz, R.G. Wenzel, and S.H. Koenig. Structure Factor and Radial Distribution Function for Liquid Argon at 85 K. Phys. Rev. A, 7(6):2130–2144, Jun 1973.
Table of Contents Graphic
Number fraction of cyclic defects
Konrad Schwenke
Michael Lang
Jens-Uwe Sommer
![[Uncaptioned image]](/html/2103.16259/assets/x8.png)