Inter-particle adhesion regulates the surface roughness of growing dense three-dimensional active particle aggregates
Abstract
Activity and self-generated motion are fundamental features observed in many living and non-living systems. Given that inter-particle adhesive forces are known to regulate particle dynamics, we investigate how adhesion strength controls the boundary growth and roughness in an active particle aggregate. Using particle based simulations incorporating both activity (birth, death and growth) and systematic physical interactions (elasticity and adhesion), we establish that inter-particle adhesion strength () controls the surface roughness of a densely packed three-dimensional(3D) active particle aggregate expanding into a highly viscous medium. We discover that the surface roughness of a 3D active particle aggregate increases in proportion to the inter-particle adhesion strength, . We show that asymmetry in the radial and tangential active particle mean squared displacement (MSD) suppresses 3D surface roughness at lower adhesion strengths. By analyzing the statistical properties of particle displacements at the aggregate periphery, we determine that the 3D surface roughness is driven by the movement of active particle towards the core at high inter-particle adhesion strengths. Our results elucidate the physics controlling the expansion of adhesive 3D active particle collectives into a highly viscous medium, with implications into understanding stochastic interface growth in active matter systems characterized by self generated particle flux.
keywords:
American Chemical Society, LaTeXIR,NMR,UV
1 Introduction
Active matter systems constitute a type of matter whereby each unit particle utilizes energy to generate work 1, 2, 3. There are many examples of active matter systems from both living 4 - cells, animals etc - and non-living contexts 5 (molecules, droplets, grains etc) in the world around us. The energy required for movement can either be self-generated (as in the case of cells in biological tissues which convert stored energy into motion) or as in driven granular systems supplied externally by a shaking plate. As each particle (or ‘agent’) utilizes energy at the individual level, active matter systems are out of equilibrium at the single particle scale 6.
The field of active matter originated from efforts to understand the physical underpinnings of collective behavior in animals 7, 8. Pioneering work by Vicsek and co-workers 8 showed that the collective dynamics of self-driven particles emerge from a form of inter-particle coupling: a simple rule that the direction of motion of a particle is aligned with the average direction of motion of its neighboring particles. As of yet it is unclear whether active particles universally possess such an intrinsic tendency to align its direction of motion with its neighbors 7. In living active matter, such as cells, adhesive inter-particle interactions can modulate the mechanical contact between particles thereby controlling its spatial structure and dynamics 9, 10, 11. In the context of active colloids, selective and directional ligand mediated bonds can tune its motion and spatial configuration 12. Therefore, inter-particle adhesive interactions function as a crucial regulator of the collective dynamics and spatial structure of active matter systems.
An important feature of living active matter is the presence of birth and death where the ratio of birth and death rates can lead to three distinct implications on the overall system size or total number of particles: (i) when birth rate is less than the death rate, (ii) birth and death rates are balanced and (iii) when birth rate is in excess of the death rate. In this work we focus on the third scenario where birth rate exceeds the death rate leading to a fast expanding collection of active particles with boundary growth. Study of growth and fluctuation of interfaces between one medium and another have laid the groundwork for important advances in physics. For instance, the Kardar-Parisi-Zhang(KPZ) model describes the stochastic growth profile of interfaces 13, elucidating the behavior of materials ranging from crystal growth in thin films, turbulent liquid crystals to bacterial colony growth 14. In the KPZ model, the particle flux is orthogonal to the growing interface whereas another interesting scenario deals with particle flux generated by the surface itself as is relevant in biological systems such as membranes and cell collectives 15, 16, 17. In this context, Risler et. al. 18 described the out-of-equilibrium surface fluctuations of cell collectives in the homeostatic state when cell birth and death are balanced. Building on our prior work 19, 20, 21, 22, 23 where we modeled biological cells with pairwise elastic and adhesive interaction in addition to rules for size growth, division and death of particles, we study the surface roughness of a dense and fast expanding three dimensional (3D) collection of active particles. We focus on investigating 3D aggregate expansion at varying inter-particle adhesion strengths, known to critically tune collective properties in active matter systems. Our study models a dense 3D active particle aggregate expanding into a highly viscous surrounding medium, under free boundary conditions in the context of an off-lattice model.
Our theoretical prediction and subsequent analysis of experimental data showed that active particles in the core versus the periphery of a dense 3D active particle aggregate exhibit dramatic variations in the dynamics 19, 21. Whereas cells near the core are characterized by subdiffusive glassy dynamics (mean square displacement, with ), cells in the periphery exhibit highly directed superdiffusive motion, with . Such topological differences in the motion of constituent particles in a dense collection of active particles is reminiscent of the variation in the dynamics of particles between the surface and bulk in glasses 24. Here, we address the question of how the emergent spatial heterogeneity in the dynamics of three-dimensional (3D) active particle aggregate determine the surface roughness during aggregate expansion into a highly viscous medium. We observe that the strength of inter-particle adhesive interactions strongly up-regulate the surface roughness of expanding dense 3D active particle aggregates. We show that the uptick in the 3D surface roughness is due to the heterogeneity in the radial displacements of the particles on the surface of the expanding 3D aggregates, driven by the symmetry between radial and transverse motions.
2 Simulation details
We briefly describe the simulation scheme adapted from our previous work on 3D tumor growth 19, 20, 21, 22, 23. In the present study, we performed an off-lattice simulation of a growing 3D dense active particle aggregate 25, 26. In the growing aggregate (see Appendix, Movies 1-3), individual particles are modeled as soft deformable spherical agents. The individual particles grow stochastically in time and undergo division into daughter agents on reaching a critical size. The physics of the aggregate growth is governed by two factors - (a) systematic mechanical forces arising from two body interactions, (b) active processes due to particle growth, division and death, as we explain further below.
(a) Systematic Interactions: The individual particles interact with short-ranged forces, consisting of two terms, elastic force (repulsion) and adhesion (attraction). The elastic force () between two particles and of radii and is given by
| (1) |
where and are the Poisson ratio and elastic modulus of the particle. Also, is the virtual overlap distance between the two particles. The adhesive force () is given by,
| (2) |
where is the overlap area between the two interacting particles and determines the strength of adhesive bond. We have normalized the receptor(rec) and ligand(lig) concentration to satisfy .
| Parameters | Values |
|---|---|
| Timestep () | 10 |
| Critical Radius for Division () | 5 |
| Environment Viscosity () | 0.005 |
| Benchmark Cell Cycle Time () | 54000 |
| Adhesive Coefficient ( | |
| Mean Cell Elastic Modulus ( | |
| Mean Cell Poisson Ratio () | 0.5 |
| Death Rate () | |
| Mean Receptor Concentration () | 1.0 (Normalized) |
| Mean Ligand Concentration () | 1.0 (Normalized) |
| Threshold Pressure () |
The net force () on the particle is the vectorial summation of elastic and adhesive forces that the neighboring particles exert on it (). Here, is summed over the number of nearest neighbors . We performed over damped (low Reynolds number 27) dynamics without thermal noise because the viscosity is assumed to be large. Therefore, the equation of motion for the particle is,
| (3) |
where is the friction term which models the environment as a thick gel and is the position of the particle.
(b) Active Processes: In the simulation the growth of individual particles is stochastic. They undergo division on reaching a critical radius (). The growth of the particle is dependent on the pressure due to neighboring particles. Therefore, the growth of individual particles are micro-environment dependent. We use Irving-Kirkwood definition 28 to calculate pressure on the particle,
| (4) |
Here, is the volume of nearest-neighbors of the particle, is the volume of the particle and . If is smaller than a threshold value, , the particles grow in size. However, if , the particle becomes dormant with no size growth or division. Hence, the particles can switch between dormancy and growth mode depending on the ratio of . The volume of an individual particle grows stochastically in time and it divides into two daughter particles on reaching the critical radius . On division, two identical daughter particles are created with radii . Hence, a key time scale in the simulation is - the average time it takes for a particle to divide, set to be hours. Death of a particle take place in the simulations leading to a particle being randomly removed. The death rate is given by . Owing to , we are simulating a rapidly growing system of particles.
Initial Conditions: We initiated the simulations by placing 100 particles whose , , coordinates are chosen from a normal distribution with zero mean and standard deviation . In the present study, all the parameters have been fixed except the inter-particle adhesion strength which is varied from to . The simulated dense aggregate was evolved for or . Relevant parameters are shown in Table 1. The time-dependent coordinates of particles were recorded in order to calculate the dynamical observables relevant to the present study.
3 Results
3.1 Inter-particle adhesion strength regulates boundary front dynamics
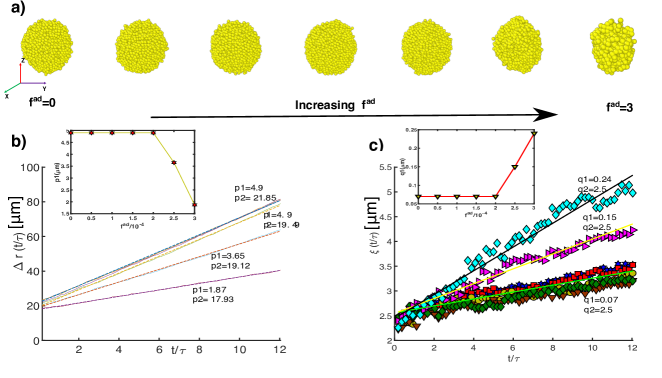
Due to advancement in imaging modalities, boundary front dynamics of dense 3D aggregates such as in tumor cell collectives can be imaged 29, 30. The dynamical evolution of the boundary front is a collective observable, which as we show depends on the complex interplay between systematic interactions and active processes. In the present case, the boundary front dynamics is regulated by growth, division and death (active processes) and inter-particle adhesion (systematic contribution). Figure 1a shows snapshots of ensembles of simulated 3D dense active particle aggregates at fixed time for increasing values of inter-particle adhesion strength, , from left to right. The aggregate snapshots at inter-particle adhesion strengths, and , show gradually increasing 3D interface roughness with smoother aggregate boundary at low values of . For and , the aggregate boundary looks visually grainy. To probe the onset of roughness driven by increasing inter-particle adhesion strength, we first quantified the average boundary front dynamics using,
| (5) |
where is the aggregate radius, is the number of boundary particles at time and is the aggregate center for a total of particles. |..| denotes the absolute sign. As expected for a system with expanding number of particles, Figure 1b shows the time dependent boundary growth () for and (top to bottom). The boundary expansion is sensitive to the inter-particle adhesion strength with similar dynamics at and marked differences starting to emerge for and . The boundary expansion is linear in time and is well fit by a linear function of the form where and are fit coefficients. corresponding to approximately have the same (p1, p2) values (i.e p1 and p2 are 4.9 and 21.85 respectively). For higher inter-particle adhesion strengths and , (p1, p2) values are (4.9, 19.49), (3.65, 19.12) and (1.87, 17.93) respectively. As evident from the inset figure 1b for values as function of inter-particle adhesion strength (), the boundary expansion of the aggregate at is roughly three times suppressed compared to . These results show that on increasing , the spatial expansion of the aggregate is suppressed indicating that there is an interplay between systematic interactions and active processes.
3.2 Roughness of the dense aggregate is enhanced when radial and transverse motions are balanced
The time dependent boundary expansion, , discussed above gives an average picture of the surface dynamics but does not capture the fluctuations. The individual particle scale origin of fluctuations on the boundary front are of extreme relevance in the context of tumor progression and wound healing 31 in addition to the rich physics that underlie aggregate growth in view of the surface roughness 32. Hence, we quantified the fluctuations of the aggregate boundary which we refer to as “roughness”, . The aggregate roughness, , was calculated using,
| (6) |
where is the distance of the boundary particle from aggregate center (). The 3D surface roughness increases linearly with time as the active particle aggregate spatially expands into the highly viscous medium at all values of inter-particle adhesion strength. We quantify the time evolution of the surface roughness () at multiple values of the inter-particle adhesion strength and in Figure 1c. By fitting to a linear trendline , we extract the roughness co-efficients . The surface roughness co-efficients are approximately the same when and as evident from (q1, q2) values (i.e q1 and q2 are 0.07 and 2.5 respectively). As the adhesion strength between active particles increases to and , a marked uptick in the surface roughness is observed with (q1, q2) values equal to (0.15,2.5) and (0.24,2.5) respectively (see inset figure 1c for the dependence of on ). We will show that the enhanced aggregate roughness for inter-particle adhesion strength beyond is a nontrivial consequence of the dynamics of active particles at the surface of the 3D aggregate. Considering that the interface growth is driven by self generated particle flux, the relation between statistical properties of particle displacements and surface roughness is not well known. As we explain below, we relate the statistics of individual active particle displacements to the time evolution of the surface roughness.
3.3 Marked differences in radial and transverse individual particle dynamics suppresses 3D surface roughness
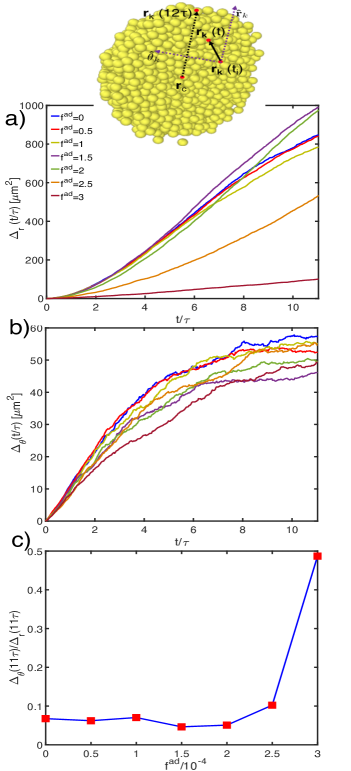
To understand the enhanced surface roughness for beyond , we focus on the displacement of individual particles located at the aggregate boundary. We noted previously that the dramatic variations in the particle dynamics between the core and periphery of the aggregate 19, 21, is a consequence of active processes being manifested predominantly on the surface of the aggregate. Consequently, we calculated the radial MSD () and transverse MSD () for particles whose distance from the aggregate center was greater than thus selecting for particles at the boundary. We define the transverse MSD () as,
| (7) |
where is the transverse component of the displacement, (i.e perpendicular to the radial direction given by the vector ) (see inset of figure 2a for a schematic). Here, and trajectories of particles were recorded between and in Eq. (7) is summed and averaged over all active particles at a distance from the aggregate center greater than . Similarly, we define radial MSD () as,
| (8) |
where is the radial component (parallel to the radial direction) of the displacement, (see inset of figure 2a for a schematic). The ensemble averaged radial and transverse mean-squared displacements are shown in Figures 2a and 2b respectively for and . Together, the two components of the mean-squared displacements reveal salient features of the particle dynamics on the surface of the 3D aggregate - (a) decreases considerably for (see main panel of 2a), (b) Inter-particle adhesion strength has no prominent effect on the transverse mean-squared displacement. To quantify the relative contributions of the radial versus transverse particle movements in determining the surface roughness, we considered the ratio - () - between transverse and radial MSDs (Figure 2c). The MSD ratio is roughly constant and small at , indicating that at low inter-particle adhesion strengths radial displacements outpaces transverse displacements. However, dramatically increases beyond with the ratio approximately an order of magnitude higher at compared to . For , is whereas is for . The larger ratio of the mean-squared displacements imply that the magnitude of transverse displacements become comparable to radial displacements in the regime of high inter-particle adhesion strength. This observation in the context of active particle aggregates is in agreement with polymeric systems the roughness of the surface increases when the transverse dynamics and radial dynamics are comparable 33.
The emergence of comparable radial and transverse displacements at the surface of 3D aggregate can be anticipated through a physical argument. Aggregate boundary growth () is strongly governed by particle growth and division as it enables the radial expansion of the aggregate. As the aggregate expansion is suppressed for (see Figure 1b) we surmise that the the relative contribution of systematic interactions as compared to active processes increase. Hence, transverse and radial displacements become comparable , leading to enhanced 3D surface roughness.
3.4 Heterogeneity in the orientation of radial displacements determine surface roughness
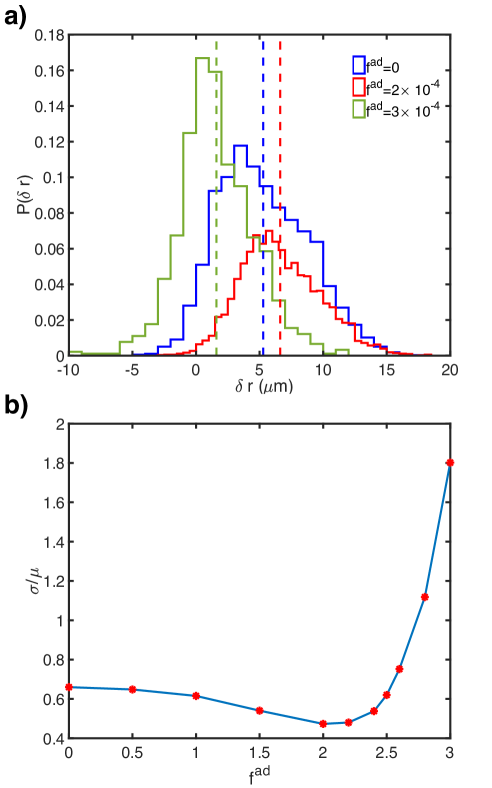
Given the marked dependence of the radial MSD on inter-particle adhesion strength (Fig. 2a), we delved further into the statistical properties of active particle radial displacements and how surface roughness arises from variations in the radial displacements of the active particles at the periphery of the 3D aggregate. How the spatio-temporal variations in the radial displacements of the particles at the 3D aggregate surface, what we refer to as the heterogeneity in radial displacements, relates to the surface roughness is not well known. To probe the aggregate surface fluctuations as motivated by our hypothesis, we calculated the radial component of displacements () defined as, . Here, is a unit vector pointing from the center of the aggregate radially outward. The probability distribution, , of radial displacement is calculated for all particles whose distance from the aggregate center was greater than , selecting for boundary particles. We compare the probability distribution of the radial displacements in Figure 3a for and . Note that in the x-axis, negative values of the radial displacement indicates particle movement towards the core while positive values indicate outward radial movement away from the center of the aggregate. The mean () of P() for is considerably smaller than or . The reduction in the mean radial displacement is due to a marked shift in the probability distribution towards negative values. Consequently, at higher inter-particle adhesion strengths, particles on the surface of the aggregate can either move outwards (away from the center; with positive radial movement ) or inwards (towards the core; with negative ) with comparable probability. To further quantify the heterogeneity in the radial displacements, we calculated the standard deviation () or the spread of the distribution with changing inter-particle adhesion strength. Surprisingly, the standard deviation does not show a dependence on the inter-particle adhesion strength implying that the variability in the active particle radial displacement by itself is not the main driver of surface roughness. However, the coefficient of variation () of as a function of , is strongly enhanced at inter-particle adhesion strength (see Fig. 3b). Consistent with increasing roughness (Fig. 1c), the coefficient of variation in is higher with increasing inter-particle adhesion strength. Therefore, the roughness increases considerably on increasing beyond due to the heterogeneity in the orientation of radial particle displacements - outward vs inward with respect to the core of the active particle aggregate.
4 Conclusion
Surface dynamics of growing active matter aggregates is of crucial significance in understanding tumor invasion, wound healing as well as in furthering our understanding of interfacial stochastic growth. In this study, using a three dimensional active particle model, we delineated the role of particle-particle adhesion strength () on aggregate boundary expansion and roughness. Our study reveals that the inter-particle adhesion strength controls the aggregate surface roughness by regulating the relative contributions of radial and transverse of active particle movements on the periphery of expanding 3D aggregates. As inter-particle adhesion strength increases, the radial component of particle motion is significantly suppressed as observed from the reduced radial expansion of the 3D aggregate. The reduction in activity causes the systematic interactions to be prominent, leading to transverse and radial displacements being comparable. Subsequently, at high inter-particle adhesion strengths, particles at the 3D periphery can undergo radial displacements towards the core as well as radially outward thereby enhancing the surface roughness of the aggregate.
The observation that roughness is controlled by the competition between radial and transverse components of particle motion has been reported in polymer grafted colloidal assemblies 33. The emergence of a similar underlying principle in active matter systems as compared to conventional polymeric systems might pave way to the discovery of universal principles underlying the collective dynamics of active matter. The problem of active particle collectives expanding into a highly viscous medium provides a fascinating context for future studies into stochastic interface growth with particular relevance to biological systems such as tumor spheroids, organoids and bacterial aggregates.
5 Acknowledgement
We would like to thank Prof. D. Thirumalai for discussions on the manuscript. We would also like to thank Xin Li and Himadri Samanta for their inputs during the course of this work. This work was supported by grants from the National Science Foundation (Grant Nos. PHY 17-08128 and PHY-1522550). AMK acknowledges support from start up funding at the College of Science and Mathematics, Augusta University.
6 Appendix
References
- Ramaswamy 2010 Ramaswamy, S. The mechanics and statistics of active matter. Annu. Rev. Condens. Matter Phys. 2010, 1, 323–45
- Marchetti et al. 2013 Marchetti, M. C.; Joanny, J.-F.; Ramaswamy, S.; Liverpool, T. B.; Prost, J.; Rao, M.; Simha, R. A. Hydrodynamics of soft active matter. Reviews of Modern Physics 2013, 85, 1143
- Gompper 2020 Gompper, G. e. a. The 2020 motile active matter roadmap. J. Phys.: Condens. Matter 2020, 32, 193001
- Bernheim-Groswasser et al. 2018 Bernheim-Groswasser, A.; Gov, N.; Safran, S.; Tzlil, S. Living matter: mesoscopic active materials. Adv Materials 2018, 30, 1707028
- Vicsek and Zafeiris 2012 Vicsek, T.; Zafeiris, A. Collective motion. Phys. Rep. 2012, 517, 71–140
- Janssen 2019 Janssen, L. Topical Review: Active Glasses. Journal of Physics: Condensed Matter 2019, 31
- Ludovic et al. 2019 Ludovic, B.; Flenner, E.; Szamel, G. Glassy dynamics in dense systems of active particles. Journal of Chemical Physics 2019, 150
- Vicsek et al. 1995 Vicsek, T.; Czirók, A.; Ben-Jacob, E.; Cohen, I.; Shochet, O. Novel type of phase transition in a system of self-driven particles. Physical Review Letters 1995, 75
- Maître et al. 2012 Maître, J.-L.; Berthoumieux, H.; Krens, S. F. G.; Salbreux, G.; Jülicher, F.; Paluch, E.; Heisenberg, C.-P. Adhesion Functions in Cell Sorting by Mechanically Coupling the Cortices of Adhering Cells. Science 2012, 338, 253–256
- Friedl and Mayor 2017 Friedl, P.; Mayor, R. Tuning Collective Cell Migration by Cell-Cell Junction Regulation. Cold Spring Harb Perspect Biol 2017, 9, a029199
- Pascalis and Etienne-Manneville 2017 Pascalis, C.; Etienne-Manneville, S. Single and collective cell migration: the mechanics of adhesions. Molecular Biology of the Cell 2017, 28
- Wang et al. 2020 Wang, Z.; Wang, Z.; Li, J.; Tian, C.; Wang, Y. Active colloidal molecules assembled via selective and directional bonds. Nature Communications 2020, 11
- Kardar et al. 1986 Kardar, M.; Parisi, G.; Zhang, Y.-C. Dynamic Scaling of Growing Interfaces. Phys. Rev. Lett. 1986, 56
- Allen and Waclaw 2019 Allen, R.; Waclaw, B. Bacterial growth: a statistical physicist’s guide. Rep. Prog. Phys. 2019, 82(1)
- Podewitz et al. 2016 Podewitz, N.; Jülicher, F.; Gompper, G.; Elgeti, J. Interface dynamics of competing tissues. New J. Phys. 2016, 18
- Williamson and Salbreux 2018 Williamson, J.; Salbreux, G. Stability and Roughness of Interfaces in Mechanically Regulated Tissues. Phys. Rev. Lett. 2018, 121
- Patteson et al. 2018 Patteson, A.; Gopinath, A.; Arratia, P. Living matter: mesoscopic active materials. Nat. Commun. 2018, 9, 5373
- Risler et al. 2015 Risler, T.; Peilloux, A.; Prost, J. Homeostatic Fluctuations of a Tissue Surface. Phys. Rev. Lett. 2015, 115
- Malmi-Kakkada et al. 2018 Malmi-Kakkada, A. N.; Li, X.; Samanta, H. S.; Sinha, S.; Thirumalai, D. Cell Growth Rate Dictates the Onset of Glass to Fluidlike Transition and Long Time Superdiffusion in an Evolving Cell Colony. Physical Review X 2018, 8, 021025
- Malmi-Kakkada et al. 2019 Malmi-Kakkada, A.; Li, X.; Sinha, S.; Thirumalai, D. Dual Role of Cell-Cell Adhesion In Tumor Suppression and Proliferation. arXiv preprint arXiv:1906.11292 2019,
- Sinha et al. 2020 Sinha, S.; Malmi-Kakkada, A. N.; Li, X.; Samanta, H. S.; Thirumalai, D. Spatially heterogeneous dynamics of cells in a growing tumor spheroid: Comparison between Theory and Experiments. Soft Matter 2020, 16, 5294–5304
- Sinha and Thirumalai 2020 Sinha, S.; Thirumalai, D. Self-generated persistent random forces drive phase separation in growing tumors. The Journal of Chemical Physics 2020, 153, 201101
- Samanta et al. 2020 Samanta, H. S.; Sinha, S.; Thirumalai, D. Far from equilibrium dynamics of tracer particles embedded in a growing multicellular spheroid. arXiv preprint arXiv:2003.12941 2020,
- Stevenson and Wolynes 2008 Stevenson, J.; Wolynes, P. On the surface of glasses. Journal of Chemical Physics 2008, 129(23)
- Drasdo and Höhme 2005 Drasdo, D.; Höhme, S. A single-cell-based model of tumor growth in vitro: monolayers and spheroids. Physical biology 2005, 2, 133
- Schaller and Meyer-Hermann 2005 Schaller, G.; Meyer-Hermann, M. Multicellular tumor spheroid in an off-lattice Voronoi-Delaunay cell model. Physical Review E 2005, 71, 051910
- Purcell 1977 Purcell, E. M. Life at low Reynolds number. American journal of physics 1977, 45, 3–11
- Irving and Kirkwood 1950 Irving, J.; Kirkwood, J. G. The statistical mechanical theory of transport processes. IV. The equations of hydrodynamics. The Journal of chemical physics 1950, 18, 817–829
- Valencia et al. 2015 Valencia, A. M. J.; Wu, P.-H.; Yogurtcu, O. N.; Rao, P.; DiGiacomo, J.; Godet, I.; He, L.; Lee, M.-H.; Gilkes, D.; Sun, S. X.; Wirtz, D. Oncotarget 2015, 6, 43438
- Padmanaban et al. 2019 Padmanaban, V.; Krol, I.; Suhail, Y.; Szczerba, B. M.; Aceto, N.; Bader, J. S.; Ewald, A. J. E-cadherin is required for metastasis in multiple models of breast cancer. Nature 2019, 573, 439–444
- Brú et al. 2003 Brú, A.; Albertos, S.; Subiza, J. L.; García-Asenjo, J. L.; Brú, I. The universal dynamics of tumor growth. Biophysical journal 2003, 85, 2948–2961
- Farrell et al. 2017 Farrell, F. D.; Gralka, M.; Hallatschek, O.; Waclaw, B. Mechanical interactions in bacterial colonies and the surfing probability of beneficial mutations. Journal of The Royal Society Interface 2017, 14, 20170073
- Asai et al. 2018 Asai, M.; Cacciuto, A.; Kumar, S. K. Surface fluctuations dominate the slow glassy dynamics of polymer-grafted colloid assemblies. ACS central science 2018, 4, 1179–1184