YouTubing at Home: Media Sharing Behavior Change as Proxy for Mobility Around COVID-19 Lockdowns
Abstract.
Compliance with public health measures, such as restrictions on movement and socialization, is paramount in limiting the spread of diseases such as the severe acute respiratory syndrome coronavirus 2 (also referred to as COVID19). Although large population datasets, such as phone-based mobility data, may provide some glimpse into such compliance, it is often proprietary, and may not be available for all locales. In this work, we examine the usefulness of video sharing on social media as a proxy of the amount of time Internet users spend at home. In particular, we focus on the number of people sharing YouTube videos on Twitter before and during COVID19 lockdown measures were imposed by 109 countries. We find that the media sharing behavior differs widely between countries, in some having immediate response to the lockdown decrees – mostly by increasing the sharing volume dramatically – while in others having a substantial lag. We confirm that these insights correlate strongly with mobility, as measured using phone data. Finally, we illustrate that both media sharing and mobility behaviors change more drastically around mandated lockdowns, and less so around more lax recommendations. We make the media sharing volume data available to the research community for continued monitoring of behavior change around public health measures.
1. Introduction
The COVID19 pandemic has brought drastic changes in people’s lives around the world. With respect to online activities and usage of the Internet, people have turned to social media and other networking and messaging platforms for socialization, networking, sharing and consumption of content (Arora et al., 2020; Böttger et al., 2020). In particular, during the first COVID19 lockdown (Q2-Q3 2020), popular social platforms such as Twitter (Iqbal, 2020b), Facebook (Iqbal, 2020a), and YouTube (Iqbal, 2020c), saw an increase in daily and monthly active users (Chaffey, 2020; Fischer, 2020), with YouTube and Facebook-related content being among the top shared (Böttger et al., 2020; Kemp, 2020). Such large changes in social media use may be not only due to increased interest, but indeed due to the physical constraints of the restrictive measures taken by the governments worldwide.
Currently, lively research is being done around misinformation that is possibly spreading among the above channels, affecting health-related beliefs and behaviors of their audience (Cinelli et al., 2020; Yang et al., 2020). However, in the unique circumstances of physical lockdowns, media consumption and sharing may be a sign of another health-related behavior: social and physical isolation. Compliance with the social distancing measures is critical in controlling the spread of COVID19 (European Centre for Disease Prevention and Control, 2020), and alternative data sources have been proposed to track it, including mobile phone GPS and traffic congestion data (Kuiper et al., 2020). Social media may be another such resource. Already, previous studies of social media have found daily and weekly periodicity, indicating shifts in check-in and sharing behavior around different activities (Hasan et al., 2013). Small-scale studies are already being published for using social media posts to track individuals who may be associated with the spread of the disease (Bisanzio et al., 2020; Zeng et al., 2021). In this work, we propose to use a large language- and space-agnostic collection of YouTube video sharing on Twitter as another tool for measuring population behavior around the social distancing measures.
Beyond monitoring the activity of users on separate platforms, studying cross-platform posting offers unique insights into users’ behavior, as it indicates higher engagement on multiple platforms. Given that such behavior is more time-consuming, and requires (higher) users’ attention to view the video on YouTube and share it on Twitter, it could reveal tendencies of users with respect to daily schedules such as working vs. resting hours, etc. Further, it is an act of social or “communal” video co-consumption, which can provide insights into community or group-focused video sharing and diffusion. Finally, technically Twitter stream provides an easier way to monitor engagement of users with YouTube videos, and to model those users through their posting history, than building crawling engines for both YouTube and Twitter and handling API-related constraints for both platforms.
Concretely, in this paper, we use a dataset of 390 million Twitter posts mentioning YouTube videos spanning the period from July 2019 to September 2020. After geo-locating the users of these posts, we select 109 countries which have had a COVID19-related social distancing recommendation or mandate. We find that, indeed, the posting trend shifts dramatically around government measures, although the precise timing may differ, depending on the peculiarities of each government’s handling of the pandemic. We also find that these changes in media sharing have a strong negative relationship with the phone-based mobility data, suggesting social media may provide valuable insights, especially where such mobility data is not available.
In particular, we make the following contributions:
-
•
We are the first to study cross-platform video posting behavior and how COVID19-related lockdowns may have impacted it.
-
•
We study this behavior worldwide for 109 countries, and provide case studies of countries with different governmental actions around the pandemic.
-
•
We investigate if the country-specific changes in media sharing behavior can be used as a proxy for the detection of reduced mobility of its residents.
-
•
Finally, we provide to the research community a unique dataset with daily aggregated per-country media sharing statistics in order to encourage reproducibility and future research of health-related behaviors111https://github.com/ymejova/yt-tw-covid.
2. Background & Related Work
YouTube on Twitter. Twitter, as a social media platform, is frequently used to disseminate various types of content produced and published in other platforms, such as news, photos, videos, etc. Such cross-platform data have been used to better understand user engagement with YouTube content, predict the extent of its diffusion, as well as to profile its viewers. For example, Christodoulou et al. (Christodoulou, George and Georgiou, Chryssis and Pallis, George, 2012) studied Twitter users and how their properties impact the popularity and diffusion of YouTube videos. Several papers have studied the problem of finding the best Twitter users to promote YouTube videos to increase engagement and viewership of said videos (Deng et al., 2015; Yan et al., 2014, 2015). Furthermore, other papers investigated the phases that a video goes through with respect to popularity (proxied by viewership), by building models to predict popularity of videos using power-law fitting (Yu et al., 2015). In addition, characteristics of YouTube videos shared on Twitter (Abisheva et al., 2014), as well as complex graph features (Yu et al., 2014) were employed to model video popularity. In this work, we consider a large dataset of YouTube links diffused via Twitter posts across over a hundred countries around the world, crucially capturing the sharing behavior before and during the rise of COVID19 in the early 2020.
Impact of COVID19 on usage of online platforms. COVID19 has had a great impact on many aspects of our offline and online lives. In relation to the focus of this paper, COVID19 has affected the intensity and frequency with which we use online platforms, including social media and digital devices. Recent studies have measured these changes by focusing on different aspects of our online world. For example, Lutu et al. (Lutu et al., 2020) performed a characterization of the impact that the pandemic had on the traffic processed by a mobile network operator, finding that mobile traffic was reduced due to users’ reduced mobility during lockdown. Also, Bottger et al. (Böttger et al., 2020) studied how the Facebook Edge Network reacted to COVID19 and the traffic induced by users, which was found to be higher during and after lockdown was imposed in different countries; in many cases this increase was due to higher video consumption. Finally, Feldmann et al. (Feldmann et al., 2020) studied how being under lockdown affected various aspects of internet traffic around the world. On the other hand, very recent studies looked into COVID19-related information spreading through various social media platforms. For example, Cinelli et al. (Cinelli et al., 2020) studied how (mis)information related to COVID19 spreads on Twitter, Instagram, YouTube, Reddit and Gab, as well as differences in the diffusion of information from questionable and reliable sources on each platform. Li et al. (Li et al., 2020) studied popular YouTube videos related to COVID19 and identified that over 25% of such videos contained misinformation regarding COVID19. In this work, not only do we find that the focus on COVID19-related videos increases around the onset of lockdown measures, but also that sharing of other content also markedly increases, pointing a behavior shift beyond attention to the ongoing events. Thus, we consider the media sharing as a proxy of offline behavior, and specifically we compare this data to mobility.
Social media and mobility. In the previous decade, the proliferation of mobile technology has provided researchers with unprecedented fine-grained data on human mobility, often coming from phone records or large internet platforms, which has been combined with more traditional sources such as air traffic and public transit data. Geo-tagged social media posts then have been used as a way to enrich the existing mobility information, for example by annotating movement by content associated with it (Wu et al., 2015) or explaining traffic events in a city (Wu et al., 2016). Quercia et al. (Quercia et al., 2014) use Flickr photos as proxies of beauty to measure “happiness” of trajectories through a city. However, going beyond annotation, attempts have been made to derive mobility data directly from the social media activity, such as international and national travel flows networks (Barchiesi et al., 2015; Beiró et al., 2016) or local commuting patterns (McNeill et al., 2017). This information then can be used to track disease (Kraemer et al., 2018), migration patterns of refugees (Hübl et al., 2017) or as a testbed for building mobility prediction models (Feng et al., 2018). Recently, attempts have been made to use Twitter data for tracking the spread of COVID19. For instance, Bisanzio et al. (Bisanzio et al., 2020) correlated the posting behavior of 161 users with COVID19 cases in locales they visited, while Zeng et al. (Zeng et al., 2021) used geo-tagged tweets to estimate mobility of the U.S. state of South Carolina. However, the size of the dataset presented in this paper allows for a much larger view of the interaction between COVID19-related measures and media consumption. In the pages below, we both quantify the relationship between media sharing and various stages of lockdowns, and discuss several case studies illustrating the complex nature of such data. Also, we provide additional visualizations and aggregated data to the research community.
| Twitter/YouTube collection | |
|---|---|
| Duration | 459 days (06/19/2019-09/20/2020) |
| Posts (tweets) | 390,002,678 |
| Unique Locations | 8,436,027 |
| Countries | 249 |
| Languages | 66 |
| COVID19 Policy data (Oxford’s Coronavirus Response) | |
| Duration | 276 days (01/01/2020-10/01/2020) |
| Countries | 185 |
| Lockdown states | 3 |
| Mobility data (Apple Mobility Trends) | |
| Duration | 231 days (01/14/2020-09/01/2020) |
| Countries | 63 |
| Mobility states | driving, walking, transit |
| Rank | Country | % of tweets |
|---|---|---|
| 1 | USA | 25.24 |
| 2 | Japan | 14.47 |
| 3 | Great Britain | 5.19 |
| 4 | Brazil | 5.11 |
| 5 | France | 4.04 |
| 6 | India | 3.53 |
| 7 | Spain | 2.76 |
| 8 | Italy | 2.60 |
| 9 | Canada | 2.16 |
| 10 | Mexico | 1.91 |
3. Data
In this section, we describe the datasets used in the present study, along with preprocessing and selection steps. First, we detail our efforts to build the Twitter & YouTube dataset (Sec. 3.1). Then, we briefly describe the extraction of lockdown dates from the Oxford COVID19 regulations data (Sec. 3.2). Finally, we conclude with a description of the Apple mobility dataset (Sec. 3.3). The various datasets used are summarized in Table 2.
3.1. Twitter & YouTube Data
Collection. This dataset was collected using the Twitter Streaming API with queries “youtube” and “youtu.be” (a popular shortened URL for the platform). Besides the query, no other constraint was applied. The collection took place from June 19, 2019 to September 20, 2020, capturing at least a half of year before COVID19 is discovered, and several months of worldwide lockdowns in 2020. The captured information includes tweet text, user information, metadata about posting time, and link to the YouTube video. This collection resulted in 390,002,678 tweets.
Preprocessing. We then geo-locate the users in this dataset using the Location field of their profiles. We use the GeoNames location database to match the user-specified free-text location strings to a populated location.222The optimized code for geolocation can be found at https://sites.google.com/site/yelenamejova/resources We are able to locate 4,055,292 out of 8,436,027 unique location strings present in the data, which covers 165,520,903 tweets (42.4% of all).
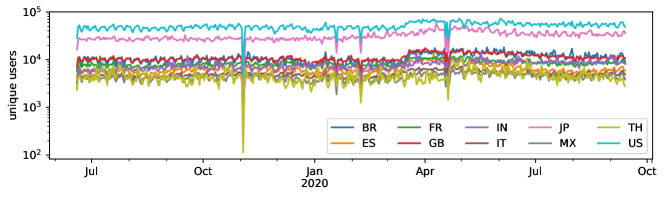
Figure 1 shows daily statistics on unique users of the top 10 countries, sorted by volume of posts (also Table 2). We can see a handful of points in time when, due to technical difficulties, the collection was disrupted. Also, we can already observe that 1) there is a weekly periodicity of users’ behavior in sharing YouTube videos on Twitter, 2) there was a shift in posting frequency between March and May 2020, and 3) USA and Japan have significantly higher posting activity across time compared to the other countries.
Next, we consider three metrics for data analysis: raw number of posts per day, unique number of users, and unique videos (figures are omitted due to space). As expected, all three metrics have skewed distributions across countries. For example, the median for daily number of posts, users and videos is 82, 51 and 71, respectively, but the mean is 1491, 892 and 948, respectively. Therefore, we apply an activity threshold and keep countries with activity (in unique users) above the median of all countries, and across all available dates. After applying this filter, from 249 countries, we are left with 125 countries. Furthermore, the three available metrics we have at hand (i.e., number of posts, unique users, and unique videos) are highly correlated with each other: average Spearman correlation between users and videos across all countries is 0.74, and between users and posts is 0.85. Given that the number of posts or videos involved in this sharing activity can be skewed by abnormal or extreme posting by any particular user, for the rest of the study, we focus on unique users posting per day. Finally, we linearly interpolate the values for the days in which the collection went down. We dub the resulting time series as the dataset.
3.2. COVID19 Response Data
Collection. We use the University of Oxford’s Coronavirus Government response tracker (Blavatnik School of Government, 2020; Thomas et al., 2020) to gather the indicator variables for the levels of lockdown in the above countries. It covers the time period from January 1, 2020 to October 2, 2020. We use the field “C6: Stay at home requirements”, which “Records orders to “shelter-in-place” and otherwise confine to the home”. This field has an ordinal scale of several levels: L0: no measures, L1: recommend not leaving house, L2: require not leaving house with exceptions for daily exercise, grocery shopping, and ’essential’ trips, and L3: require not leaving house with minimal exceptions. Using the above scale, we define lockdown () as the period of time that a country was requiring its residents to stay at home unless (minimal) exceptions apply (i.e., L2 or L3). We also consider the days under L1 as recommended lockdown, and we use this distinction when appropriate.
Preprocessing. The data regarding the lockdown and other related information on COVID19 were reported for 185 countries, covering all 125 countries in our data. For each country, we find the starting date when it entered in lockdown mode, i.e., L2 or L3 (from here on, when referring to L2 we include both states), and the ending date , i.e., when the country entered L0 or L1. In case more than one starting and ending dates are detected, we apply a buffer time to merge consecutive lockdown periods (we experimented with up to 28, but results changed minimally). The median country went through 52 days of lockdown, which lasted for up to 107 days for 75% of the countries. About 10% of countries have remained in a lockdown mode for the whole duration of observation (200 days), while 41 countries (i.e., 33%) had 0 days in lockdown. The latter countries either did not define any stay at home guidelines (L0, 9 countries) or did not provide any COVID19 data (5 countries), and where subsequently removed. Finally, we removed 2 countries which had enforced fewer than 30 days of lockdown. These steps resulted in two lists of countries: 82 that had a (L2) lockdown, and a more inclusive one of 109 countries that had at least a lockdown recommendation (L1).
3.3. Mobility Data
Collection & Preprocessing. Finally, in order to explore the relationship between media sharing () and mobility (), we utilize the Mobility Trends Report published by Apple, which “reflects requests for directions in Apple Maps”333https://covid19.apple.com/mobility. The report offers normalized mobility activity in three categories: driving, walking, and transit. For our analysis, we use the walking estimates as the finest of granularity levels. In the end, out of the 109 countries which have passed the activity and COVID19 lockdown thresholds, 56 had mobility data (signal ) provided by the Mobility Trends Report.
4. Media Sharing About COVID19
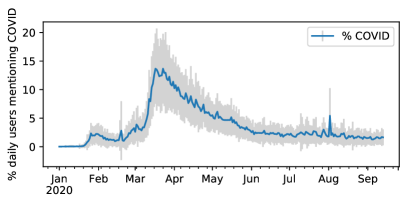
We begin by examining the extent to which the increase in shared media () can be directly attributed to conversations about the pandemic, or if other topics were also at play. We use a dictionary of 590 keywords defined by Twitter for its multilingual COVID19 stream444https://developer.twitter.com/en/docs/labs/covid19-stream/filtering-rules, since these keywords indicate interest in the topic of the pandemic. Figure 2(a) shows the country macro-average of the daily unique users in our dataset who are mentioning COVID19-related keywords. Such spike on Twitter and Facebook-related activity has also been reported in recent works (Yang et al., 2020). On average, the maximum contribution of COVID19-related posting is 15%, and appears to happen in late March 2020, when most lockdowns started across many countries. The spike tends to be higher for countries having fewer users, with Spearman () between average volume of tweets vs. maximum contribution of COVID19-related posting.
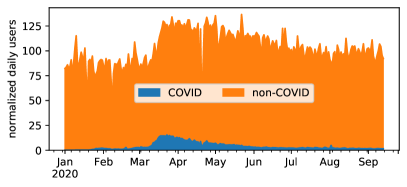
Interestingly, Figure 2(b) shows that the volume increase around the second half of March is not only due to the posting around COVID19. In this figure, we normalize the volume of posting in each country by dividing it by the volume on the first day and multiplying by 100, such that the volume increase is standardized. We find that, despite a rise in COVID19-related volume (in blue), there is additional volume (in orange) not attributable to the interest in pandemic.
To check whether topics other than COVID19 are mentioned in these posts, we take the U.S. as an example (which also has the highest volume per country), and compute the top terms mentioned in the two months before and two months during the lockdown. The top terms, shown in Table 3, show that, even though COVID19-related keywords emerge in the topics during the lockdown (e.g., coronavirus and covid), others remain, including music, mentions of President Trump, and other general terms like love, check, and day. Thus, we postulate that the increased media sharing behavior is not wholly explained by the increased interest in the pandemic, but includes the habitual use of the platform.
| Rank | Popular Word Before | Popular Word During | Rank | Popular Word Before | Popular Word During |
|---|---|---|---|---|---|
| 1 | via (28.13%) | via (27.03%) | 11 | like (1.18%) | covid (1.56%) |
| 2 | youtube (5.25%) | youtube (5.13%) | 12 | love (1.14%) | got (1.51%) |
| 3 | video (5.10%) | video (4.85%) | 13 | one (1.04%) | trump (1.42%) |
| 4 | amp (2.51&) | amp (2.37%) | 14 | full (1.00%) | like (1.05%) |
| 5 | new (2.35%) | live (2.20%) | 15 | de (0.95%) | one (1.01%) |
| 6 | official (2.31%) | new (2.02%) | 16 | coronavirus (0.95%) | love (1.80%) |
| 7 | watch (2.11%) | watch (2.12%) | 17 | song (0.94%) | de (0.98%) |
| 8 | live (2.09%) | official (2.29%) | 18 | check (0.91%) | song (0.98%) |
| 9 | trump (1.83%) | coronavirus (1.80%) | 19 | time (0.82%) | check (0.93%) |
| 10 | music (1.71%) | music (1.56%) | 20 | day (0.81%) | day (0.92%) |
5. Media Sharing Around COVID19 Lockdowns
5.1. Hourly Sharing Behavior Change Before and During Lockdown
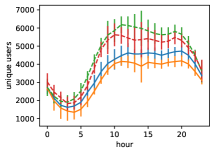
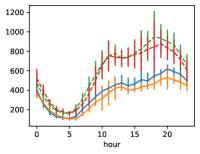
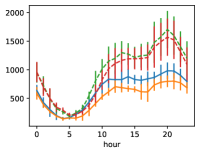
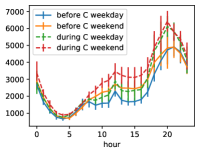
Focusing specifically on the posting behavior before and after lockdown was announced () by the respective governments of the studied countries, we first examine the hourly periodicity of the posting behavior. Figure 3 shows examples of unique users posting during the hours of the day in four countries, separately for weekdays and weekends, and before and during COVID19 lockdowns. Here, we consider 2 months before and 2 months after the lockdown announcements, average the posting volume over the days, and show standard deviation in vertical bars. Not only do we see a marked rise in posting volume during L2 lockdowns, but also a shift in posting patterns, though differently for each country. For instance, in U.S., the posting rate in the morning increases, compared to pre-COVID19 levels, whereas in Brazil it elevates especially around evening. Also, the difference in posting between weekdays and weekends becomes less clear during lockdown (e.g., in Spain or Brazil), suggesting a similar media consumption on weekdays and weekends.
5.2. Sharing Behavior Change at the Lockdown Start
Next, we examine the change in the media sharing behavior () around the lockdown dates. As described in Sec. 3.2, we define the lockdown dates at several levels. Specifically, we consider two scenarios: (1) an L1 lockdown (with its starting date signified as ), when only a recommendation to stay at home is promoted, and (2) an L2 lockdown (with its starting date signified as ), when only essential trips are allowed. To compare the behavior change to these days, we employ change point detection on signal , using the pruned exact linear time (PELT) algorithm (Wambui et al., 2015) that detects change points through minimising a cost function over possible numbers and locations, as implemented in the python ruptures library (Truong et al., 2020). We apply this algorithm to data from each country separately, taking the 2 months before their lockdown date ( or ), and 2 months after the date, or until the studied lockdown is over (whichever comes first). Dates of detected trend change are signified as . Out of the 109 countries having L1 and/or L2, we detected a change point for 100 countries, and for the 82 countries having L2 only, we detected change point for 77 countries.
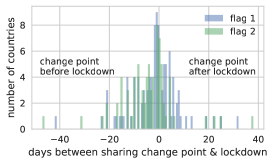
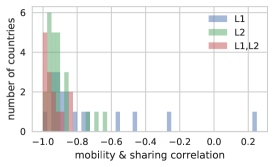
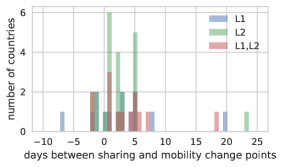
Figure 4(a) shows the frequency distribution of countries having a difference between the detected change point and the lockdown dates (i.e., - or - ), such that points below 0 indicate countries in which change point happened before the lockdown, and above 0 after lockdown. For both definitions of lockdown (L1 or L2), about half of the time the change points happened within 5 days of the lockdown (51% for L1 and 52% for L2). And, as expected, for more strict lockdown definition (L2), more change points happened before 0 (64%) than for less strict (51%).
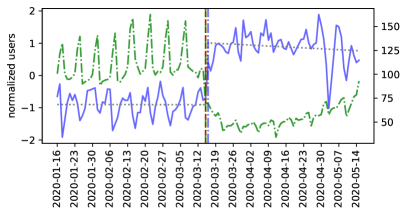
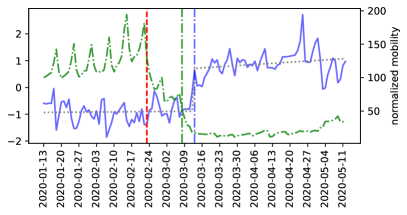
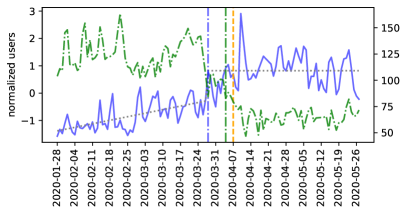
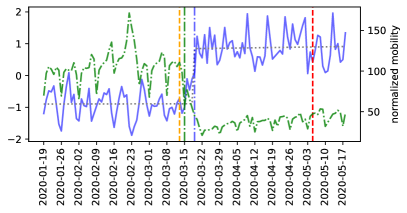
Figure 5 shows four countries exemplifying the case in which the change in behavior is detected, on the same day as the announcement (United States), before the lockdown announcement (Japan & Brazil), and after it (Italy). The readers are welcome to examine the plots for all countries at the end of this paper (Appendix A). The blue line shows the normalized sharing volume (in unique users), while the lockdown dates are shown in vertical lines – orange for L1, and red for L2. We explain the other lines in the next sections. United States (as well as Serbia, New Zealand, Spain, and others) show changes in posting behavior that correspond precisely to the lockdown announcements. In the case of the U.S., on March 16, President Trump announced “15 Days to Slow the Spread” with a series of guidelines on physical distancing and self-isolation, and recommendations to close schools and businesses (McGraw and Oprysko, 2020). Italy’s lockdown happened gradually, first quarantining 50,000 people from 11 different municipalities in the northern region on February 22, with gradual subsequent closures of regions (Dusi, 2020), until the Prime Minister Giuseppe Conte announced a country-wide quarantine on March 9 (BBC, 2020). Similarly, in Japan, Prime Minister Shinzo Abe requested that all Japanese elementary, junior high, and high schools close on February 27 (Tokyo News, 2020), and the state of emergency declaration eventually expanded to include every prefecture within the country on April 16 (Mainichi, 2020). Brazil displays a notable shift in behavior around the time of the first COVID19 related death on March 17 (Bergamo, 2020), without any official lockdowns until some of the northern cities announced the measures on May 7 (Globo, 2020). The sudden or gradual shifts in the media sharing behavior, thus, visibly happen around the measures being taken at the time of the collection gathering, but not always, as in the case of Brazil. We encourage the reader to explore these graphs for all countries, shown at the bottom of the paper.
5.3. Media Sharing as a Proxy for Mobility
Thus, we find that the media sharing behavior changes around the dates of lockdown enforcement. We hypothesize that this change reflects the physical mobility of users, and the fact that they have more time to spend watching and sharing media online. To explore the relationship between media sharing and mobility, we utilize the Apple mobility dataset () as described in Sec 3. Recall that 56 countries that have passed our selection filters appeared in this dataset.
Figure 4(b) shows the Pearson correlation between mobility and media sharing , by the lockdown situations that happened in each country: having only L1, right away into L2, and having first L1 and later L2 (L1,L2). Here, we smooth both trends using a 7-day average, in order to remove weekly periodicity (that was obvious in Figure 1). Most correlations are strongly negative, and all those less than are significant at . Interestingly, the correlation is the weakest for countries which had only L1 lockdown (the rightmost points on the graph are Slovakia (, ), Cambodia (, ), Thailand (, ), and Hong Kong (, )). This strongly suggests that mobility is inversely proportional to media sharing behavior, as captured in the dataset. Further, Figure 4(c) shows the difference in days between the change point detected in the mobility and media sharing (both raw, un-smoothed). Out of 50 countries that had a change point detected for both mobility and media sharing, 44 are within 7 days, and for most countries the change in media sharing change follows the change in mobility. The three countries having largest difference in change points (ticks in the far right of the plot) are Philippines (23), South Korea (20), and Singapore (18) – all countries close to China that took early precautions against the virus.
If we return to the countries in Figure 5, we now can examine the media sharing volume (in blue) in the contemporary context of the mobility score (green), and their respective change points (vertical lines in their respective colors). In the case of the United States, the change happens all at once, and the change points, thus, happen within 1 day of each other. The change points are a bit further apart in Brazil at 4 days, Italy at 5, and Japan at 7.
Some could argue that the identified cross-platform sharing changes were more predominant in countries with highly connected Internet users. However, when we take the correlation of mobility and media sharing computed above, and correlate it to the internet penetration in the corresponding countries (data extracted from (Internet World Stats, 2020)), we find no significant relationship (, ). This suggests that, once the countries have a minimum volume of Twitter usage, the signal can be used as a proxy for mobility irrespective of internet penetration. This is encouraging, since only 56 out of 109 originally selected countries had mobility data available, so that an alternative proxy is especially valuable for those locales where the major technology service providers do not release their data.
6. Media Sharing Behavior Change: Interrupted Time-Series Modeling
To understand whether human behavior changes significantly around the time of COVID-related lockdowns, we employ Interrupted Time Series analysis (ITS) (Bernal et al., 2017), which aims to estimate the effect of an intervention which has a well-defined starting time. Specifically, we examine both the time series of media sharing volume (), as well as the mobility data (), in order to gauge the extent of the behavior change. We employ Ordinary Least Squares (OLS) regression to model the behavior time series of the two signals using two variables: signifying time passage in days and , an indicator signifying the beginning of the intervention period. For example, modeling change in the media sharing volume around a lockdown date, in following equation:
is the volume of media sharing at the time , is the baseline volume at the beginning of the time series, is the baseline change in volume over time before the lockdown date, is the change in volume at the lockdown date, and is the trend (slope) change following the lockdown date. In this paper, we focus specifically on the , the change in behavior around the intervention. Visually, the ITS models are plotted in grey in Figure 5 for the four countries.
To capture the complexity of the lockdown situations, we again examine three groups of countries: those that only had L1, those that only had L2, and those that went from L1 to L2 (L1=¿L2). Note that for the last group of countries, we can test both lockdown dates. Additionally, since in the previous sections we found that the actual behavior change often happened some days before or after the official lockdown dates, we decided to perform ITS with 4 different types of dates: two lockdown dates ( or ), and two trend change points ( or ), on the groups of countries that each applies. As in the previous section, we select 2 months before and 2 months after the selected date, and here consider only the 54 countries with mobility data.
Table 4 shows statistics of ITS models for various scenarios. It reports the mean () and standard deviation () of the intervention point coefficient, and the model fit (), aggregated over relevant countries (). First, we observe that the coefficients are positive across all models. Note that we z-normalize the sharing volume (), making it comparable across countries. Second, strongly negative coefficients for mobility indicate a sharp decrease around the interruption dates, echoing the negative relationship between sharing volume () and mobility () we have previously established. Third, we find the model fit to be the worst for countries that had L1 lockdowns, indicating that the behavior change, both in media sharing and in mobility, are affected the least by policies merely recommending people to stay home. Further, we find similar values and model fit for the two levels of lockdowns for the L1=¿L2 countries, indicating that for such scenarios it may be difficult to discern the effect of L1 policy, as it is usually quickly followed by a more stringent one (for 75% of the countries within 2 weeks).
Finally, we make two methodological observations. We confirm that the extent of change of behavior (both in media sharing and mobility) is greater at change points than at lockdown dates, suggesting that factors other than those captured by lockdown policies – including other communication by the authorities – may have had an effect on behavior. The better fit of the ITS models in the case of mobility points to the quicker effect on this variable, and a less sudden one on media sharing, pointing to a gradual behavior change when it concerns media consumption during emergency measures. The implications in terms of attention to public messaging, adjustment in daily routine, and mental health maintenance are exciting future directions of research.
| Model | ||||
|---|---|---|---|---|
| media sharing & L1 date (L1) | 1.126 | 0.832 | 0.477 | 18 |
| media sharing & L2 date (L2) | 1.349 | 0.598 | 0.650 | 24 |
| media sharing & L1 date (L1=¿L2) | 1.158 | 0.685 | 0.652 | 14 |
| media sharing & L2 date (L1=¿L2) | 1.044 | 0.579 | 0.651 | 14 |
| media sharing & sharing change point (L1) | 1.667 | 0.439 | 0.580 | 15 |
| media sharing & sharing change point (L2) | 1.659 | 0.453 | 0.701 | 23 |
| media sharing & sharing change point (L1=¿L2) | 1.697 | 0.370 | 0.756 | 13 |
| media sharing & mobility change point (all countries) | 1.298 | 1.084 | 0.623 | 54 |
| mobility & L1 date (L1) | -48.767 | 30.435 | 0.751 | 18 |
| mobility & L2 date (L2) | -64.630 | 30.556 | 0.804 | 24 |
| mobility & L1 date (L1=¿L2) | -58.422 | 31.459 | 0.790 | 14 |
| mobility & L2 date (L1=¿L2) | -44.808 | 25.672 | 0.760 | 14 |
| mobility & mobility change point (L1) | -65.221 | 21.345 | 0.817 | 16 |
| mobility & mobility change point (L2) | -82.002 | 25.618 | 0.878 | 24 |
| mobility & mobility change point (L1=¿L2) | -53.372 | 82.838 | 0.865 | 14 |
| mobility & sharing change point (all countries) | -67.582 | 29.810 | 0.831 | 51 |
7. Discussion & Conclusions
This paper provides a large-scale evidence of individual behavioral response to the social distancing interventions taking place around the world in the early 2020. We find that media sharing behavior increased in the majority of countries during the COVID19 lockdowns. However, COVID19-related activity only accounts for 15% of the overall volume of posts. In fact, users shared with each other content on a wide range of topics apart from COVID19. Whether this change in behavior extends beyond volume, and impacts the media consumption qualitatively is a fascinating question. We are open to collaborating with researchers (as making full dataset is against Twitter Terms of Service) on exploring, for instance, the change in quality of information being shared, the kind of health advice people turn to in an emergency situation, and how users may maintain social ties and communities around co-consumption of online media.
We also established a strongly negative relationship between media sharing and mobility, however it is not certain that this relationship will endure. We find the spike in interest about COVID19 dissipates after several months, whereas the sharing volume remains elevated over time. This data provides an opportunity to study psychological adaptation during a crisis, and test theories around, for instance, emotional evanescence as individuals adjust their emotional reactions (Wilson et al., 2003), and the role of media in post-traumatic stress disorder after major events.
As far as the online behavior can be viewed as a proxy of mobility, it may be especially useful in the understanding of public compliance with the public health measures, and its implications on the spread of disease. In the post-hoc analysis of the effectiveness of government measures, online data may provide a window into individual behaviors that signify online and offline socialization, as well as interest in public health messages, which may relate to actions individuals take that may raise or lower the risk of disease contraction. Further, country-specific cultural aspects may play a role, as well as trust in or disobedience to authority, and individual’s relation to society.
There are several important limitations to our study. Not only are we limited by the users of two specific internet platforms (albeit some of the most popular ones), the adoption of these platforms is non-uniform around the world, allowing us to examine only some countries. Analysis of local platforms, such as Sina Weibo in China, may provide a better coverage. Further, as we have found, definitions of “lockdown” are highly varied, as each country presents a unique combination of local guidance, social support systems, and public messaging, which makes comparison across countries approximate. Finally, a plethora of other signals should be considered when modeling public health-related behaviors beyond lockdown measures, and future work in understanding health belief formation and the changing of action affordances will provide a fuller picture of this emergency.
In order to support repeatable and extensible research, we make country-specific daily data and additional visualizations available at https://github.com/ymejova/yt-tw-covid.
8. Acknowledgments
The research leading to these results received partial funding from the EU H2020 Research and Innovation programme under grant agreements No 830927 (Concordia). These results reflect only the authors’ view and the Commission is not responsible for any use that may be made of the information it contains.
References
- (1)
- Abisheva et al. (2014) Adiya Abisheva, Venkata Rama Kiran Garimella, David Garcia, and Ingmar Weber. 2014. Who watches (and shares) what on youtube? and when? using twitter to understand youtube viewership. In Proceedings of the 7th ACM international conference on Web search and data mining. 593–602.
- Arora et al. (2020) Anshika Arora, Pinaki Chakraborty, M. P. S. Bhatia, and Prabhat Mittal. 2020. Role of Emotion in Excessive Use of Twitter During COVID-19 Imposed Lockdown in India. Journal of Technology in Behavioral Science (2020). https://doi.org/10.1007/s41347-020-00174-3
- Barchiesi et al. (2015) Daniele Barchiesi, Helen Susannah Moat, Christian Alis, Steven Bishop, and Tobias Preis. 2015. Quantifying international travel flows using Flickr. PloS one 10, 7 (2015), e0128470.
- BBC (2020) BBC. 2020. Coronavirus: Italy extends emergency measures nationwide. BBC News (March 2020).
- Beiró et al. (2016) Mariano G Beiró, André Panisson, Michele Tizzoni, and Ciro Cattuto. 2016. Predicting human mobility through the assimilation of social media traces into mobility models. EPJ Data Science 5 (2016), 1–15.
- Bergamo (2020) Monica Bergamo. 2020. Brasil registra primeira morte por coronavírus. Folha de S.Paulo (March 2020).
- Bernal et al. (2017) James Lopez Bernal, Steven Cummins, and Antonio Gasparrini. 2017. Interrupted time series regression for the evaluation of public health interventions: a tutorial. International journal of epidemiology 46, 1 (2017), 348–355.
- Bisanzio et al. (2020) Donal Bisanzio, Moritz UG Kraemer, Isaac I Bogoch, Thomas Brewer, John S Brownstein, and Richard Reithinger. 2020. Use of Twitter social media activity as a proxy for human mobility to predict the spatiotemporal spread of COVID-19 at global scale. Geospatial health 15, 1 (2020).
- Blavatnik School of Government (2020) Blavatnik School of Government. 2020. Oxford COVID-19 Government Response Tracker. Available at https://www.bsg.ox.ac.uk/research/research-projects/coronavirus-government-response-tracker, accessed on 03 December 2020.
- Böttger et al. (2020) Timm Böttger, Ghida Ibrahim, and Ben Vallis. 2020. How the Internet Reacted to Covid-19: A Perspective from Facebook’s Edge Network. In Proceedings of the ACM Internet Measurement Conference (Virtual Event, USA) (IMC ’20). 34–41.
- Chaffey (2020) Dave Chaffey. 2020. Global social media research summary August 2020. Available at https://www.smartinsights.com/social-media-marketing/social-media-strategy/new-global-social-media-research/, accessed on 08 February 2021.
- Christodoulou, George and Georgiou, Chryssis and Pallis, George (2012) Christodoulou, George and Georgiou, Chryssis and Pallis, George. 2012. The Role of Twitter in YouTube Videos Diffusion. In Web Information Systems Engineering - (WISE), Wang, X. Sean and Cruz, Isabel and Delis, Alex and Huang, Guangyan (Ed.). 426–439.
- Cinelli et al. (2020) Matteo Cinelli, Walter Quattrociocchi, Alessandro Galeazzi, Carlo Michele Valensise, Emanuele Brugnoli, Ana Lucia Schmidt, Paola Zola, Fabiana Zollo, and Antonio Scala. 2020. The COVID-19 social media infodemic. Scientific Reports 10 (October 2020). Issue 1.
- Deng et al. (2015) Zhengyu Deng, Ming Yan, Jitao Sang, and Changsheng Xu. 2015. Twitter is Faster: Personalized Time-Aware Video Recommendation from Twitter to YouTube. ACM Trans. Multimedia Comput. Commun. Appl. 11, 2, Article 31 (January 2015), 23 pages.
- Dusi (2020) Elena Dusi. 2020. Coronavirus, in dieci comuni lombardi: 50 mila persone costrette a restare in casa. Quarantena all’ospedale milanese di Baggio. La Repubblica (February 2020).
- European Centre for Disease Prevention and Control (2020) European Centre for Disease Prevention and Control. 2020. Considerations relating to social distancing measures in response to COVID-19 – second update. ECDC (March 2020).
- Feldmann et al. (2020) Anja Feldmann, Oliver Gasser, Franziska Lichtblau, Enric Pujol, Ingmar Poese, Christoph Dietzel, Daniel Wagner, Matthias Wichtlhuber, Juan Tapiador, Narseo Vallina-Rodriguez, Oliver Hohlfeld, and Georgios Smaragdakis. 2020. The Lockdown Effect: Implications of the COVID-19 Pandemic on Internet Traffic. In Proceedings of the ACM Internet Measurement Conference (Virtual Event, USA) (IMC ’20). 1–18.
- Feng et al. (2018) Jie Feng, Yong Li, Chao Zhang, Funing Sun, Fanchao Meng, Ang Guo, and Depeng Jin. 2018. Deepmove: Predicting human mobility with attentional recurrent networks. In Proceedings of the 2018 world wide web conference. 1459–1468.
- Fischer (2020) Sara Fischer. 2020. Social media use spikes during pandemic. Available at https://www.axios.com/social-media-overuse-spikes-in-coronavirus-pandemic-764b384d-a0ee-4787-bd19-7e7297f6d6ec.html, accessed on 08 February 2021.
- Globo (2020) Globo. 2020. Belem e mais 9 cidades do Para entram em ’lockdown’; estado e o 2 do país a adotar a medida contra o coronavirus. Globo.com (May 2020).
- Hasan et al. (2013) Samiul Hasan, Xianyuan Zhan, and Satish V Ukkusuri. 2013. Understanding urban human activity and mobility patterns using large-scale location-based data from online social media. In Proceedings of the 2nd ACM SIGKDD international workshop on urban computing. 1–8.
- Hübl et al. (2017) Franziska Hübl, Sreten Cvetojevic, Hartwig Hochmair, and Gernot Paulus. 2017. Analyzing refugee migration patterns using geo-tagged tweets. ISPRS International Journal of Geo-Information 6, 10 (2017), 302.
- Internet World Stats (2020) Internet World Stats. 2020. Alphabetic List of Countries. Available at https://www.internetworldstats.com/list2.htm, accessed on 25 February 2021.
- Iqbal (2020a) Mansoor Iqbal. 2020a. Facebook Revenue and Usage Statistics (2020). Available at https://www.businessofapps.com/data/facebook-statistics/, accessed on 08 February 2021.
- Iqbal (2020b) Mansoor Iqbal. 2020b. Twitter Revenue and Usage Statistics (2020). Available at https://www.businessofapps.com/data/twitter-statistics/, accessed on 08 February 2021.
- Iqbal (2020c) Mansoor Iqbal. 2020c. YouTube Revenue and Usage Statistics (2020). Available at https://www.businessofapps.com/data/youtube-statistics/, accessed on 08 February 2021.
- Kemp (2020) Simon Kemp. 2020. Digital 2020: July Global Statshot. Available at https://datareportal.com/reports/digital-2020-july-global-statshot, accessed on 08 February 2021.
- Kraemer et al. (2018) Moritz UG Kraemer, Donal Bisanzio, RC Reiner, R Zakar, Jared B Hawkins, Clark C Freifeld, David L Smith, Simon I Hay, John S Brownstein, and T Alex Perkins. 2018. Inferences about spatiotemporal variation in dengue virus transmission are sensitive to assumptions about human mobility: a case study using geolocated tweets from Lahore, Pakistan. EPJ Data Science 7 (2018), 1–17.
- Kuiper et al. (2020) Malouke Esra Kuiper, Anne Leonore de Bruijn, Chris Reinders Folmer, Elke Olthuis, Megan Brownlee, Emmeke Barbara Kooistra, Adam Fine, and Benjamin Van Rooij. 2020. The intelligent lockdown: Compliance with COVID-19 mitigation measures in the Netherlands. Available at SSRN 3598215 (2020).
- Li et al. (2020) Heidi Oi-Yee Li, Adrian Bailey, David Huynh, and James Chan. 2020. YouTube as a source of information on COVID-19: a pandemic of misinformation? BMJ Global Health 5, 5 (2020). https://doi.org/10.1136/bmjgh-2020-002604
- Lutu et al. (2020) Andra Lutu, Diego Perino, Marcelo Bagnulo, Enrique Frias-Martinez, and Javad Khangosstar. 2020. A Characterization of the COVID-19 Pandemic Impact on a Mobile Network Operator Traffic. In Proceedings of the ACM Internet Measurement Conference (Virtual Event, USA) (IMC ’20). 19–33.
- Mainichi (2020) Mainichi. 2020. Japan to declare nationwide state of emergency amid virus spread. The Mainichi (April 2020).
- McGraw and Oprysko (2020) Meridith McGraw and Caitlin Oprysko. 2020. Inside the White House during ’15 Days to Slow the Spread’. Politico (March 2020).
- McNeill et al. (2017) Graham McNeill, Jonathan Bright, and Scott A Hale. 2017. Estimating local commuting patterns from geolocated Twitter data. EPJ Data Science 6 (2017).
- Quercia et al. (2014) Daniele Quercia, Rossano Schifanella, and Luca Maria Aiello. 2014. The shortest path to happiness: Recommending beautiful, quiet, and happy routes in the city. In Proceedings of the 25th ACM conference on Hypertext and social media. 116–125.
- Thomas et al. (2020) Hale Thomas, Noam Angrist, Emily Cameron-Blake, Laura Hallas, Beatriz Kira, Saptarshi Majumdar, Anna Petherick, Toby Phillips, Helen Tatlow, and Samuel Webster. 2020. Oxford COVID-19 Government Response Tracker. Available at https://github.com/OxCGRT/covid-policy-tracker.
- Tokyo News (2020) Tokyo News. 2020. PM Abe asks all schools in Japan to temporarily close over coronavirus. Tokyo News (February 2020).
- Truong et al. (2020) Charles Truong, Laurent Oudre, and Nicolas Vayatis. 2020. Selective review of offline change point detection methods. Signal Processing 167 (2020).
- Wambui et al. (2015) G Dorcas Wambui, Gichuhi Anthony Waititu, and Anthony Wanjoya. 2015. The power of the pruned exact linear time (PELT) test in multiple changepoint detection. Am. J. Theor. Appl. Stat 4, 6 (2015), 581–586.
- Wilson et al. (2003) Timothy D Wilson, Daniel T Gilbert, and David B Centerbar. 2003. Making sense: The causes of emotional evanescence. The psychology of economic decisions 1 (2003), 209–233.
- Wu et al. (2015) Fei Wu, Zhenhui Li, Wang-Chien Lee, Hongjian Wang, and Zhuojie Huang. 2015. Semantic annotation of mobility data using social media. In Proceedings of the 24th International Conference on World Wide Web. 1253–1263.
- Wu et al. (2016) Fei Wu, Hongjian Wang, and Zhenhui Li. 2016. Interpreting traffic dynamics using ubiquitous urban data. In Proceedings of the 24th ACM SIGSPATIAL International Conference on Advances in Geographic Information Systems. 1–4.
- Yan et al. (2014) Ming Yan, Jitao Sang, and Changsheng Xu. 2014. Mining Cross-Network Association for YouTube Video Promotion. In Proceedings of the 22nd ACM International Conference on Multimedia (Orlando, Florida, USA) (MM ’14). 557–566.
- Yan et al. (2015) Ming Yan, Jitao Sang, and Changsheng Xu. 2015. Unified YouTube Video Recommendation via Cross-Network Collaboration. In Proceedings of the 5th ACM on International Conference on Multimedia Retrieval (Shanghai, China) (ICMR ’15). 19–26.
- Yang et al. (2020) Kai-Cheng Yang, Francesco Pierri, Pik-Mai Hui, David Axelrod, Christopher Torres-Lugo, John Bryden, and Filippo Menczer. 2020. The COVID-19 Infodemic: Twitter versus Facebook. arXiv:2012.09353 [cs.SI]
- Yu et al. (2014) Honglin Yu, Lexing Xie, and Scott Sanner. 2014. Twitter-driven youtube views: Beyond individual influencers. In Proceedings of the 22nd ACM international conference on Multimedia. 869–872.
- Yu et al. (2015) Honglin Yu, Lexing Xie, and Scott Sanner. 2015. The lifecyle of a youtube video: Phases, content and popularity. In Ninth International AAAI Conference on Web and Social Media.
- Zeng et al. (2021) Chengbo Zeng, Jiajia Zhang, Zhenlong Li, Xiaowen Sun, Bankole Olatosi, Sharon Weissman, and Xiaoming Li. 2021. Spatial-temporal relationship between population mobility and COVID-19 outbreaks in South Carolina: A time series forecasting analysis. medRxiv (2021).
Appendix A Media sharing, mobility, lockdowns, and ITS model for select countries
![[Uncaptioned image]](/html/2103.14601/assets/x15.png)
![[Uncaptioned image]](/html/2103.14601/assets/x16.png)
![[Uncaptioned image]](/html/2103.14601/assets/x17.png)
![[Uncaptioned image]](/html/2103.14601/assets/x18.png)
![[Uncaptioned image]](/html/2103.14601/assets/x19.png)
![[Uncaptioned image]](/html/2103.14601/assets/x20.png)
![[Uncaptioned image]](/html/2103.14601/assets/x21.png)
![[Uncaptioned image]](/html/2103.14601/assets/x22.png)
![[Uncaptioned image]](/html/2103.14601/assets/x23.png)
![[Uncaptioned image]](/html/2103.14601/assets/x24.png)
![[Uncaptioned image]](/html/2103.14601/assets/x25.png)
![[Uncaptioned image]](/html/2103.14601/assets/x26.png)
![[Uncaptioned image]](/html/2103.14601/assets/x27.png)
![[Uncaptioned image]](/html/2103.14601/assets/x28.png)
![[Uncaptioned image]](/html/2103.14601/assets/x29.png)
![[Uncaptioned image]](/html/2103.14601/assets/x30.png)
![[Uncaptioned image]](/html/2103.14601/assets/x31.png)
![[Uncaptioned image]](/html/2103.14601/assets/x32.png)
![[Uncaptioned image]](/html/2103.14601/assets/x33.png)
![[Uncaptioned image]](/html/2103.14601/assets/x34.png)
![[Uncaptioned image]](/html/2103.14601/assets/x35.png)
![[Uncaptioned image]](/html/2103.14601/assets/x36.png)
![[Uncaptioned image]](/html/2103.14601/assets/x37.png)
![[Uncaptioned image]](/html/2103.14601/assets/x38.png)
![[Uncaptioned image]](/html/2103.14601/assets/x39.png)
![[Uncaptioned image]](/html/2103.14601/assets/x40.png)
![[Uncaptioned image]](/html/2103.14601/assets/x41.png)
![[Uncaptioned image]](/html/2103.14601/assets/x42.png)
![[Uncaptioned image]](/html/2103.14601/assets/x43.png)
![[Uncaptioned image]](/html/2103.14601/assets/x44.png)
![[Uncaptioned image]](/html/2103.14601/assets/x45.png)
![[Uncaptioned image]](/html/2103.14601/assets/x46.png)
![[Uncaptioned image]](/html/2103.14601/assets/x47.png)
![[Uncaptioned image]](/html/2103.14601/assets/x48.png)
![[Uncaptioned image]](/html/2103.14601/assets/x49.png)
![[Uncaptioned image]](/html/2103.14601/assets/x50.png)
![[Uncaptioned image]](/html/2103.14601/assets/x51.png)
![[Uncaptioned image]](/html/2103.14601/assets/x52.png)
![[Uncaptioned image]](/html/2103.14601/assets/x53.png)
![[Uncaptioned image]](/html/2103.14601/assets/x54.png)
![[Uncaptioned image]](/html/2103.14601/assets/x55.png)
![[Uncaptioned image]](/html/2103.14601/assets/x56.png)
![[Uncaptioned image]](/html/2103.14601/assets/x57.png)
![[Uncaptioned image]](/html/2103.14601/assets/x58.png)
![[Uncaptioned image]](/html/2103.14601/assets/x59.png)
![[Uncaptioned image]](/html/2103.14601/assets/x60.png)
![[Uncaptioned image]](/html/2103.14601/assets/x61.png)
![[Uncaptioned image]](/html/2103.14601/assets/x62.png)
![[Uncaptioned image]](/html/2103.14601/assets/x63.png)
![[Uncaptioned image]](/html/2103.14601/assets/x64.png)
![[Uncaptioned image]](/html/2103.14601/assets/x65.png)
![[Uncaptioned image]](/html/2103.14601/assets/x66.png)
![[Uncaptioned image]](/html/2103.14601/assets/x67.png)
![[Uncaptioned image]](/html/2103.14601/assets/x68.png)
![[Uncaptioned image]](/html/2103.14601/assets/x69.png)
![[Uncaptioned image]](/html/2103.14601/assets/x70.png)