Timing and spectral studies of the X-ray pulsar 2S 1417–624 during the outburst in 2021
Abstract
We study the timing and spectral properties of the X-ray pulsar 2S 1417–624 during the recent outburst in January 2021 based on the Neutron Star Interior Composition Explorer (NICER) observation. We also used some early data from the 2018 outburst to compare different temporal and spectral properties. The evolution of the spin period and pulsed flux is studied with Fermi/GBM during the outburst and the spin-up rate is found to be varied between . The pulse profile shows energy dependence and variability. The pulse profile shows multiple peaks and dips which evolve with energy. The evolution of the spectral state of this source is also studied using the hardness intensity diagram (HID). The HID shows a transition from the horizontal to the diagonal branch, which implies the source went through a state transition from the subcritical to supercritical accretion regime. The NICER energy spectrum is well described by a composite model of a power-law with a higher cut-off energy and blackbody components along with a photo-electric absorption component. An iron emission line is detected near 6.4 keV in the NICER spectrum with an equivalent width of 0.05 keV. The photon index shows an anti-correlation with flux below the critical flux. The mass accretion rate is estimated to be near the peak of the outburst. We have found a positive correlation between the pulse frequency derivatives and luminosity. The Ghosh and Lamb model is applied to estimate the magnetic field at different spin-up rates, which is compared to the earlier estimated magnetic field at a relatively high mass accretion rate. The magnetic field is estimated to be G from the torque-luminosity model using the distance estimated by Gaia, which is comparatively higher than most of the other Be/XBPs.
Email: manojmandal@mcconline.org.in (MM), sabya.pal@gmail.com (SP)
Keywords accretion, accretion disks - star: pulsar, individual: 2S 1417–624
1 Introduction
The X-ray transient pulsar 2S 1417–624 was discovered using the Small Astronomy Satellite (SAS–3) in 1978 (Apparao et al., 1980). Several outbursts from the source were observed by the Burst and Transient Source Experiment (BATSE) and the Rossi X-ray Timing Explorer (RXTE) (Finger et al., 1996a; Gupta et al., 2018). Earlier, an X-ray pulsation at 17.5 s was detected from the source light curve with an orbital period of 42 days (Finger et al., 1996a). The orbital parameters of the binary system were improved by Raichur & Paul (2010) using RXTE during the giant outburst in 1999. The source is located at a distance of 9.9 kpc provided by Gaia (Bailer-Jones et al., 2018). The accretion-powered X-ray pulsar 2S 1417–624 went through a giant outburst in 2009, and different timing and spectral properties were studied using RXTE (Gupta et al., 2018). During this outburst, the pulse profile showed energy and luminosity dependence, and the pulse profile evolved from a double-peak feature at lower luminosity to a triple-peak feature at higher luminosity and back to a double-peak feature during the decay phase of the outburst. The variation of pulse fraction was studied with flux, which showed an anti-correlation with source flux during the outburst.
During the MAXI observation, the strong energy dependence of the pulse profile was observed, and the four-peaked pulse profile at lower energies evolved into a double peak feature at higher energies. The pulse fraction showed an anti-correlation with luminosity, which was similar to the previous giant outburst in 2009 (Gupta et al., 2019). Variability in the pulse profile was also observed from the NICER observations, and the pulse profile evolved significantly with luminosity and energy (Ji et al., 2020). The magnetic field was estimated to be G for a source distance of 20 kpc by considering the spin-up due to the accretion torque.
The critical luminosity () of a source is crucial in defining two accretion regimes. The source luminosity is lower than the critical luminosity in the subcritical regime, and at the critical luminosity, a state transition from the subcritical to the supercritical regime occurs. Near the critical luminosity, the pulse profile, pulsed fraction, and beaming patterns change significantly. The state transition can be probed using the hardness intensity diagram (HID). During the state transition, the HID shows a transition from the horizontal branch (low luminosity state) to a diagonal branch (high luminosity state), which was observed earlier for several sources (Reig & Nespoli, 2013).
During the 2018 giant outburst, 2S 1417–624 was studied using Swift, MAXI (Gupta et al., 2019), NICER (Serim et al., 2022), and Insight-HXMT (Ji et al., 2020). Serim et al. (2022) reported a state transition from a subcritical to a supercritical regime during the 2018 outburst. A significant evolution of different spectral parameters was found near the critical X-ray flux (unabsorbed) of 0.7 erg cm-2 s-1 using NICER observations (0.8–12 keV).
Recently, the source went through an outburst in 2021 that was the strongest after the giant outburst of 2018. The outburst was detected by Fermi/GBM, Burst Alert Telescope (BAT) onboard Swift, and Gas Slit Camera (GSC) onboard MAXI on January 2021 (Hazra et al., 2021). The X-ray flux started to increase from the early last week of January 2021, and the duration of the outburst was nearly three months. In this paper, we study the timing and spectral properties of the pulsar 2S 1417–624 during the recent outburst in 2021 using NICER observations and compare different timing and spectral properties with the giant outburst of 2018. We describe the data reduction and analysis method in Sect. 2. We have presented the results of the current study in Sect. 3. The discussion and conclusion are summarized in Sect. 4 and 5 respectively.
| Start time | NICER flux | Exposure | Obs. ID | Pulsed fraction |
|---|---|---|---|---|
| (MJD) | (ks) | (%) | ||
| 59241.50 | 6.5390.004 | 7.165 | 3200130112 (Obs 1) | 27.121.7 |
| 58308.25 | 7.3980.006 | 1.745 | 1200130165 (Obs 2) | 35.142.0 |
| 58296.28 | 9.4660.005 | 1.423 | 1200130155 (Obs 3) | 28.641.8 |
| 58310.32 | 6.4670.009 | 0.632 | 1200130166 (Obs 4) | 32.402.0 |
| 58312.44 | 5.9350.009 | 0.936 | 1200130168 (Obs 5) | 37.012.1 |
| 58317.70 | 4.5600.020 | 0.959 | 1200130169 (Obs 6) | 43.902.2 |
| 58214.77 | 6.8440.010 | 0.998 | 1200130104 (Obs 7) | 31.151.8 |
| 58274.33 | 11.630.90 | 1.146 | 1200130143 (Obs 8) | 27.862.0 |
| 58275.04 | 11.550.90 | 1.646 | 1200130144 (Obs 9) | 20.051.7 |
| 58326.12 | 3.950.96 | 1.360 | 1200130175 (Obs 10) | 37.182.0 |
| 58328.82 | 3.900.90 | 0.856 | 1200130177 (Obs 11) | 41.932.2 |
2 Observation and data analysis
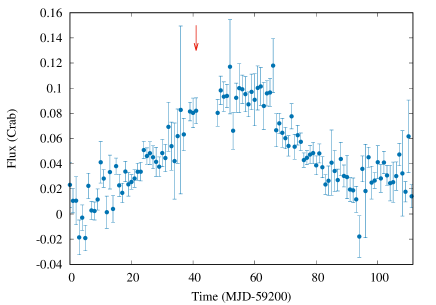
We detected an outburst from the X-ray pulsar 2S 1417–624 and followed the evolution of the outburst using different instruments. We use data from all-sky X-ray monitors like Swift/BAT (15–50 keV), MAXI/GSC (2–20 keV), and Fermi/GBM (12–50 keV). We analyzed the NICER data during the rising phase of the 2021 outburst near the peak. We used the HEASOFT v6.27.2 for the data reduction and analysis. BAT onboard the Swift observatory (Gehrels et al., 2004) is sensitive in hard X-ray (15–50 keV) (Krimm et al., 2013). We have used the results of the BAT transient monitor during the outburst, which were provided by the BAT team. BAT flux reached a maximum of 0.1 Crab during the first week of February 2021.
We have made use of MAXI/GSC (2–20 keV) light curves data (Matsuoka et al., 2009) to follow up on the outburst and to study the evolution of spectral states. MAXI in-orbit operation was started in 2009, and nearly 300 pre-registered sources have been monitored at regular intervals in different energy bands (2–4 keV, 4–10 keV, and 10–20 keV bands). The data provided by MAXI/GSC is averaged for every day. We have studied the evolution of the hardness of the X-ray pulsar using data from different energy bands.
The Neutron Star Interior Composition Explorer(NICER) was launched in 2017 and is currently working as an external payload on the International Space Station. NICER consists of one instrument, the X-ray Timing Instrument (XTI), operating in the soft X-ray region (0.2–12 keV) (Gendreau et al., 2016). A follow-up observation of 2S 1417–624 was conducted by NICER on January 27, 2021, during the rising phase of the outburst, close to the peak of the outburst. The details of the NICER observation are tabulated in Table 1. The processing of raw data has been done using the NICERDAS in HEASOFT v6.27.2. The NICER data are reduced with Calibration Database (CALDB) version xti20200722. We have created clean event files by applying the standard calibration and filtering tool nicerl2 to the unfiltered data. We have extracted light curves and spectra using XSELECT from the barycenter corrected reprocessed clean event file. For the timing analysis, we selected good time intervals according to the following conditions: ISS not in the South Atlantic Anomaly (SAA) region, source elevation 20∘ above the Earth limb, source direction at least 30∘ from the bright Earth.
For timing analysis, we have applied barycentric corrections to those events using the task barycorr. The ancillary response file and response matrix file of version 20200722 were considered in our spectral analysis. The background corresponding to each epoch of the observation was simulated by using the nibackgen3C50111https://heasarc.gsfc.nasa.gov/docs/nicer/tools/nicer_bkg_est_tools.html tool (Remillard et al., 2022). Ancillary response files and response matrix files of version 20200722 are considered in our spectral analysis. We have used the latest response files (nixtiref20170601v002.rmf,nixtiaveonaxis20170601v004.arf) for the spectral analysis.
The Fermi Gamma-ray Space Telescope operates within a wide energy range between 8 keV–40 MeV. The Large Area Telescope (LAT) and Gamma-ray Burst Monitor (GBM) are the two main instruments onboard the Fermi Gamma-ray Space Telescope (Meegan et al., 2009). The GBM is made up of 14 detectors: 12 detectors of Sodium Iodide (NaI) and 2 detectors of Bismuth Germanate (BGO). In the current study, we have used the spin frequency, frequency derivative, and 12–50 keV pulsed flux measurements with the Fermi/GBM (Finger et al., 2009). The outburst from 2S 1417–624 was also detected with Fermi/GBM from January 2021 and continued for nearly two months with a maximum pulsed flux of 0.27 keV cm-2 s-1 on MJD 59260 as provided by Fermi/GBM (Meegan et al., 2009).
The spin-frequencies are also used, which are provided by the Fermi/GBM team. There were a total of 23 spin frequency () measurements conducted during our study, and we used 18 measurements, which were at around 3-day equal intervals, and we have not included the first and last few measurements. We used a linear function to fit each of the three consecutive frequency measurements with time. The spin-up rate was calculated from the slope of the linear function during a 9-day interval, as each pulse frequency measurement was collected every 3-day interval, using the minimization technique. We repeated this process for the next three frequency measurements and so on (viz. Kabiraj & Paul (2020)). Therefore, we had 6 spin-up rates from 18 spin frequencies.
We have used the average value of total flux for three consecutive points over the same intervals, which are used to determine . Finally, the luminosity is estimated from the X-ray flux for a distance of 9.9 kpc. X-ray luminosity of the source is calculated from the count rate history provided by Swift/BAT team (Krimm et al., 2013) by multiplying a flux conversion factor of erg cts-1 (Ji et al., 2020).
3 Results
The X-ray pulsar 2S 1417–624 went through an outburst during January-March 2021, detected by Fermi/GBM, Swift/BAT,222https://swift.gsfc.nasa.gov/results/transients/ MAXI/GSC, which reached a maximum flux during the second week of February 2021. Figure 1 shows the variation of hard X-ray flux during the outburst using Swift/BAT (15–50 keV). The total duration of the outburst was around 3 months, which started in early January 2021 and continued till March 2021. We have summarized the results of the timing and spectral analysis of 2S 1417–624 during the recent outburst in 2021. We have used MAXI (Matsuoka et al., 2009) final data products (light curves) as well as the Fermi (Finger et al., 2009; Meegan et al., 2009) pulse frequencies and pulsed flux evolution data for this source.
3.1 Variation of pulse profile and pulsed fraction
The light curves were produced using the science event data in different energy ranges with a bin size of 0.1 s from NICER data. We used the efsearch task in FTOOLS to check for the periodicity in the time series of the barycenter and background corrected data sets. We used the folding method of the light curve over a trial period to get the best period by maximizing process (Leahy, 1987) over 32 phase bins in each period. After getting the best spin period, pulse profiles were generated using the efold task in FTOOLS by folding light curves with the best spin period. Uncertainty in the estimated spin period was computed using the task efsearch in FTOOLS from the chi-square versus spin period plot (Raichur & Paul, 2010). The evolution of the pulse period and pulsed flux during the outburst was studied using the Fermi/GBM.
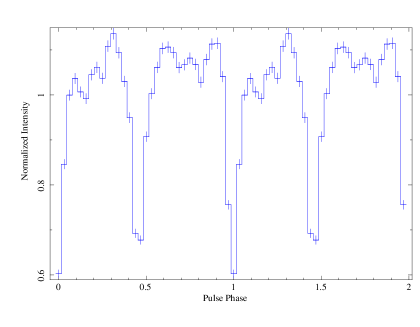
We have studied the variation of different timing properties of the X-ray pulsar 2S 1417–624 during the outburst using NICER observations. The spin period of the pulsar during the outburst is found to be using NICER data, which is comparable with the pulse period recorded with Fermi/GBM333https://gammaray.nsstc.nasa.gov/gbm/science/pulsars during the outburst. Fermi/GBM found that the period decreased slowly with the time of the outburst. Figure 2 shows the pulse profile using NICER data in the energy range of 0.4–10 keV, which consists of multiple broad peaks and narrow dips. We have compared pulse profiles with the 2018 outburst at the comparable flux level. The left side of Fig. 2 shows the pulse profile during the 2021 outburst, and the right side of Fig. 2 shows the pulse profile during the 2018 outburst.
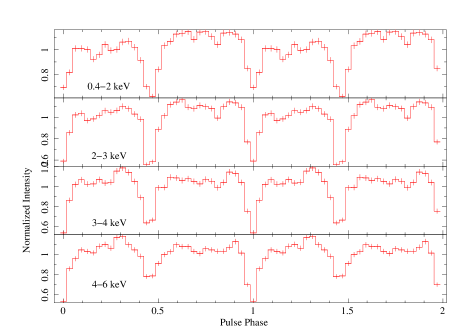
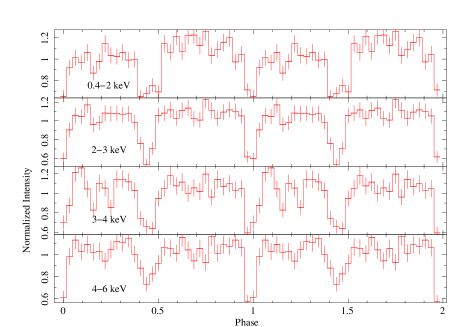
We have looked at the energy dependence of the pulse profiles as well as the temporal variation of the pulse profile during the outburst. Figure 3 represents the energy-dependent pulse profile for four different energy ranges. The variation of the pulse profile over four energy bands: 0.4–2 keV, 2–3 keV, 3–4 keV, and 4–6 keV is shown in Fig. 3. We have also estimated the pulse profile in the 6–10 keV band, but due to the low count rate in this band, we have not included this. The pulse profile shows two broad peaks and dips, which varied with energy. The pulse profile of the first row (0.4–2 keV) of Fig. 3 shows two clear dips and two broad peaks. We compare the energy-resolved pulse profile with the previous giant outburst of 2018 at comparable flux levels, which also showed two broad peaks and dips which evolved slightly with energy.
For estimating the pulsed fraction, we used this formula:
| (1) |
where and are the maximum and minimum intensities respectively in the folded light curve.
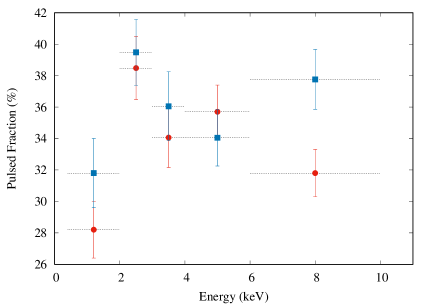
Figure 4 shows the variation of pulsed fraction for different energy ranges for which the energy-resolved pulse profile is studied. The horizontal bars represent the energy ranges for which the PF is calculated, and the vertical bars indicate the corresponding error in measurements. We have compared the value of pulse fraction at the same energy ranges with the 2018 and 2021 outbursts.
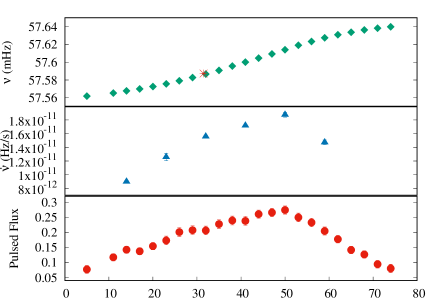
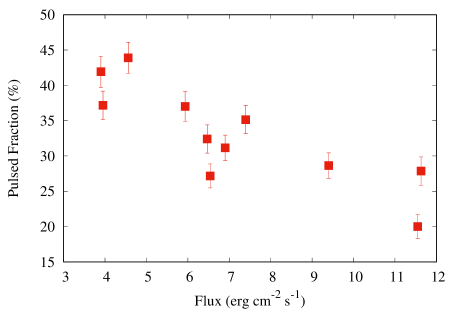
We have estimated the pulsed fraction for a few earlier NICER observations during the 2018 outburst. Table 1 (5th column) summarizes the value of the pulsed fraction. The pulsed fraction shows a trend to decrease with an increase in flux. The first row of the table corresponds to the 2021 outburst and the rest of the rows are during the 2018 outburst. The right-hand side image of Fig. 10 shows the variation of pulsed fraction with flux. This indicates that the pulsed fraction is decreased with an increase in X-ray flux. Figure 5 shows the evolution of the spin frequency and pulsed flux (12–50 keV) during the outburst of 2021 using Fermi/GBM, which implies that the pulse period of the X-ray pulsar has decreased slowly with time. We estimated the spin frequency derivative (as described in Sect. 2), which varied between 0.8– during the outburst (shown in the middle panel of Fig. 5).
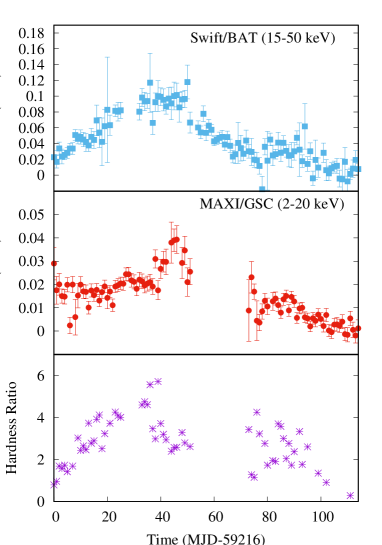
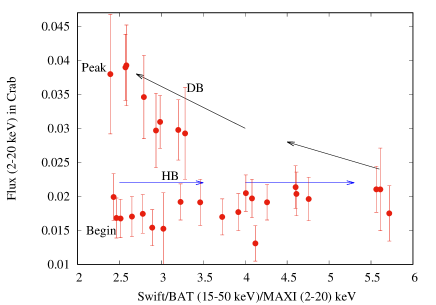
We have studied the evolution of the spectral state of the source during the outburst. Figure 6 shows the variation of flux using Swift/BAT and MAXI/GSC. The top panel of Fig. 6 shows the variation of hard X-ray flux using BAT (15–50 keV), which indicates that the flux reached a value of 0.12 crab near the peak of the outburst. The middle panel of Fig. 6 shows the variation of flux using MAXI (2–20 keV), which indicates that the highest flux was 0.04 crab near the peak of the outburst. The bottom panel of Fig. 6 shows that the HR varied between 0.1–6 during the outburst.
The hardness ratio shows a significant variation during the outburst. The HR started to increase during the rising phase (from MJD 59216) and has continued to increase and reached a maximum value of 6 near the peak of the outburst (MJD 59256), after that the HR started to decrease. We have also studied the hardness intensity diagram using Swift/BAT and MAXI flux. Figure 7 shows the hardness intensity diagram (HID) for 2S 1417–624 during the outburst. The HID shows that there is a sudden turn towards the left above the critical luminosity. The low luminosity states are represented by the horizontal branch (HB) and the high luminosity states are shown by the diagonal branch (DB). This sudden turn above the critical luminosity implies a state transition from subcritical to supercritical for this source.
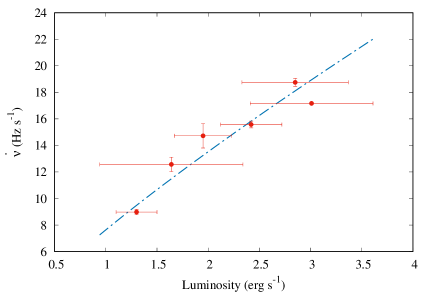
Figure 8 shows the variation of spin-up rate with luminosity. A power law is used to fit the and luminosity. This shows a positive correlation between the spin-up rate and the luminosity. Spin frequency derivatives vary between (0.8–1.8), which is estimated from spin frequency evolution history as provided by Fermi/GBM. The luminosity is varied between (1.0–3.5) erg s-1, which is estimated from the Swift/BAT count rate using a multiplying factor.
| Obs. ID | Date | Count | Photon index | Ecut | Efold | Line | Equivalent | Reduced | Unabsorbed flux | ||
|---|---|---|---|---|---|---|---|---|---|---|---|
| rate | () | energy | width | (d.o.f) | (10-10) | ||||||
| (MJD) | (Count s-1) | ( 1022, cm-2) | (keV) | (keV) | (keV) | (keV) | (keV) | (erg cm-2 s-1) | |||
| 3200130112 | 59241.50 | 39.850.08 | 1.20 | 0.41 | 6.39 | 11.4 | 0.255 | 6.39 | 0.02 | 1.07 (935) | 6.5390.004 |
| 1200130165 | 58308.25 | 40.230.15 | 1.19 | 0.45 | 5.83 | 18.75 | 0.3 | 6.42 | 0.07 | 1.03 (754) | 7.3980.006 |
| 1200130155 | 58296.28 | 52.060.18 | 1.14 | 0.51 | 5.75 | 18.04 | 0.390.11 | 6.46 | 0.12 | 1.02 (780) | 9.460.90 |
| 1200130166 | 58310.32 | 36.910.20 | 1.15 | 0.40 | 4.95 | 14.07 | 0.29 | 6.4 | 0.04 | 1.04 (607) | 6.4670.009 |
| 1200130168 | 58312.44 | 33.260.17 | 1.02 | 0.43 | 5.80 | 15.53 | 0.15 | 6.39 | 0.0002 | 0.97 (635) | 5.9350.009 |
| 1200130169 | 58317.70 | 26.270.20 | 1.43 | 0.46 | 5.93 | 10.95 | 0.20 | 6.39 | 0.07 | 1.01 (530) | 4.5600.09 |
| 1200130104 | 58214.77 | 36.690.19 | 1.38 | 0.30 | 7.1 | 12.7 | 0.23 | 6.43 | 0.11 | 0.97 (630) | 6.900.01 |
| 1200130143 | 58215.45 | 62.650.24 | 1.13 | 0.45 | 7.2 | 12.5 | 0.42 | 6.39 | 0.20 | 0.97 (754) | 11.630.90 |
| 1200130144 | 58274.33 | 60.100.20 | 1.14 | 0.52 | 9.67 | 14.0 | 0.40 | 6.40 | 0.05 | 0.97 (807) | 11.550.90 |
| 1200130175 | 58326.12 | 22.640.13 | 1.13 | 0.45 | 6.32 | 11.60 | 0.15 | 6.42 | 0.002 | 1.03 (596) | 3.950.96 |
| 1200130177 | 58328.82 | 22.730.02 | 1.08 | 0.40 | 6.37 | 7.05 | 0.11 | 6.42 | 0.02 | 1.04 (496) | 3.900.90 |
-
•
Model : phabs(powerlawhighEcut+bbodyrad+gaussian), : hydrogen column density, : power-law photon index, : blackbody temperature, All the flux (unabsorbed flux) values quoted in the paper are calculated by using the cflux convolution model. All of the reported errors were obtained using the err tool from XSPEC. Uncertainties are given for a 90% confidence interval.
3.2 Energy spectrum
The spectra were produced using the NICER (0.8–12 keV) data. We have excluded the spectrum above 12 keV and below 0.8 keV due to the poor source count rate statistics in these ranges. The NICER spectra were fitted using XSPEC v12.11.0 and model parameters were varied independently. We tested different simple single-component models like high energy cut-off power-law, bbody, and compTT as well as combinations of models like power-law+bbody, diskbb+bknpower, andpohighEcut+bobdyrad to fit the source spectra. The spectra were well fitted with a blackbody emission and a power-law component with a high-energy cut-off and an iron emission line at 6.4 keV, also modeled using a Gaussian. The blackbody has been introduced along with a simple power-law to model the soft excess component (Hickox et al., 2004). To find the effect of absorption by hydrogen, all model components were multiplied by a photo-electric absorption model.
We have studied the energy spectra using NICER/XTI data and compared the variation of spectral parameters near the same flux levels with the earlier outburst in 2018. Earlier, the spectra of the source were modeled using an absorbed power-law with a high energy cut-off and an iron emission line near 6.4 keV (Gupta et al., 2019). We have applied an absorbed power-law continuum model, and an additional blackbody emission has been introduced, which improves the fit statistics. This model is good enough to describe the spectral continuum at lower flux limits, which becomes more complex at higher flux levels, as observed during the giant outburst of 2018 (Gupta et al., 2019). The additional emission near 6.4 keV is modeled using a Gaussian component, which provides a reduced value of 1.0.
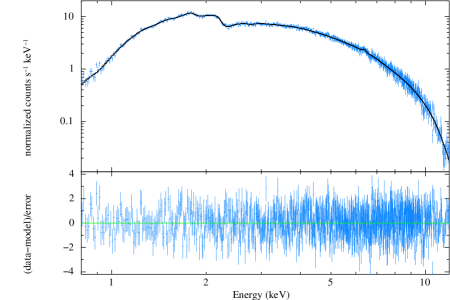
The energy spectrum with the best-fitted models during the 2021 outburst is shown in Fig. 9 where the bottom panel of Fig. 9 shows the residuals. The energy spectrum of the X-ray pulsar can be well fitted with a high-energy cut-off power-law (power-lawhighEcut in XSPEC) and a blackbody emission component bbodyrad in XSPEC) along with a photoelectric absorption (phabs in XSPEC). The NICER spectrum in the energy range 0.8–12 keV is well described with blackbody emission with temperature () 0.255 keV and hydrogen column density .
The unabsorbed X-ray flux in the 0.8–12 keV energy range is ergs cm-2 s-1 using NICER observation during the 2021 outburst. Table 2 summarizes the values of different spectral parameters for the best-fitted model. The cflux convolution model was used to calculate all of the flux (unabsorbed) values in the paper. All of the reported errors were obtained using the err tool from XSPEC. Uncertainties are given for a 90% confidence interval. We have also looked at the variation of spectral parameters with X-ray flux from different NICER observations in 2018 and 2021.
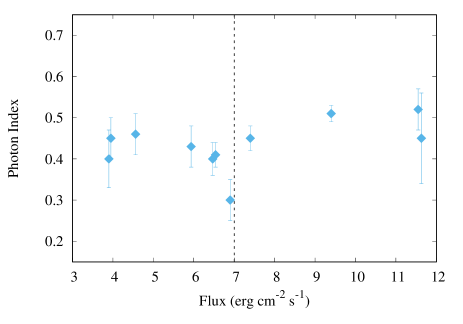
The photon index decreased as the flux increased and shows an anti-correlation below the flux level of erg cm-2 s-1, which implies that at the brighter phase of the source the X-ray emission was harder. Near the peak of the outburst during NICER observation, the photon index was 0.4. For the sake of comparison, we have used a few earlier NICER data points at nearly the same flux level. The photon index showed a consistent value with the earlier observation at the same flux level. Hydrogen column density and the blackbody temperature also did not show any significant variation at the same flux level. The radius of the emitting region of the blackbody is estimated using the normalization constant of the model bbodyrad as norm , where is the source radius in km and is the distance to the source in units of 10 kpc. The BB emission region is found to be 12 km at a flux level of erg cm-2 s-1 using NICER (0.8–12 keV) observation during 2021 outburst. Earlier, during the 2018 outburst, the BB emission radius was estimated to be 8 km using NICER observations for a source distance of 9.9 kpc using bbodyrad model (Serim et al., 2022) at a flux level of erg cm-2 s-1 in the energy of 0.8–12 keV of NICER. The variation of photon index with flux is shown in Fig. 10, which shows that the photon index is anti-correlated with the X-ray flux below the critical flux level ( erg cm-2 s-1), which is shown by a vertical dotted line. Above the critical flux, the correlation turns to a slightly positive trend, which may indicate a state transition for this source.
4 Discussion
We present the results of timing and spectral analysis of 2S 1417–624 using the NICER data during the recent outburst in 2021. The timing analysis reveals that the pulse profile shows multiple peaks and dips with an energy-dependent nature, which is comparable with the previous results at the same flux levels during the giant outbursts in 2009 (Gupta et al., 2018) and 2018 (Ji et al., 2020; Gupta et al., 2019). The energy dependence of the pulse profile is studied to investigate the evolution of the individual dips and peaks of the pulsar with different energies. The pulse profile evolves significantly with energy, which is comparable at the same flux level as the previous result (Ji et al., 2020). During the 2021 outburst, the spin-up rate is found to vary from to , which is comparable to the previous outbursts of 2S 1417–624 (Finger et al., 1996a; Ji et al., 2020). The mass accretion rate is estimated using the luminosity near the peak (during NICER observation) of the outburst as, and , which is estimated using the accretion efficiency factor . The variation of pulsed fraction with energy also shows consistent values at comparable flux levels in the 2018 and 2021 outbursts. The value of the pulsed fraction in the 6–10 keV energy band is not consistent probably due to the low count in this band. The pulsed fraction showed a negative correlation with luminosity. We have used a few earlier NICER data along with recent data to investigate the evolution of pulsed fractions at different flux levels.
Earlier, the X-ray pulsar 2S 1417–624 showed strong luminosity and energy dependence during the 2018 giant outburst. During the present outburst, two broad peaks and dips are observed in the pulse profile, and the pulse profile evolves with energy. The double peak feature, with 0.5 separations of each peak, indicates a simple beam function created from both of the poles of the neutron star during the outburst (Gupta et al., 2018). During the 2018 giant outburst, the luminosity dependency of the pulse profile and the complex shape of the pulse profiles were reported by Ji et al. (2020). In the supercritical regime, an additional dip was observed, probably due to the increased absorption at higher luminosity. It is also possible that the hydrogen column density of the partial covering absorber () may increase due to the absorption of the materials around the neutron star as in the case of Swift J0243.6+6124 (Zhang et al., 2019). At higher luminosity, the beam patterns become more complex and mostly dominated by fan-beam or a mix of pencil and fan-beam patterns. During the 2009 giant outburst, Gupta et al. (2019) performed phase-resolved spectroscopy for this source and concluded that except for the primary dip (phase 0.95-1.05) there was no significant variation in the additional column density. Several pulsars showed strong energy and luminosity dependence of the pulse profiles, like 1A 0535+262 (Mandal & Pal, 2022), EXO 2030+375 (Epili et al., 2017; Naik et al., 2013), GX 304–1 (Jaisawal et al., 2016).
The luminosity during the NICER observation of the 2021 outburst was below the critical luminosity for this source, and at this phase of the outburst, the pulse profile showed two broad peaks, which is consistent with the previous result (Ji et al., 2020) and the emission geometry is expected to be driven by a “pencil beam” pattern during this sub-critical accretion regime. During the recent outburst, multiple dips-like features were observed from 2S 1417–624. The typical value of the critical luminosity of accretion-powered X-ray pulsars is estimated to be in the order of erg s-1 (Becker et al., 2012; Reig & Nespoli, 2013). This critical value of luminosity is essential to understand the transition between sub-critical and super-critical accretion regimes. In sub-critical phases, the emission geometry is comparatively simple, and the accretion flow is supposed to halt by Coulomb interaction close to the neutron star surface. A single or double-peaked pulse profile is produced, and emission geometry can be driven by a pencil beam-like pattern. Earlier, in the 2018 outburst, the luminosity was higher and near the critical luminosity, the beam geometry changed and multiple peaks were observed in the pulse profile (Gupta et al., 2018). The emission geometry was changed from a pencil beam to a mixture of pencil and fan beams.
We look at the hardness ratio (HR) using the ratio of the count rates from Swift/BAT (15–50 keV) and MAXI/GSC (2–20 keV) to study the evolution of the spectral states during the outburst. The HR shows variability during the outburst and the HR varied between 0.1–6 for the time MJD 59216–59326. We have also studied the hardness intensity diagram (HID) to look for any changes in spectral shape. The HID shows a state change from a subcritical to a supercritical accretion regime. In the HID for the pulsar 2S 1417–624, we noticed a change from HB to DB. Earlier different pulsars, such as 4U 0115+63, EXO 2030+375, V 0332+53, KS 1947+300, and 1A 0535+262 showed a transition in their HID (Reig & Nespoli, 2013; Mandal & Pal, 2022). When the luminosity reached a critical value, 2S1417–624 entered the DB by making a sudden left turn in the HID. The hardness ratio (HR) started to drop above the critical luminosity, and the peak of the outburst corresponded to the softest state of DB.
Earlier, critical flux level was estimated to be erg cm-2 s-1 using NICER (0.8–12 keV) for a source distance of 9.9 kpc (Serim et al., 2022). During the NICER observation of the 2021 outburst, the unabsorbed flux (0.8–12 keV) level was below the critical level. Above this flux level, the source state transition from sub-critical to super-critical accretion regime may occur, and in this regime, the radiation pressure is high enough to halt the accretion flow at a certain height above the pulsar. During this transition, the pulse profile morphology, pulse fraction, and different spectral parameters also show significant variation. The beaming pattern also seems to change from pencil-beam to fan-beam or a mix of pencil and fan-beam (Becker et al., 2012).
Earlier, a correlation between spin-up rate and X-ray flux was observed during outbursts for different transient systems, which was explained in terms of accretion. For example, 2S 1417–624 (Finger et al., 1996a), A 0535+26 (Finger et al., 1996b; Bildsten et al., 1997), EXO 2030+375 (Parmar et al., 1989; Reynolds et al., 1996), GRO J1744–28 (Bildsten et al., 1997), and SAX J2103.5+4545 (Baykal et al., 2002) showed correlation between spin-up rate and X-ray flux. Figure 8 shows that the pulse frequency derivatives of the X-ray pulsar 2S 1417–624 are correlated with luminosity. Earlier, for 2S 1417–624, Finger et al. (1996a) observed that was highly correlated with the pulsed flux. Both these parameters are supposed to be driven by the mass accretion rate.
Based on the accreting torque model and the observed spin-up rate, we have tried to find the magnetic dipole moment and the surface magnetic field of 2S 1417–624. The spin-up rate and the luminosity are known to be correlated in transient X-ray pulsars as (Ghosh & Lamb, 1979b; Sugizaki et al., 2017):
| (2) |
where , , , , and are the spin frequency derivative, magnetic dipole moment, radius, mass and the moment of inertia of the neutron star given in the units of , G cm3, cm, 1.4 , and respectively. is the X-ray luminosity in the unit of erg s-1. According to the Ghosh & Lamb (1979a, b) model, under slow-rotator condition, 1.39 and . Therefore, equation (1) reduces to (Sugizaki et al., 2017)
| (3) |
where and . For nominal values of , measurements of the versus give a rough estimation of the magnetic dipole moment of the pulsar. From the vs plot, we have estimated and as 7.650.71 and 0.820.11 respectively from the best fit result. The estimated value of is close to the theoretical value. Figure 8 shows the correlation between the spin-up rate and luminosity and the solid line represents the best-fitted result. From the best fit result, we may write the equation (2) as
| (4) |
Now the magnetic dipole moment can be written in the form
| (5) |
The surface magnetic field can be estimated using the magnetic moment () and radius () of the pulsar as
| (6) |
is the correlation factor, for typical NS, 0.68, the magnetic field can be written as
| (7) |
for 109, the magnetic field is estimated to be G.
The high value of the magnetic dipole moment leads to a higher value of the magnetic field ( G). Earlier, Ji et al. (2020) also concluded that the estimated magnetic field of this source was high during the 2018 giant outburst. If the source distance is taken as twice (20 kpc (Ji et al., 2020)) of the Gaia estimated distance, then the magnetic field strength reduces to a typical value of the order G. Serim et al. (2022) also concluded that the magnetic field of the source was very high ( G) like a magnetar during another study of the 2018 outburst, which is consistent with our results in the 2021 outburst. The high magnetic field in 2S 1417–624 may originate from the limitation of torque models, which do not allow closer distance (Malacaria et al., 2020). There are several sources like XTE J1858+034, GRO J1008–57, GS 0834–430, IGR J18179–1621, IGR J19294+1816, RX J0440.9+4431, MAXI J1409–619, and GRO J2058+42 for which considerable deviations from the GL model were observed, even considering the Gaia measured distances (Malacaria et al., 2020). During the 2009 outburst of 2S 1417–624, the critical luminosity was estimated to be erg s-1 (3–30 keV flux, source distance of 11 kpc) by assuming a magnetic field of G (İnam et al., 2004; Gupta et al., 2018). Serim et al. (2022) found that the critical flux during the 2018 outburst was erg cm-2 s-1 above which spectral parameters showed significant evolution. We have found that the critical flux (0.8–12 keV) during the 2021 outburst to be erg cm-2 s-1, which is consistent with the previous outburst (Serim et al., 2022). We have also estimated the magnetic field corresponding to the critical luminosity using equation 8, during the 2021 outburst of the source. The magnetic field corresponding to the critical luminosity erg s-1 is estimated to be G for a source distance of 9.9 kpc (Bailer-Jones et al., 2018). For a typical neutron star, the critical luminosity and magnetic field are associated as (Becker et al., 2012),
| (8) |
Using the torque luminosity model, the magnetic field was estimated to be G and the distance was estimated to be 20 kpc (Ji et al., 2020).
Earlier, in 2013, Chandra observed 2S 1417–624 during the quiescent phase. The pulsar spectrum was characterized by either a power-law or a blackbody model with a high temperature of 1.5 keV (Tsygankov et al., 2017). The spectrum of the source during the 2021 outburst was well explained by a composite model of power-law and blackbody components. During the 2018 giant outburst, the source spectrum was well explained with the cut-off power-law continuum model and a blackbody component with the interstellar absorption (Gupta et al., 2019). The energy spectrum (NICER/XTI) of the source during the recent outburst in 2021 is also well described with a similar type of model as observed earlier. We have compared the spectral properties of the X-ray pulsar with the 2018 giant outburst at a comparable flux level. Earlier, the photon index showed an anti-correlation with flux below 10-9 erg cm-2 s-1. Such an anti-correlation was also observed in both the 1999 (İnam et al., 2004) and 2009 outbursts (Gupta et al., 2018). During the recent outburst of 2021, the NICER flux was below the critical value ( erg cm-2 s-1), and the photon index showed an anti-correlation with X-ray flux below critical luminosity. During the 2018 outburst, Serim et al. (2022) also found an anti-correlation between the photon index and flux below the critical flux value, which turns into a slightly positive correlation above the critical value of flux. We have compared the NICER spectra during the 2018 and 2021 outbursts at comparable flux levels, and the results show consistent values of spectral parameters and the photon index decreases with the increase of X-ray flux and the spectrum gets harder.
We have found the radius of the emitting region of the pulsar using the fitting parameters. The normalization constant of the bbodyrad model gives the size of the emission region for a known distance to the source. From the results of spectral fitting during the 2021 NICER observation, the radius of the emitting region is 12 km for a distance of 9.9 kpc.
Earlier, a significant change in the correlation of the – diagram was seen in different sources near the critical luminosity. The transition from a negative to positive correlation was seen in the – diagram as luminosity increases above the critical luminosity (Reig & Nespoli, 2013). In the subcritical regime, a negative correlation was reported for the sources like 1A 1118–612, GRO J1008–57, XTE J0658–073, and a transition in the correlation of – was observed for the sources 1A 0535+262 (Mandal & Pal, 2022), 4U 0115+63, EXO 2030+375 (Epili et al., 2017; Jaisawal et al., 2021), 2S 1417–624 (Serim et al., 2022), and KS 1947+300 (Reig & Nespoli, 2013). In the subcritical accretion regime, the negative correlation implied the hardening of the power-law continuum with flux. In the supercritical accretion regime, the positive correlation implied the softening of the power-law continuum with flux.
5 Conclusions
We have summarized the results of the timing and spectral analysis of the X-ray pulsar 2S 1417–624 during the outburst in 2021. The spin-up rate varied between during the outburst. A positive correlation is observed between the spin-up rate and luminosity during the outburst. The torque-luminosity model gives a surface magnetic field of the pulsar of G. The higher magnetic field may arise due to the closer distance as given by Gaia. The pulse profile showed multiple peaks and dips, which evolved with energy. The energy spectrum of the source was well described with a composite model consisting of a power-law with higher cut-off energy and a thermal blackbody component. The radius of the emitting region of the pulsar is estimated to be 12 km. The photon index showed an anti-correlation with X-ray flux below the flux level of erg cm-2 s-1. During the outburst, the source state evolved from a subcritical to a supercritical regime. The HID supported the state transition. A transition from the horizontal to the diagonal branch is observed from the HID. As flux increased, the spectrum became harder in the horizontal branch and softer in the diagonal branch.
Acknowledgements
We thank the anonymous reviewer for useful suggestions, which helped to improve the manuscript significantly. This research has made use of the MAXI data provided by RIKEN, JAXA, and the MAXI team. We acknowledge the use of public data from the NICER, and Fermi data archives.
Data Availability
The data underlying this article are publicly available in the High Energy Astrophysics Science Archive Research Center (HEASARC) at
https://heasarc.gsfc.nasa.gov/db-perl/W3Browse/w3browse.pl.
Statements & Declarations
Funding
The authors declare that no funds, grants, or other support were received during the preparation of this manuscript.
Competing Interests
The authors have no relevant financial or non-financial interests to disclose.
Author Contributions
All authors contributed to the study’s conception and design. Data analysis was performed by Manoj Mandal and Sabyasachi Pal. The first draft of the manuscript was jointly written by both authors. All authors read and approved the final manuscript.
References
- Apparao et al. (1980) Apparao, K.M.V., Naranan, S., Kelley, R.L., Bradt, H.V., 1980. 2S 1417–624: a variable galactic X-ray source near CG 312–1, A&A 89, 249–250.
- Bailer-Jones et al. (2018) Bailer-Jones C. A. L., Rybizki J., Fouesneau M., Mantelet G., Andrae R., 2018, AJ, 156, 58.
- Baykal et al. (2002) Baykal, A., Stark, M.J., Swank, J.H., 2002. X-ray spectra and pulse frequency changes in SAX J2103.5+4545, ApJ 569(2), 903–910.
- Becker et al. (2012) Becker, P.A., Klochkov, D., Schönherr, G., et al., 2012. Spectral formation in accreting X-ray pulsars: bimodal variation of the cyclotron energy with luminosity, A&A 544, A123.
- Bildsten et al. (1997) Bildsten, L., Chakrabarty, D., Chiu, J., et al., 1997. Observations of Accreting Pulsars, ApJS 113(2), 367–408.
- Epili et al. (2017) Epili, P., Naik, S., Jaisawal, G.K., Gupta, S., 2017. Decade long RXTE monitoring observations of Be/X-ray binary pulsar EXO 2030+375, MNRAS 472(3), 3455–3466.
- Finger et al. (2009) Finger, M.H., Beklen, E., Narayana, B.P., et al., 2009. Long-term Monitoring of Accreting Pulsars with Fermi GBM, arXiv e-prints, arXiv:0912.3847.
- Finger et al. (1996a) Finger, M.H., Wilson, R.B., Chakrabarty, D., 1996. Reappearance of the X-ray binary pulsar 2S 1417-624, A&AS 120, 209–212.
- Finger et al. (1996b) Finger, M.H., Wilson, R.B., Harmon, B.A., 1996. Quasi-periodic Oscillations during a Giant Outburst of A0535+262, ApJ 459, 288.
- Gehrels et al. (2004) Gehrels, N., Chincarini, G., Giommi, P., et al., 2004. The Swift gamma-ray burst mission, ApJ 611(2), 1005–1020.
- Gendreau et al. (2016) Gendreau, K.C. Arzoumanianab, Z., Adkins, W.P., et al., 2016, Proc. SPIE, Vol. 9905, The Neutron Star Interior Composition Explorer (NICER): Design and Development, p. 99051H.
- Ghosh & Lamb (1979a) Ghosh, P., Lamb, F.K., 1979a. Accretion by rotating magnetic neutron stars. II. Radial and vertical structure of the transition zone in disk accretion, ApJ 232, 259–276.
- Ghosh & Lamb (1979b) Ghosh, P., Lamb, F.K., 1979b. Accretion by rotating magnetic neutron stars. III. Accretion torques and period changes in pulsating X-ray sources, ApJ 234, 296–316.
- Gupta et al. (2018) Gupta, S., Naik. S., Jaisawal, G.K., Epili, P.R., 2018. Spectral and timing studies of 2S 1417-624 during a giant outburst, MNRAS 479(4), 5612–5619.
- Gupta et al. (2019) Gupta, S., Naik, S., Jaisawal, G.K., 2019. NuSTAR view of Be/X-ray binary pulsar 2S 1417–624 during 2018 giant outburst, MNRAS 490(2), 2458–2466.
- Hazra et al. (2021) Hazra, M., Pal, S., Mandal, M., et al., 2021. Swift/MAXI/Fermi detection of strong X-ray activity from 2S 1417–624, The Astronomer’s Telegram, 14349, 1.
- Hickox et al. (2004) Hickox R. C., Narayan R., Kallman T. R., 2004. Origin of the Soft Excess in X-Ray Pulsars, ApJ 614, 881–896.
- İnam et al. (2004) İnam, S. Ç., Baykal, A., Matthew Scott, D, et al., 2004. X-ray flux related timing and spectral features of 2S 1417-62, MNRAS, 349(1), 173–180.
- Jaisawal et al. (2016) Jaisawal, G.K., Naik, S., Epili, P., 2016. Suzaku view of the Be/X-ray binary pulsar GX 304–1 during Type I X-ray outbursts, MNRAS 457(3), 2749–2760.
- Jaisawal et al. (2021) Jaisawal G. K., Naik S., Gupta S., Agrawal P. C., Jana A., Chhotaray B., Epili P. R., 2021, JApA, 42, 33.
- Ji et al. (2020) Ji, L., Doroshenko, V., Santangelo, A., et al., 2020. Timing analysis of 2S 1417-624 observed with NICER and Insight-HXMT, MNRAS 491(2), 1851–1856.
- Kabiraj & Paul (2020) Kabiraj, S., Paul, B., 2020. Broad-band X-ray characteristics of the transient pulsar GRO J2058+42, MNRAS 497(1), 1059–1065.
- Krimm et al. (2013) Krimm, H.A., Holland, S.T., Corbet, R.H.D., et al., 2013. The Swift/BAT Hard X-ray Transient Monitor, ApJS 209(1), 14.
- Leahy (1987) Leahy, D.A., 1987. Searches for pulsed emission - Improved determination of period and amplitude from epoch folding for sinusoidal signals, A&A 180(1–2), 275–277.
- Mandal & Pal (2022) Mandal, M., Pal, S., 2022. Study of timing and spectral properties of the X-ray pulsar 1A 0535+262 during the giant outburst in 2020 November-December, MNRAS, 511, 1121.
- Matsuoka et al. (2009) Matsuoka, M., Kawasaki, K., Ueno, S., et al., 2009. The MAXI Mission on the ISS: Science and Instruments for Monitoring All-Sky X-Ray Images, PASJ 61, 999–1010.
- Meegan et al. (2009) Meegan, C., Lichti, G., Bhat, P.N., et al., 2009. The Fermi gamma-ray burst monitor, ApJ 702(1), 791–804.
- Malacaria et al. (2020) Malacaria C., Jenke P., Roberts O. J., Wilson-Hodge C. A., Cleveland W. H., Mailyan B., GBM Accreting Pulsars Program Team, 2020. The Ups and Downs of Accreting X-ray Pulsars: Decade-long Observations with the Fermi Gamma-Ray Burst Monitor ApJ 896(1), 90.
- Naik et al. (2013) Naik, S., Maitra, C., Jaisawal, G.K., Paul, B., 2013. Timing and Spectral properties of Be/X-ray pulsar EXO 2030+375 during a Type I outburst, ApJ 764(2), 158.
- Parmar et al. (1989) Parmar, A.N., White, N.E., Stella, L., 1989. The transient 42 second x-ray pulsar EXO 2030+375. II. The luminosity dependence of the pulse profile, ApJ 338, 373.
- Raichur & Paul (2010) Raichur, H., Paul, B., 2010. Apsidal motion in 4U 0115+63 and orbital parameters of 2S 1417–624and V0332+53, MNRAS 406(4), 2663–2670.
- Reig & Nespoli (2013) Reig, P., Nespoli, E., 2013. Patterns of variability in Be/X-ray pulsars during giant outbursts, A&A 551, A1.
- Remillard et al. (2022) Remillard R. A., Loewenstein M., Steiner J. F., Prigozhin G. Y., LaMarr B., Enoto T., Gendreau K. C., et al., 2022, AJ, 163, 130.
- Reynolds et al. (1996) Reynolds, A.P., Parmar, A.N., Stollberg, M.T., Verbunt, F., Roche, P., Wilson, R.B., Finger, M.H., 1996. Accretion torques in the transient X-ray pulsar EXO 2030+375, A&A 312, 872.
- Serim et al. (2022) Serim M. M., Özüdoğru Ö. C., Dönmez Ç. K., Şahiner Ş., Serim D., Baykal A., İnam S. Ç., 2022. Timing and spectral analysis of 2S 1417-624 during its 2018 outburst, MNRAS, 510, 1438.
- Sugizaki et al. (2017) Sugizaki, M., Mihara, T., Nakajima, M., Makishima, K., 2017. Correlation between the luminosity and spin-period changes during outbursts of 12 Be binary pulsars observed by the MAXI/GSC and FERMI/GBM, PASJ 69(6), 100.
- Tsygankov et al. (2017) Tsygankov, S.S., Wijnands, R., Lutovinov, A.A., Degenaar, N., Poutanen, J., 2017. The X-ray properties of Be/X-ray pulsars in quiescence, MNRAS 470(1), 126–141.
- Zhang et al. (2019) Zhang Y., Ge M., Song L., Zhang S., Qu J., Zhang S., Doroshenko V., et al., 2019, Insight-HXMT Observations of Swift J0243.6+6124 during Its 2017-2018 Outburst, ApJ, 879, 61.