Understanding X-ray and optical selection of galaxy clusters: A comparison of the XXL and CAMIRA cluster catalogues obtained in the common XXL-HSC SSP area
Abstract
Large samples of galaxy clusters provide knowledge of both astrophysics in the most massive virialised environments and the properties of the cosmological model that defines our Universe. However, an important issue that affects the interpretation of galaxy cluster samples is the role played by the selection waveband and the potential for this to introduce a bias in the physical properties of clusters thus selected. We aim to investigate waveband-dependent selection effects in the identification of galaxy clusters by comparing the X-ray Multi-Mirror (XMM) Ultimate Extra-galactic Survey (XXL) and Subaru Hyper Suprime-Cam (HSC) CAMIRA cluster samples identified from a common 22.6 deg2 sky area. We compare 150 XXL and 270 CAMIRA clusters in a common parameter space defined by X-ray aperture brightness and optical richness. We find that 71/150 XXL clusters are matched to the location of a CAMIRA cluster, the majority of which (67/71) display richness values that exceed the CAMIRA catalogue richness threshold. We find that 67/270 CAMIRA clusters are matched to the location of an XXL cluster (defined within XXL as an extended X-ray source). Of the unmatched CAMIRA clusters, the majority display low X-ray fluxes consistent with the lack of an XXL counterpart. However, a significant fraction (64/107) CAMIRA clusters that display high X-ray fluxes are not asociated with an extended source in the XXL catalogue. We demonstrate that this disparity arises from a variety of effects including the morphological criteria employed to identify X-ray clusters and the properties of the XMM PSF.
keywords:
galaxies: clusters: general1 Introduction
The identification of large samples of galaxy clusters from observations compiled at various wavelengths represents a mature field of study. Wavebands and techniques employed to identify galaxy clusters include the identification of spatial overdensities of galaxies displaying characteristically-red colours from optical and NIR imaging data (Postman et al., 1996; Gladders & Yee, 2000; Rykoff et al., 2014; Oguri, 2014; Maturi et al., 2019), the detection of optically-thin X-ray photons resulting from bremsstrahlung emission from the hot, baryonic intra-cluster medium (ICM; Gioia et al. 1990; Böhringer et al. 2001; Clerc et al. 2012), the observation of a Sunyaev Zel’dovich (SZ) decrement caused by inverse Compton scattering of cosmic microwave background (CMB) photons by electrons in the cluster ICM (Staniszewski et al., 2009; Marriage et al., 2011; Reichardt et al., 2013; Planck Collaboration et al., 2016), and the detection of weak lensing shear in the images of background galaxies arising from the cluster gravitational potential (Miyazaki et al., 2002; Wittman et al., 2006; Gavazzi & Soucail, 2007; Miyazaki et al., 2018b).
One aspect of the study of galaxy clusters that is less well understood however, is the relationship between the observing waveband and the average physical properties of cluster samples thus generated. Much work has been undertaken to understand the multi-wavelength properties of galaxy clusters detected in a given waveband and, in particular, to express these properties via scaling relationships (e.g. Rozo et al., 2014; Rozo & Rykoff, 2014). An associated approach attempts to understand the combination of effects that lead to a given fraction of galaxy clusters within a sample being detected in one waveband but not another, e.g. an optically identified galaxy cluster not being detected in X-ray (Donahue et al., 2002; Sadibekova et al., 2014). Further understanding is achieved by performing detailed multi-wavelength follow-up studies of galaxy clusters identified in a particular waveband (e.g. Rossetti et al., 2017; Andrade-Santos et al., 2017; Zhang et al., 2019).
We have previously considered aspects of this question in Willis et al. (2018) where we compared the physical properties of two distant cluster samples: the X-ray selected XMM-LSS survey and the optical-MIR selected SpARCS sample. The results of this comparison indicated that many of the observed differences between the two cluster samples could be interpreted in terms of a larger uncertainty in the centroid estimation resulting from MIR galaxy overdensity compared to X-ray emission. Furthermore, MIR selected clusters were found to have marginally more numerous red sequence populations compared to X-ray selected clusters of comparable X-ray brightness. Ultimately, the relatively small number of clusters compared (19 XMM-LSS and 92 SpARCS) limited the extent to which physical differences between the two samples could be resolved. This led us to seek a more comprehensive comparison, between cluster samples from the XXL X-ray survey (Pierre et al., 2016, hereafter XXL Paper I) and the Subaru Hyper Suprime-Cam (HSC) optical imaging survey known as HSC Subaru Strategic Program (HSC-SSP; Miyazaki et al., 2018a; Aihara et al., 2018a), as presented in this paper.
The structure of this paper is as follows: In Section 2 we describe the two cluster samples and perform a simple matching analysis. We then compute scaling relations for each sample prior to defining cluster sub-samples on the basis of X-ray aperture photometry and cluster richness measurements. In Section 3 we compile a number of physical measurements for each cluster sub-sample before moving to Section 4 where we discuss and attempt to explain the nature of the physical differences between each cluster sub-sample. We draw our conclusions in Section 5. Where necessary, we assume a Friedmann-Lemaître-Robertson-Walker cosmological model described by the parameters , , . In this model a transverse physical scale of 700 kpc observed at a redshift corresponds to an angular scale of 1.75 arcminutes.
2 The cluster samples
The XXL sample employed in this paper consists of 150 clusters presented within Adami et al. 2018 (hereafter XXL Paper XX). This version of the XXL catalogue results from the processing of individual XMM pointings with version 3.3 of the Xamin pipeline and is limited to sources at XMM off axis angles arcminutes. Clusters in this catalogue have and are selected as either class 1 or class 2 (C1 and C2) extended sources on the basis of their surface brightness characteristics as defined by Pacaud et al. (2006) and Pacaud et al. (2016) (hereafter XXL Paper II). Sources for which a point source model produces a statistically acceptable fit are labelled as P1. The remaining sources for which neither an extended source model (C1 or C2) nor a point source model (P1) produce an acceptable characterisation are labelled as P0 in the XXL database. Though such sources typically lack sufficient X-ray photon counts to generate a statistically acceptable fit the full sample of P0 and P1 sources expected to be dominated numerically by extra-galactic X-ray point sources. In the following discussion, we refer to both P0 and P1 sources from the XXL version 3.3 catalogue as point sources, although we recognise that individual point sources may represent faint extended sources where low source counts prevent a statistically acceptable classification. This issue is potentially of importance for the case of X-ray point sources studied along the line of sight to clusters detected in optical wavebands. In such cases the cluster detection effectively acts as a prior selection applied to the P0 and P1 sample.
Of the 150 XXL clusters, 142 are confirmed spectroscopically whereas the remaining 8 clusters possess a photometric redshift (XXL Paper XX). The number of XXL clusters employed in this paper is slightly greater than that used in the joint HSC-XXL weak lensing study of Umetsu et al. (2020, 150 compared to 136 clusters) as in the present paper we select clusters from a common sky area with no prior selection based upon relative cluster positions.
The HSC sample consists of 289 clusters around the XXL region selected from the S17A data release (Aihara et al., 2018b, 2019) employing the CAMIRA red-sequence detection algorithm (Oguri, 2014; Oguri et al., 2018). Of these, 270 clusters lie within 13 arcminutes of an XMM pointing. Detected clusters are characterised by a red-sequence derived photometric redshift and a stellar-mass corrected richness () measured using a spatially extended filter of radial scale 0.8 Mpc (see Oguri, 2014, and Section 2.2 for more details). The photometric redshift accuracy of the CAMIRA catalogue is estimated to be (Oguri et al., 2018). The CAMIRA sample is restricted to and richness .
The common sky area between the XXL and HSC-SSP surveys was computed using a method similar to that presented in (Umetsu et al., 2020, their Figure 1), i.e. we computed the overlap between the HSC-SSP survey and the grid of XXL XMM pointing centres with the additional constraint that only the area with 13 arcminutes of each XMM pointing centre contributed to the area calculation. Using this method we obtain a common sky area of 22.6 square degrees.
2.1 X-ray aperture photometry
The common sky area of each cluster sample has been observed by XMM-Newton as part of the XXL survey which consists of a contiguous field of 10 ks XMM exposures (XXL Paper I). We performed X-ray aperture photometry in the [0.5-2] keV waveband at the sky location of all clusters following the procedure described in Willis et al. (2018), i.e. apertures are placed at the X-ray centroid for XXL clusters and at the optical centroid for CAMIRA clusters. X-ray photometry was performed in a circular aperture of radius 500 kpc which corresponds to a scale approximately 111Where is defined as the physical radius within which the average cluster density exceeds 500 times the critical density of the universe at that redshift. inferred for X-ray bright XXL clusters (Umetsu et al., 2020). In particular, point sources were excluded from the aperture photometry with a purely geometric correction applied to account for the reduced area sampling. Point source locations were obtained from the Xamin pipeline and represent all X-ray sources not classified as C1 or C2 (Faccioli et al., 2018, hereafter XXL Paper XXIV). The Xamin pipeline employs SExtractor (Bertin & Arnouts, 1996) to create a segmentation map that is used to mask each point source, whose extent varies but is normally much smaller than the 500 kpc rest-frame aperture size used for photometry. We further compute the X-ray luminosity of each cluster () employing the aperture flux, a distance modulus calculated from the cluster redshift and a -correction based upon a standard, keV plasma emission model (Willis et al., 2018).
2.2 Computing CAMIRA richness values for XXL clusters
We follow the standard algorithm in CAMIRA to compute richness (Oguri 2014). For each peak in a three-dimentional richness map, it first identifies a central cluster galaxy (CCG) candidate that maximizes the likelihood function consisting of the stellar mass filter, the member galaxy likelihood, and spatial filter, such that a massive galaxy located in the red-sequence and within Mpc from the peak is selected as a CCG candidate. After the CCG candidate is identified, CAMIRA re-computes the cluster photometric redshift by combining photometric redshift estimates of red-sequence galaxies around the CCG candidate and re-computes richness by summing up the number parameter of galaxies around the CCG candidate with a spatial filter of with , Mpc, and being Gamma function (see Oguri 2014 for more details). With this spatial filter, the number of galaxies within Mpc is used to define the richness. The spatial filter is a compensated filter and thus subtracts the background level from the number density of red galaxies around each cluster. We again search for a new CCG candidate with the new center and the cluster redshift, and repeat the process mentioned above until it converges.
As in the case of X-ray aperture photometry, here we want to compute richness for all the XXL clusters. To do so, we simply replace peaks in the three-dimentional richness map with X-ray centroids and redshifts of XXL clusters and compute the richness for each XXL cluster using the same procedure as mentioned above.
2.3 Matching results and the definition of cluster subsamples
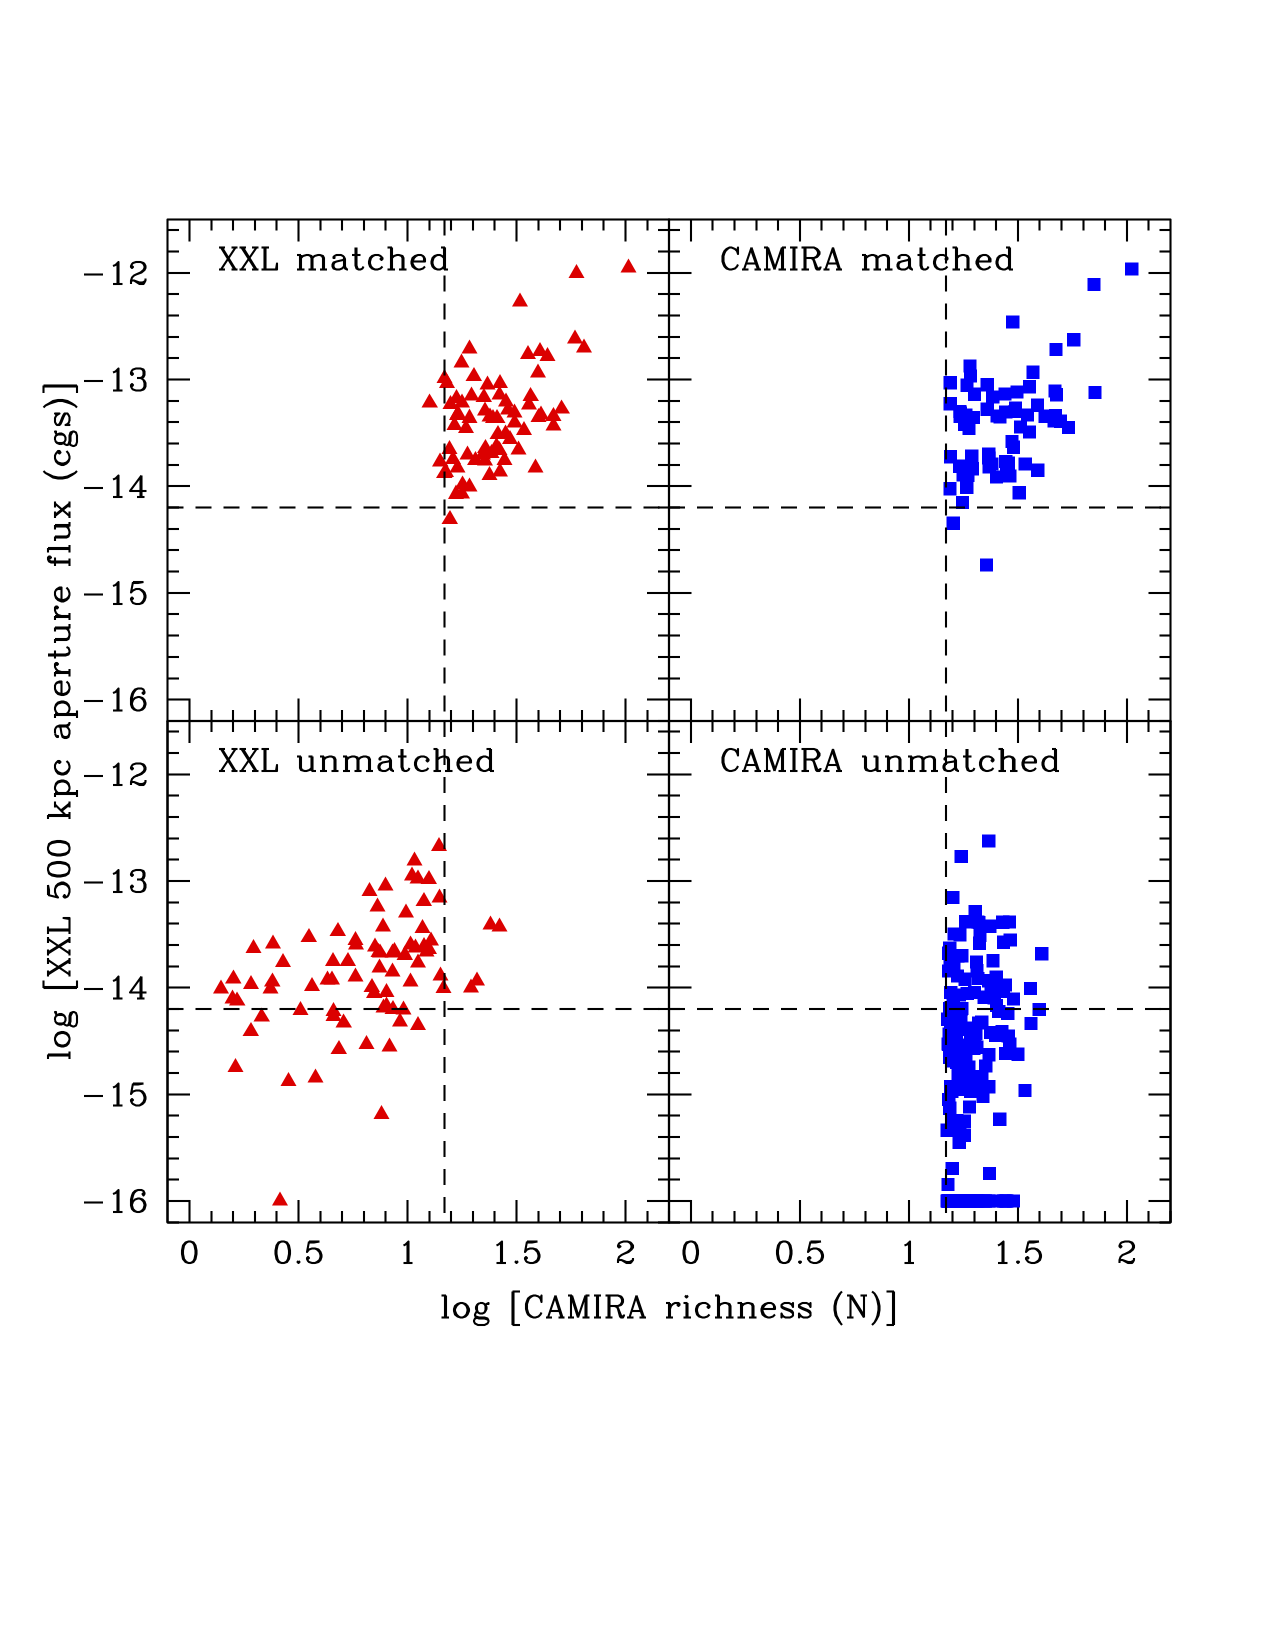
Figure 1 shows 500 kpc aperture X-ray flux () versus CAMIRA measured richness () for all clusters. To further our understanding of the XXL and CAMIRA samples clusters from each catalogue were matched according to a positional and redshift tolerance. Cluster detections were considered to be matched if they displayed a rest-frame transverse physical offset within 700 kpc (computed at the redshift of the cluster about which a match was being sought). In addition we applied the criterion that the difference between the XXL and CAMIRA catalogue redshifts should be . Matching results are summarised in Table 1 and employ cluster sub-samples defined in the following discussion.
| Sample | matched | unmatched |
|---|---|---|
| XXL | 67/71 | 4/71 |
| XXL | 0/79 | 79/79 |
| CAMIRA (cgs) | 64/107 | 43/107 |
| CAMIRA (cgs) | 3/163 | 160/163 |
It is immediately apparent that approximately all XXL clusters that display a richness of are matched to a cluster in the CAMIRA catalogue. However, the converse is not true, a sizeable fraction of CAMIRA clusters (displaying by definition) that are of comparable X-ray aperture flux to XXL clusters are not matched to a XXL cluster. Note that, as we discuss in Section 2.1, despite not being matched to an XXL C1 or C2 cluster, many unmatched CAMIRA clusters have detectable X-ray emission. Determining the physical cause of this apparent disparity motivates the remainder of the paper.
Although the XXL cluster sample is limited by X-ray surface brightness (Pacaud et al. 2006; XXL Paper II), it can reasonably be approximated to a flux limited sample at fixed core radius (Figure 8 of Pacaud et al., 2006). We therefore apply a flux limit of (cgs) to the CAMIRA cluster sample (see Figure 1). Note that this limit is approximately two times fainter than the value of (cgs) corresponding to the 100% XMM on-axis completeness limit presented by XXL Paper XX222Note that XXL Paper XX measure fluxes within a 1 arcminute radius circular aperture compared to the 500 kpc radius aperture (1.25 arcminutes at using the adopted cosmological model) employed in this paper.. The limit of (cgs) presented in this paper selects 107 CAMIRA clusters which we refer to as “high flux” in the following discussion. Of these high flux CAMIRA clusters, 64 are matched to an XXL cluster (see Table 1).
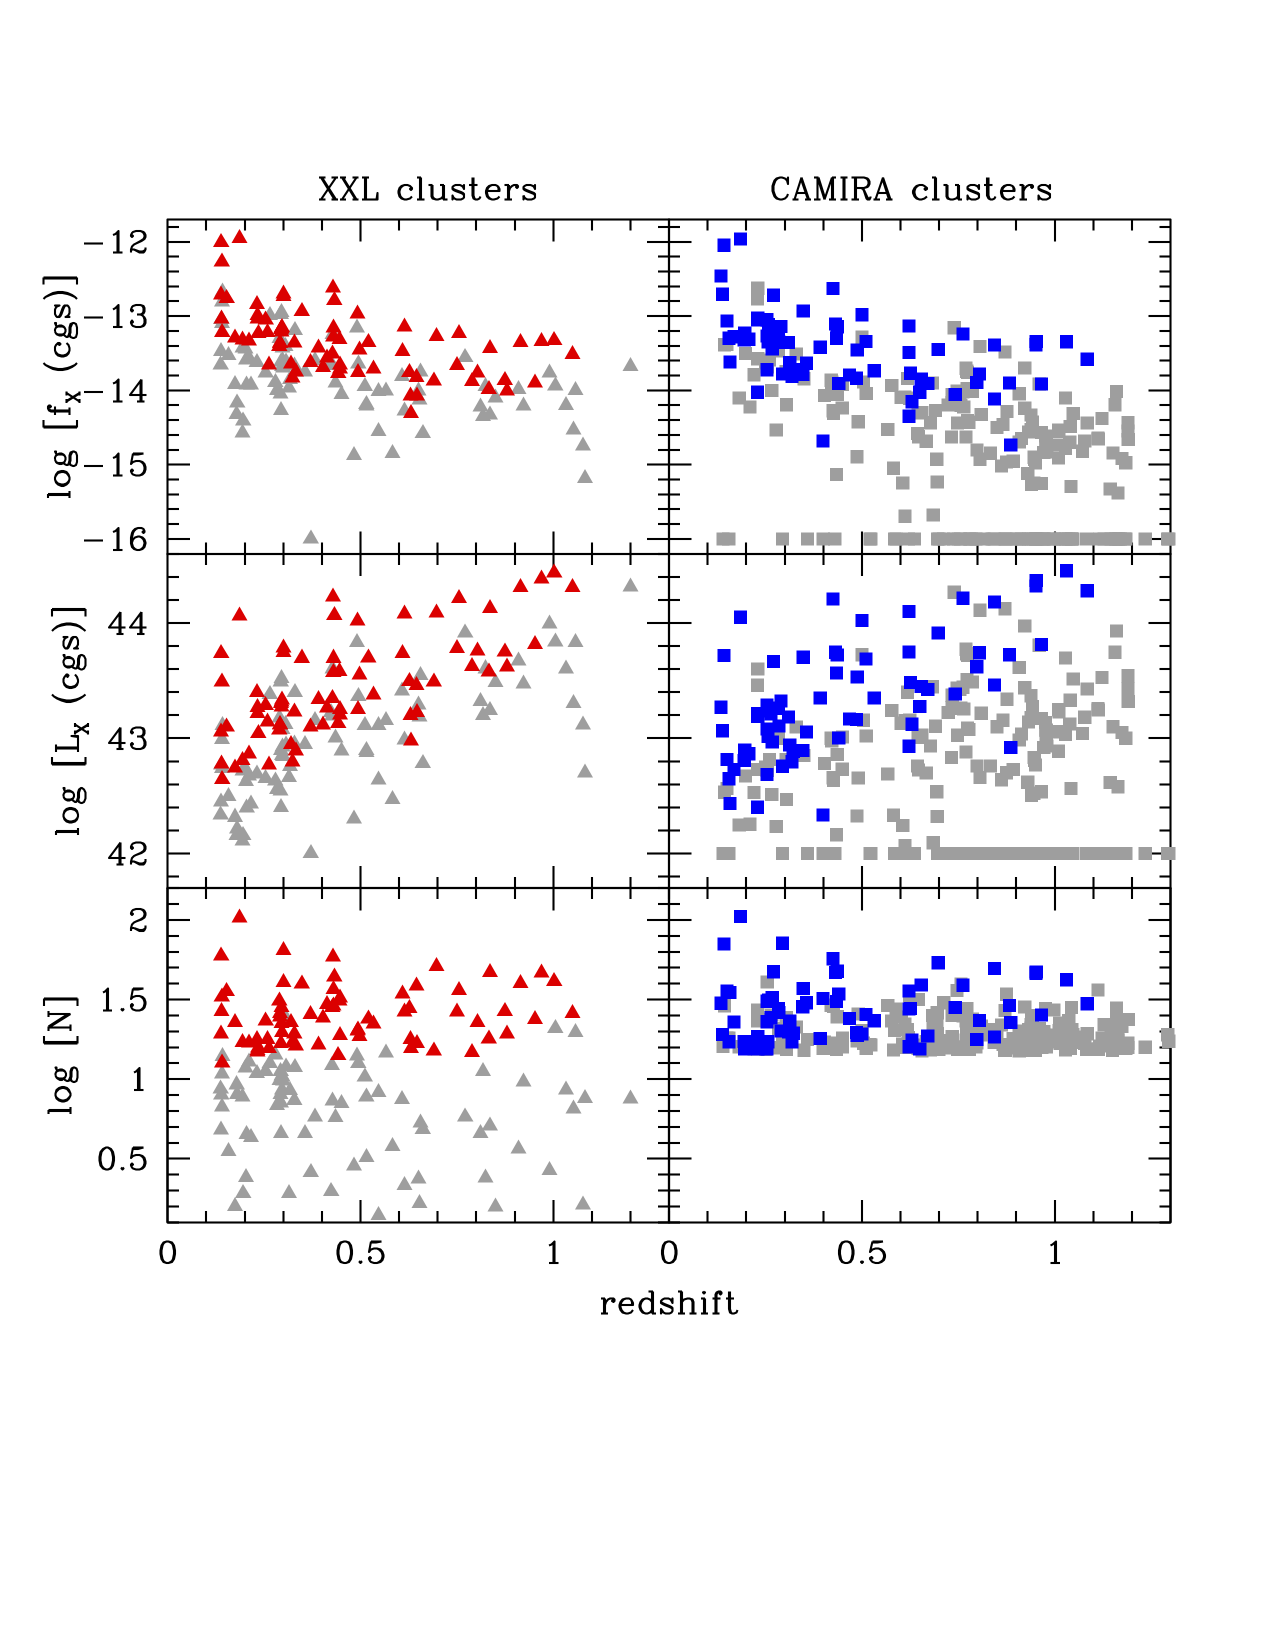
Of the 163 clusters that lie below this flux limit, which we refer to as “low flux” in the following discussion, only 3 are matched to an XXL cluster. The simplest explanation is that these low flux clusters are too faint to be unambiguously flagged as extended sources by the XXL pipeline. Though such sources may represent true extended sources, there are insufficient X-ray photons to permit a statistically acceptable characterisation. Such sources are labelled P0 in the XXL catalogue. Figure 2 displays the trends of flux, luminosity and richness in both the XXL and CAMIRA samples and demonstrates that the low flux CAMIRA clusters are high to moderate luminosity clusters viewed at high () redshift. Of the 107 high-flux CAMIRA clusters, 43 remain unmatched to an XXL cluster.
Figure 3 demonstrates that the redshift and distributions of the matched and unmatched high flux CAMIRA samples are essentially identical. A 2-sided Kolmogorov-Smirnov (KS) test applied to the redshift and luminosity distributions respectively generates -values that the two samples are drawn from the same population of 0.16 and 0.43. Therefore, while it is advantageous to present cluster sub-sample definitions in terms of intrinsic cluster properties, e.g. X-ray luminosity, it is clear that application of a flux threshold identifies samples of matched and unmatched CAMIRA clusters that are comparable in terms of their X-ray luminosities.

One question to be answered therefore is whether the high flux matched and unmatched CAMIRA clusters display any discernable differences in their physical properties that would explain the matching results.
The situation with the XXL clusters is more straightforward to understand. The CAMIRA sample to which XXL is matched displays by definition and the XXL matching results reflect the effect of this threshold. There are 71 XXL clusters displaying , of which 67 are matched to a CAMIRA cluster. The 4 unmatched clusters are either affected by local, bright stars or are at the extremes of the CAMIRA redshift selection interval. There are 79 XXL clusters that display and none of these is matched to a CAMIRA cluster. A second question that we will investigate in this paper concerns the properties of the matching clusters between XXL and CAMIRA and whether there exist any subtle differences between them caused by the effects of X-ray versus optical selection methods.
We therefore define the following cluster sub-samples that form the basis for further investigation in this paper (see Table 1).
-
1.
XXL : These X-ray selected clusters exceed the CAMIRA catalogue richness threshold and would normally be expected to be detected by the CAMIRA algorithm as an optical cluster. These clusters are referred to as “XXL ” in the rest of the paper.
-
2.
XXL : These X-ray selected clusters do not exceed the CAMIRA catalogue richness threshold and would not normally be expected to be associated with an optically-detected cluster. These clusters are referred to as “XXL ” in the rest of the paper.
-
3.
CAMIRA (cgs): This flux limit contains 63/65 CAMIRA clusters matched to an XXL cluster. These optically-selected clusters therefore display comparable X-ray fluxes to the XXL sample and would nominally be expected to be identified as an X-ray cluster. Determining why 43 out of 107 CAMIRA clusters satisfying this flux limit are not matched to an XXL cluster is therefore of interest. These clusters are referred to as “high flux CAMIRA” in the rest of the paper.
-
4.
CAMIRA (cgs): These optically-selected clusters display lower X-ray flux values compared to the XXL sample and would nominally not be expected to be identified as an X-ray cluster by the XXL pipeline. These clusters are referred to as “low flux CAMIRA” in the rest of the paper.
2.4 Scaling relations
We derive scaling relations between XXL X-ray aperture luminosity and CAMIRA richness for the matched and unmatched XXL and CAMIRA samples using a Bayesian hierarchical method with latent variables. In common with Rozo & Rykoff (2014) we note that the scaling relations derived in this paper do not include any explicit information on the selection function for either the XXL or CAMIRA surveys. Instead, we employ the relative scaling relations derived for the matched and unmatched XXL and CAMIRA samples as a means of investigating whether each sample represents a single, coherent population of objects irrespective of whether they are matched or not.
The Bayesian fitting method employed here can deal with heteroscedastic and possibly correlated measurement errors, intrinsic scatters, upper and lower limits, systematic errors, missing data, forecasting, time evolution, and selection effects. A full description can be found in Sereno & Ettori (2015a); Sereno et al. (2015); Sereno (2015); Sereno & Ettori (2015b, 2017); Sereno et al. (2019) (also known as XXL Paper XXXVIII), which we refer to for details. In summary, we model the relation between richness and luminosity as a power-law with lognormal scatter. In formulae,
| (1) | |||||
| (2) |
By the notation , we mean that the relations are affected by a normal intrinsic scatter with standard deviation . The variable is the latent richness, which can differ from the observable one due to the intrinsic scatter . Although no explicit information on the XXL and CAMIRA selection functions is included in this analysis, the approach by which the independent variable is selected from a non-evolving Gaussian distribution provides a valid representation of the effects of a selection threshold in the mass-observable plane (see Appendix A1 of Sereno & Ettori, 2015a). We consider standard priors, see e.g. Sereno & Ettori 2015b.
For the richness, we consider a Poissonian uncertainty. For the unmatched clusters, we consider an upper limit in the detection, see App. A. Computations were performed with the R-package LIRA, see App. A.333The package LIRA (LInear Regression in Astronomy) is publicly available from the Comprehensive R Archive Network at https://cran.r-project.org/web/packages/lira/index.html. For further details, see Sereno (2016).
Figure 4 displays the central scaling relation fits and their uncertainties for each sample of clusters. These results are also detailed in Table 2. It is interesting to note that this analysis generates a slope () for the relation between and richness for the XXL () and CAMIRA () merged samples that is essentially identical to that reported by Rozo & Rykoff (2014) for a comparison of redMaPPer and Meta-Catalogue of X-ray Clusters (MCXC; ). Some caution is required however, as neither this analyis, nor that of Rozo & Rykoff (2014), attempts to model any selection effects.
A more detailed discussion of the scaling relation fits will be presented in Section 4. However, at this point, we consider whether the scaling relation analysis informs the question of whether the matched and unmatched clusters of either the XXL or CAMIRA samples can be considered as a single population in terms of their -richness scaling. The –richness scaling relations of the matched, unmatched and merged XXL sample are all consistent with one another – as one might expect, given that the XXL sample is X-ray selected and presents a continuous range of richness values. When matched to richness-selected CAMIRA clusters the matching results are strongly correlated with richness about the threshold applied to the CAMIRA catalogue. Though the scaling relations determined for the CAMIRA matched and unmatched samples are statistically different (with a large scatter in particular for the unmatched clusters), it is noteworthy that the scaling relations for the matched and merged samples (respectively containing 68 and 289 clusters) are very close in their values of normalisation, slope and scatter. This result would appear to support the assertion that the CAMIRA cluster sample represents a single, uniform population of galaxy clusters – at least as characterised on the –richness plane. It is therefore interesting to consider in the following sections why a large fraction of the CAMIRA clusters do not appear to be matched to an XXL counterpart.

| Sample | |||||
|---|---|---|---|---|---|
| XXL matched | 67 | ||||
| XXL unmatched | 83 | ||||
| XXL merged | 150 | ||||
| CAMIRA matched | 67 | ||||
| CAMIRA unmatched | 203 | ||||
| CAMIRA merged | 270 |
3 Results
Having defined each cluster sub-sample in Section 2.3 the next task is to determine whether each sub-sample presents measureable physical differences with respect to the others and what the cause of these differences might be. In this section we therefore report on the set of measurements performed on each cluster sub-sample and present the results. We defer a discussion of these results in the context of each cluster sub-sample until Section 4.
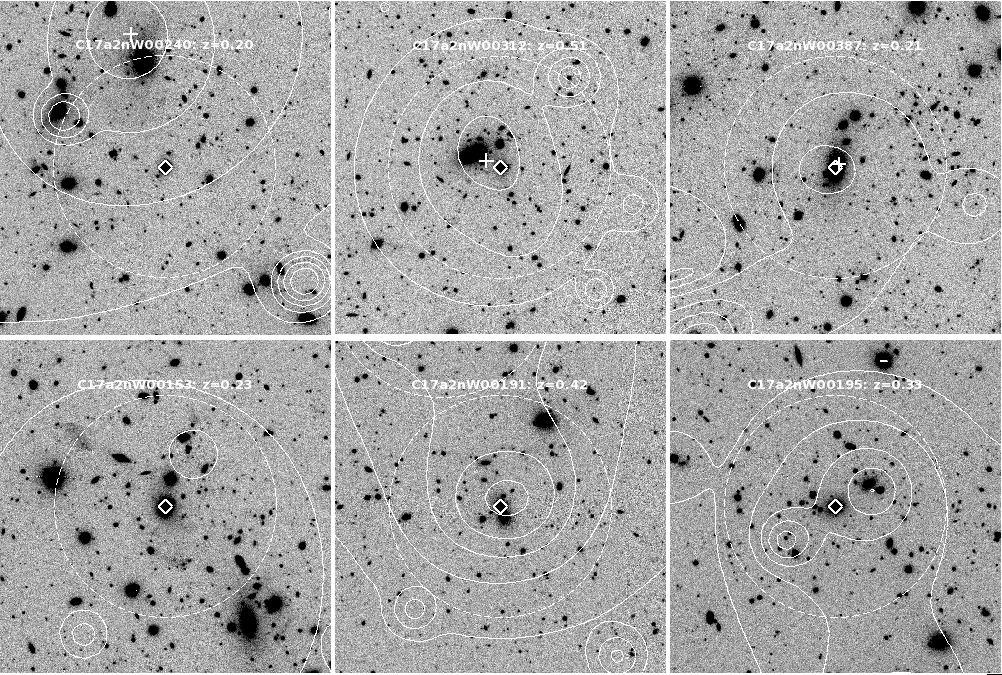
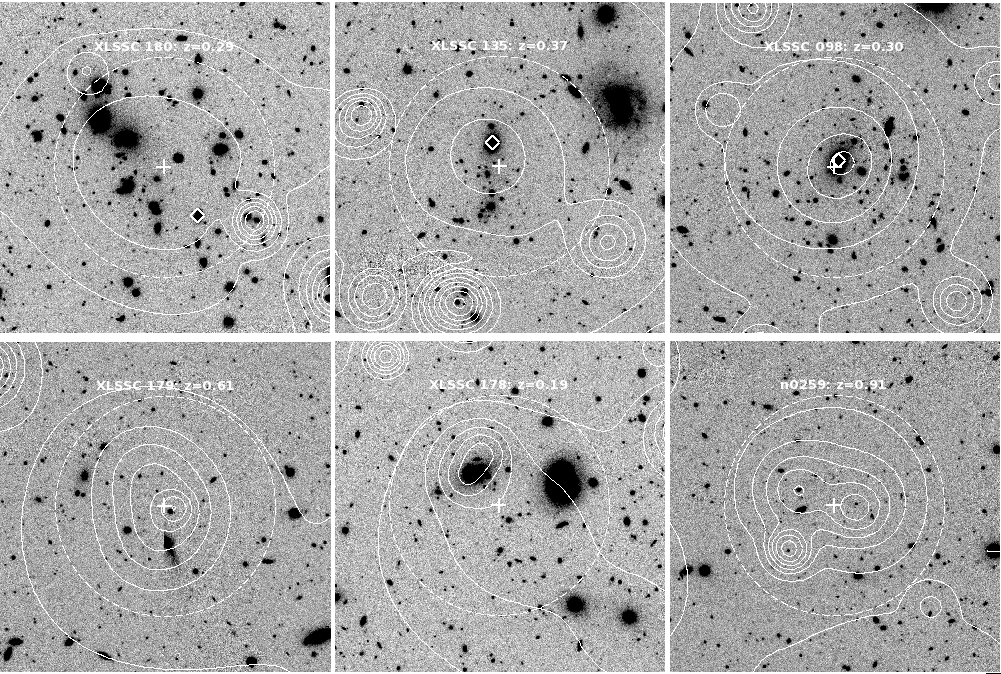
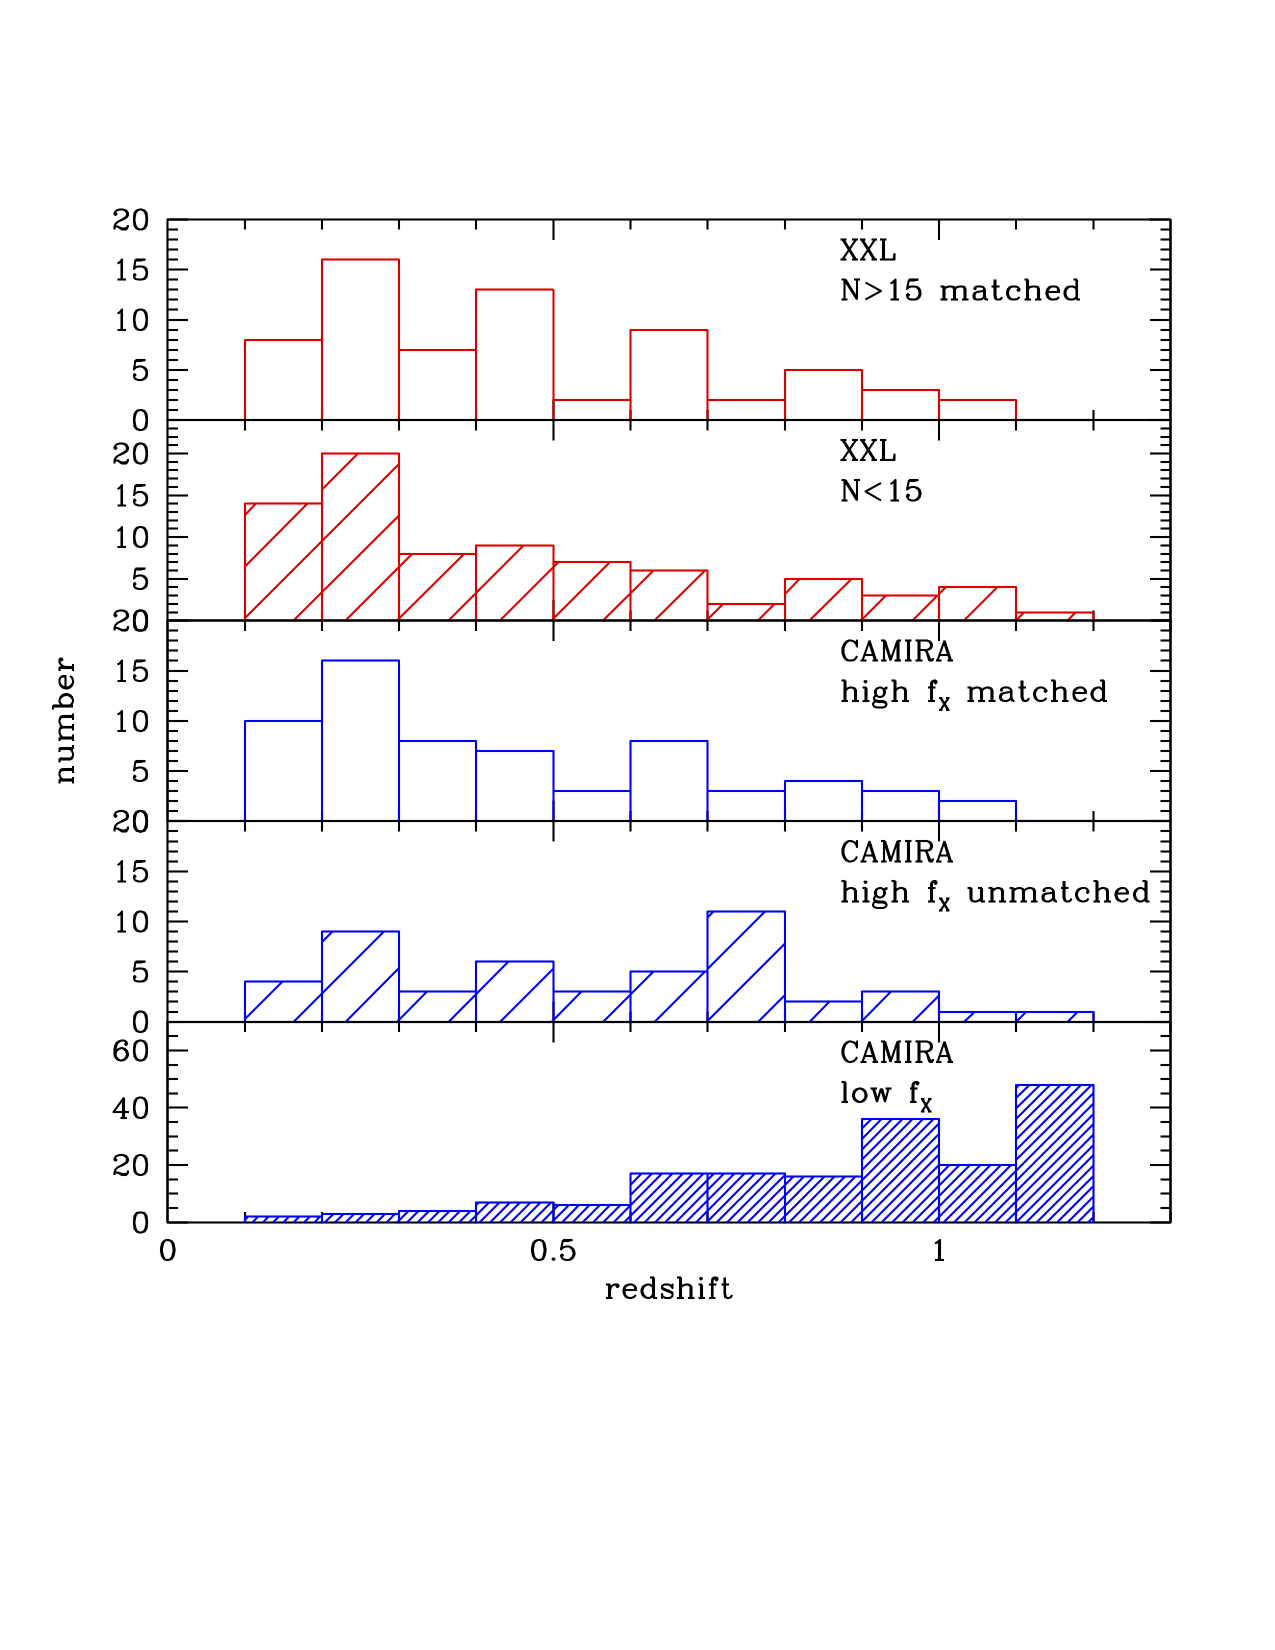
3.1 Cluster redshift distributions and visual assessment
In addition, in Figure 7 we plot the redshift histograms for each cluster sub-sample.
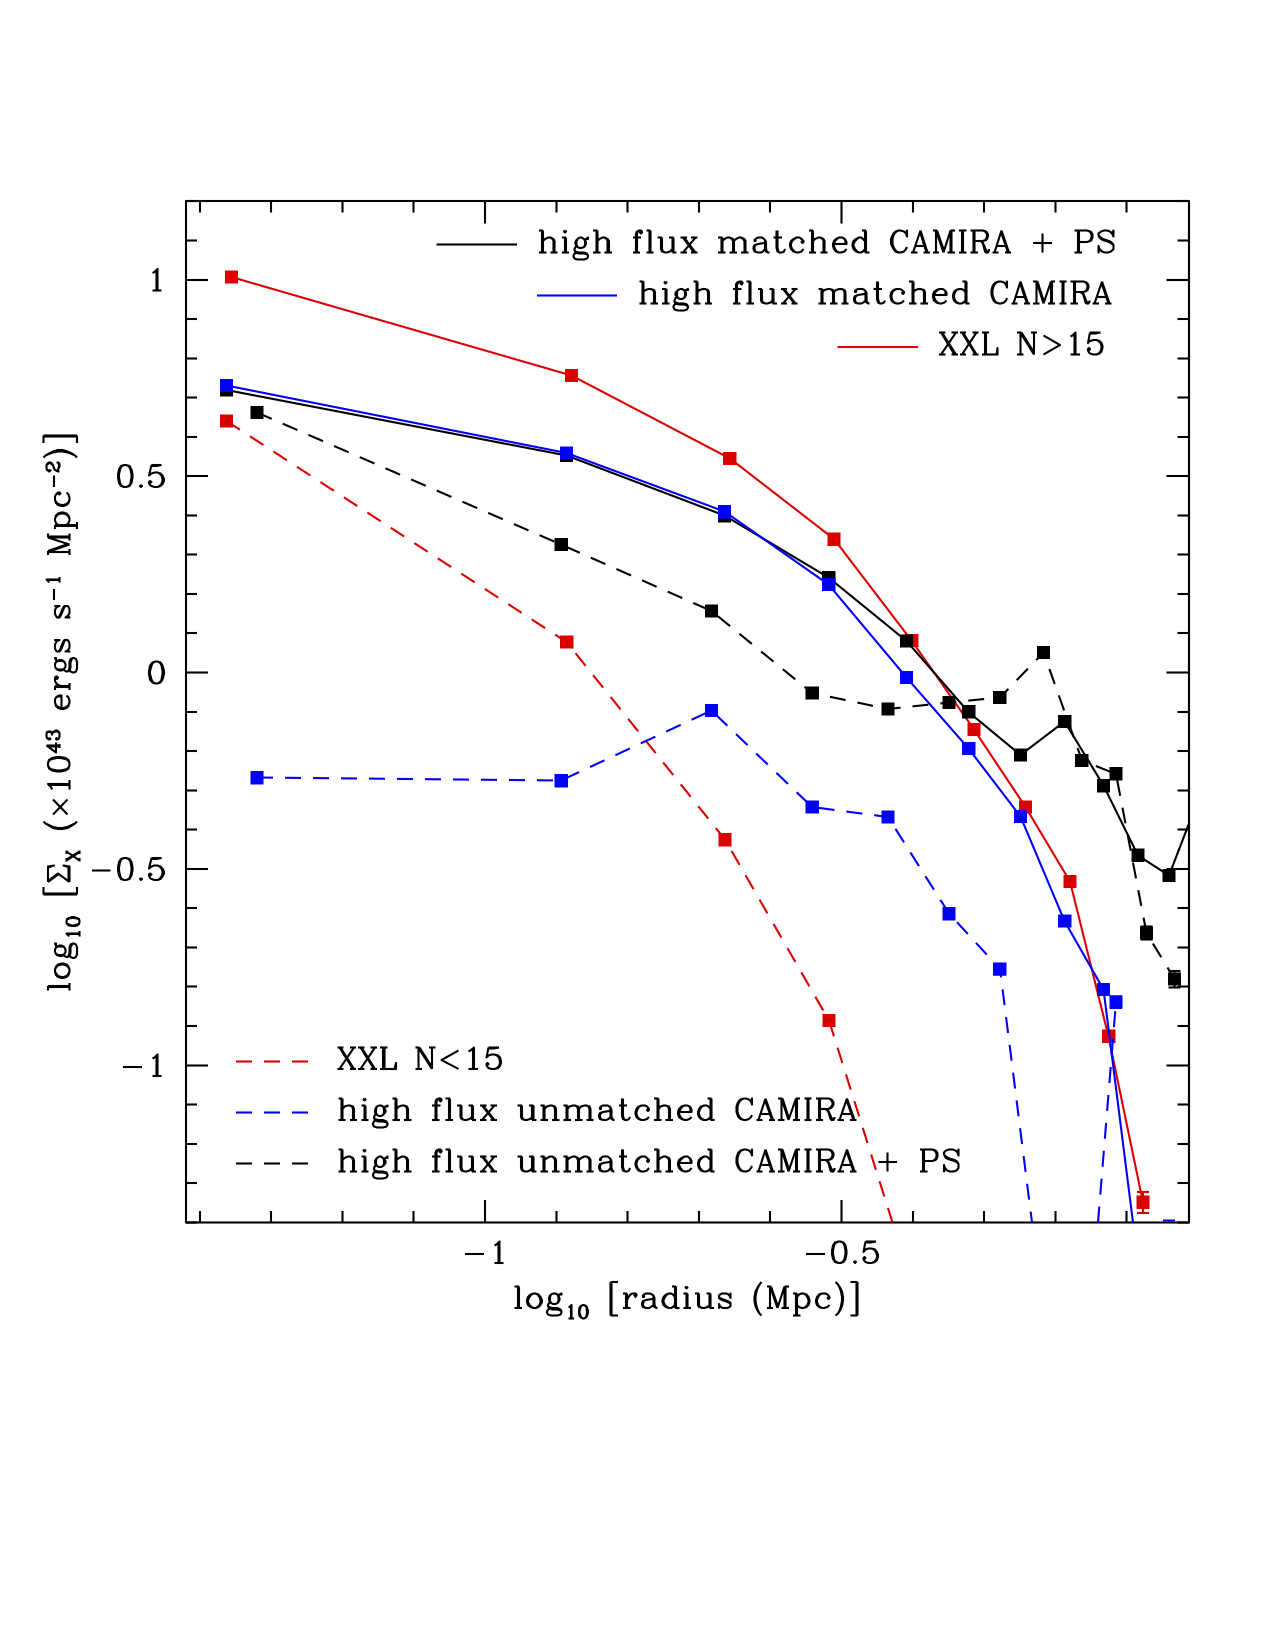
3.2 Stacked X-ray surface brightness profiles
We employ the procedure presented in Willis et al. (2018) to generate a stacked image in physical space of each cluster sub-sample defined in Section 2.3. The stacking procedure excludes point sources identified by the Xamin pipeline as described in Section 2.1. However, as a test of this procedure, we also compute stacked images for the CAMIRA cluster sub-samples without the exclusion of point sources. We compute a circular-average surface brightness profile for each stacked cluster sub-sample image and present them in Figure 8.
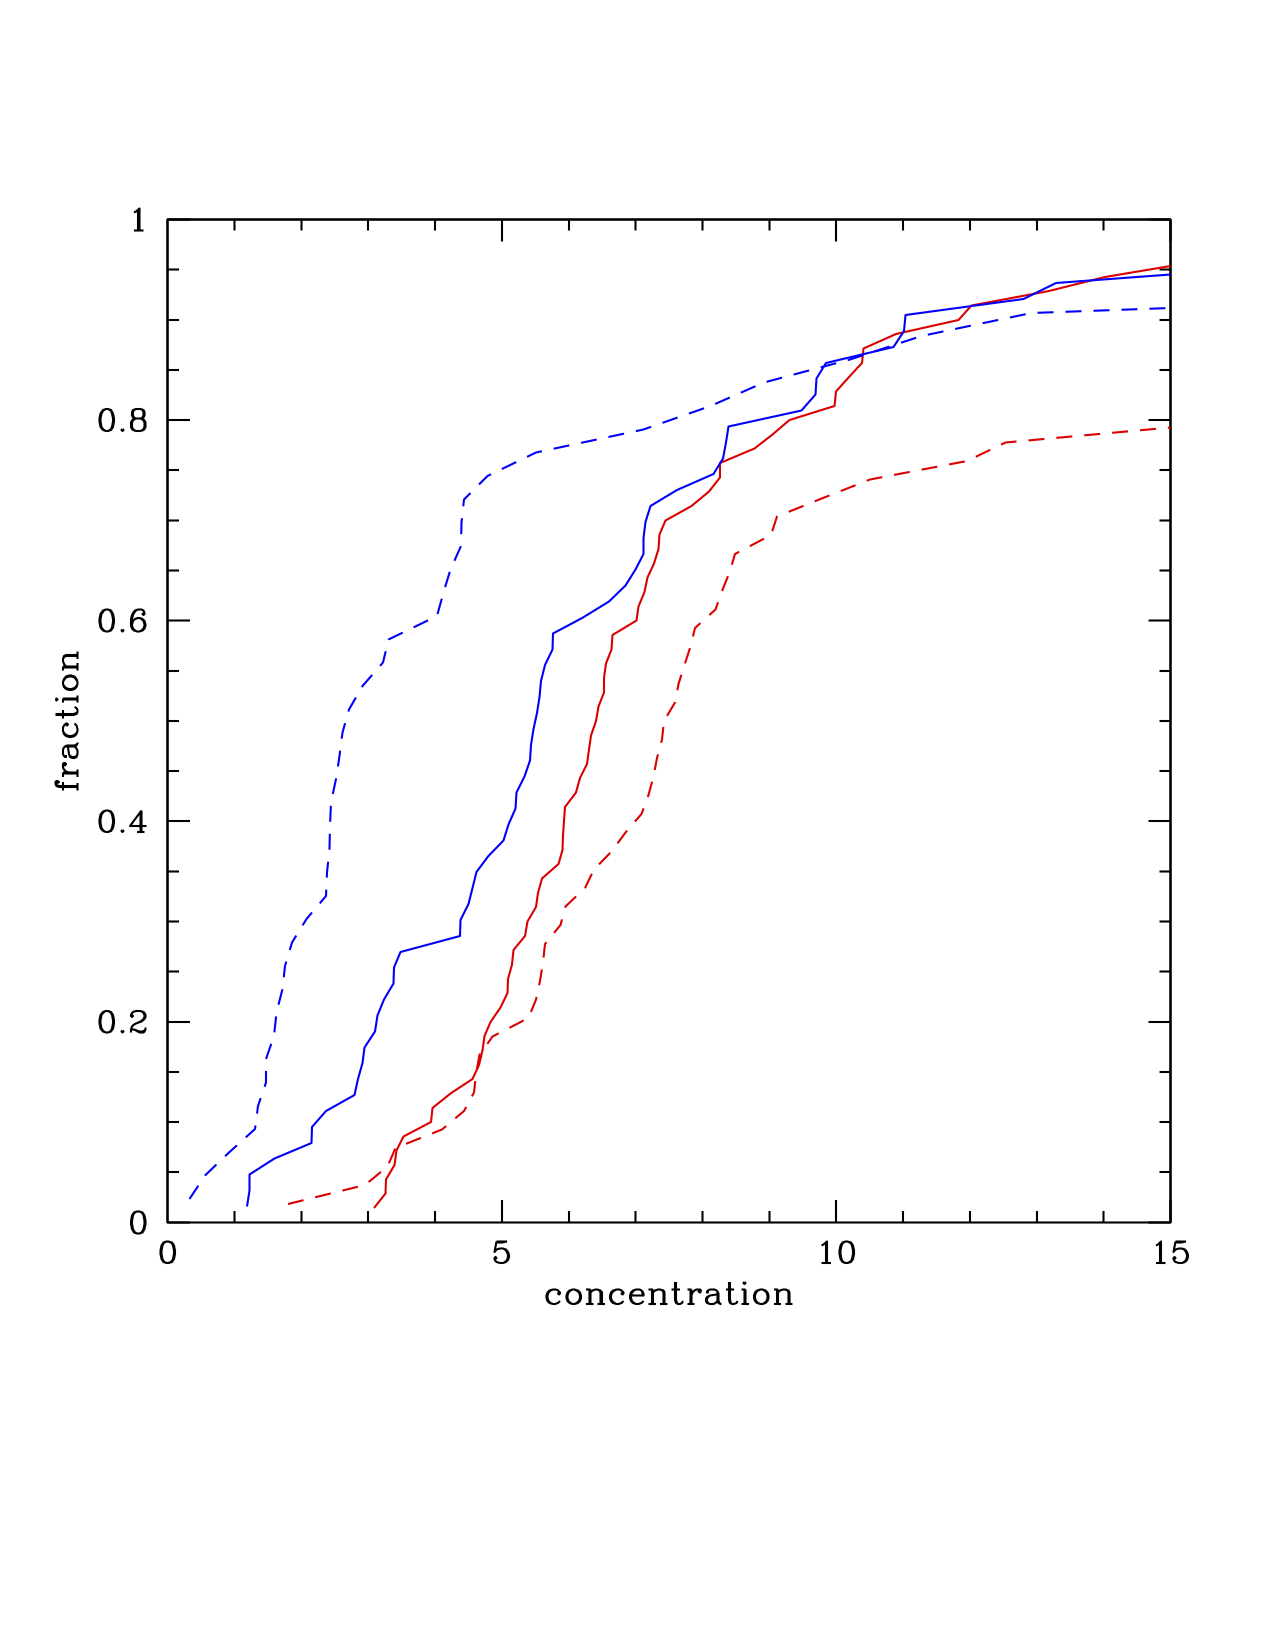
An alternative method of investigating the X-ray morphology of galaxy clusters is to compute the concentration of X-ray emission defined as the ratio of the X-ray surface brightness measured in two circular apertures of differing radius (e.g. Santos et al., 2008). We define concentration as the surface brightness ratio measured within circular apertures of radius 300 and 1000 kpc centred on each cluster and display the cumulative distribution of these values for each cluster sub-sample in Figure 9.
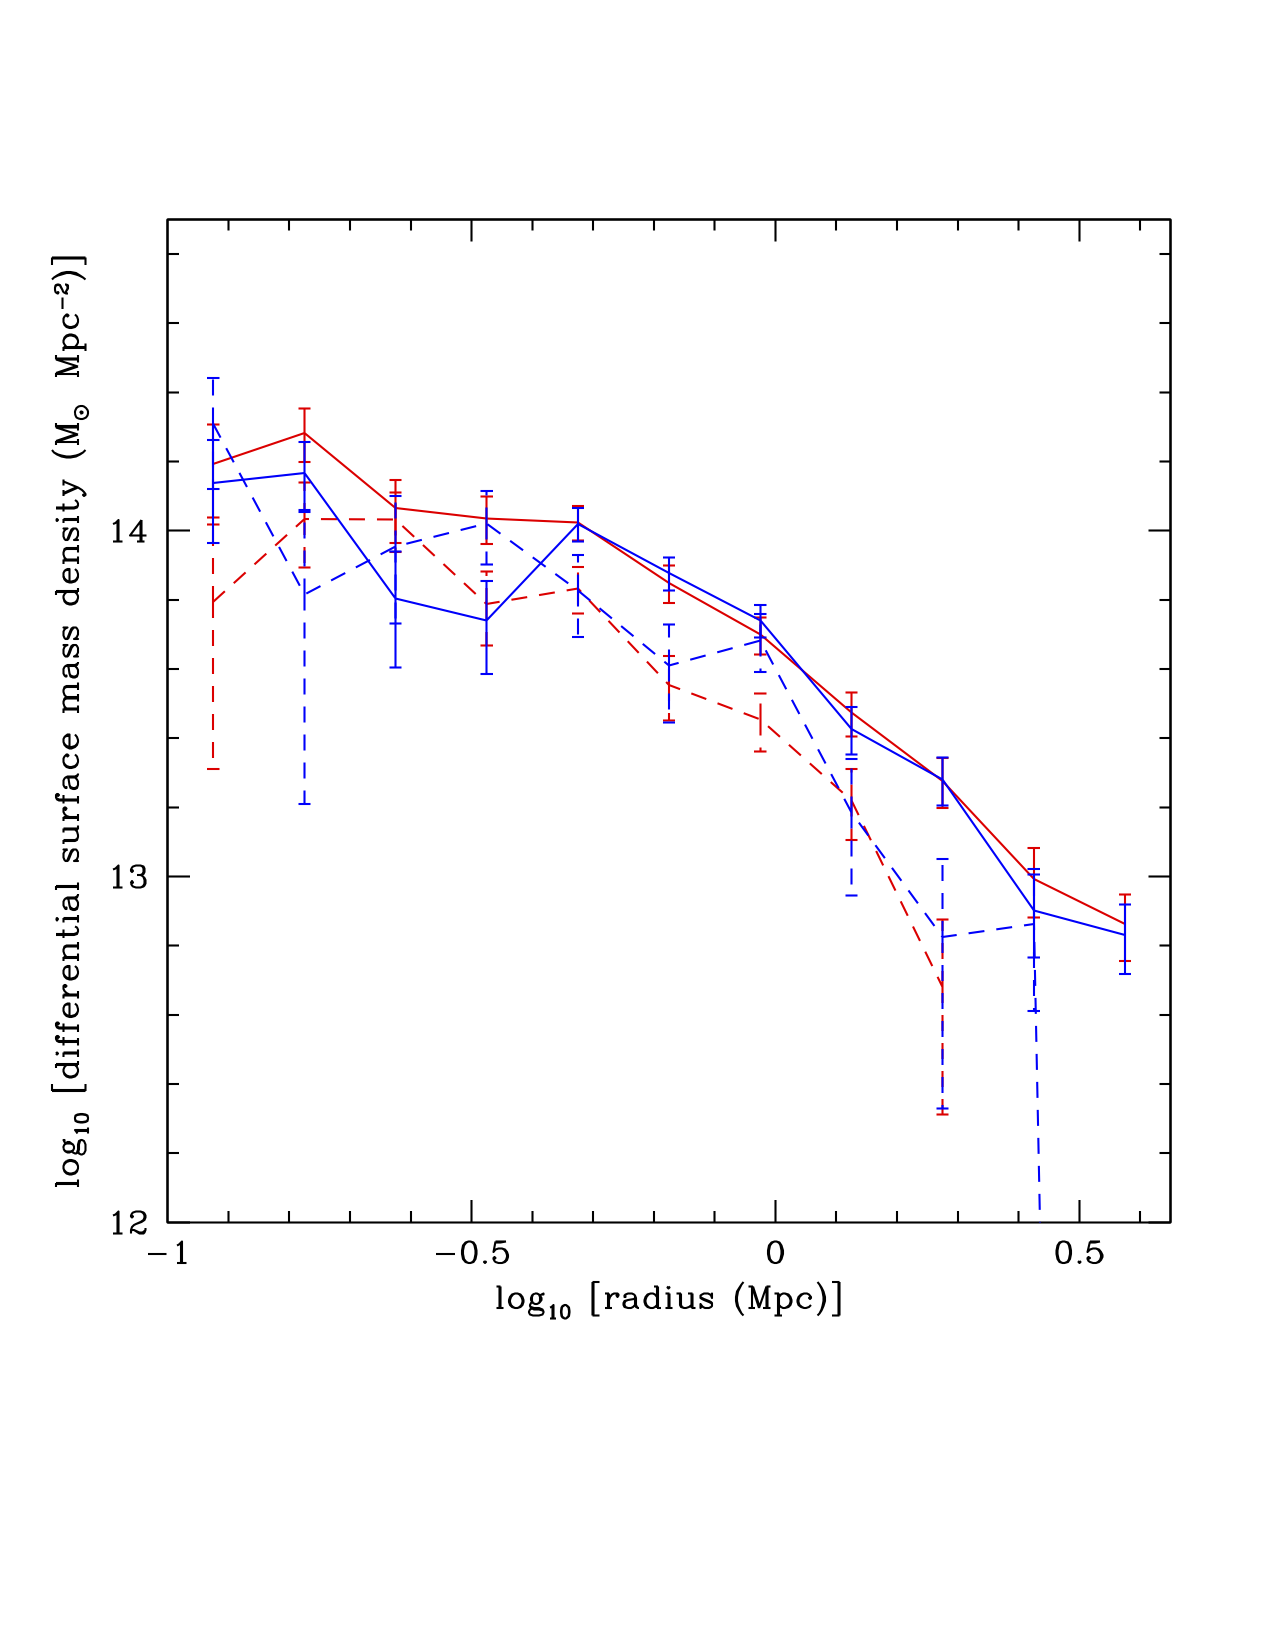
3.3 Stacked weak lensing profiles
We employ the HSC first-year shear catalog presented in Mandelbaum et al. (2018) to compute a stacked circular-average weak lensing surface mass density profile for each cluster sub-sample defined in Section 2.1. A full HSC weak-lensing analysis of the XXL sample has been presented in Umetsu et al. (2020), which was complemented by its companion paper, Sereno et al. (2020). We use the MLZ photometric redshift (see Tanaka et al., 2018) to estimate the weak lensing depth, and also to remove cluster member galaxies using the so-called P-cut method (Oguri, 2014; Medezinski et al., 2018). Here we adopt the redshift threshold of and the probability threshold of (see Medezinski et al., 2018, for the definitions of these parameters). Although the choice of the parameters is less stringent than those adopted in some of previous HSC weak lensing analysis, and (e.g. Medezinski et al., 2018; Miyatake et al., 2019; Umetsu et al., 2020), here we adopt this relaxed cut because we are interested in the relative difference of mass density profiles among different cluster subsamples rather than detailed fitting of their mass density profiles, and because the relaxed cut helps improve the statistical sensitivity. Profiles are presented in Figure 10.
3.4 Central galaxy offsets and member galaxy extent as measured by CAMIRA
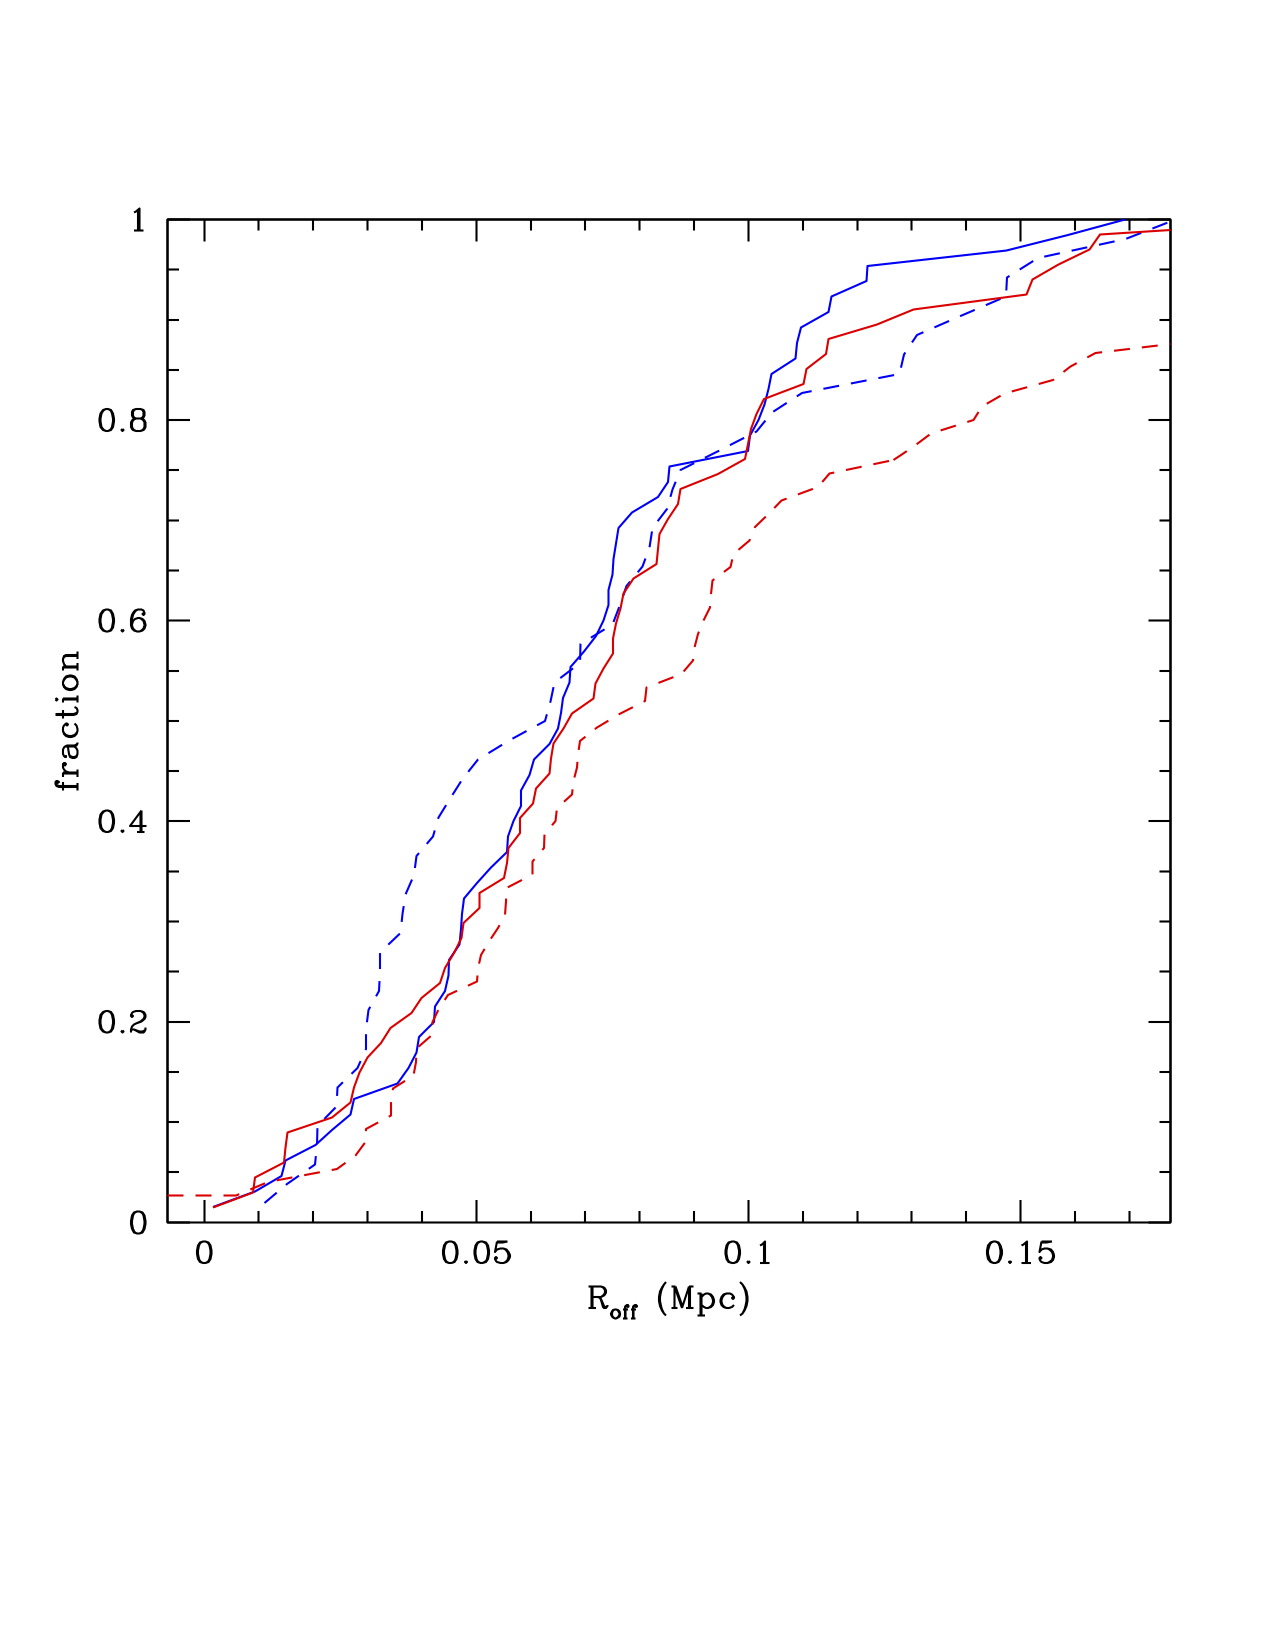
We compute the offset between the CAMIRA determined central cluster galaxy (CCG) and the mean sky location of all cluster members (). As described in Section 2.2 the candidate CCG in each cluster is selected as the galaxy that maximises a likelihood function that incorporates a spatial, stellar mass and cluster membership filter. The CCG is therefore defined as a high stellar mass galaxy displaying a colour consistent with the cluster red-sequence that is located close to the cluster richness peak of the richness map (see Oguri, 2014, for details). Cumulative distributions of for each XXL and CAMIRA cluster sub-sample are displayed in Figure 11.
3.5 XMM off-axis angle
Figure 12 displays the cumulative XMM off-axis angle distribution of each CAMIRA cluster sub-sample. Note that the distribution of high-flux matched CAMIRA clusters is essentially the same as that of the XXL sample (not shown).

3.6 Point source frequency toward each cluster sub-sample
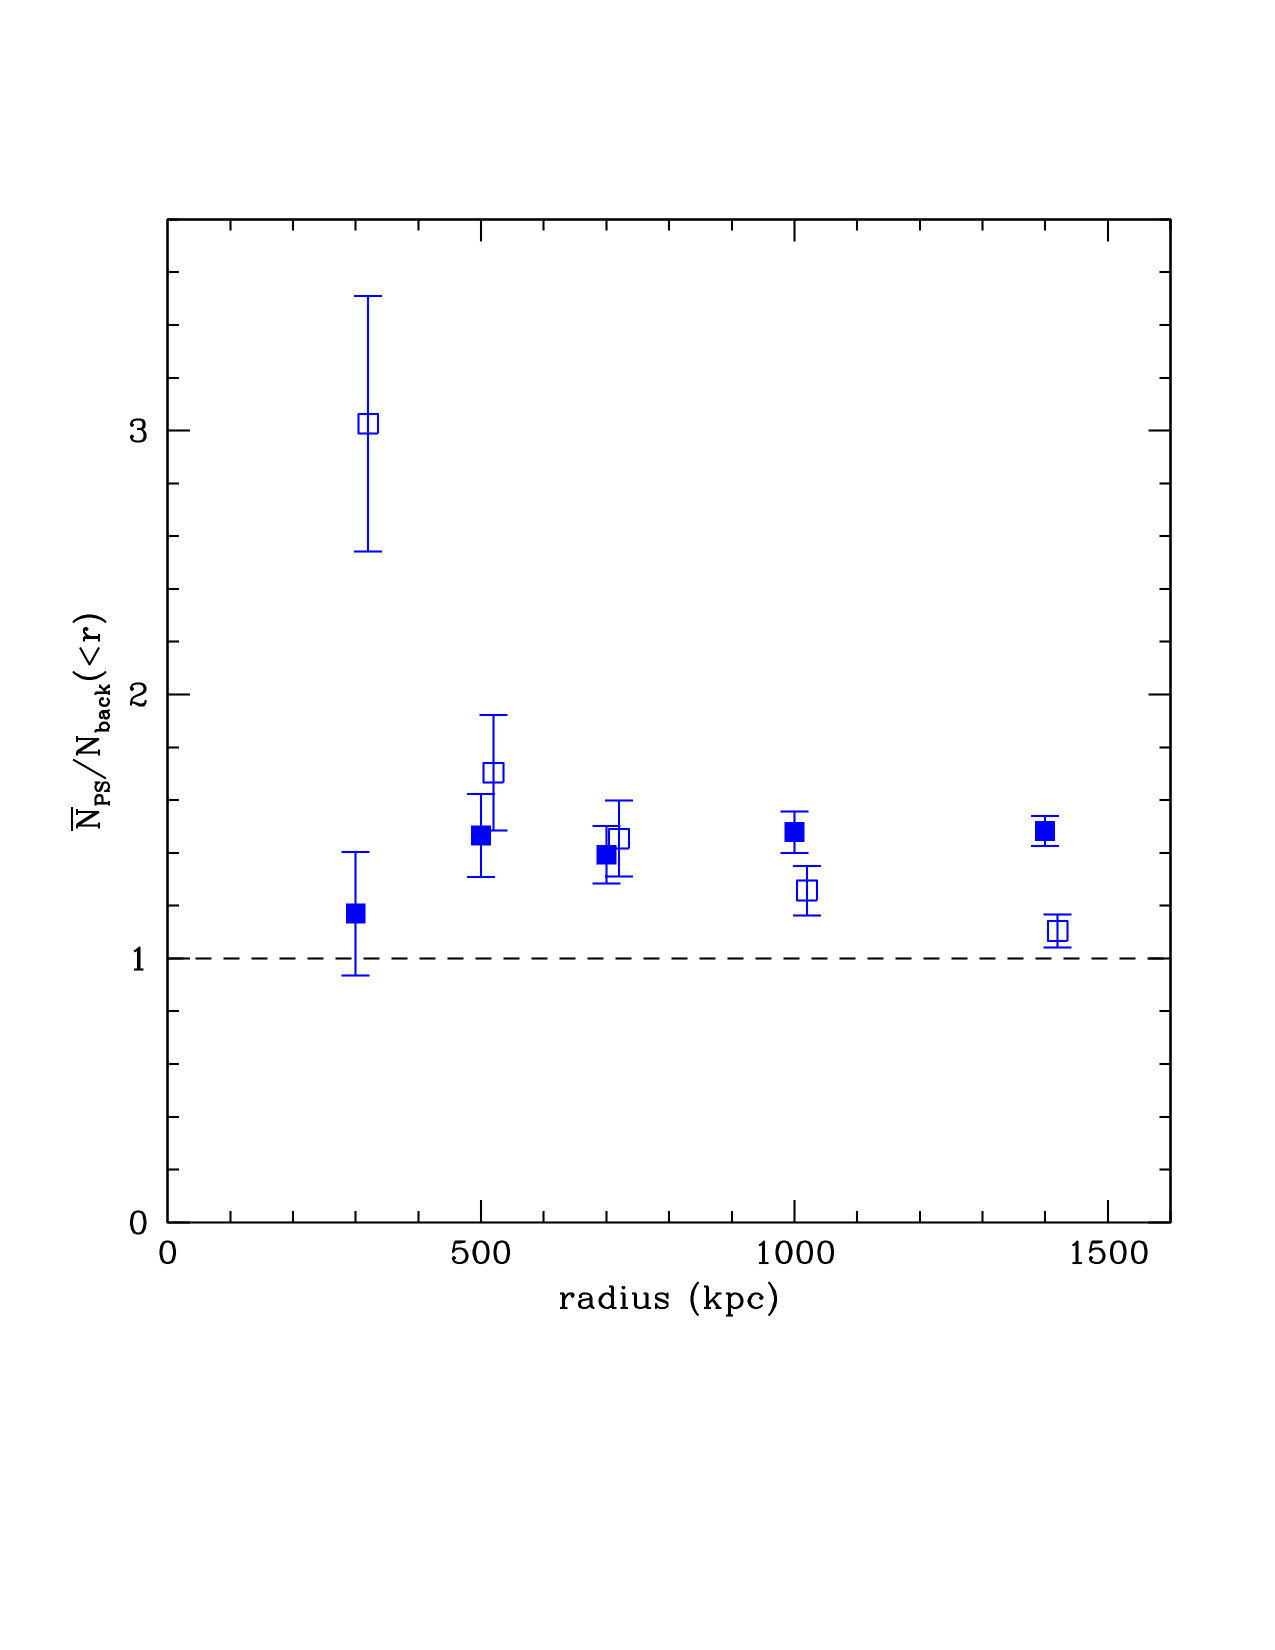
Figure 13 displays for each CAMIRA cluster sub-sample the mean number of point sources (class P0 and P1) in the 3XLSS catalogue (Chiappetti et al., 2018, also known as XXL Paper XXVII) per cluster within a given radius relative to the expectation for a background value measured over the full XXL field.
4 Characterising each cluster sub-sample
4.1 XXL clusters
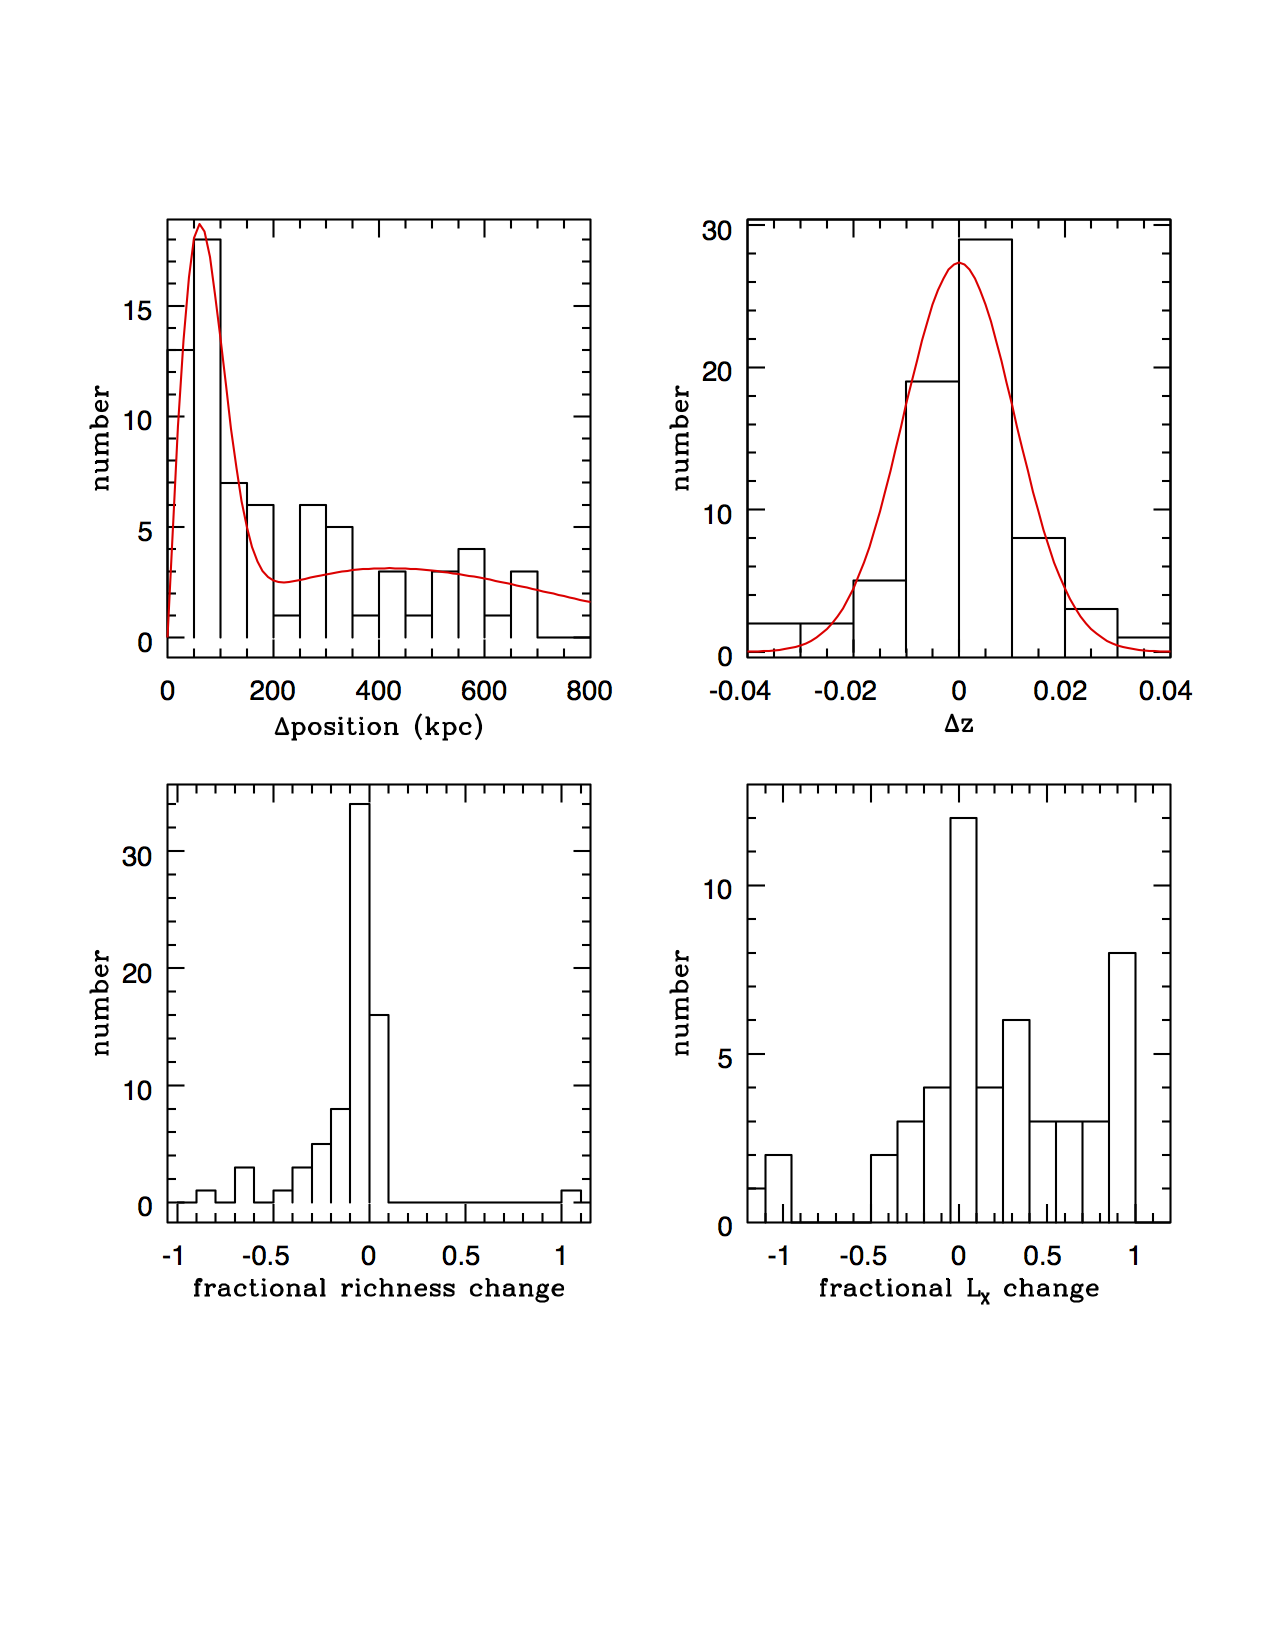
The optically rich XXL clusters are defined as those displaying , almost all of which are located in the top left panel of Figure 1. With only four exceptions they are all matched to a CAMIRA counterpart and therefore are the same clusters as are displayed in the top right panel of the same figure. Figure 14 shows the properties of XXL clusters matched to CAMIRA clusters within 700 kpc. The distribution of projected transverse separations between the XXL and CAMIRA cluster position is shown in the top left panel. Over-plotted in red is a mis-centering model described in Oguri (2014) and described by the parameters , kpc and kpc where the probability of a given centroid offset, is
| (3) |
The properties of this fit are different to that presented in Oguri (2014) (which are based upon a comparison to XCS and ACCEPT X-ray clusters). We measure a lower fraction of centred clusters, (0.45 compared to 0.7), yet mis-centered clusters are generally observed to display the same scatter in position ( kpc). The top right panel of Figure 14 displays the difference in redshift between the XXL values (spectroscopic) and CAMIRA (photometric). Over plotted in red is a Gaussian model of mean zero and standard deviation 0.011 indicating that the CAMIRA cluster photometric redshifts appear to be very reliable. The lower panels of Figure 14 show the fractional difference in richness and X-ray aperture luminosity between the XXL and CAMIRA cluster positions (following the convention [XXL-CAMIRA]/XXL). These distributions indicate that the XXL position identifies the location of marginally greater X-ray luminosity while the CAMIRA position traces the location of greater richness.
As noted by Zhang et al. (2019) the determination of a cluster centre based upon an optically identified dominant central galaxy is subject to a number of uncertainties. These uncertainties are associated with either the displacement of the central galaxy from the centre of the cluster gravitational potential during a cluster scale merger event (e.g. Lavoie et al., 2016) or the mis-identification of the central galaxy due either to the existence of multiple unmerged central galaxies from progenitor clusters or from projection effects (e.g. Myles et al., 2020).
Of the four XXL clusters not matched to a CAMIRA cluster, three are potentially affected by nearby bright star halos that may affect the HSC photometry (Coupon et al., 2018) and the fourth is at and may represent a marginal CAMIRA detection. Overall, with only four unmatched clusters, we do not attempt any further statistical investigation of why they are unmatched.
4.2 XXL clusters
None of the XXL clusters are matched to a CAMIRA cluster. This occurence results from the selection cut applied to generate the CAMIRA cluster sample. Furthermore, the -richness scaling relation analysis presented in Section 2.4 indicates that the XXL and samples are consistent with being drawn from the same parent sample (albeit with no correction for sample incompleteness) even given the split in the samples at . Furthermore, stacked weak lensing profile of the XXL clusters displays a similar shape yet lower normalisation compared to the XXL clusters, a result consistent with the scenario that the clusters represent lower mass counterparts of the clusters. While it is likely that these XXL clusters would be matched to optically poor CAMIRA clusters were the richness selection threshold reduced, the comparison would likely be confused by the increased rate of false positives potentially introduced into the CAMIRA sample by doing so.
4.3 Unmatched high-flux CAMIRA clusters
As described in Section 2.3, 43/107 CAMIRA clusters exceeding the (cgs) threshold remain unmatched to an XXL cluster while Figure 3 indicates that matched and unmatched high-flux CAMIRA clusters display equivalent redshift and X-ray luminosity distributions. Why are such otherwise detectable X-ray emitting galaxy clusters not identified as extended sources by the XXL survey?
Figure 8 shows the stacked X-ray surface brightness (XSB) profiles of each cluster sub-sample and the presence of significant extended X-ray emission in the unmatched high-flux CAMIRA clusters indicates that – as a population – they are real clusters (defined as significant galaxy overdensities associated with a hot gaseous halo). The important point to answer here is why these sources are not recognised as clusters (i.e. significant extended X-ray sources) by the XXL pipeline.
The -richness scaling relation computed for the unmatched CAMIRA clusters (Section 2.4) is poorly constrained. However, we note that the relation for the merged matched/unmatched CAMIRA sample (Figure 4) is statistically very similar to that obtained for the matched sample (even though one is fitting 58 compared to 289 clusters). This result would appear to support the conclusion that the CAMIRA cluster sample represents a single population of objects.
The stacked XSB distributions in the high-flux unmatched CAMIRA clusters are fainter in their central regions than the high flux matched CAMIRA clusters. Note that the fainter central XSB profile in the unmatched clusters is unlikely to be solely due to mis-centering. Compare the XSB profiles of XXL clusters matched to CAMIRA in Figure 8 (solid red line) to that of the CAMIRA clusters matched to XXL (solid blue line). These are the same clusters that are detected at different positions in the X-ray and optical. Hence, the difference between these two XSB profiles is due to mis-centering of the CAMIRA clusters compared to XXL.
The distribution of concentration measurements for these clusters displayed in Figure 9 reinforces this impression. The effects of mis-centering are apparent in the differences between the distributions of the matched XXL and CAMIRA clusters (the solid red and blue lines). In contrast to this, the unmatched high-flux CAMIRA clusters (the dashed blue line) indicates that these clusters are significantly less concentrated than their matched counterparts. A KS test performed upon the concentration distributions of the matched and unmatched high-flux CAMIRA clusters indicates a -value that they are drawn from the same population of .
The stacked projected weak lensing mass density for each cluster sub-sample (Figure 10) indicates that (within error fluctuations) the XXL clusters together with the high-flux matched and unmatched CAMIRA clusters show the same projected mass density profiles. The similarity of the XXL and CAMIRA matched clusters, within the limits of mis-centering as discussed previously, is expected. The similarity of the projected mass profile of the high-flux unmatched CAMIRA clusters to the matched clusters is interesting when compared to the corresponding X-ray surface brightness profiles (Figure 8).
Although the relative suppression of central X-ray emission might be taken as evidence that the high-flux matched/unmatched CAMIRA clusters represent clusters of similar mass that are experiencing different central ICM physics (e.g. Sanderson et al., 2009), the unmatched X-ray luminous CAMIRA clusters do not appear to be disturbed according to the measures we have available to us. As shown in Figure 11, the CCG offset distribution for all cluster sub-samples are very similar (no signficant -values are obtained between sub-samples in 2-sided KS tests).
The relative occurrence of X-ray point sources as a function of cluster-centric distance reveals significant differences between the high-flux matched and unmatched CAMIRA sub-samples (Figure 13). The point source occurence rate in the high-flux matched CAMIRA clusters is essentially the same as the XXL sample and these clusters indicate that the occurrence of point sources in matching cluster fields is marginally elevated compared to the level expected from the background (horizontal dashed line), yet dips at low radius consistent with the result of Koulouridis et al. (2018b) (also known as XXL Paper XXXV). Compared to these data, the high-flux unmatched CAMIRA clusters display a significant excess of points sources compared to the background. The increase of this excess toward smaller cluster-centric radii suggests that they are physically associated with the clusters as opposed to line-of-sight projections.
The effect of point sources along the line of sight to each CAMIRA cluster is two-fold: Firstly, the point source may simply represent extended emission from the cluster itself that remains unclassified due to low count rates (which would result in the source being labelled as P0) or, more subtly, the presence of both point-like and extended emission may result in a blended source ultimately labelled as point-like by the pipeline (XXL Paper XXIV). Secondly, the exclusion of point source emission from the aperture photometry computed in Section 2.1 will result in the underestimation of any extended emission within the applied aperture.
As a test of this effect we repeated the X-ray stacking procedure described in Section 3.2 for the high-flux CAMIRA clusters – this time with point sources included in the stacking – and display the results in Figure 8. The XSB profile for the high-flux matched CAMIRA clusters is largely unchanged at low clustercentric radius and displays the effects of additional noise at larger radius (demonstrating the motivation for originally excluding point sources). The XSB profile for the high-flux unmatched clusters is significantly changed with the inclusion of point sources and displays markedly elevated levels of X-ray emission at low clustercentric radius. The XSB profiles of matched and unmatched high-flux CAMIRA clusters now appear more similar, though the unmatched clusters are always slighlty fainter at all radii. Although this test confirms the effect of central point sources upon the characterisation of high-flux unmatched CAMIRA clusters, it does not resolve the question as to whether such sources represent true point sources, i.e. central cluster AGN, or compact, yet extended, central X-ray emission that remains unclassified in XMM images.
In order to resolve this question we computed the hardness ratio of the stacked X-ray emission from each cluster sub-sample generated in this case with no point source rejection. Following Anderson et al. (2013) we compute the X-ray hardness ratio as
| (4) |
within a circular aperture of radius 150 kpc centred on each stack. This physical scale represents an angular scale approximately equal to 1.5 times the on-axis Half-Energy Width (HEW) of the XMM Newton detectors computed at a redshift . We employ the [0.5-2] keV and [2-10] keV observed frame energy intervals to represent the count rates in the soft and hard bands respectively.
The hardness ratios computed for the high-flux matched and unmatched CAMIRA clusters are respectively and . For reference, canonical APEC plasma models for thermal emission from a keV galaxy cluster and a simple AGN model consisting of an absorbed power law with an index of , both computed at , generate HR values of -0.80 and -0.32 respectively. Unsurprisingly, the high-flux matched CAMIRA clusters present a mix of hard and soft X-ray emission, hosting as they do a mix of thermal ICM and point-like AGN emission. What is important is that the X-ray hardness ratio of stacked emission from the high-flux unmatched clusters is statistically identical (at the level ) to that of the matched clusters. This result argues that the high-flux unmatched CAMIRA clusters are unmatched due to the mis-classification of extended thermal emission as point-like as opposed to such clusters being dominated by bright, central AGN, i.e. true point sources. However, we note that this test does not permit us to quantify the extent to which the intermediate case – where extended emission is blended with point-like emission from proximate AGN – plays a role in the misclassification of an extended, thermal source.
Finally, it also appears that instrumental effects also play a role in the absence of an XXL cluster identification at these locations. Figure 12 indicates that high-flux unmatched CAMIRA clusters are identified at greater XMM off-axis angle than their matched counterparts. The KS -value that the matched and unmatched clusters are drawn from the same sample is . Being located at greater off-axis angle will result in a decreased detection probability due to a combination of vignetting and deteriorating point-spread function (PSF). We note that, as we have not attempted to deconvolve the effects of the PSF from the XSB distributions present in Figure 8, there exists the possibility that the lower central X-ray surface brightness observed in the high-flux unmatched CAMIRA clusters partly results from the larger PSF which exists at greater XMM off-axis angle.
It therefore appears that two principal factors may act in combination to reduce the likelihood that CAMIRA clusters are identified as extended X-ray sources by the XXL pipeline. Extended, thermal X-ray emission is present in these clusters. However, when that emission is potentially blended with proximate AGN and combined with the larger XMM PSF at increased XMM off-axis angle, it results in a morphologically complex source that is not recognised as extended by the XXL pipeline.
4.4 Low flux CAMIRA clusters
The 176 low flux CAMIRA clusters that, with two exceptions, remain unmatched to an XXL cluster are preferentially located at higher redshift than all other cluster sub-samples (Figure 7). While some of these clusters do indeed display X-ray flux values comparable to some of the very faintest XXL clusters (Figure 1), the simplest explanation for the absence of an XXL-detected cluster at these locations is that these clusters are low-to-moderate X-ray luminosity sources viewed at high redshift. As such they present X-ray count rates that are insufficient to generate a statistically acceptable characterisation as either extended (C1 or C2) or point-like (P1) and are classified as P0 as a result.
5 Conclusions
The ability to effectively sample any population of objects in the universe often reduces to a discussion of purity – the ability to distinguish true sources from false – and completeness – the ability to identify as large a fraction of true sources as possible.
The XXL cluster sample represents an exceptionally pure sample of galaxy clusters. This statement is based upon the results of spectroscopic follow-up of XXL galaxy clusters (XXL Paper XX), of which 95% possess a spectroscopic redshift. It is therefore unsurprising that effectively all XXL clusters are matched to a CAMIRA cluster. The high spectroscopic completeness of the XXL sample further supports the idea that XXL clusters – which are unmatched to a CAMIRA cluster by virtue of the CAMIRA catalogue richness cut – are real clusters presenting low richness values consistent with the fitted -richness scaling relation.
In comparing CAMIRA clusters to XXL counterparts one can in principle learn of the purity and completeness of the CAMIRA sample relative to XXL. A large fraction (163/270) of CAMIRA clusters – which we label as low-flux unmatched CAMIRA – are simply too faint to be characterised as extended by the XXL pipeline. Flux incompleteness is a well-studied selection effect and is modelled explicitly in the XXL pipeline (Pacaud et al. 2006; XXL Paper II; XXL Paper XXIV).
However, we find that a further 40% (43/107) of high flux CAMIRA clusters are not matched to an XXL cluster. These CAMIRA clusters are likely real in that each represents a galaxy overdensity associated with significant extended X-ray emission and weak lensing mass. The X-ray flux threshold applied in this paper to understand such clusters identifies 96% (64/67) of CAMIRA clusters that are matched to an XXL cluster. To understand why a large fraction of the remaining high flux CAMIRA clusters are not classified as a C1/C2 source within XXL one must recall that, to achieve high purity, the XXL pipeline selects only bright, significantly extended sources (e.g. Pacaud et al. 2006; XXL Paper II).
The high-flux, unmatched CAMIRA clusters display an apparent excess of central X-ray point sources compared to both high-flux, matched CAMIRA clusters and the field. However, it further appears that the hardness ratio of stacked X-ray emission from these high-flux unmatched CAMIRA clusters is statistically identical to that measured for the high-flux matched CAMIRA clusters (which by definition are the same as the matched XXL clusters). There is no evidence for an excess of hard X-ray emission in the unmatched clusters that might be expected if the excess point sources associated with these clusters were solely due to AGN emission. Instead it appears that the point sources in these clusters represent extended emission that is either unclassified due to low count rates or classified as a point source due to blending. Due to the averaging process involved in our stacking procedures we cannot rule out that some of these clusters contain real point sources in addition to compact extended emission and we note that the presence of a point source close to an extended source further complicates the extension classification with XXL (XXL Paper XXIV). A final point to note is that the unmatched, high-flux CAMIRA clusters lie preferentially towards the periphery of the XMM field of view such that vignetting and a broadened PSF reduce the probability that a compact yet extended X-ray source will be successully classified. Overall, there is no evidence on the basis of the comparison in this paper that the high-flux, unmatched CAMIRA clusters are anything but galaxy clusters that, as a result of a combination of known selection effects, are not recognised as extended sources in the XXL pipeline.
Issues of selection are a particular concern for studies that use galaxy cluster surveys to infer accurately the cosmological parameters that define our Universe (see Allen et al., 2011, for a review). Incomplete knowledge of the selection process will potentially result in biased inference, e.g., if the survey selection function fails to account for clusters underrepresented due to astrophysical and instrumental effects, inferred parameters such as will be biased low (e.g. Schellenberger & Reiprich, 2017; Xu et al., 2018). The results of this paper indicate that there is an important requirement to describe accurately the classification of extended X-ray sources and proximate X-ray point sources in simulated XMM images. Presently, X-ray point sources are included in selection function modelling via a spatially uncorrelated background (Clerc et al. 2014; XXL Paper II) and, though X-ray point sources can be superimposed upon extended cluster emission (XXL Paper XXIV), these studies do not include information on the population statistics of AGN in clusters (Koulouridis et al., 2018a, also known as XXL Paper XIX). The incorporation of such information into the planned version 4 processing of the XXL survey, in addition to updates to classify sources using mosaiced tiles of XMM images as opposed to individual pointings, will therefore provide an important advance in the ability of XMM-based cluster surveys to accurately represent cluster population statistics.
It is more difficult to compare the relative purity of the two samples. The X-ray faint CAMIRA clusters present X-ray emission (albeit faint) and are plausibly unmatched to XXL sources simply as a result of a combination of possessing low- to moderate X-ray luminosity and being located at high redshift. Therefore, while there is some certainty that the CAMIRA cluster sample identifies a greater fraction of clusters of a given X-ray luminosity than the XXL sample, these differences lie within the realm of known selection effects. On the other hand, the relative purity of the CAMIRA sample with respect to XXL has not been addressed conclusively by this analysis and remains a question better suited to analysis either via deeper X-ray observations or realistic mock observations (e.g. Euclid Collaboration et al., 2019).
Acknowledgements
Based on observations obtained with XMM-Newton, an ESA science mission with instruments and contributions directly funded by ESA Member States and NASA. J.P.W. acknowledges support from the National Science and Engineering Research Council of Canada. M.S. acknowledges financial contribution from contract ASI-INAF n.2017-14-H.0 and INAF ‘Call per interventi aggiuntivi a sostegno della ricerca di main stream di INAF’. This work was supported in part by World Premier International Research Center Initiative (WPI Initiative), MEXT, Japan, and JSPS KAKENHI Grant Number JP18K03693. MP acknowledges long-term support from the Centre National d’Etudes Spatiales (CNES). The French collaborators were supported by the Programme National Cosmology et Galaxies (PNCG) of CNRS/INSU with INP and IN2P3, co-funded by CEA and CNES. S.E acknowledges financial contribution from the contracts ASI-INAF Athena 2019-27-HH.0, “Attività di Studio per la comunità scientifica di Astrofisica delle Alte Energie e Fisica Astroparticellare” (Accordo Attuativo ASI-INAF n. 2017-14-H.0), INAF mainstream project 1.05.01.86.10, and from the European Union’s Horizon 2020 Programme under the AHEAD2020 project (grant agreement n. 871158). S.A. acknowledges support from the Scientific and Technological Research Council of Turkey (TUBITAK) with the project number 117F311. K.U. acknowledges support from the Ministry of Science and Technology of Taiwan (grants MOST 106-2628-M-001-003-MY3 and MOST 109-2112-M-001-018-MY3) and by Academia Sinica (grant AS-IA-107-M01).
XXL is an international project based around an XMM Very Large Programme surveying two 25 deg2 extragalactic fields at a depth of in the [0.5-2] keV band for point-like sources. The XXL website is http://irfu.cea.fr/xxl. Multi-band information and spectroscopic follow-up of the X-ray sources are obtained through a number of survey programmes, summarised at http://xxlmultiwave.pbworks.com/. The Hyper Suprime-Cam (HSC) collaboration includes the astronomical communities of Japan and Taiwan, and Princeton University. The HSC instrumentation and software were developed by the National Astronomical Observatory of Japan (NAOJ), the Kavli Institute for the Physics and Mathematics of the Universe (Kavli IPMU), the University of Tokyo, the High Energy Accelerator Research Organization (KEK), the Academia Sinica Institute for Astronomy and Astrophysics in Taiwan (ASIAA), and Princeton University. Funding was contributed by the FIRST program from the Japanese Cabinet Office, the Ministry of Education, Culture, Sports, Science and Technology (MEXT), the Japan Society for the Promotion of Science (JSPS), Japan Science and Technology Agency (JST), the Toray Science Foundation, NAOJ, Kavli IPMU, KEK, ASIAA, and Princeton University. This paper makes use of software developed for the Large Synoptic Survey Telescope. We thank the LSST Project for making their code available as free software at http://dm.lsst.org This paper is based in part on data collected at the Subaru Telescope and retrieved from the HSC data archive system, which is operated by Subaru Telescope and Astronomy Data Center (ADC) at NAOJ. Data analysis was in part carried out with the cooperation of Center for Computational Astrophysics (CfCA), NAOJ.
The Pan-STARRS1 Surveys (PS1) and the PS1 public science archive have been made possible through contributions by the Institute for Astronomy, the University of Hawaii, the Pan-STARRS Project Office, the Max Planck Society and its participating institutes, the Max Planck Institute for Astronomy, Heidelberg, and the Max Planck Institute for Extraterrestrial Physics, Garching, The Johns Hopkins University, Durham University, the University of Edinburgh, the Queen’s University Belfast, the Harvard-Smithsonian Center for Astrophysics, the Las Cumbres Observatory Global Telescope Network Incorporated, the National Central University of Taiwan, the Space Telescope Science Institute, the National Aeronautics and Space Administration under grant No. NNX08AR22G issued through the Planetary Science Division of the NASA Science Mission Directorate, the National Science Foundation grant No. AST-1238877, the University of Maryland, Eotvos Lorand University (ELTE), the Los Alamos National Laboratory, and the Gordon and Betty Moore Foundation.
Data Availability
All XMM public data are available through the XMM archive located at https://xmm-tools.cosmos.esa.int. All HSC-SSP data are publicly available at https://hsc-release.mtk.nao.ac.jp/.
References
- Adami et al. (2018) Adami C., et al., 2018, A&A, 620, A5
- Aihara et al. (2018a) Aihara H., et al., 2018a, PASJ, 70, S4
- Aihara et al. (2018b) Aihara H., et al., 2018b, PASJ, 70, S8
- Aihara et al. (2019) Aihara H., et al., 2019, PASJ, 71, 114
- Allen et al. (2011) Allen S. W., Evrard A. E., Mantz A. B., 2011, ARA&A, 49, 409
- Anderson et al. (2013) Anderson M. E., Bregman J. N., Dai X., 2013, ApJ, 762, 106
- Andrade-Santos et al. (2017) Andrade-Santos F., et al., 2017, ApJ, 843, 76
- Bertin & Arnouts (1996) Bertin E., Arnouts S., 1996, A&AS, 117, 393
- Böhringer et al. (2001) Böhringer H., et al., 2001, A&A, 369, 826
- Chiappetti et al. (2018) Chiappetti L., et al., 2018, A&A, 620, A12
- Clerc et al. (2012) Clerc N., Sadibekova T., Pierre M., Pacaud F., Le Fèvre J.-P., Adami C., Altieri B., Valtchanov I., 2012, MNRAS, 423, 3561
- Clerc et al. (2014) Clerc N., et al., 2014, MNRAS, 444, 2723
- Coupon et al. (2018) Coupon J., Czakon N., Bosch J., Komiyama Y., Medezinski E., Miyazaki S., Oguri M., 2018, PASJ, 70, S7
- Donahue et al. (2002) Donahue M., et al., 2002, ApJ, 569, 689
- Euclid Collaboration et al. (2019) Euclid Collaboration et al., 2019, A&A, 627, A23
- Faccioli et al. (2018) Faccioli L., et al., 2018, A&A, 620, A9
- Gavazzi & Soucail (2007) Gavazzi R., Soucail G., 2007, A&A, 462, 459
- Gioia et al. (1990) Gioia I. M., Maccacaro T., Schild R. E., Wolter A., Stocke J. T., Morris S. L., Henry J. P., 1990, ApJS, 72, 567
- Gladders & Yee (2000) Gladders M. D., Yee H. K. C., 2000, AJ, 120, 2148
- Koulouridis et al. (2018a) Koulouridis E., et al., 2018a, A&A, 620, A4
- Koulouridis et al. (2018b) Koulouridis E., et al., 2018b, A&A, 620, A20
- Lavoie et al. (2016) Lavoie S., et al., 2016, MNRAS, 462, 4141
- Mandelbaum et al. (2018) Mandelbaum R., et al., 2018, PASJ, 70, S25
- Marriage et al. (2011) Marriage T. A., et al., 2011, ApJ, 737, 61
- Maturi et al. (2019) Maturi M., Bellagamba F., Radovich M., Roncarelli M., Sereno M., Moscardini L., Bardelli S., Puddu E., 2019, MNRAS, 485, 498
- Medezinski et al. (2018) Medezinski E., et al., 2018, PASJ, 70, 30
- Miyatake et al. (2019) Miyatake H., et al., 2019, ApJ, 875, 63
- Miyazaki et al. (2002) Miyazaki S., et al., 2002, ApJ, 580, L97
- Miyazaki et al. (2018a) Miyazaki S., et al., 2018a, PASJ, 70, S1
- Miyazaki et al. (2018b) Miyazaki S., et al., 2018b, PASJ, 70, S27
- Myles et al. (2020) Myles J. T., et al., 2020, arXiv e-prints, p. arXiv:2011.07070
- Oguri (2014) Oguri M., 2014, MNRAS, 444, 147
- Oguri et al. (2018) Oguri M., et al., 2018, PASJ, 70, S20
- Pacaud et al. (2006) Pacaud F., et al., 2006, MNRAS, 372, 578
- Pacaud et al. (2016) Pacaud F., et al., 2016, A&A, 592, A2
- Pierre et al. (2016) Pierre M., et al., 2016, A&A, 592, A1
- Planck Collaboration et al. (2016) Planck Collaboration et al., 2016, A&A, 594, A27
- Postman et al. (1996) Postman M., Lubin L. M., Gunn J. E., Oke J. B., Hoessel J. G., Schneider D. P., Christensen J. A., 1996, AJ, 111, 615
- Reichardt et al. (2013) Reichardt C. L., et al., 2013, ApJ, 763, 127
- Rossetti et al. (2017) Rossetti M., Gastaldello F., Eckert D., Della Torre M., Pantiri G., Cazzoletti P., Molendi S., 2017, MNRAS, 468, 1917
- Rozo & Rykoff (2014) Rozo E., Rykoff E. S., 2014, ApJ, 783, 80
- Rozo et al. (2014) Rozo E., Bartlett J. G., Evrard A. E., Rykoff E. S., 2014, MNRAS, 438, 78
- Rykoff et al. (2014) Rykoff E. S., et al., 2014, ApJ, 785, 104
- Sadibekova et al. (2014) Sadibekova T., Pierre M., Clerc N., Faccioli L., Gastaud R., Le Fevre J.-P., Rozo E., Rykoff E., 2014, A&A, 571, A87
- Sanderson et al. (2009) Sanderson A. J. R., Edge A. C., Smith G. P., 2009, MNRAS, 398, 1698
- Santos et al. (2008) Santos J. S., Rosati P., Tozzi P., Böhringer H., Ettori S., Bignamini A., 2008, A&A, 483, 35
- Schellenberger & Reiprich (2017) Schellenberger G., Reiprich T. H., 2017, MNRAS, 471, 1370
- Sereno (2015) Sereno M., 2015, MNRAS, 450, 3665
- Sereno (2016) Sereno M., 2016, MNRAS, 455, 2149
- Sereno & Ettori (2015a) Sereno M., Ettori S., 2015a, MNRAS, 450, 3633
- Sereno & Ettori (2015b) Sereno M., Ettori S., 2015b, MNRAS, 450, 3675
- Sereno & Ettori (2017) Sereno M., Ettori S., 2017, MNRAS, 468, 3322
- Sereno et al. (2015) Sereno M., Ettori S., Moscardini L., 2015, MNRAS, 450, 3649
- Sereno et al. (2019) Sereno M., Ettori S., Eckert D., Giles P., Maughan B. J., Pacaud F., Pierre M., Valageas P., 2019, A&A, 632, A54
- Sereno et al. (2020) Sereno M., et al., 2020, MNRAS, 492, 4528
- Staniszewski et al. (2009) Staniszewski Z., et al., 2009, ApJ, 701, 32
- Tanaka et al. (2018) Tanaka M., et al., 2018, PASJ, 70, S9
- Umetsu et al. (2020) Umetsu K., et al., 2020, ApJ, 890, 148
- Willis et al. (2018) Willis J. P., Ramos-Ceja M. E., Muzzin A., Pacaud F., Yee H. K. C., Wilson G., 2018, MNRAS, 477, 5517
- Wittman et al. (2006) Wittman D., Dell’Antonio I. P., Hughes J. P., Margoniner V. E., Tyson J. A., Cohen J. G., Norman D., 2006, ApJ, 643, 128
- Xu et al. (2018) Xu W., Ramos-Ceja M. E., Pacaud F., Reiprich T. H., Erben T., 2018, A&A, 619, A162
- Zhang et al. (2019) Zhang Y., et al., 2019, MNRAS, 487, 2578
Appendix A Upper limits
In the Bayesian framework, we associate a variable to the result of the measurement process and a variable to the ideal result we would get in an experiment with unlimited precision. Observational results expressed as upper limits can be dealt by truncating the conditional probability distribution of given ,
| (5) |
where is the Gaussian distribution, is the Heaviside function, is the observational uncertainty, and is the upper limit for the left-censored point. If the upper limit is expressed as the probability that is less than a threshold, or if the upper limit itself is affected by some statistical uncertainty, the truncation can be smooth
| (6) |
where sets the transition length. If unknown, the variable can be dealt as parameters to be fitted.
The previous treartments is implemented in the LIRA package. Let x and y, delta.x and delta.y, and y.upperlimit be the vectors storing the values of the observed and , their uncertainties and , and the estimated upper limits, respectively. if unknown, the or values can be stored as NA. For detected objects, the upper limits can be set to NA or very large values. The LIRA command to be used to reproduce our results is
> mcmc <- lira (x, y, delta.x = delta.x, delta.y = delta.y, y.upperlimit=y.upperlimit, sigmaXI.Z.0=’prec.dgamma’, n.chains = 4, n.adapt = 4*10^3, n.iter = 4*10^4)
where the argument sigma.XIZ.0 = ′prec.dgamma′ makes the scatter in a parameter to be fitted with a prior on the precision described by a Gamma distribution, and where each of the n.chains = 4 chain was n.iter = 5104 long, and the number of iterations for inizialisation was set to n.adapt =4*103.