Photometric Redshifts in the W-CDF-S and ELAIS-S1 Fields Based on Forced Photometry from 0.36 – 4.5 Microns
Abstract
The W-CDF-S and ELAIS-S1 fields will be two of the LSST Deep Drilling fields, but the availability of spectroscopic redshifts within these two fields is still limited on scales. To prepare for future science, we use EAZY to estimate photometric redshifts (photo-zs) in these two fields based on forced-photometry catalogs. Our photo-z catalog consists of million sources covering in W-CDF-S and million sources covering in ELAIS-S1, among which there are (W-CDF-S) and (ELAIS-S1) million sources having signal-to-noise-ratio (SNR) detections in more than 5 bands. By comparing photo-zs and available spectroscopic redshifts, we demonstrate the general reliability of our photo-z measurements. Our photo-z catalog is publicly available at10.5281/zenodo.4603178 (catalog 10.5281/zenodo.4603178).
The Wide Chandra Deep Field-South (W-CDF-S) and European Large-Area ISO Survey-S1 (ELAIS-S1) fields are parts of the XMM-SERVS (Chen et al. 2018; Ni et al., in preparation)111http://personal.psu.edu/wnb3/xmmservs/xmmservs.html and MIGHTEE (Jarvis et al. 2016) surveys, and will further be two of the Deep Drilling Fields (e.g., Brandt et al. 2018) of the Vera C. Rubin Observatory Legacy Survey of Space and Time (LSST). Redshifts are a crucial ingredient for most extragalactic studies, but spectroscopic redshifts (spec-zs) are only available for a small fraction of VIDEO-selected sources in these two fields — 3.8% for W-CDF-S and 1.3% for ELAIS-S1, and the spectroscopic coverage reaches roughly down to -band magnitude for W-CDF-S and for ELAIS-S1. To lay a necessary foundation for future science, we measure photometric redshifts (photo-zs) for 1.6 million sources in these two fields utilizing forced-photometry catalogs in Nyland et al. (in preparation; W-CDF-S) and Zou et al. (2021; ELAIS-S1) with EAZY (Brammer et al. 2008). These catalogs were generated with The Tractor (Lang et al. 2016) and provide consistent, deblended photometry across the available bands and are thus expected to improve the reliability of photo-z measurements (e.g., Nyland et al. 2017; Chen et al. 2018).
Our photo-z derivation methodology is the same as those in Yang et al. (2014) and Chen et al. (2018), and interested readers can refer to these two articles for a detailed description. Briefly, EAZY fits the spectral energy distributions (SEDs) with a linear combination of several galaxy templates at a series of redshift grid points to estimate the redshifts. We adopt the default v1.3 set, which includes 9 templates, and default parameter settings in EAZY. All the templates are for pure-galaxy SEDs and do not include any AGN or stellar templates. We iteratively adjust the photometric zero points so that the median value of the differences between the fitted and observed magnitudes is zero. Unlike Brammer et al. (2008), we do not apply a magnitude prior, because this configuration tends to underestimate redshifts (Yang et al. 2014). EAZY also returns a parameter, , used to indicate photo-z quality (see Eq. 8 of Brammer et al. 2008). A nominal criterion for “high-quality” photo-zs is , and we adopt this hereafter. For sources with detections in more than 5 bands,222Note that photo-zs are still estimated for all sources regardless of the SNRs. the overall completeness of high-quality photo-zs is 69% (0.39 out of 0.57 million sources) and 68% (0.28 out of 0.42 million sources) in W-CDF-S and ELAIS-S1, respectively.
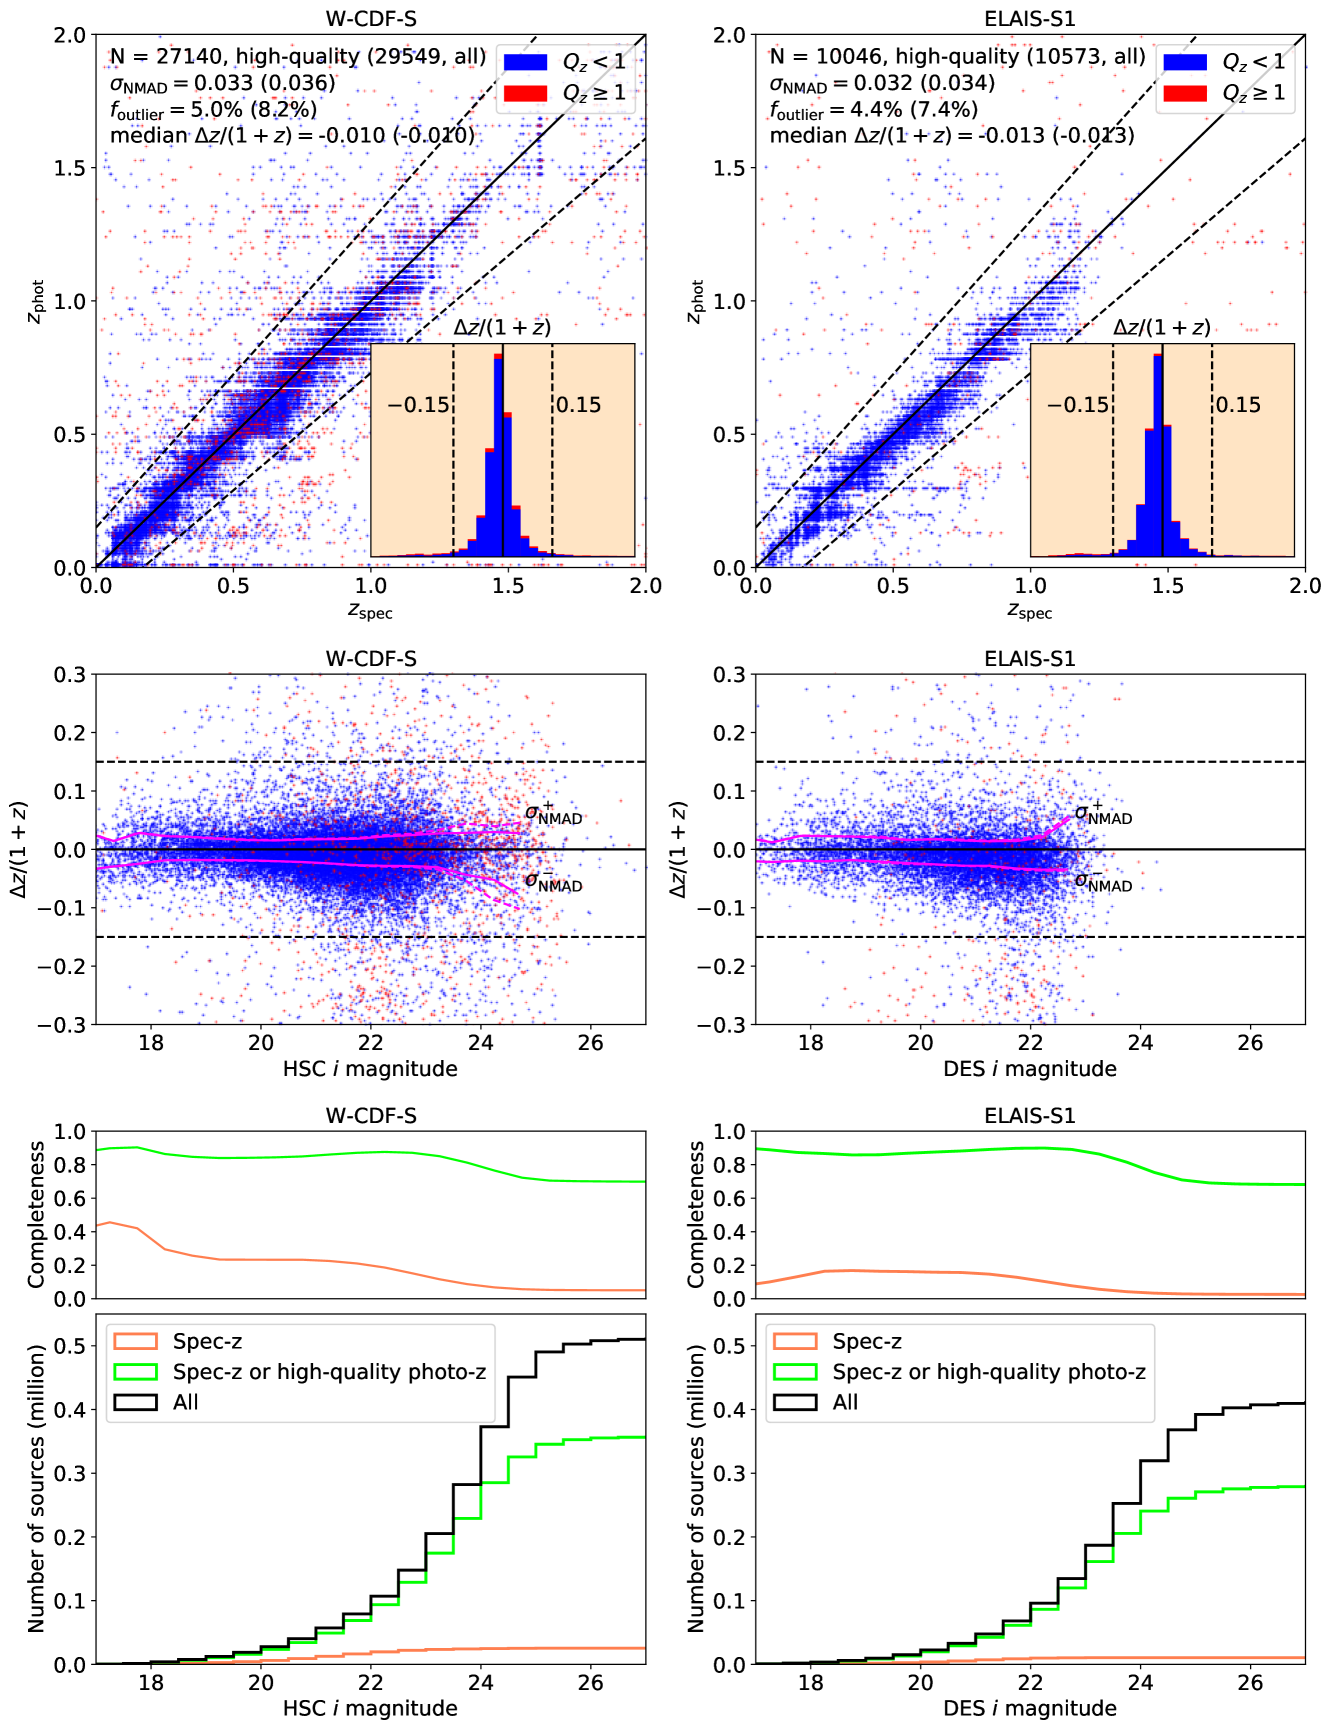
To evaluate the reliability of our photo-zs, we compile spec-zs for extragalactic sources, as summarized in Ni et al. (in preparation), who will release XMM-Newton point-source catalogs in these fields. For the 29549 (W-CDF-S) and 10573 (ELAIS-S1) extragalactic sources that have detections in more than 5 bands, we present a comparison between their spec-zs and photo-zs in Fig. 1, in which we define , as the normalized median absolute deviation, and “outliers” as objects with . There are several factors that may cause outliers (see, e.g., Section 4.2 of Brammer et al. 2008), though it is hard to know which is dominant. For 27140 sources with both spec-zs and photo-zs in W-CDF-S, , outlier fraction () , and median . For ELAIS-S1, there are 10046 such sources, which have , , and median . These values are better than those in Pforr et al. (2019); they derived photo-zs for Spitzer-detected sources based on unforced photometry in 12 bands in these two fields and obtained and in both fields. Additionally, our photo-z results largely do not suffer from blending issues in DeepDrill because the adopted forced-photometry catalogs have already deblended the sources, and thus the and values are similar between blended and non-blended sources after matching their magnitudes. We also note that the median offsets are much smaller than the typical uncertainties of the photo-zs. Fig. 1 further shows that the overall photo-z reliability decreases with increasing magnitude because fainter sources have larger photometric uncertainties and fewer photometric points. Since the depth of the spectroscopic coverage in W-CDF-S is deeper than that in ELAIS-S1, the exact values of and are not directly comparable between these two fields.
Our photo-z catalog is available at10.5281/zenodo.4603178 (catalog 10.5281/zenodo.4603178) and provides spec-zs (if available), photo-zs, the 68% lower and upper limits of photo-zs, , numbers of bands with detections, and the bands with the shortest and longest wavelengths among those with detections. Our released data also include some supplementary notes for this catalog, in which we present more details about the adopted photometric data, estimate a nominal depth of high-quality photo-zs to be -band magnitude , give additional notes on Fig. 1, and discuss the photo-z uncertainties and caveats for AGNs and stars. Readers are encouraged to also refer to these supplementary notes for a better understanding of our data. Especially, since our templates lack AGN contributions, our photo-zs may be less reliable for AGN-dominated sources, and these sources are often broad-line (BL) AGNs. Ni et al. (in preparation) select BL AGNs in these two fields and use templates and codes designed for fitting these sources to measure their photo-zs. Users focusing on BL AGNs should use the photo-z measurements in Ni et al. (in preparation) instead.
Acknowledgements. We acknowledge support from NASA grant 80NSSC19K0961. The National Radio Astronomy Observatory is a facility of the National Science Foundation operated under cooperative agreement by Associated Universities, Inc. Basic research in radio astronomy at the U.S. Naval Research Laboratory is supported by 6.1 Base Funding. FEB acknowledges support from ANID-Chile Basal AFB-170002, FONDECYT Regular 1200495 and 1190818, and Millennium Science Initiative – ICN12_009. MV acknowledges support from the Italian Ministry of Foreign Affairs and International Cooperation (MAECI Grant Number ZA18GR02) and the South African Department of Science and Technology’s National Research Foundation (DST-NRF Grant Number 113121) as part of the ISARP RADIOSKY2020 Joint Research Scheme.
References
- Abbott et al. (2021) Abbott, T. M. C., Adamow, M., Aguena, M., et al. 2021, arXiv e-prints, arXiv:2101.05765. https://arxiv.org/abs/2101.05765
- Berta et al. (2006) Berta, S., Rubele, S., Franceschini, A., et al. 2006, A&A, 451, 881, doi: 10.1051/0004-6361:20054548
- Brammer et al. (2008) Brammer, G. B., van Dokkum, P. G., & Coppi, P. 2008, ApJ, 686, 1503, doi: 10.1086/591786
- Brandt et al. (2018) Brandt, W. N., Ni, Q., Yang, G., et al. 2018, arXiv e-prints, arXiv:1811.06542. https://arxiv.org/abs/1811.06542
- Chen et al. (2018) Chen, C. T. J., Brandt, W. N., Luo, B., et al. 2018, MNRAS, 478, 2132, doi: 10.1093/mnras/sty1036
- Jarvis et al. (2016) Jarvis, M., Taylor, R., Agudo, I., et al. 2016, in MeerKAT Science: On the Pathway to the SKA, 6. https://arxiv.org/abs/1709.01901
- Jarvis et al. (2013) Jarvis, M. J., Bonfield, D. G., Bruce, V. A., et al. 2013, MNRAS, 428, 1281, doi: 10.1093/mnras/sts118
- Lacy et al. (2021) Lacy, M., Surace, J. A., Farrah, D., et al. 2021, MNRAS, 501, 892, doi: 10.1093/mnras/staa3714
- Lang et al. (2016) Lang, D., Hogg, D. W., & Mykytyn, D. 2016, The Tractor: Probabilistic astronomical source detection and measurement. http://ascl.net/1604.008
- Ni et al. (2019) Ni, Q., Timlin, J., Brandt, W. N., & Yang, G. 2019, Research Notes of the American Astronomical Society, 3, 5, doi: 10.3847/2515-5172/aaf8af
- Nyland et al. (2017) Nyland, K., Lacy, M., Sajina, A., et al. 2017, ApJS, 230, 9, doi: 10.3847/1538-4365/aa6fed
- Pforr et al. (2019) Pforr, J., Vaccari, M., Lacy, M., et al. 2019, MNRAS, 483, 3168, doi: 10.1093/mnras/sty3075
- Vaccari et al. (2016) Vaccari, M., Covone, G., Radovich, M., et al. 2016, in The 4th Annual Conference on High Energy Astrophysics in Southern Africa (HEASA 2016), 26. https://arxiv.org/abs/1704.01495
- Yang et al. (2014) Yang, G., Xue, Y. Q., Luo, B., et al. 2014, ApJS, 215, 27, doi: 10.1088/0067-0049/215/2/27
- Zou et al. (2021) Zou, F., Brandt, W. N., Lacy, M., et al. 2021, Research Notes of the American Astronomical Society, 5, 31, doi: 10.3847/2515-5172/abe769
Appendix A The data
The utilized photometric bands for W-CDF-S are VOICE (Vaccari et al. 2016), HSC (Ni et al. 2019), VIDEO (Jarvis et al. 2013), and DeepDrill 3.6 and (Lacy et al. 2021); the bands for ELAIS-S1 are VOICE , DES DR2 (Abbott et al. 2021), ESIS (Berta et al. 2006; Vaccari et al. 2016), VIDEO , and DeepDrill 3.6 and . The photometric data are corrected for Galactic extinction following the method in Section 5.5 of Yang et al. (2014); see also https://irsa.ipac.caltech.edu/applications/DUST/. The compilation of spec-zs is described in Ni et al. (in preparation), and interested readers can refer to their article for more details.
Our cataloged sources are required to be detected in VIDEO. However, the VIDEO survey in the W-CDF-S field is not uniform, and some regions are shallower than ELAIS-S1 or even are not covered in some bands; e.g., the band only covers of the entire W-CDF-S field. Therefore, W-CDF-S has a slightly smaller surface number density on scales than ELAIS-S1.
Appendix B The depth of high-quality photo-zs
To assess quantitatively how the fraction of high-quality photo-zs drops as a function of -band magnitude (), we fit our data with the following formulae:
| (B1) | ||||
| (B2) |
where () are parameters to be fitted, is the probability that a source with has , and is defined as 1 if and 0 if . can be regarded as a nominal magnitude, below which drops considerably (if ). By maximizing the corresponding likelihoods, we obtain
| (B3) | ||||
| (B4) | ||||
| (B5) | ||||
| (B6) |
where “SNR cuts” means that we only select sources having detections in more than 5 bands.
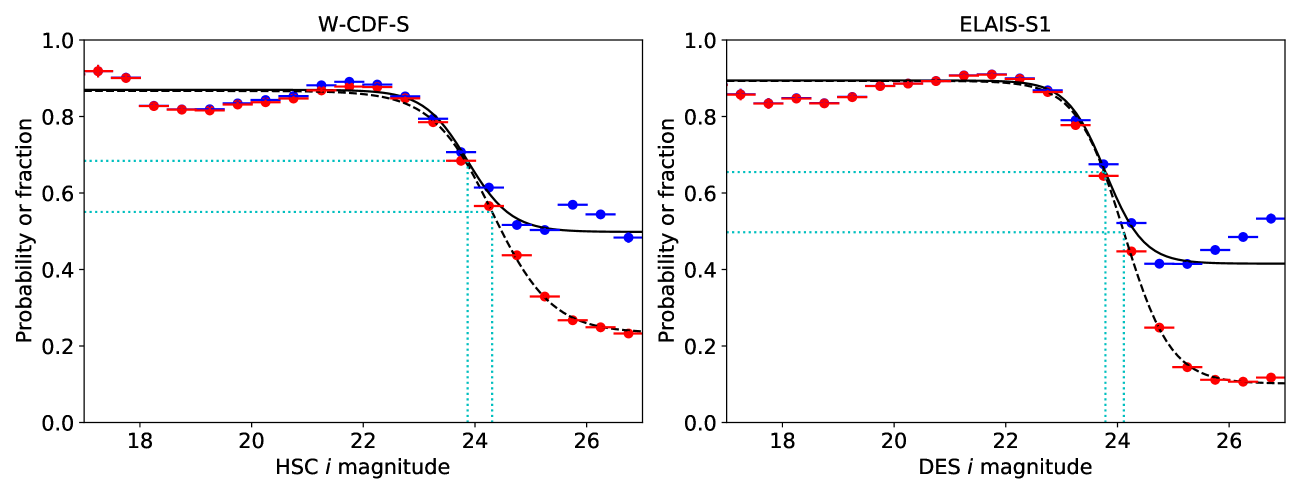
Fig. S1 justifies that these functions can generally match well the observed fraction of high-quality photo-zs as a function of . The figure also shows that applying the SNR cut can greatly improve the overall photo-z quality in the faint-magnitude regime. The best-fit values are generally around 24, and thus we conclude that the nominal -band “depths” of our high-quality photo-zs are for both W-CDF-S and ELAIS-S1. The values of ELAIS-S1 can generally match those of W-CDF-S at . At fainter magnitudes, the ELAIS-S1 drops to a lower level than the W-CDF-S because the data in ELAIS-S1 are shallower.
Appendix C Additional Notes on Figure 1
There are a few sources that have non-zero spec-zs but have near-zero photo-zs. This phenomenon may arise because the EAZY code cannot find an obvious Balmer break at 3646 Å for these sources when no bands cover the break, and thus it assigns the photo-zs to be .
Appendix D Notes on the photo-z uncertainties
The cataloged photo-z is the z-grid value that minimizes the fitting output by EAZY, and the 68% limits are the redshift values of the photo-z quantile function from the fitting at 16% and 84% (see Eq. 6 of Brammer et al. 2008). The definition of the best-fit photo-z does not require it to be necessarily within the photo-z uncertainty interval; thus, there are a small fraction of sources with photo-zs smaller/larger than their 68% lower/upper limits, and the limits of these sources should not be used (Yang et al. 2014). Furthermore, we found that 78%/76% of spec-zs reside within the 68% photo-z intervals in W-CDF-S/ELAIS-S1. This may indicate that the photo-z uncertainties are slightly overestimated (i.e., 78%/76% roughly correspond to 1.2 for a normal distribution).
Appendix E Notes on AGNs and stars
As mentioned in the main text, we only use galaxy templates to fit all the sources, and thus the results may be less reliable for AGNs and stars. For AGNs, however, only those that materially affect the observed optical-to-near-infrared (NIR) SEDs are expected to have this issue, and such sources are usually BL AGNs. Other sources with at most moderate AGN contributions to the optical-to-NIR SEDs (e.g., obscured AGNs) generally still have reliable photo-zs. For example, Ni et al. (in preparation) show that in W-CDF-S/ELAIS-S1 are 6.8%/4.4% for non-BL X-ray AGNs with high-quality photo-zs. Therefore, for most work involving AGNs in W-CDF-S and ELAIS-S1, to obtain optimal photo-zs, it is usually sufficient to divide their sample to BL AGNs and other sources and adopt the photo-zs in Ni et al. (in preparation) for the former and our photo-zs for the latter. We emphasize that the term “BL AGNs” here does not only refer to those AGNs with spectroscopically detected broad lines, but is generalized to mean all the sources with significant characteristics that are similar to spectroscopic BL AGNs, such as those sources with AGN-dominated SEDs.
In addition, BL AGNs are not expected to be dominant among the outliers in Fig. 1 because BL AGNs have a much lower surface number density (; Ni et al., in preparation) than galaxies. Only 5%/16% of the outliers in W-CDF-S/ELAIS-S1 are identified as BL AGN candidates (Ni et al., in preparation), and these values further drop to 3%/5% when requiring .
Detailed selections of BL AGNs and stars are beyond the scope of this work. Thus, we leave the selections to the users of this catalog who can apply their own criteria, and they can also adopt the selections in Ni et al. (in preparation) for both BL AGNs and stars.