Analysis of physical processes in eruptive YSOs with near infrared spectra and multi-wavelength light curves
Abstract
The decade-long Vista Variables in the Via Lactea (VVV) survey has detected numerous highly variable young stellar objects (YSOs). We present a study of 61 highly variable VVV YSOs (–5 mag), combining near infrared spectra from Magellan and VLT with VVV and NEOWISE light curves to investigate physical mechanisms behind eruptive events. Most sources are spectroscopically confirmed as eruptive variables (typically Class I YSOs) but variable extinction is also seen. Among them, magnetically controlled accretion, identified by Hi recombination emission (usually accompanied by CO emission), is observed in 46 YSOs. Boundary layer accretion, associated with FU Ori-like outbursts identified by CO overtone and H2O absorption, is observed only in longer duration events (5 yr total duration). However, even in long duration events, the magnetically controlled accretion mode predominates, with amplitudes similar to the boundary layer mode. Shorter (100–700 days) eruptive events usually have lower amplitudes and these events are generally either periodic accretors or multiple timescale events, wherein large photometric changes occur on timescales of weeks and years. We find that the ratio of amplitudes in and can distinguish between variable accretion and variable extinction. Several YSOs are periodic or quasi-periodic variables. We identify examples of periodic accretors and extinction-driven periodicity among them (with periods up to 5 yr) though more data are needed to classify some cases. The data suggest that dynamic interactions with a companion may control the accretion rate in a substantial proportion of eruptive systems, although star-disc interactions should also be considered.
keywords:
stars: pre-main sequence – stars: protostar – stars: variables: T Tauri – infrared: stars – stars: Wolf-Rayet – stars: AGB1 Introduction
Pre-main-sequence (PMS) stellar evolution is shaped by the mass accretion process (see review by Hartmann et al., 2016). As a departure from the steady mass accretion scenario (e.g. Shu, 1977), episodic accretion during the PMS evolution was originally proposed to solve the luminosity problem (Kenyon et al., 1990; Hartmann & Kenyon, 1996), specifically the under-luminosity of low mass Class I YSOs. The mass accretion rate of a YSO would be enhanced by up to 4 orders of magnitudes for relatively short periods (Dunham & Vorobyov, 2012; Audard et al., 2014) and the luminosity would be lower at other times. Theoretical models explored several physical mechanisms that might trigger episodic accretion, including outside-in thermal instability introduced by a massive planet (Lodato & Clarke, 2004; Clarke et al., 2005), imbalance between accretion controlled by gravitational and magneto-rotational instabilities at different radii within the disc (Zhu et al., 2009b), disc fragmentation (Vorobyov & Basu, 2005, 2010) or piling up of disc materials outside the star-disc co-rotation radius (D’Angelo & Spruit, 2010, 2012).
Photometric variations related to episodic accretion have been observed among Class I and Class II objects with a wide range of amplitudes and timescales (see review by Audard et al., 2014, and references therein). In general, most eruptive YSOs were sorted into two groups, EXors and FUors. EXors have amplitudes up to mag (Lorenzetti et al., 2009) on timescales of a few hundred days, and some of them have repeated outbursts (Herbig, 1989, 2008; Audard et al., 2010). Spectroscopic studies revealed that EXors are undergoing the magnetospheric accretion process with indicators like broad Hi recombination emission lines (e.g. Lorenzetti et al., 2009). FUors typically have similarly high amplitudes but much longer-lasting outbursts, with a rapid rise (100 days) followed by a century-long decay (Hartmann & Kenyon, 1996; Kenyon et al., 2000). Most FUor outbursts have higher luminosity than EXors with high mass accretion rate ( – ). The mass accretion process of FUors is not controlled by the stellar magnetic field. As a consequence, their near infrared spectra are dominated by broad H2O and CO absorption bands; Br emission is not seen and the Paschen lines are often detected in absorption (Connelley & Reipurth, 2018). As the prototype of FUors, an extended self-luminous disc is found around FU Ori, as a consequence of inefficient radiative transfer throughout the geometrically thick disc (Zhu et al., 2007, 2009a; Hartmann et al., 2011).
Recently, more eruptive YSOs were discovered not belonging to the EXor and FUor categories. A few YSOs show intermediate amplitude and timescale, while having similar spectral features to FUors, e.g. HBC 722 (Kóspál et al., 2016) and V371 Ser (Hodapp et al., 2012). On the other hand, some eruptive YSOs with emission-line spectra have variation timescales longer than typical EXors, for example V1647 Ori (Aspin et al., 2009) and Gaia19bey (Hodapp et al., 2020). The YSO V346 Nor has unique characteristics, with a FUor-like outburst duration but an outflow-dominated spectrum (Kóspál et al., 2020). A more complete sample of eruptive objects is necessary to draw a whole picture of the episodic accretion process throughout the PMS evolution.
The VISTA Variables in the Via Lactea (VVV) survey has imaged the southern Galactic plane and the bulge in the near-infrared at several dozen epochs since 2010 (Minniti et al., 2010; Saito et al., 2012). The initial VVV survey was extended as “VVVX" in 2016 (Minniti, 2016), so (2.15 m) light curves of targets have been observed on a timescale of a decade. A series of works have been carried out to study eruptive YSOs in the VVV field111The VVV field covers the Galactic bulge () and disc () with longitude . VVVX also covers a large new area but that does not form part of this study. Contreras Peña et al. (2017a, hereafter Paper I), discovered 816 high amplitude variables from the 2010-2014 VVV -band light curves ( mag). This work showed that eruptive variability is at least an order of magnitude more common in Class I YSOs than Class II YSOs, see also Contreras Peña et al. (2019). The spectroscopic follow-up work (Contreras Peña et al., 2017b, hereafter referred to as Paper II) found that most Class I eruptive variables have outbursts of intermediate duration, typically 1–5 yr, whilst the nature of the spectra (EXor-like emission or FUor-like absorption) in many cases did not fit expectations based on the duration of classical FUor and EXor outbursts in optically bright systems. Optically detected FUors and EXors have Class II or flat-spectrum SEDs suggesting a more evolved nature, though some appear to have massive circumstellar envelopes despite this (Green et al., 2013; Fehér et al., 2017). A new category of eruptive YSOs “MNors” was tentatively proposed for these systems having intermediate outburst duration or inconsistent spectroscopic and time domain characteristics according to the classical FUor/EXor scheme. This was a broad classification, including not only sources with “eruptive” light curves but also some that showed evidence for long period accretion-driven variability, dubbed “LPV-YSOs”. Guo et al. (2020, Paper III) studied the near-infrared spectroscopic variation of 14 eruptive objects from the Paper II sample, on day-to-day and year-to-year timescales. Both variable mass accretion and variable line-of-sight extinction were found on long-term eruptive Class I objects. In Paper III, we also defined a new type of variable YSO, the “multiple timescale variable” (MTV), wherein the amplitudes on short timescales ( 30 d) are comparable to the slower inter-year variations. MTVs have emission line spectra, consistent with the magnetospheric accretion scenario. The physical mechanisms of these month-long variations are likely due to unstable accretion, but this is unclear at present.
In this work, we conducted near-infrared spectroscopic follow-up of 38 highly variable YSO candidates from the VVV survey with a variety of light curve types. When added to the previous sample of Paper II, the combined sample size is 61 spectroscopically confirmed YSOs. Here, this large spectroscopic sample, dominated by eruptive YSOs, is used to constrain/infer the accretion mode, measure accretion luminosity and the accretion burst duration, thereby allowing us to study the detailed nature of episodic accretion in embedded protostars. We classify the YSOs in various sub-types via their spectroscopic and multi-wavelength time domain properties. The observational behaviours and underlying physical processes are then further investigated.
This paper is organised as follows: Target selection methods, observational information, and data reduction routines are described in §2. Spectroscopic and photometric results and target classifications are shown in §3. In §4, we discuss variation mechanisms by studying multi-wavelength light curves, then take a statistical view of eruptive YSOs in the VVV survey and give details of a few individual objects. A conclusion is presented in §5.
| Name | RA | Dec | Variable star | Period | ||||||||
|---|---|---|---|---|---|---|---|---|---|---|---|---|
| J2000 | J2000 | mag | mag | mag | mag | classa | classb | day | Y/ N | kpc | ||
| v14 | 12:12:18.13 | -62:49:04.5 | 15.56 | 1.64 | 0.44 | 1.16 | 0.61 | LPV-YSO | M | 398 | Y | 2.5 |
| v16 | 12:13:29.76 | -62:41:07.7 | 13.65 | 1.66 | 0.35 | 1.66 | 0.07 | Eruptive | L | > 3477 | N | 9.7 |
| v51 | 13:19:42.87 | -63:01:01.9 | 14.56 | 2.93 | 0.60 | 2.71 | - | AGB | L | 1000 | N | - |
| v53 | 13:27:02.40 | -63:06:22.5 | 14.56 | 2.42 | 1.29 | 1.66 | 0.61 | Eruptive | M | 236 | N | - |
| v84 | 14:09:11.55 | -61:32:24.3 | 11.99 | 2.76 | - | - | - | Nova | L | > 500 | N | - |
| v128 | 14:58:29.67 | -59:09:40.3 | 14.41 | 2.54 | 0.83 | 1.79 | 0.56 | Eruptive | L | > 1132 | N | 2.6 |
| v181 | 15:46:39.17 | -55:50:28.3 | 12.76 | 3.47 | 1.58 | 1.41 | 0.58 | Eruptive | M | 183.9 | Y? | - |
| v190 | 15:47:03.56 | -54:43:10.2 | 13.53 | 1.44 | 0.67 | 0.80 | -0.43 | LPV-YSO | L | 612 | Y | 5.0 |
| v237 | 16:10:48.22 | -51:42:45.0 | 13.95 | 1.92 | 0.16 | 0.91 | 1.02 | Dipper? | L | 1943 | N | 4.2 |
| v309 | 16:40:58.19 | -47:06:31.9 | 13.56 | 2.60 | 0.28 | 1.17 | 1.30 | LPV-YSO? | M | 181 | Y? | 12.2 |
| v319 | 16:45:17.04 | -46:05:55.4 | 11.66 | 1.56 | 0.75 | 0.79 | - | Symbiotic | L | 307 | Y | - |
| v335 | 16:52:09.73 | -45:52:49.6 | 13.00 | 3.63 | 0.74 | 1.64 | 0.45 | Dipper | L | 1041 | N | 2.3 |
| v370 | 16:57:48.65 | -43:04:42.5 | 11.82 | 0.94 | 0.34 | 0.62 | - | Symbiotic | L | 419 | Y | - |
| v371 | 16:59:50.04 | -43:17:21.6 | 14.56 | 2.09 | - | - | - | Wolf-Rayet | M | 193 | Y | - |
| v376 | 16:58:44.44 | -42:47:36.6 | 12.49 | 1.71 | 0.62 | 0.81 | -0.37 | Fader | M | >1300 | N | - |
| v389 | 17:03:17.18 | -42:25:49.9 | 13.59 | 1.97 | 0.56 | 1.57 | 0.69 | Eruptive? | M | 1036 | N | 2.2 |
| v467 | 13:01:13.23 | -62:25:27.9 | 12.79 | 2.64 | 0.85 | 2.37 | -0.24 | LPV-YSO | L | 1840 | Y | 4.5 |
| v618 | 15:42:54.67 | -55:00:52.8 | 12.13 | 1.33 | 0.60 | 0.94 | -0.09 | STV | M | 140 | N | - |
| v621 | 15:43:12.04 | -54:23:08.8 | 15.45 | 1.91 | 0.51 | 0.25 | -0.05 | Eruptive | L | > 2898 | N | 6.0 |
| v636 | 15:51:46.28 | -53:25:57.3 | 13.60 | 1.43 | 0.62 | 0.96 | 0.43 | LPV-YSO | M | 565 | Y | 2.8 |
| v713 | 16:33:52.79 | -46:52:18.5 | 11.75 | 2.03 | 1.60 | 2.03 | -0.04 | Fader | L | > 1130 | N | 3.2 |
| Stim1 | 12:57:44.23 | -62:15:06.4 | 14.20 | 2.45 | 1.70 | 2.45 | 0.63 | Eruptive | L | > 3452 | N | - |
| Stim5 | 16:12:14.38 | -51:50:24.6 | 12.78 | 3.81 | 1.71 | 3.81 | 0.9 | Eruptive | L | > 3452 | N | 2.4 |
| Stim13 | 16:19:10.80 | -51:03:53.0 | 12.39 | 1.51 | 0.20 | 0.76 | 1.39 | Dipper | L | 1588 | N | 3.1 |
| DR4_v5 | 13:29:26.28 | -62:23:26.5 | 14.11 | 3.96 | 0.31 | 0.81 | 0.95 | Dipper | L | > 1230 | N | - |
| DR4_v10 | 14:25:13.98 | -60:20:20.0 | 15.67 | 3.56 | 0.79 | 1.57 | 1.86 | Eruptive | L | > 3437 | N | 4.6 |
| DR4_v15 | 15:07:11.11 | -58:50:32.9 | 17.41 | 3.60 | 1.41 | 2.15 | 0.56 | Eruptive | L | > 3456 | N | 4.3 |
| DR4_v17 | 15:09:35.66 | -57:35:22.6 | 13.69 | 3.83 | 1.10 | 2.80 | 0.79 | LPV-YSO | L | 1155 | Y | 4.0 |
| DR4_v18 | 15:30:17.93 | -55:34:55.1 | 13.19 | 4.52 | 2.22 | 4.37 | 0.21 | Dipper | L | > 796 | N | - |
| DR4_v20 | 15:44:26.03 | -54:01:38.4 | 17.03 | 3.35 | 0.50 | 0.68 | 0.74 | Eruptive | L | > 2913 | N | 2.5 |
| DR4_v30 | 16:22:40.18 | -49:06:26.4 | 13.68 | 3.88 | 1.37 | 2.14 | 0.36 | STV or Eruptive | M | 30 | N | - |
| DR4_v34 | 16:29:06.99 | -48:51:16.9 | 14.11 | 3.57 | 0.44 | 1.04 | -0.19 | Eruptive | L | > 2904 | N | 3.2 |
| DR4_v39 | 16:46:30.13 | -46:04:39.7 | 13.56 | 4.76 | 1.06 | 2.01 | 0.57 | Dipper | L | 1445 | N | 3.0 |
| DR4_v42 | 16:50:14.77 | -44:03:30.7 | 15.74 | 3.36 | 1.26 | 2.38 | 1.02 | Eruptive | L | > 900 | N | 5.1 |
| DR4_v44 | 16:52:04.42 | -43:33:26.0 | 15.98 | 3.57 | 1.04 | 1.46 | 0.83 | Eruptive | L | > 2921 | N | 3.5 |
| DR4_v55 | 17:29:02.42 | -34:00:36.2 | 13.87 | 3.59 | 2.57 | 2.93 | 1.92 | LPV-YSO | L | 954 | Y | 3.4 |
| DR4_v67 | 17:41:31.14 | -31:26:12.1 | 14.03 | 5.30 | 1.45 | 3.37 | 1.05 | Eruptive | L | 2572 | N | 4.5 |
| DR4_v89 | 17:50:50.54 | -29:10:48.7 | 14.23 | 3.04 | 0.23 | 0.85 | 0.85 | Eruptive | M | 710 | N | 2.3 |
2 Observation and data reduction
2.1 Target selection and basic information
In this paper, 38 targets were selected for follow-up in our 2017 and 2019 spectroscopic campaigns based on their variability in in the VVV survey and evidence for star formation activity in the surrounding field. For the 2017 observations, 24 objects were selected from our previous study of the VVV light curves from 2010 to 2014 (Paper I), which had provided a list of 816 near-infrared variable stars with mag. These objects were sufficiently bright () in 2017 to allow good quality data to be obtained at intermediate resolution in brief observations. They were chosen to encompass a range of the light curve types defined in Paper I: “eruptive”, “dipper”, “fader”, and “LPV-YSO” (long period variable YSO). This broadens the selection compared to the sample in Paper II, which was heavily weighted towards YSOs with eruptive light curves. Short term variables (“denoted STV”, whether periodic or not) were not selected, these almost always having mag in Paper I. However, v618, a source previously classified as “LPV-YSO” is reclassified as “STV”. Herein we use a single “v” prefix for 21 of these 24 sources, as opposed to “VVVv” in Paper I. The remaining three have the prefix “Stim”, denoting the discoverer W. Stimson, a previous group member in the University of Hertfordshire who identified a total of 14 highly variable stars during completeness testing in Paper I, that were not included in the published list. We give details of these sources in Appendix A.
For the 2019 campaign, another 15 targets, mostly having eruptive light curves, were selected from a set of 27 YSO candidates found in a search of the VVV 4th Data Release (available at http://vsa.roe.ac.uk) for high amplitude variable stars of all types with mag. The 15 targets selected were those for which the available photometry indicated that they would likely be in a bright state during the 2019 spectroscopic campaign, or at least an intermediate state. Fourteen targets have a “DR4_v” prefix, following Lucas et al., (in prep). One object “Stim5” also appears in the previous selection and it was observed in both the 2017 and 2019 campaigns, providing a helpful comparison of results from the two different telescopes used.
The light curve classifications of all 38 targets are refined using light curves drawn from the VVV/VIRAC2 catalog, (Smith et al., 2018, Smith et al. in prep). For YSOs we follow the method described in Paper I, with the addition of the MTV category (see §1) More information on light curve analysis is shown in §2.6. Information on the targets, including coordinates, mean magnitudes, variation amplitudes, light curve classifications, and typical duration of variations are listed in Table 1.
The evolutionary stages of YSOs are classified by the slope between the near- and mid-infrared spectral energy distributions (SED), as defined by (Lada, 1987). YSOs at early evolution stages (Classes 0 & I) have while Class II objects with a thick disc have . In between, YSOs with are defined as “flat-spectrum” objects, as a transitional stage from Class I to Class II (Greene & Lada, 2002; Großschedl et al., 2019). In this work, the infrared fluxes from 2 to 24 m are drawn from public surveys including the bandpass data from the VVV/VIRAC2, IRAC to data from the Spitzer/GLIMPSE survey catalog (Benjamin et al., 2003), MIPS24 data from the Spitzer/MIPSGAL survey (Carey et al., 2009; Gutermuth & Heyer, 2015) and to bandpass data from the AllWISE data release of the WISE survey (Wright et al., 2010). WISE and Spitzer data are obtained via online catalogs at the NASA/IPAC Infrared Science Archive (IRSA222http://irsa.ipac.caltech.edu). In the Galactic plane, WISE photometry in (12 m) and (22 m) may be seriously compromised by the bright non-uniform background in star formation regions. Genuine sources detected in and can have spurious detections in and due to forced photometry at the same locations. To guard against this, visual inspection was performed on the Spitzer Enhanced Imaging Products (SEIP) images and the unWISE (Meisner et al., 2017) images. In a few cases, where there is no mid-infrared detection in the or MIPS 24m passbands, derived from an SED fit between 2 and 12 m.
For measurement of , contemporaneous and WISE photometry are strongly preferred. To complement the WISE photometry obtained in 2010, we only use VVV data from 2010 to fit the SED slope. A comparison between and amplitudes will be discussed in §4.1. The measured values for YSOs are listed in Table 1. Two objects, v84 and v621, lack archival and photometric detections. We visually inspected images from SEIP and ALLWISE and no source is seen at the given coordinates. From to and/or from Spitzer to bands, both objects have a steeply declining SED toward longer wavelengths, in line with Class III objects or main-sequence stars. Based on the measurement, 73% (24/33) of our targets are Class I objects, 21% (7/33) are flat-spectrum objects and 6% (2/33) are disk-bearing Class II YSOs. Another 5 sources were classified as post-main-sequence objects based on their spectral features (see §3.2).
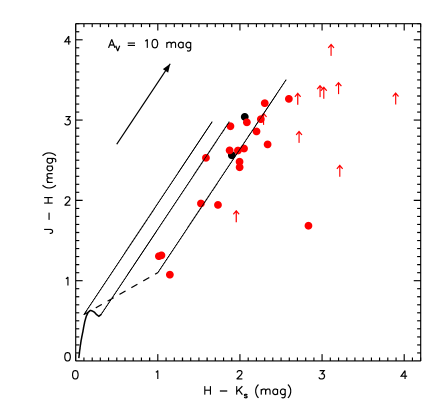
There are two facts for readers to note here. First, targets in our work lie in the Galactic mid-plane and so their are slightly biased towards high values due to foreground extinction. Second, the variable nature of our targets may also bias the measurement of the value. For example, an ongoing near-infrared outburst would reduce if the energy is not efficiently reprocessed at far infrared wavelengths. Conversely, a dimming due to extinction would cause a higher value. Since most of the eruptive systems were in a quiescent state in 2010, the measurement of for those objects is still a useful indicator of evolutionary stage. Similarly, the dippers (whose classification suggests an extinction event) underwent their dips after 2010. However, as we will see, the spectra are typically disc-dominated and show H2 emission lines (an indicator of Class I status, Greene & Lada 1996). This implies an earlier stage of evolution than classical EXors for example. A near-infrared colour-colour diagram is shown in Figure 1. The -, - and magnitudes are obtained from several multi-band photometric epochs from VVV/VVVX. For some eruptive systems, the magnitude is only detected from the bright epoch in 2015 that close to the spectroscopic epochs. To keep consistency, we hereby favoured the bright epochs for sources with more than one available epochs. For the sources lacking a -bandpass detection, the magnitude is artificially set to 20, the typical detection limit of VVV. These sources are marked by upward-pointing arrows in Figure 1. Through comparison with the location of reddened classical T Tauri stars (Meyer et al., 1997), we see that most of Class I and flat-spectrum YSOs () in this work have a -bandpass excess.
2.2 Spectroscopic observations
In the 2017 campaign, spectra of 24 targets were obtained using the Echelle mode of Folded-port Infra-Red Echellette (FIRE) spectrograph (Simcoe et al., 2013) on the Magellan Telescope over two consecutive nights (May 29th to 30th) at Las Campanas Observatory, Chile. The FIRE spectrograph covers the near-infrared waveband from 0.8 m to 2.45 m. A slit width of either 0.6″ or 0.75″ was used, depending on the seeing conditions, giving resolution or , respectively. The data reduction procedures are similar to those described in Paper III using the FIREHOSE V2.0 pipeline (Gagne et al., 2015) plus customised programs based on the IDL platform.
The 2019 spectroscopic campaign was conducted using the slit mode of the X-shooter spectrograph (Vernet et al., 2011) on the ESO Very Large Telescope (VLT), at Paranal Observatory, Chile. Data were taken in Service Mode (program ID 0103.C-0622(A)). Both the visible and near-infrared arms were used simultaneously during the observations and the exposure time is adjusted for individual target based on the expected brightness. In this work, we only present the near-infrared spectra since a visible spectrum was detected in only one source (DR4_v30). A slit width of 0.6″ was used for all targets, giving resolution in the bandpass. Blind offsetting was applied for both spectrographs for most targets since they were typically fainter than 20th magnitude in the acquisition images, taken in the bandpass for FIRE and the bandpass for X-shooter. Observation date, exposure time, and spectrograph information for individual targets are listed in Table LABEL:tab:obs.
2.3 Reduction of X-shooter spectra
Spectra were extracted by the X-shooter pipeline as constructed in the ESO Recipe Flexible Execution Workbench software (Reflex; Freudling et al., 2013). The data reduction workflow first creates master calibration frames, including bias, flat and dark fields. Then the location of the spectra (taken at two separate nod positions) and the wavelength solution are generated by a 2D mapping algorithm using arc lamp frames. Sky backgrounds are extracted under the STARE reduction mode of the pipeline, which provides an additional step of wavelength calibration for individual targets. We noticed a constant 83 km s-1 shift between the wavelength solution provided by the pipeline and the wavelengths of the OH sky lines between 2.1 and 2.5 m. This shift was manually corrected during the data reduction. The flux calibration was derived from telluric standard stars observed on the same night as the scientific targets. Telluric absorption lines are further corrected by the molecfit software (Smette et al., 2015; Kausch et al., 2015).
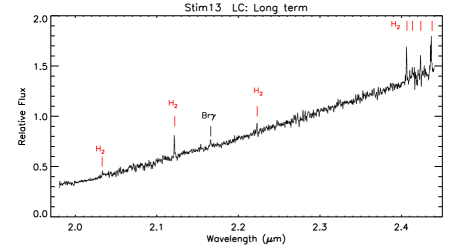
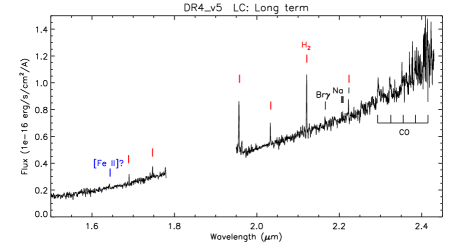
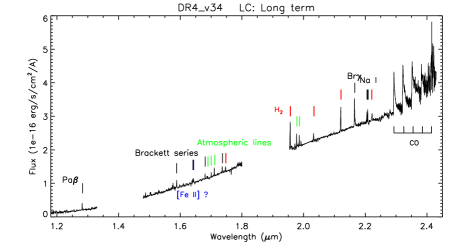
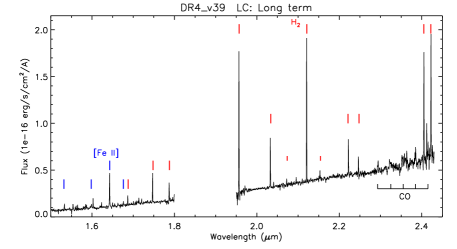
An accurate absolute flux calibration could not be performed because most targets were acquired by blind offsetting and because observation of these relatively bright infrared stars was queued for relatively poor seeing conditions by Paranal standards (typically 1.0–1.5″ seeing at the zenith). We present the pipeline produced fluxes for the X-shooter spectra nonetheless. The synthesised flux of Xshooter targets through the filter is shown by a blue dot in the relevant panels in Figure 8. The reader should be aware that the integrated flux may be less than the real flux due to imperfect target acquisition on the slit and changeable observing conditions. Examples of reduced spectra are presented in Figure 15.
2.4 Spectroscopic measurements and CO model
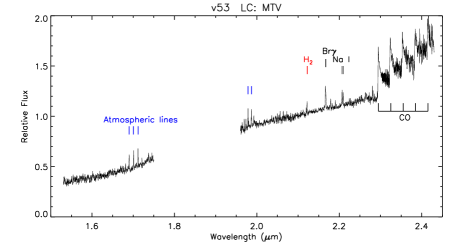
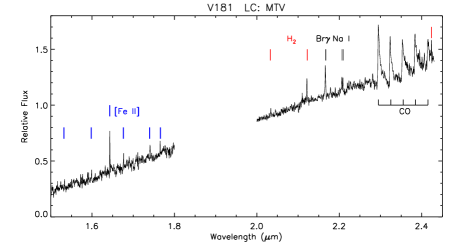
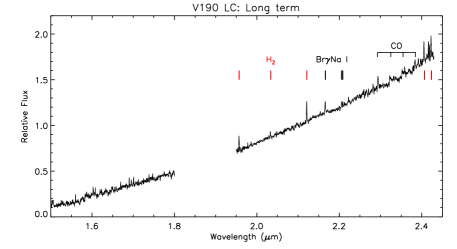
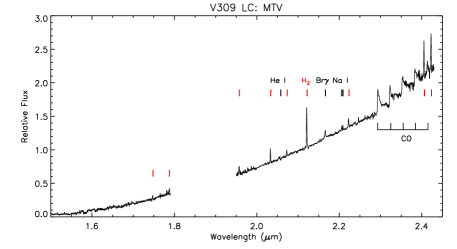
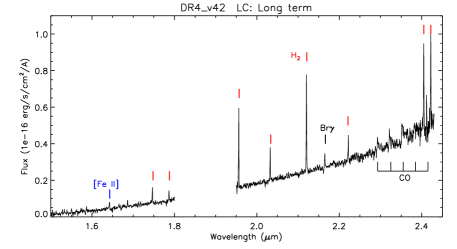
Three principal spectroscopic features are measured in this work: the CO overtone bands beyond 2.29 m, molecular hydrogen (H2) emission lines, and the Br line at 2.166 m. Heliocentric velocities and the sun’s motion relative to the Local Standard of Rest is calculated by the data reduction pipelines and are corrected before measuring spectral features. All measurements are conducted by custom-written programs in the IDL platform. The measurements of line features followed the Gaussian fitting method developed in Paper III, and the results are shown in Table LABEL:tab:lines. The typical uncertainty of the radial velocity measurement is about 1 pixel on the array detector, which corresponds to km s-1 for both detectors. In individual sources, H2 emission, originating from the stellar wind or outflow, often has a blue-shifted radial velocity relative to the Br and CO emission that trace the mass accretion process and the rotating disc. The radial velocity difference between H2 and Br lines reaches 100 km s-1 in a few sources.
The 12CO overtone features are measured by fitting synthetic models to the continuum-subtracted spectra. The CO model used in this work is based on previous works (Kraus et al. (2000), and Appendix E in Paper II). By considering the ro-vibrational energy states of the CO molecule (Dunham, 1932; Farrenq et al., 1991), this model calculates the spectral intensity of CO band heads for a range of temperatures and column densities. In addition, the line-of-sight Keplerian rotation velocity are now added to the previous model, for a range of disc inclination angles. The CO models are then applied to fit the first two bands ( and ). As mentioned in Paper II, observed CO profiles usually have broader band heads than the models, and high Keplerian velocity from an accretion disc was proposed as an explanation of the broadened emission profile (Najita et al., 1996; Davies et al., 2010). In this work, we noticed that the unexpected broadening of the CO emission is only seen on the first () band for most YSOs, while the second band () is usually well fit by the model. This broadening issue could not be fully solved by adding a more realistic disc model including the temperature gradient in the inner disc (e.g. Wheelwright et al., 2010; Ilee et al., 2013). We believe that there are some missing spectral features in the first band in our model. Hence, in our analysis and discussion we use the CO model fitting only for radial velocity measurements (which are reliable because there are many well-fitted lines in the CO bands) and we do not quote the fitted temperatures and column densities.
| Object | Instrument | Br | H2 (2.12 m) | CO | |||||
| RV (km s-1) | EW (Å) | RV (km s-1) | EW (Å) | RV (km s-1) | EW (Å) | (kpc) | (kpc) | ||
| Young stellar objects: | |||||||||
| v14 | FIRE | -34.1 | -5.8 1.1 | - | - | - | - | ||
| v16 | FIRE | 6.3 | 0.4 0.2 | - | - | 2.2 | 12.5 7.0 | - | |
| v53 | FIRE | 93.9 | -3.6 0.5 | - | - | 51.5 | -42.6 5.6 | - | |
| v128 | FIRE | 61.3 | -1.2 1.0 | -45.2 | -0.9 0.2 | - | - | - | - |
| v181 | FIRE | 5.0 | -4.4 0.8 | -48.4 | -2.0 0.8 | 18.1 | -32.1 8.7 | - | |
| v190 | FIRE | -46.0 | -2.1 0.9 | -135.2 | -2.8 0.4 | -66.8 | -10.3 6.1 | ||
| v237 | FIRE | -1.3 | -0.5 0.3 | - | - | -85.1 | 7.8 7.4 | ||
| v309 | FIRE | -47.2 | -1.7 0.8 | -135.3 | -8.5 0.4 | -35.3 | -31.7 5.1 | ||
| v335 | FIRE | -54.8 | -4.7 0.3 | -41.9 | -0.4 0.2 | -60.0 | -13.0 5.2 | ||
| v376 | FIRE | -11.3 | -0.9 0.3 | - | - | - | - | ||
| v389 | FIRE | -52.4 | -3.4 0.9 | -51.2 | -3.9 0.3 | - | - | ||
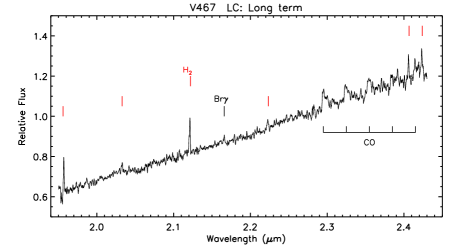
| v467 | FIRE | -12.7 | -0.5 0.4 | -66.5 | -1.7 0.2 | -3.6 | -9.9 5.7 | ||
| v618 | FIRE | - | - | -38.3 | -6.0 1.5 | - | - | - | - |
| v621 | FIRE | 13.4 | -7.1 0.9 | - | - | - | - | - | |
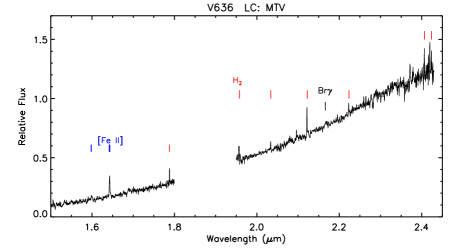
| v636 | FIRE | - | - | -43.6 | -3.3 0.3 | - | - | - | - |
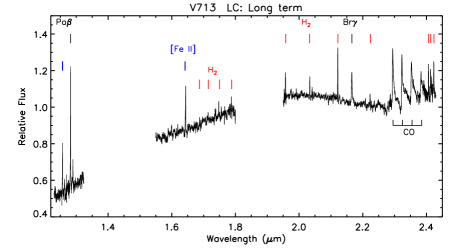
| v713 | FIRE | -76.4 | -3.4 0.7 | -47.3 | -2.8 0.2 | -49.5 | -15.3 13.6 | ||
| Stim1 | FIRE | -2.0 | -3.3 0.3 | - | - | 17.8 | -18.7 3.1 | - | |
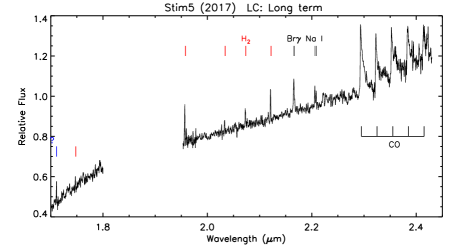
| Stim5 | FIRE | -97.1 | -2.9 0.7 | -127.5 | -2.2 0.4 | -91.2 | -34.0 5.2 | ||
| Stim5 | XSHOOTER | -91.5 | -2.6 2.0 | -159.2 | -14.2 0.1 | -78.7 | -22.1 14.2 | ||
| Stim13 | FIRE | -40.1 | -1.3 0.9 | -51.0 | -2.9 0.5 | - | - | ||
| DR4_v5 | XSHOOTER | - | - | -79.0 | -9.1 0.5 | -27.9 | -25.8 12.2 | ||
| DR4_v10 | XSHOOTER | -105.3 | -4.0 0.8 | -84.4 | -1.7 0.3 | -78.2 | -8.9 6.1 | ||
| DR4_v15 | XSHOOTER | - | - | -90.5 | -3.1 0.1 | - | - | - | - |
| DR4_v17 | XSHOOTER | -98.1 | -1.2 0.4 | -126.3 | -2.1 0.4 | -73.1 | -12.2 6.5 | ||
| DR4_v18 | XSHOOTER | -100.0 | -3.0 0.4 | -83.8 | -1.0 0.2 | -90.2 | -6.9 5.7 | ||
| DR4_v20 | XSHOOTER | - | - | -48.4 | -2.5 0.5 | -83.7 | 40.6 9.2 | ||
| DR4_v30 | XSHOOTER | -143.3 | -1.1 0.1 | - | - | -126.8 | -1.9 0.6 | ||
| DR4_v34 | XSHOOTER | -58.4 | -3.8 0.2 | -121.0 | -3.8 0.3 | -59.4 | -28.4 3.5 | ||
| DR4_v39 | XSHOOTER | - | - | -77.3 | -35.3 0.9 | -72.5 | -7.5 16.0 | ||
| DR4_v42 | XSHOOTER | -111.0 | -4.8 0.9 | -117.9 | -23.3 0.2 | -114.7 | -17.4 17.6 | ||
| DR4_v44 | XSHOOTER | -85.0 | -2.1 0.3 | - | - | -48.9 | -25.4 6.3 | ||
| DR4_v55 | XSHOOTER | - | - | -34.7 | -30.5 1.3 | - | - | - | - |
| DR4_v67 | XSHOOTER | - | - | -43.4 | -12.1 0.1 | - | - | - | - |
| DR4_v89 | XSHOOTER | - | - | -51.4 | -5.2 0.3 | - | - | - | - |
| Post main sequence objects: | |||||||||
| v51 | FIRE | -34.3 | 0.9 0.5 | - | - | 37.3 | 7.8 5.6 | - | |
| v84 | FIRE | -218.9; 208.0 | -5.8 0.7 | - | - | - | - | - | - |
| v319 | FIRE | 128.6 | 1.1 0.4 | - | - | 119.8 | 56.9 6.1 | - | - |
| v370 | FIRE | 26.1 | -0.9 0.4 | - | - | -10.2 | 49.9 10.8 | ||
| v371 | FIRE | -88.2 | -30.7 3.7 | - | - | - | - | ||
2.5 Distance measurements
Wherever possible, kinematic distances, , were derived from the radial velocities measured in the CO overtone band fits described above. For objects without CO features, we used the radial velocity of the Br line to derive the kinematic distance because H2 lines more often arise in a blue-shifted wind or outflow. The uncertainty of the radial velocity measurement is approximately 1 array pixel, about 12 km s-1 in both spectrographs. The kinematic distances are measured via the “Monte Carlo simulation mode” of the online tool provided by Wenger et al. (2018), which includes the uncertainties in the Galactic rotation model. The constants in the calculations are adopted from Reid et al. (2014), including the circular rotation speed of the solar system (), the distance to the Galactic centre ( kpc), and the Galactic rotation curve. The kinematic distances and uncertainties are listed in Table LABEL:tab:lines. For targets lacking Br and CO features and targets for which the measured radial velocity is inconsistent with the Galactic rotation model (e.g. halo stars) distances not given in Table LABEL:tab:lines. In addition, we noticed that the difference between the radial velocities of Br line and CO bandhead emission sometimes significantly exceeds the uncertainty (12 km s-1). Therefore, the kinematic distance derived by the radial velocity of Br line alone is highly uncertain and needs to be confirmed by other methods, such as a literature-based distance to the surrounding star formation region, .
Most of our targets are heavily embedded distant Class I YSOs, very faint in the optical waveband, so Gaia measurements are not available. Here, the measured proper motions (PMs) of individual objects are provided in the VIRAC2333The VIRAC2 PMs, though calibrated using the Gaia second data release, are preliminary. The final absolute calibration, based on the Gaia “eDR3” reference frame, is still in progress but any changes are expected to be very small. catalogue, which were used to break the ambiguity between the near and far kinematic distance solutions. The PM-based probability density function for distance is calculated by a Monte-Carlo method built on the Python platform, using one of two models of the Milky Way disc rotation and the peculiar velocity dispersion, adopted for YSOs and non-YSOs treated as Galactic “thin disc” stars respectively (the latter drawing on Bensby et al., 2013). For a given PM measurement, a distance solution is computed by randomly sampling from the peculiar velocity distribution and the PM error distribution using Gaussian errors.444The approach is an evolution of that of Smith et al. (2018). Details of the adopted rotation curves and peculiar velocity distributions used for YSOs and thin disc stars in the sample will be given in a separate paper (C. Morris et al., in prep). A relatively broad peculiar velocity spread (20 km s-1 in the U and V components) is used for YSOs in order to allow for uncertainties in the rotation curve, i.e. folding the two effects into a single parameter.. The probability histogram is then generated by binning 1 million samples for each star. Kinematic distances with consistent with the sometimes rather wide range of distances allowed by the PM-based distance solutions are marked by the symbol in Table LABEL:tab:lines. Several targets lack consistent and PM distance solutions, which could be due to underestimated errors in the PM measurements for faint objects, large orbital motions in binary systems, intrinsic blue-shifts of expanding CO shells around Asymptotic Giant Branch (AGB) stars, or a Galactic halo location.
2.6 Light curve Analysis
The 2010–2015 light curves of 21 targets with the “v” prefix were previously published in Paper I, based on aperture photometry. In this work, we present a new set of VVV/VIRAC2 light curves for all 61 targets in the combined sample (see online supplementary information, examples are shown in Table LABEL:tab:lc_example). The light curves, contain profile fitting photometry from 2010 to 2019. The profile fitting photometry was carried out with DoPHOT (Schechter et al., 1993; Alonso-García et al., 2012). The absolute photometric calibration of the VIRAC2 catalogue is based on a new procedure designed to mitigate issues pointed out by (Hajdu et al., 2020) that arise from blending of multiple VVV sources in 2MASS data for very crowded star fields in the inner Galactic bulge.
We applied the value, an output of DoPHOT, from the VIRAC2 catalogue as a selection criteria in order to remove less reliable data points. Detections with value are excluded from the final light curves. As a second step, the relation between magnitudes and photometric errors () is fitted by a 3rd order polynomial function derived from all sources in this work. All sources share the same vs. relationship. Detections with deviating from this relationship by more than 3 are rejected from the final light curves. The typical photometric error is 0.020 mag at mag and 0.069 mag at mag. In the final light curves (shown in Figure 7 and 8) the data are averaged in 1 day bins because this work focuses on longer-term variability rather than intra-night changes. Even though the error reported by DoPHOT is small, the magnitudes above 11.25 mag, could suffer from a not completely linear response from the detector.
The photometric period of individual object is measured using the generalised Lomb-Scargle periodogram in IDL (Zechmeister & Kürster, 2009). More details are shown in §3.3. The variation timescale () is defined as follows. For periodic variables, is the photometric period (see Table 1). For other YSOs, is the time difference between two photometric minima for sources with eruptive light curves and the time between maxima for “dippers”. For objects with ongoing outbursts and decays, we indicate in Table 1 that is a lower limit. The nature of photometric variations are summarised in Table 1.
3 Results
In this section, we will present the spectral features of our targets, period analysis, and classifications of variables based on both spectroscopic and photometric information.
3.1 Spectroscopic features of accretion modes of YSOs
The spectroscopic features of YSOs are shaped by mass accretion process (Hartmann & Kenyon, 1996; Hartmann et al., 2016). In general, there are two types of accretion natures in YSOs which are distinguishable by certain spectral features. Magnetospheric accretion and boundary layer accretion were introduced in §3.1 of Paper III and references therein. Here we briefly summarise the spectral features of these two accretion scenarios.
Magnetospheric accretion is widely observed on disc-bearing YSOs. Emission features are generated around the accretion shock on the stellar surface, such as Hi recombination lines (e.g. Pa and Br) and Ca ii triplet (8498, 8542, and, 8662 Å). Emission fluxes of Ca ii and Hi recombination lines have tight empirical correlations with the mass accretion rate (Muzerolle et al., 1998; Alcalá et al., 2014). Originating from the chromosphere and the disc, the Nai emission doublet at 2.206 m is closely correlated with Br emission (Paper III). Recent near-infrared surveys found CO overtone emission bands, although excited in the inner gaseous disc, have a positive correlation with Br emission on both non-eruptive (Connelley & Greene, 2010) and eruptive YSOs (Kóspál et al., 2011b, and Paper III), indicating that CO emission is associated with a high rate of magnetospheric accretion, perhaps due to irradiation by hot spots on the star arising from the accretion columns (Hodapp et al., 2020).
Boundary layer accretion, mostly seen in FUors, shows strong H2O and CO absorption bands arising in cool upper layers of its self-luminous accretion disc (see review by Audard et al., 2014). In Paper III, we found stronger CO absorption is associated with a brighter near-infrared continuum which is consistent with the physical expectation that the disc’s vertical temperature gradient is steeper when the accretion rate is higher and more energy is being released in the disc’s mid-plane. Weak photospheric CO absorption features are seen in YSOs and they are associated with other absorption lines (e.g. Nai and Cai) (Johns-Krull & Valenti, 2001, and Paper II). In addition, strong CO absorption is also observed in the photosphere of very low mass YSOs (e.g. Lucas et al., 2001; Allers et al., 2007; Jose et al., 2020), which are much less luminous than FUor outbursts and hence should be much less distant. Leaving aside these cases of photospheric absorption, the strong CO overtone absorption in a distant eruptive YSO is an efficient indicator of boundary layer accretion process. For the following results and discussions, YSOs are termed “FUor-like” when CO absorption features are detected.
The near-infrared emission lines are indicators of stellar winds and outflows (Chrysostomou et al., 2008; Greene et al., 2010). Although seen in non-variable sources like protoplanetary nebulae, H2 lines are recognised as signatures of YSOs. After inspecting samples of eruptive YSO spectra (Connelley & Reipurth, 2018, and Paper III), we found the strength of H2 emission lines is independent of variation in other spectral features. The absence of H2 emission in most FUors might be a veiling effect of the hot self-luminous disc (see discussions of v332 in §4.2.3 of Paper III) or rather the absence of collimated winds/jets during the FUor burst.
| Name | Br | Pa | Nai | H2∗ | CO | H2O | Spec Class |
| H2 emission only | |||||||
| Outflow dominated | |||||||
| v618 | - | - | - | E | - | - | Emission line |
| DR4_v15 | - | - | - | E | - | - | Emission line |
| DR4_v55 | - | - | - | E | - | - | Emission line |
| DR4_v67 | - | - | - | E | - | - | Emission line |
| DR4_v89 | - | - | - | E | - | - | Emission line |
| H2, Br, and/or CO bandhead emission | |||||||
| v14 | E | - | - | - | - | - | Emission line |
| v53 | E | - | E | - | E | Emission line | |
| v128 | E | - | - | E | - | A | Emission line |
| v181 | E | E | - | E | E | - | Emission line |
| v190 | E | - | E | E | E | - | Emission line |
| v309 | E | - | E | E | E | - | Emission line |
| v335 | E | E | E | E | E | - | Emission line |
| v376 | E | - | - | - | - | - | Emission line |
| v389 | E | - | - | E | - | - | Emission line |
| v467 | E | - | - | E | E | - | Emission line |
| v621 | E | - | - | - | ? | - | Emission line |
| v636 | E? | - | - | E | - | - | Emission line |
| v713 | E | E | - | E | - | - | Emission line |
| Stim1 | E | E | E | - | E | - | Emission line |
| Stim13 | E | - | - | E | - | - | Emission line |
| Stim5 | E | - | E | E | E | - | Emission line |
| DR4_v5 | E | - | - | E | E | - | Emission line |
| DR4_v10 | E | - | - | E | E | - | Emission line |
| DR4_v17 | E | - | - | E | E | - | Emission line |
| DR4_v18 | E | E | E | E | E | - | Emission line |
| DR4_v30 | E | E | - | - | E | - | Emission line |
| DR4_v34 | E | E | E | E | E | - | Emission line |
| DR4_v39 | - | - | - | E | E | - | Emission line |
| DR4_v42 | E | - | - | E | E | - | Emission line |
| DR4_v44 | E | E | E | - | E | - | Emission line |
| CO absorption | |||||||
| v16 | A | - | - | - | A | A | FUor-like |
| v237 | E | - | - | - | A | - | FUor-like |
| DR4_v20 | - | - | - | E | A | A | FUor-like |
| Post main sequence objects | |||||||
| v51 | - | - | - | - | A | A | AGB |
| v319 | E | - | - | - | A | - | Symbiotic |
| v370 | E | - | - | - | A | A | Symbiotic |
| v84 | E | - | E | E | - | - | Nova |
| v371 | E | - | - | - | - | - | Wolf-Rayet |
3.2 Spectroscopic classification
Here we identify non-YSOs in the sample and then sort the variable YSOs into two categories based their spectral features. YSOs with 12CO overtone absorption beyond 2.29 m are classified as “FUor-like” objects, and YSOs with emission features (e.g. H2, Br, Nai, or CO emission) are classified as “emission line spectra” YSOs. The spectral characteristics of our targets are summarised in Table LABEL:tab:sumlines.
3.2.1 Emission line YSOs
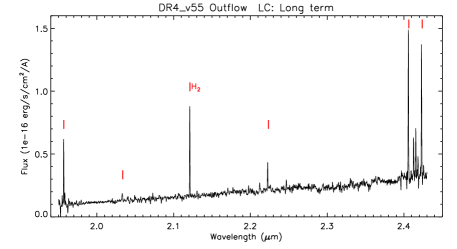
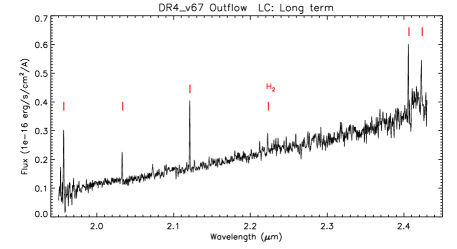
33 of the 38 new spectroscopic targets observed in this work are identified as YSOs. Br emission is clearly detected in 23 of them and there is a marginal detection () in one additional source, v237. Other indicators of magnetospheric accretion, including Pa emission, Nai emission and CO overtone emission, are only observed among objects with Br emission, with the exception of DR4_v39. H2 emission lines are seen in 24 YSOs. Following the classification methods introduced above, there are 30 YSOs classified as “emission line objects”. This category includes 24 YSOs with indicators of magnetospheric accretion and five YSOs with “outflow-dominated” spectra, these displaying only H2 emission, sometimes accompanied by [Feii] emission. One object (v621) has debatable spectral features as broad Br and He I emission lines, which are often observed on nova. However, the light curve of v621 had a quick rise and then stayed on a brightness plateau for at least 6.5 years, which has not seen among novae. Hence we still classify v621 as an eruptive YSO.
3.2.2 FUor-like YSOs
CO overtone absorption is observed in six of the new spectroscopic targets, three of which are identified as FUor-like YSOs. Two of the three YSOs also display water vapour absorption bands. When we include FUor-like VVV sources from Paper II, there are six YSOs with FUor-like spectra in the combined sample. These are v16, v237, DR4_v20, v322, v721 and v717. Of the three new FUor-like YSOs listed in Table LABEL:tab:sumlines, one (v237) has marginally detected Br emission, as noted above, one (v16) has marginally detected Br absorption and one (DR4_v20) has no Br detection but displays clear H2 emission lines. Due to the large photometric variability of the three and their large distances (see Table 1), there is no possibility of confusion between FUor-like YSOs and very young brown dwarfs having CO and water vapour absorption in the photosphere.
3.2.3 non-YSOs
Among the six new spectroscopic targets displaying 12CO overtone absorption, three also show the 12CO second overtone () absorption bands in the bandpass and/or strong 13CO () first overtone absorption. These three are then identified as AGB stars (v51, v319 and v370, §G). In the case of v51, since there were only two dips in the light curve, it may have a 2500 day period. However, the brightness is very different before and after the first dip so it may be aperiodic. The other two AGB stars have periods of a few hundred days, which are typical for Mira variables.
In addition, double-peaked and broad Br emission associated with Hei or Heii emission lines are detected in two sources. The spectrum of v371 is very similar to that of a Wolf-Rayet type star, with strong Heii emission lines blended with Br emission and broad Niii emission at 2.11 m (Mauerhan et al., 2009). We name v371 as WR80-1 following the up-to-date naming convention of massive stars (Rosslowe & Crowther, 2015)555http://pacrowther.staff.shef.ac.uk/WRcat. A 193 d quasi-period is found in the VVV light curve of this star. Although periodic variation is widely detected in Wolf-Rayet type stars, the 193 d period is longer than the timescale of wind-dominated variation (WR 1, 16.9 d; Chené & St-Louis, 2010) and is much shorter than the multi-year-long dust making process (Williams, 2019). We therefore suggest that v371 is perhaps in a binary system.
V84 has a blue SED () and the light curve shows a fading trend with mag in the first 600 d of the VVV survey. It remained at a low brightness level thereafter. Strong double-peaked Hei and Br emission lines are detected, suggesting a fast rotating envelope ( km s-1). Both photometric and spectroscopic features of v84 are consistent with previously detected novae, such as v514 in Paper II, V1493 Aql (Venturini et al., 2004), and V2491 Cyg (Naik et al., 2009). Towards the end of the VVV VIRAC2 light curve, the brightness of v84 shows signs of rising again slightly. It might therefore be a recurrent nova, though significant photometric variations are also seen in classical novae long after the outburst.
3.2.4 The combined sample
Including sources from Paper II, 75 high-amplitude VVV variable stars have near-infrared spectra. Following the spectroscopic classification above, 61 sources are confirmed as YSOs: 6 FUor-like objects and 55 objects emission line objects. Of the 55 emission line objects, 46 YSOs have signatures of magnetospheric accretion, including 45 having HI recombination line emission and one source (DR4_v39) lacking this feature but having CO overtone emission. The remaining eight emission line YSOs have outflow-dominated spectra so their accretion modes are not yet determined. According to the spectral indices calculated in §2.1 and Paper II, about 2/3 of these spectroscopically confirmed YSOs are Class I objects (40/61), some of them are flat-spectrum objects (17/61), and 4 of them are Class II objects.
| Name | Period (d) | Period (d) | Class | ||
|---|---|---|---|---|---|
| this work | Paper I | (mag) | (mag) | ||
| YSOs from this work: | |||||
| v14 | 397 | 124 | 1.64 | 0.21 | Q |
| v190 | 611 | 125 | 1.44 | 0.22 | Q |
| v467a | 1840 | - | 2.64 | 0.24 | P |
| v636 | 565 | 609 | 1.43 | 0.21 | Q |
| DR4_v17 | 1154 | - | 3.03 | 0.12 | P |
| DR4_v55 | 953 | - | 3.59 | 0.34 | P |
| v181b | 184 | - | 3.49 | 0.55 | Q |
| v309b | 181 | 191 | 2.60 | 0.43 | Q |
| YSOs from Paper II: | |||||
| v32 | 1439 | - | 1.80 | 0.18 | P |
| v65 | 30.2 | 30 | 0.98 | 0.21 | Q |
| v94 | 436 | - | 1.27 | 0.24 | Q |
| v480 | 306 | 303 | 1.51 | 0.24 | Q |
| v630 | 409 | - | 1.57 | 0.31 | Q |
| Post main sequence objects: | |||||
| v319 | 307 | - | 0.86 | 0.07 | P |
| v370 | 419 | 445 | 0.94 | 0.11 | Q |
| v371 | 193 | 186 | 2.09 | 0.28 | Q |
3.3 Periodic or Quasi-periodic variables
Most periodic variations on YSOs are associated with stellar or disc rotation. For instance, star spots on Class II/III objects have sinusoidal variation on timescales from days to weeks (e.g. Rebull et al., 2018; Guo et al., 2018b). Periodic extinction by asymmetric inner disc structures are mostly seen on Class II objects on timescales from one week to months (e.g. Bouvier et al., 2007). Although most episodic accretion bursts (FUor- and EXor-type) are unpredictable in Class 0/I objects, three YSOs in the literature display periodic variability attributed to a large and periodic change in the accretion rate. Periodic accretion events seen in the Class I YSOs LRLL 54361 (25 d, Muzerolle et al., 2013) and V347 Aur (160 d, Dahm & Hillenbrand, 2020) are presumably triggered by undetected stellar companions. A 530 d periodic accretion flare is observed on the Class 0 object EC53 (V371 Ser) by both near-infrared and millimetre surveys (Hodapp et al., 2012; Lee et al., 2020), which is interpreted as a consequence of piled-up material in the inner disc.
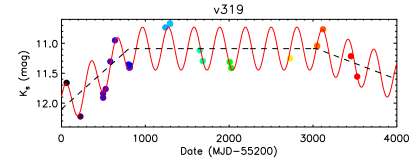
Periodic VVV variables were identified in Paper I from 2010 – 2015 light curves by phase dispersion minimisation (PDM) method. In this work, we applied generalised Lomb-Scargle periodogram (Zechmeister & Kürster, 2009) to VIRAC2 version light curves of spectroscopic followed up variables in this work and spectroscopic confirmed YSOs from Paper II. Light curve data are averaged in 1 day bins to avoid the over-sampling issue. The fitting period is constrained to be in the range of 10 to 2000 days, based on the cadence of the light curves and the duration of the VVV survey. The best-fit period is identified by the highest peak in the periodogram. Two particular targets, v319 and DR4_v17 have light curves that are combinations of long term ( days) trends and periodic variations. Hence, their power spectra were generated after fitting and removing the long term trends (see Figure 2). Finally, we visually inspected the phase-folded light curves to confirm the periods.
In total, 16 objects have periods in their light curves ranging from 30 to 1840 days. All measured periods passed the 1% false alarm possibility test (method from Guo et al., 2018a). The residual to the fit in the phase-folded light curves is used to categorise these objects as periodic or quasi-periodic. The phase-folded light curves are fitted with the following analytic functions (for the purpose of this categorisation only): Gaussian, polynomial burst, and sinusoidal curves, examples of which are given in Figure 9. Objects are defined as periodic if the standard deviation of the fitting residual is smaller than 10% of the amplitude in . Under this definition, five objects are identified as periodic variables and 11 objects as quasi-periodic variables (listed in Table LABEL:tab:periods). The longest period is seen on v467 ( d), which shows two dips in the unfolded light curve. The periodicity of this source is yet to be confirmed as only two full periods were observed within the VVV survey.
Two quasi-periodic variables have periods around 180 days, which are suspicious as they might be false periods introduced by the observational cadence (i.e. one to three epochs close together in each year from 2016–2019). Both of them have large fitting residuals ( mag). In particular, the unfolded light curve of v181 is a combination of of a sharp dip ( d) and a gradual long-term variation. It is possible that the observed light curve features arise from a poorly sampled periodic variation, but the evidence is fairly weak. In this case, the 184 day period on v181 is highly doubtful so list it as “eruptive” rather than “LPV-YSO” in Table 1.
Eight YSOs have periods detected by the PDM method in Paper I, including six with similar periods in the two works. Two objects have longer periods measured in this work than the results from Paper I. The period of v14 measured in Paper I corresponds to the second highest peak in the periodogram generated in this work. Among the other eight objects without periods in Paper I, DR4_v17 and DR4_v55 are new sources first studied in this work, v32 and v467 have periods longer than 1000 days, and the rest were classified as aperiodic in Paper I.
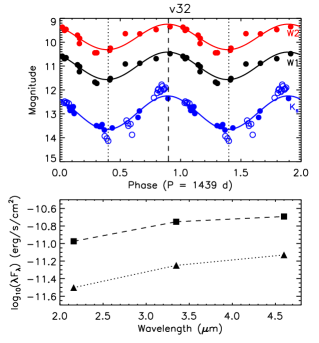
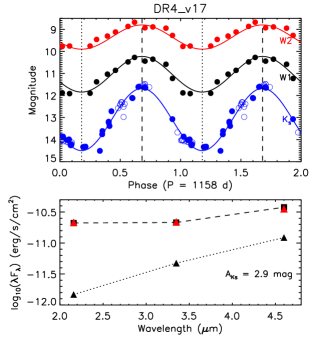
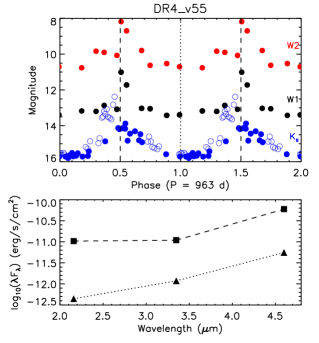
Based on the spectroscopic features, 13 periodic or quasi-periodic variables are identified as YSOs, and all of them are emission line YSOs. In the following section, we will discuss the near-to-mid infrared amplitude of long-term periodic YSOs (v32, DR4_v17, and DR4_v55), in order to identify periodic accretion bursts. Separately, one periodic and two quasi-periodic objects are identified as post-main-sequence stars: two AGB stars (see §G) and a Wolf-Rayet star.
4 Discussion
4.1 Near-infrared colour variation
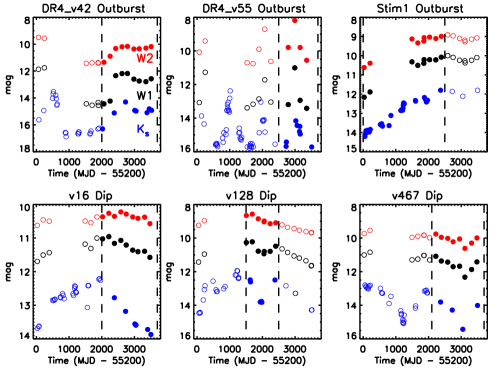
The variation mechanisms of eruptive objects can be revealed by infrared colour changes. For example, the optical to near-infrared SEDs of most optically bright EXors during the outbursts are well fitted by additional thermal emission from the accretion disc (e.g. Lorenzetti et al., 2012). In other cases, wavelength-dependent flux changes can be used to infer the radial progression of an outburst through the disc, e.g. inward in the case of the recent FUor Gaia 17bpi (Hillenbrand et al., 2018) or outward in the case of WISE 1422-6115 (Lucas et al., 2020). In this section, we use WISE (3.4 m) and (4.6 m) time series photometry from the IRSA archive666A few targets lack WISE data in the AllWISE and NEOWISE catalogs due to blending. The and light curves of v14, v621, DR4_v15, DR4_v20 and DR4_v89 were extracted from the time series of unWISE image stacks (unWISE, Lang, 2014; Meisner et al., 2018) by running the Crowdsource crowded field photometry pipeline in an efficient forced photometry mode (Schlafly et al., 2019), using the coordinates given in the deep unWISE catalogues available at https://catalog.unwise.me/ which were derived from running Crowdsource on the five-year unWISE image stacks (Meisner et al., 2019)., taken from the AllWISE MultiEpoch Photometry Table for 2010 (Wright et al., 2010) and the ongoing NEOWISE Reactivation database from late 2013 onward (Mainzer et al., 2014). There was a 3.5 year gap between the AllWISE and NEOWISE data. The cadence of the WISE light curves is about 180 days (after averaging of the several scans taken over a period of a few days at each epoch). A few examples of the multi-band light curves are shown in Figure 3.
Here we measure the VVV () and WISE () variations in portions of the light curves of the variable YSOs in our sample, to attempt to distinguish between accretion-driven and extinction-driven changes on timescales from one to nine years. From the sample of 61 spectroscopically confirmed YSOs from Paper II and this work, 34 have -band light curves with long-term photometric variations, including 5 FUor-like objects. This sample excludes multiple time scale variables and periodic variables with days, to avoid sampling issues of low cadence VVV and WISE light curves. Almost all of these 34 YSOs are thought to be eruptive variables undergoing episodic accretion. In a few cases this is not proven, e.g. four (v406, DR4_v15, DR4_v55 and DR4_v67) were classified as having outflow-dominated spectra, though the absence of accretion signatures can be attributed to observation during quiescence in some cases. One additional source DR4_v5 is classified as a Dipper in Table 1 but the spectrum shows clear signatures of a high accretion rate. The , , and light curves of the 34 YSOs are visually inspected and sorted into subgroups where an outburst or a dip can be identified in a certain time window. Examples are shown in Figure 3. These outbursts or dips are sometimes relatively brief or low in amplitude in comparison to the total variation and the nine year light curve duration. Eruptive YSOs are known to have photometric variations due to extinction as well as episodic accretion, e.g. V1515 Cyg and VSX J205126.1+440523 (Clarke et al., 2005; Kóspál et al., 2011a), so it is not surprising to observe dips within the light curves of eruptive YSOs that could be due to changing extinction.
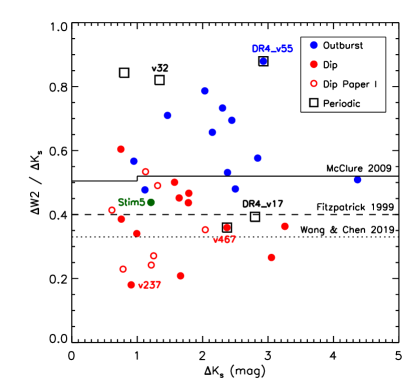
YSOs without suitable dips or outbursts sampled by the WISE and VVV data are excluded from Figure 3. Periodic variables with sinusoidal light curves are labelled as such since the variation could be equally well regarded as a dip or a burst in many cases. We chose the ratio between - and amplitudes, instead of between and , to distinguish accretion and extinction driven variations. The wide wavelength range between the and bandpasses provides sufficient amplitude differences to measure changing line-of-sight extinction, according to the near- to mid-infrared extinction laws (e.g. Fitzpatrick, 1999; McClure, 2009). In Figure 3, we show the measured and for individual dips and outbursts within the time range of the WISE data. and are defined within the window of each dip or burst as appropriate. While the VVV and WISE measurements are not contemporaneous, the amplitude of these multi-year dips and outbursts is captured fairly well by the data. We therefore have confidence in the overall trends revealed by these metrics even though individual stars are uncertain. In addition, the / ratio of seven dippers from Paper I are also shown in Figure 3. These objects are yet to be confirmed as YSOs by spectroscopic follow-up.
All of the 35 sources plotted in Figure 3 have a bluer-when brighter, redder-when-fainter behaviour in the colour. This behaviour of the infrared colours is typical of the of optically bright EXors where an outburst takes place in the inner disc, causing it to become hotter and bluer (Lorenzetti et al., 2012). However, Figure 3 shows that dips and outbursts typically have different ratios. Dippers have smaller ratios, ranging between 0.18 to 0.50. Several dips with very low ratios can be explained by a source of obscuration that hides the near-infrared emitting-region of the disc more than the mid-infrared emitting region. Similar obscuration behaviour were recently observed on a Class II object AA Tau, in which the mid-infrared variation is anti correlated with optical variation (Covey et al., 2021). By contrast, the of most outbursts are larger than 0.4. The boundary between two morphologies, , is consistent with the infrared extinction laws (e.g. Fitzpatrick, 1999; McClure, 2009; Wang & Chen, 2019). Although some overlap is seen around the boundary, distinct distributions of the ratio are seen for dips and outbursts, which can be attributed to changes in extinction and accretion rate, respectively.
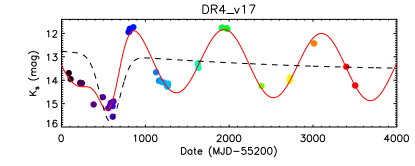
Since the VVV and WISE light curves were not obtained simultaneously, the measurement of for individual YSOs is imprecise, especially for variables with low amplitude or strong variation on a short timescale. However, colour variations of periodic variables having long periods are more precisely measured in the phase-folded light curves. Figure 4 presents phase-folded multi-band light curves of v32, DR4_v17, and DR4_v55 with their SEDs at photometric minima and maxima measured within the time coverage of the WISE light curves. All three objects have emission line spectra, though the CO overtone emission and Br emission are relatively weak (or absent in the case of DR4_v55, which shows H2 emission only). In each case the spectra were taken in the faint part of the cycle. For DR4_v17, the SED measured at photometric maximum is well reconstructed by applying a de-reddening function to the data taken at the minimum ( mag, , Fitzpatrick 1999). By contrast, DR4_v55 and v32 have similar amplitudes in and in , indicating their variations are likely linked to accretion bursts modulated by periodic perturbations. For these variable YSOs with periods around 1000 days, the corresponding Keplerian orbital radius is around 2 au for a solar mass star777 au.
The study in this section provides a statistical view of the infrared colour variation of YSOs with variability on long timescales. Most dippers have greater infrared colour variation, , than accretion dominated eruptive YSOs, which is in line with the infrared dust extinction law (). A few YSOs in this work have both variable line-of-sight extinction and variable mass accretion process, so that ratios is time dependent. For example, Stim5 (green dot in Figure 3) began an outburst in 2010 that was ongoing throughout the nine year light curve, with . It is therefore classified as an eruptive YSO. However, between 2017 and 2019 there was a dip with . Multi-epoch spectroscopy provides a more reliable interpretation of the variable mechanism: we discuss the variability of Stim5 in §F.
4.2 Variation timescales of eruptive YSOs
We now consider the timescale of accretion-driven outbursts broken down into the different spectroscopic and light curve categories, in order to gain insight into the physical mechanisms causing these events. As mentioned earlier, the timescale refers to the total duration of an outburst from the start of the event until the return to quiescence, or to the period in the case of the periodic systems. Later in this section we also discuss the rise-times of the longer duration events. Classical FUor and EXor outbursts have quite distinct duration. Most optical EXor outbursts in the literature lasted less than 1000 days (Herbig, 1989), while the three classical FUors have remained in outburst for several decades (Hartmann & Kenyon, 1996). In Paper II, the “MNor” category was tentatively proposed for YSO outbursts of intermediate duration.
Individual objects are placed in the following categories based on their spectra and their light curves.
-
•
YSOs with FUor-like spectra
-
•
Eruptive YSOs with emission line spectra
-
•
Multiple timescale YSOs with emission line spectra
-
•
YSOs with outflow-dominated emission line spectra
-
•
Periodic or quasi-periodic YSOs with emission line spectra
For the first three of categories in the list, there is good spectroscopic evidence for accretion-driven outbursts, either from a FUor-like spectrum or from signatures of magnetospheric accretion. The outflow-dominated systems are less clear-cut: stars in this category show strong H2 emission and sometimes [Feii] emission but lack spectral signatures of magnetospheric accretion or boundary layer accretion. The effect of geometry might play a role on these “bona-fide outbursts”. In a nearly edge-on system, the emission from the inner disc is heavily obscured while the emission lines from a jet can dominate the infrared spectrum. The measured line-of-sight extinction of these objects is discussed in §4.3 and Appendix E. The timing of the spectroscopy also matters. The three YSOs (DR4_v15, DR4_v55, and DR4_v67) show a long term outburst in their light curves but have outflow-dominated spectra that were taken during the quiescent state. In Figure 5 we exclude YSOs that only have dips in light curves attributed to changing extinction, including the periodic variables v467 and DR4_17, see §4.1. Other periodic variables are retained, some of which have clear evidence for accretion-driven variability. The categories of individual YSOs are shown in Table LABEL:tab:lum.
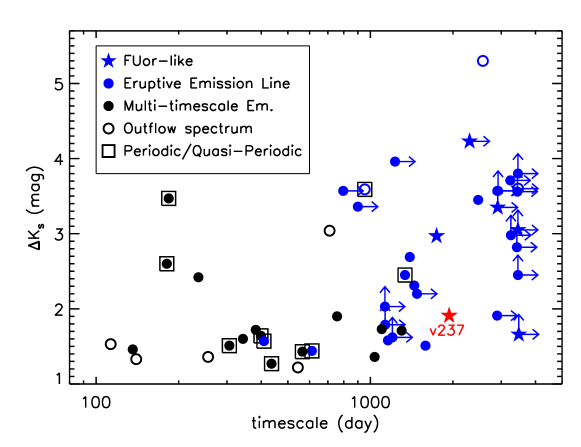
The duration and values of 52 variable YSOs are presented in Figure 5. Two variable stars with timescales around 30 days are not presented (v65 and DR4_v30). The key results are: (i) all six of the FUor-like YSOs have timescales 1900 days but (ii) there is no clear separation between them and the emission line objects in duration or amplitude. In fact, the majority of long duration outbursts show emission line spectra.
The multi-year-long photometric variations in the FUor-like YSO v237 (marked by red star in Figure 5) are due to variable line-of-sight extinction rather than changes in accretion rate. Similar variations have been observed in well-studied FUors such as V1515 Cyg (Clarke et al., 2005). Ongoing accretion bursts are seen in two FUor-like YSOs (v721 and DR4_v20) with mag and d. Both the amplitude and duration of these two FUor-like YSOs are lower limits since their light curves began to rise before the VVV survey started in 2010.
As the only FUor-like YSO where the entire outburst was captured in this work, v322 (see §4.2.2 in Paper III) exhibited a fast outburst (2.4 mag in 200 d) followed by a rapid initial decay at a rate of 1.56 mag yr-1 that then slowed down. The rapid initial decay of v322 is rarely seen among FUor-like YSOs and is comparable to some EXors. One previously discovered “FUor-like” Class 0 object V371 Ser (also known as EC 53) has similar low amplitude and multi-year photometric behavior to v322, and it also has emission lines like v322 (Hodapp et al., 2012; Connelley & Reipurth, 2018; Lee et al., 2020).
To investigate the pre-outburst brightness of eruptive objects, we gathered the 2MASS photometry (Skrutskie et al., 2006) from the IRSA online server. The results of individual sources are presented in Appendix D.
4.2.1 MTVs
MTVs were defined in Paper III to have significant variability on short timescales ( d) as well as large inter-year variability. In this work, the MTVs are found to be YSOs with similar variation on inter-year and intra-year timescales, and lack of a strong longer term decline or outburst in their VVV light curves. In some cases (e.g. DR4_v30, v181), there are long term trends in the light curves but their amplitude is smaller than the inter-year variation. Many photometric variations of MTVs are only partially captured by the VVV/VVVX light curves due to their sparse sampling. Hence, the variation amplitudes and timescales of MTVs are highly uncertain. In Figure 5 we see that most MTVs (except v181) have relatively short timescales for their inter-year variations, consistent with the above definition, and the amplitudes are lower than is seen in most of the longer-timescale variables.
Among 20 MTVs, five have outflow-dominated spectra, a higher proportion than that found among longer timescale emission line YSOs (2/30). It is not a very surprising result because MTVs lack of major outbursts which lead to emission features like Br and CO band heads. The variable nature of outflow-dominated sources are likely linked to inner disc structures, either resulting from unstable mass accretion or variable line-of-sight extinction. Six MTVs have quasi-periodic variations. The spectral indices of MTVs are similar to longer timescale variables, as -0.37 1.30. Most of these MTVs are listed as “eruptive candidates” in Table LABEL:tab:lum as no major (long term) eruptive event were observed.
4.3 Extinction and luminosity measurements
In this work, the line-of-sight extinctions () of YSOs are measured by two methods, either by their locations on the near-infrared colour-colour diagram or by the flux ratio between 1-0 Q(3) (2.42 m) and 1-0 S(1) (2.12 m) lines, where possible. The details of two measurement methods and further discussions are presented in Appendix E. The measured from both methods are listed in Table LABEL:tab:lum. One should notice that the measured is the integrated extinction along the line-of-sight to the star, including interstellar extinction between the sun to the star forming region, the extinction within the molecular cloud and the circumstellar extinction.
Nine YSOs in the sample have outflow-dominated spectra. The value is measured for all nine YSOs, mostly by the flux ratio, five of the nine have intermediate extinction, and four have ranging from 2.20 to 3.79 mag, significantly higher than the extinction found in other emission line objects measured by both methods. We infer that in erupting systems where Br and CO overtone emission are not seen, this is sometimes due to heavy obscuration of the inner regions of the system. This suggests that high disc inclination is playing a role (i.e. close to edge-on orientation). Evolutionary stage may also be a factor but the spectral indices of the four highly extinguished outflow-dominated sources span a wide range ( = 0.11, 0.33, 1.56 for DR4_v89, DR4_v15 and DR4_v55, respectively, whilst v473 lacks a detection).
The in-outburst infrared luminosity () and the rise in luminosity from the quiescent state () of eruptive YSOs are measured using the extinction-corrected m SED. The extinction correction is conducted based on the value measured above, in which the line ratio method is preferred, and the empirical near-to-mid infrared extinction law is from McClure (2009). For preference, the distances used in the calculation are radial-velocity-based kinematic distances (, listed in Table LABEL:tab:lines) and the distance ambiguity is broken using the VIRAC2 proper motions, see 2.5. Where is unavailable, we use the distance to the star forming region () given in Table 1 or the distance determined in Paper II 888We exclude v621 from this measurement due to its unknown distance. The value, based on the Br line, disagrees with the PM solution. No distance has been published for the star forming region.. To measure the quiescent luminosity we use the and to magnitudes from VVV and ALLWISE, these data being taken in 2010 when the sources were in a faint state. To calculate the in-outburst luminosity, , we use the , , and magnitudes measured in the bright state. The mid-infrared luminosity increased during outburst can be affected by many mechanisms (MacFarlane et al., 2019) so we estimate the in-outburst and magnitudes by assuming that the - and - colours measured in the ALLWISE survey remain constant whilst the flux increases. Luminosity is not calculated for YSOs lacking and detections in ALLWISE, such as the FUor-like source v322. This leaves us with values for five FUor-like YSOs. In a few systems the luminosity is a lower limit because the extinction value, , is a lower limit. These luminosity calculations are obviously uncertain but they allow us to make comparisons between FUor-like YSOs and emission line YSOs in the sample and eruptive YSOs in the literature.
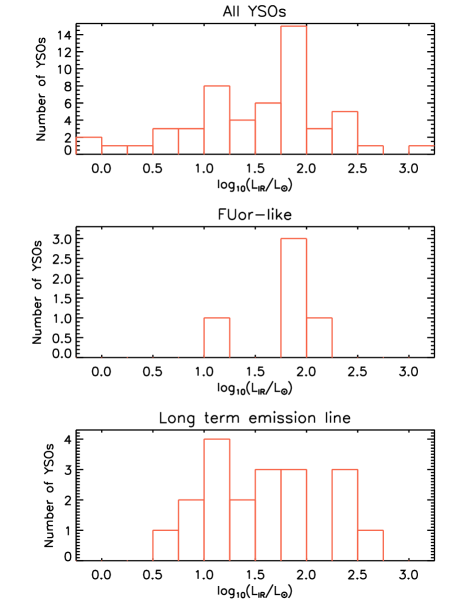
The distribution of of FUor-like objects and eruptive YSOs with emission line spectra are presented in Figure 6. In our sample, FUor-like objects have ranging from 10 to 143 L⊙, which is similar to previously identified FUors (e.g. Connelley & Reipurth, 2018). Long-term eruptive emission line YSOs have a similar range of luminosities to the FUor-like YSOs. In many sources the quiescent luminosity is not measured, e.g. if the source was in outburst in 2010. However, the rise in luminosity, , is approximately equal to , the in-outburst luminosity, where this is measured. is therefore a rough estimate of the accretion luminosity during the bright state, in the measured wavelength range 999In Paper II, the accretion luminosity of emission line YSOs was estimated using , which was strongly model-dependent and could be heavily biased by the veiling effect from the continuum..
In long term magnetospheric accretion controlled outbursts, is typically to L⊙. This is a little higher than many previously discovered EXors in nearby star forming regions, such as EX Lupi (Aspin et al., 2010) and others (Lorenzetti et al., 2012). This is likely to be a selection effect, owing to the larger distances to the YSOs presented here. Our results indicate that accretion rates are typically of the same order for the boundary layer mode and the magnetospheric mode in embedded Class I YSOs. This contrasts with nearby optically visible systems where EXors typically have lower luminosities and accretion rates than FUors. The measured extinctions, luminosities and classifications of the 61 spectroscopically confirmed YSOs are listed in Table LABEL:tab:lum.
4.4 Classification
In this section, we refine the classification of eruptive YSOs based on their photometric and spectroscopic features. In Paper II, “MNor” was defined as a tentative subgroup of eruptive YSOs. “MNors” have mixed characteristics of classical EXors and classical FUors, and with Class I or flat-spectrum SEDs. In terms of outburst duration (often intermediate, i.e. 1–5 yr) or spectral features (emission or absorption), “MNors” are opposite to those expected from the outburst timescale. Under this definition, “MNor” contains both emission line YSOs having outbursts longer than typical “EXors” and FUor-like objects without decades-long photometric eruptions. Among eruptive YSOs in the VVV survey, we found that “MNors” are more common than either “FUors” or “EXors” among eruptive YSOs with a large variety of duration and amplitude. The term is therefore not especially useful, except to highlight that the FUor/EXor categories defined for optically bright systems cannot encompass what is seen in embedded systems. Hence, in this work, eruptive YSOs are sorted by accretion mode and light curve properties instead of traditional categories. The category of FUors is fairly well defined by their unique spectral features, long duration and the outburst luminosity, whilst there are some differences in the rise time of individual objects. On the other hand, we favour “emission line objects” to “EXors” owing to the wide range in duration of eruptive events controlled by the magnetospheric accretion mode. The final classification is presented in Table LABEL:tab:lum.
Among the 16 variables with the longest duration ( d) in our sample, nine have indicators of the magnetospheric accretion process and two are dominated by outflows. We considered whether this result might be affected by disc orientation. Discs viewed close to face-on (i.e. at small inclinations) are more likely to display emission line features arising in the innermost disc and in magnetospheric accretion columns, whereas these can be hidden from view at high inclinations. We do not see significantly lower extinction in emission line objects than FUor-like sources, which indicates that our result is not strongly biased by the disc orientation (see §E). We conclude that magnetospheric accretion can be maintained during long-duration outbursts and that this is more common than boundary layer accretion in Class I YSOs.
Both slow-rising and fast-rising outbursts were observed among emission line objects. Slow-rising eruptive YSOs (e.g. Stim1 and DR4_v15) are possibly triggered by thermal-instability where the instability is formed at the inner disc without a dynamical perturbation and then propagates inside-out (Lin et al., 1985; Bell & Lin, 1994). On the other hand, outbursts with fast eruptive nature (e.g. v621 and DR4_v34), could be consequences of disc fragments being accreted onto the protostar (e.g. Vorobyov & Basu, 2006).
4.5 AGB stars and symbiotic systems: v51, v319 and v370
In this work, we identified three AGB stars via the 12CO and 13CO absorption bands. Notably, two AGB stars, v319 and v370, exhibit both Br emission and CO absorption. In addition, the WISE - colours of these two stars are bluer than solitary AGB stars. We hereby identify v319 and v370 as D-type symbiotic stars (e.g. Kenyon & Webbink, 1984; Corradi et al., 2008). More detailed description of these three AGB stars are provided in Appendix G.
5 Summary and Conclusions
In this work, we report results of spectroscopic follow-up for 38 high amplitude variable stars ( mag) discovered in the VVV survey, including 33 that are spectroscopically confirmed as YSOs. We add them to the sample of 28 confirmed YSOs from Paper II for a combined sample of 61 highly variable YSOs. Based on spectral index, 56 of them are Class I and flat-spectrum objects. We publish the VIRAC2 version of the VVV light curves from 2010 to 2019 for all 61 VVV YSOs (available in the online supplemental material, examples in Table LABEL:tab:lc_example). The sample includes some YSOs with long duration outbursts (typically 2–4 mag amplitude), some with periodic variability, some MTVs and some with extinction-dominated variability. There are also a few post-main-sequence variable stars.
Our main findings are as follows.
-
•
Spectroscopically, the 61 variable YSOs are sorted as 55 emission line YSOs and 6 FUor-like objects. Among emission line YSOs, 46 sources display emission features linked to the magnetospheric accretion process (Pa or Br) usually accompanied by CO overtone emission and sometimes Na i emission. The remaining nine emission line sources show only lines associated with a molecular outflow or disc wind ( or [Fe II]). The FUor-like objects have 12CO overtone absorption bands and water absorption in the and bandpasses, associated with the boundary layer accretion process.
-
•
The dominant timescales of variability seen in the YSO sample range from months to a decade for different sources. FUor-like spectra are only seen during outburst events with duration 5 yr.
-
•
Signatures of magnetospheric accretion were observed among most eruptive YSOs with long duration outbursts. Therefore, the stellar magnetic field is still in control during these outbursts, which have similar infrared amplitudes and luminosities to the FUor-like sources. This contrasts with past results for long duration optically selected events, where FUor-like spectra are almost always seen (e.g. Audard et al., 2014). There is no clear difference in the measured extinction for the two spectral categories, indicating that the spectral classification is not driven primarily by the disc inclination angle and veiling.
-
•
Similar in-outburst luminosities were seen among emission line and FUor-like eruptive YSOs which suggests that they may have similar accretion rates.
-
•
Periodic accretors comprise a significant minority amongst eruptive protostars. Using the Lomb-Scargle method, photometric periods are detected in several emission line YSOs, though three or four of these require more data to confirm or disprove the periodic behaviour. For the four longest period systems ( 950 d), two systems are periodic accretors and two systems as cases of periodic extinction identified by the colour ratio. While a determination could not be made for the other nine quasi-periodic YSOs. The finding of periodic accretors suggests that an orbiting companion or star-disc interactions are be able to modify the mass accretion rate. At present, the two cyclically accreting YSOs, v32 and DR4_v55, only have spectra taken in the quiescent state, where relatively weak CO overtone and Br emission features were observed comparing to other eruptive spectra taken in outburst. Multiple epochs of spectroscopy and multi-wavelength photometry will be needed to study the cyclical accretion and to distinguish between accretion and extinction in the other periodic systems.
-
•
MTVs have relatively short duration outbursts (–3 yr). First noted in Paper III as YSOs that vary strongly on timescales of weeks and years, these systems show repeated bursts or dips and they have typical amplitudes below 2 mag in . The rapid component of the variability is likely linked to an unstable accretion process, star-disc interactions or inner disc structures causing variable extinction. By contrast, frequent intra-year high amplitude variations are not often seen among long-term eruptive YSOs.
-
•
Variable line-of-sight extinction contributes to the photometric variation in a few sources. Such changes are sometimes seen on the “bright plateau” in the light curve of eruptive YSOs (e.g. Stim5). The extinction dips are recognised by light curve morphologies and are further identified by a smaller ratio than is seen in outbursts. As noted above, the long period variability in two of the emission line YSOs is extinction driven, presumably by asymmetric disc structures. The light curve of one FUor-like source, v237, is also dominated by extinction dips in the 2010–2019 time interval. The combined 2MASS and VVV light curve suggests that v237 has been in a high state of accretion for at least two decades.
-
•
In this work, five sources are identified as post-main-sequence stars. The quasi-periodic variable v371 is a newly discovered Wolf-Rayet star in a binary system, which is named as WR80-1 in accordance with the naming convention. Two AGB stars with periodic/quasi-periodic light curves are classified as D-type symbiotic stars with Br emission features arising from the accretion process of their companion stars.
| Name | Spectral Class | Final Classification | Distance | Timescale | ||||||
|---|---|---|---|---|---|---|---|---|---|---|
| kpc | (L⊙) | (L⊙) | mag | mag | day | mag | ||||
| v14 | Emission Line | Eruptive Candidate | 1.9a | 0.16 | -0.11 | 0.00 | - | 398 | 1.6 | 0.61 |
| v16 | FUor-like | FUor-like | 8.2a | 1.84 | 1.23 | 0.18 | - | 3476 | 1.7 | 0.07 |
| v20 | Emission Line | Eruptive with Magnetosphere | 2.5c | 1.97 | 1.65 | 1.40 | 1.71 | 1100 | 1.7 | 0.47 |
| v32 | Emission Line | Eruptive with Magnetosphere | 1.9a | 0.75 | 0.50 | 0.49 | - | 1337 | 2.5 | 0.08 |
| v53 | Emission Line | Eruptive Candidate | 13.9a | 2.19 | 1.99 | 0.00 | - | 236 | 2.4 | 0.61 |
| v63 | Emission Line | Eruptive Candidate | 3.5b | 0.74 | 0.36 | 0.89 | - | 136 | 1.5 | -0.24 |
| v65 | Emission Line | Eruptive Candidate | 3.5b | 1.08 | 0.80 | 1.00 | - | 30 | 1.4 | -0.27 |
| v94 | Emission Line | Eruptive with Magnetosphere | 3.5b | 1.56 | 1.29 | 0.00 | - | 436 | 1.3 | 0.17 |
| v118 | Emission Line | Eruptive Candidate | 2.2c | 0.91 | 0.88 | 0.19 | - | 50 | 3.5 | 0.12 |
| v128 | Emission Line | Eruptive with Magnetosphere | 2.6b | 1.30 | 1.06 | >1.00 | - | 1131 | 1.8 | 0.56 |
| v181 | Emission Line | Eruptive Candidate | - | - | - | 0.79 | - | 183 | 3.5 | 0.58 |
| v190 | Emission Line | Eruptive Candidate | 4.0a | 1.25 | 0.57 | 1.28 | 2.50 | 612 | 1.4 | -0.43 |
| v193 | Emission Line | Non-eruptive | 4.5a | 1.92 | 1.79 | >2.01 | - | 763 | 1.4 | 0.35 |
| v237 | FUor-like | Pre-VVV-eruptive? | 5.0a | 1.91 | 1.34 | >0.96 | - | 1943 | 1.9 | 0.88 |
| v270 | Emission Line | Eruptive with Magnetosphere | 4.6a | 1.79 | 1.61 | 1.55 | - | 3237 | 3.7 | 0.87 |
| v309 | Emission Line | Eruptive with Magnetosphere | 2.8a | 2.35 | 1.99 | >1.42 | 1.45 | 181 | 2.6 | 1.30 |
| v322 | FUor-like | FUor-like | 3.8a | - | - | 0.45 | - | 1743 | 3.0 | 0.82 |
| v335 | Emission Line | Non-eruptive | 4.2a | 1.86 | 1.51 | 0.71 | - | 1041 | 3.6 | 0.45 |
| v374 | Emission Line | Eruptive with Magnetosphere | 2.9b | 2.47 | 2.02 | 1.04 | - | 3254 | 3.0 | 0.56 |
| v376 | Emission Line | Eruptive with Magnetosphere | 1.2a | -0.04 | -0.37 | 0.90 | - | 1300 | 1.7 | -0.37 |
| v389 | Emission Line | Eruptive with Magnetosphere | 4.3a | 1.80 | 1.46 | >0.91 | - | 1036 | 1.4 | 0.68 |
| v405 | Emission Line | Non-eruptive | 2.3b | 1.85 | 1.64 | >0.15 | - | 733 | 2.2 | 1.10 |
| v406 | Outflow | Non-eruptive | 2.3b | 1.57 | 1.25 | 0.92 | - | 796 | 1.7 | 0.80 |
| v452 | Emission Line | Eruptive with Magnetosphere | 2.8c | 1.12 | 1.05 | 0.82 | - | 2472 | 3.5 | 0.21 |
| v467 | Emission Line | Non-eruptive (Periodic) | 9.0a | 1.86 | 1.58 | 0.98 | - | 1840 | 2.6 | -0.27 |
| v473 | Outflow | Outflow Dominated | 3.7b | 1.69 | 1.21 | - | 2.21 | 113 | 1.5 | 0.89 |
| v480 | Emission Line | Eruptive Candidate | 3.7b | 0.30 | -0.07 | 0.00 | - | 306 | 1.5 | -0.81 |
| v562 | Emission Line | Eruptive with Magnetosphere | 2.9b | 0.97 | 0.82 | 0.96 | - | 1392 | 2.7 | -0.02 |
| v618 | Outflow | Outflow Dominated | - | - | - | 0.77 | 1.29 | 140 | 1.3 | -0.09 |
| v621 | Emission Line | Eruptive with Magnetosphere | - | - | - | 1.26 | - | 2898 | 1.9 | -0.05 |
| v625 | Emission Line | Eruptive Candidate | 2.3b | 0.64 | 0.41 | >0.00 | - | 343 | 1.6 | 0.17 |
| v628 | Outflow | Outflow Dominated | 2.3a | - | - | 0.45 | - | 256 | 1.4 | -0.47 |
| v630 | Emission Line | Eruptive with Magnetosphere | 1.9a | - | - | 0.95 | - | 409 | 1.6 | 2.70 |
| v631 | Emission Line | Eruptive with Magnetosphere | 2.3b | 1.61 | 1.52 | 0.73 | - | 3422 | 2.8 | 0.62 |
| v632 | Emission Line | Eruptive Candidate | 2.5b | 1.32 | 0.84 | 0.14 | - | 382 | 1.7 | -0.05 |
| v636 | Emission Line | Eruptive Candidate | 2.8b | 1.07 | 0.77 | 1.19 | - | 565 | 1.4 | 0.43 |
| v662 | Emission Line | Eruptive with Magnetosphere | 3.1b | 1.11 | 0.82 | >0.00 | - | 1159 | 1.6 | 0.53 |
| v665 | Emission Line | Eruptive with Magnetosphere | 4.3a | 1.93 | 1.44 | 1.41 | - | 1203 | 1.6 | 0.58 |
| v699 | Emission Line | Eruptive with Magnetosphere | 4.9a | 1.87 | 1.26 | >1.05 | 1.94 | 756 | 1.9 | 0.91 |
| v713 | Emission Line | Eruptive with Magnetosphere | 3.5a | 1.58 | 1.40 | 0.19 | - | 1130 | 2.0 | -0.04 |
| v717 | FUor-like | FUor-like | 6.1a | 2.16 | 1.77 | 1.63 | - | 2300 | 4.2 | 0.23 |
| v721 | FUor-like | FUor-like | 4.9a | 1.98 | 1.80 | 0.85 | - | 3452 | 3.0 | 0.55 |
| v800 | Emission Line | Eruptive with Magnetosphere | 1.4b | 2.45 | 2.36 | 1.18 | - | 1479 | 2.2 | 0.94 |
| v815 | Outflow | Outflow Dominated | 3.1b | 1.28 | 0.87 | - | 0.48 | 544 | 1.2 | 1.08 |
| Stim1 | Emission Line | Eruptive with Magnetosphere | 10.5a | 2.47 | 2.35 | 0.40 | - | 3452 | 2.5 | 0.63 |
| Stim5 | Emission Line | Eruptive with Magnetosphere | 5.1a | 1.41 | 1.33 | 0.92 | 0.44 | 3452 | 3.8 | 0.90 |
| Stim13 | Emission Line | Eruptive with Magnetosphere | 2.7a | 2.73 | 1.61 | >0.40 | 1.22 | 1588 | 1.5 | 1.33 |
| DR4_v5 | Emission Line | Eruptive with Magnetosphere | 1.8a | 1.23 | 0.69 | 1.14 | - | 1230 | 4.0 | 0.96 |
| DR4_v10 | Emission Line | Eruptive with Magnetosphere | 4.2a | 0.87 | 0.57 | >1.06 | - | 3437 | 3.6 | 1.86 |
| DR4_v15 | Outflow | Outflow Dominated | 4.3b | 2.21 | 2.04 | - | 3.29 | 3456 | 3.6 | 0.56 |
| DR4_v17 | Emission Line | Non-eruptive (Periodic) | 4.3a | 1.92 | 1.79 | 1.05 | - | 1155 | 3.8 | 0.78 |
| DR4_v18 | Emission Line | Eruptive with Magnetosphere | 5.2a | 1.68 | 1.60 | 0.54 | - | 796 | 3.6 | 0.21 |
| DR4_v20 | FUor-like | FUor-like | 4.7a | 1.02 | 0.78 | >0.60 | - | 2913 | 3.3 | 0.74 |
| DR4_v30 | Emission Line | Eruptive Candidate | 6.7a | 2.31 | 2.21 | 1.02 | - | 30 | 3.9 | 0.36 |
| DR4_v34 | Emission Line | Eruptive with Magnetosphere | 4.0a | 1.94 | 1.17 | 1.30 | - | 2904 | 3.6 | -0.19 |
| DR4_v39 | Emission Line | Eruptive with Magnetosphere | 4.6a | 1.55 | 1.30 | 0.90 | 1.16 | 1445 | 2.3 | 0.51 |
| DR4_v42 | Emission Line | Eruptive with Magnetosphere | 6.6a | 1.84 | 1.74 | >0.07 | 1.11 | 900 | 3.4 | 1.26 |
| DR4_v44 | Emission Line | Eruptive with Magnetosphere | 3.9a | 1.17 | 0.89 | >1.05 | - | 2921 | 3.6 | 0.83 |
| DR4_v55 | Outflow | Outflow Dominated | 3.4b | 3.04 | 2.99 | - | 3.79 | 954 | 3.6 | 1.97 |
| DR4_v67 | Outflow | Outflow Dominated | 4.5b | 2.01 | 1.94 | 1.20 | 1.19 | 2572 | 5.3 | 1.05 |
| DR4_v89 | Outflow | Outflow Dominated | 2.3b | 1.49 | 0.93 | - | 2.39 | 710 | 3.0 | 0.85 |
Acknowledgements
ZG, PWL, and CJM acknowledge support by STFC Consolidated Grants ST/R00905/1, ST/M001008/1 and ST/J001333/1 and the STFC PATT-linked grant ST/L001403/1. We thank the staff of the Magellan Telescopes and the European Southern Observatory for their work in operating the facilities used in this project. This work has made use of the University of Hertfordshire’s high-performance computing facility (http://uhhpc.herts.ac.uk).
The contribution of CCP was funded by a Leverhulme Trust Research Project Grant
We gratefully acknowledge data from the ESO Public Survey program ID 179.B-2002 taken with the VISTA telescope, and products from the Cambridge Astronomical Survey Unit (CASU). This paper includes data gathered with the 6.5 meter Magellan Telescopes located at Las Campanas Observatory, Chile during Chilean programes: CN2014A-16 and CN2015A-78. D.M. and J.A.-G. thank support from the BASAL Center for Astrophysics and Associated Technologies (CATA) through grant AFB170002 and FONDECYT Regular grant No. 1170121.
J.B., R.K., and J.A.-G. are supported by ANID, Millennium Science Initiative ICN12_009, awarded to the Millennium Institute of Astrophysics (MAS). J.A.-G. acknowledges support from Fondecyt Regular 1201490.
A.C.G. acknowledges funding from the European Research Council (ERC) under the European Union’s Horizon 2020 research and innovation programme (grant agreement No. 743029).
Supported by the international Gemini Observatory, a program of NSF’s NOIRLab, which is managed by the Association of Universities for Research in Astronomy (AURA) under a cooperative agreement with the National Science Foundation, on behalf of the Gemini partnership of Argentina, Brazil, Canada, Chile, the Republic of Korea, and the United States of America.
MSNK acknowledges the support from FCT - Fundação para a Ciência e a Tecnologia through Investigador contracts and exploratory project (IF/00956/2015/CP1273/CT0002).
This research has made use of the NASA/IPAC Infrared Science Archive, which is funded by the National Aeronautics and Space Administration and operated by the California Institute of Technology.
6 Data Availability
The WISE, Spitzer and 2MASS data underlying this article are publicly available at https://irsa.ipac.caltech.edu/Missions/wise.html, https://irsa.ipac.caltech.edu/Missions/spitzer.html, and https://irsa.ipac.caltech.edu/Missions/2mass.html respectively. The VVV and VVVX data are publicly available at the ESO archive http://archive.eso.org/cms.html. The relevant reduced products for the most recent VVVX epochs have not yet been publicly released but are available on request to the first author. The lasted VVV/VVVX -band light curves of the spectroscopic follow-up samples are provided in Table LABEL:tab:lc_example. The reduced spectra are provided at http://star.herts.ac.uk/~pwl/Lucas/GuoZ/VVVspec/.
References
- Alcalá et al. (2014) Alcalá J. M., et al., 2014, A&A, 561, A2
- Allers et al. (2007) Allers K. N., et al., 2007, ApJ, 657, 511
- Alonso-García et al. (2012) Alonso-García J., Mateo M., Sen B., Banerjee M., Catelan M., Minniti D., von Braun K., 2012, AJ, 143, 70
- Aspin et al. (2009) Aspin C., et al., 2009, ApJ, 692, L67
- Aspin et al. (2010) Aspin C., Reipurth B., Herczeg G. J., Capak P., 2010, ApJ, 719, L50
- Audard et al. (2010) Audard M., et al., 2010, A&A, 511, A63
- Audard et al. (2014) Audard M., et al., 2014, Protostars and Planets VI, pp 387–410
- Belczyński et al. (2000) Belczyński K., Mikołajewska J., Munari U., Ivison R. J., Friedjung M., 2000, A&AS, 146, 407
- Bell & Lin (1994) Bell K. R., Lin D. N. C., 1994, ApJ, 427, 987
- Benjamin et al. (2003) Benjamin R. A., et al., 2003, PASP, 115, 953
- Bensby et al. (2013) Bensby T., et al., 2013, A&A, 549, A147
- Bouvier et al. (2007) Bouvier J., et al., 2007, aap, 463, 1017
- Carey et al. (2009) Carey S. J., et al., 2009, PASP, 121, 76
- Chené & St-Louis (2010) Chené A. N., St-Louis N., 2010, ApJ, 716, 929
- Chrysostomou et al. (2008) Chrysostomou A., Bacciotti F., Nisini B., Ray T. P., Eislöffel J., Davis C. J., Takami M., 2008, A&A, 482, 575
- Clarke et al. (2005) Clarke C., Lodato G., Melnikov S. Y., Ibrahimov M. A., 2005, MNRAS, 361, 942
- Connelley & Greene (2010) Connelley M. S., Greene T. P., 2010, AJ, 140, 1214
- Connelley & Reipurth (2018) Connelley M. S., Reipurth B., 2018, ApJ, 861, 145
- Contreras Peña et al. (2017a) Contreras Peña C., et al., 2017a, MNRAS, 465, 3011
- Contreras Peña et al. (2017b) Contreras Peña C., et al., 2017b, MNRAS, 465, 3039
- Contreras Peña et al. (2019) Contreras Peña C., Naylor T., Morrell S., 2019, arXiv e-prints, p. arXiv:1904.04068
- Corradi et al. (2008) Corradi R. L. M., et al., 2008, A&A, 480, 409
- Covey et al. (2021) Covey K. R., Larson K. A., Herczeg G. J., Manara C. F., 2021, AJ, 161, 61
- D’Angelo & Spruit (2010) D’Angelo C. R., Spruit H. C., 2010, MNRAS, 406, 1208
- D’Angelo & Spruit (2012) D’Angelo C. R., Spruit H. C., 2012, MNRAS, 420, 416
- Dahm & Hillenbrand (2020) Dahm S. E., Hillenbrand L. A., 2020, AJ, 160, 278
- Davies et al. (2010) Davies B., Lumsden S. L., Hoare M. G., Oudmaijer R. D., de Wit W.-J., 2010, MNRAS, 402, 1504
- DeWitt et al. (2013) DeWitt C., Bandyopadhyay R. M., Eikenberry S. S., Sellgren K., Blum R., Olsen K., Bauer F. E., Sarajedini A., 2013, AJ, 146, 109
- Dunham (1932) Dunham J. L., 1932, Physical Review, 41, 721
- Dunham & Vorobyov (2012) Dunham M. M., Vorobyov E. I., 2012, ApJ, 747, 52
- Farrenq et al. (1991) Farrenq R., Guelachvili G., Sauval A. J., Grevesse N., Farmer C. B., 1991, Journal of Molecular Spectroscopy, 149, 375
- Fehér et al. (2017) Fehér O., Kóspál Á., Ábrahám P., Hogerheijde M. R., Brinch C., 2017, A&A, 607, A39
- Fitzpatrick (1999) Fitzpatrick E. L., 1999, PASP, 111, 63
- Freudling et al. (2013) Freudling W., Romaniello M., Bramich D. M., Ballester P., Forchi V., García-Dabló C. E., Moehler S., Neeser M. J., 2013, A&A, 559, A96
- Gagne et al. (2015) Gagne J., Lambrides E., Faherty J. K., Simcoe R., 2015, FireHose v2: Firehose v2.0, doi:10.5281/zenodo.18775, %****␣draft2.bbl␣Line␣225␣****https://doi.org/10.5281/zenodo.18775
- González-Fernández et al. (2018) González-Fernández C., et al., 2018, MNRAS, 474, 5459
- Gredel & Dalgarno (1995) Gredel R., Dalgarno A., 1995, ApJ, 446, 852
- Green et al. (2013) Green J. D., et al., 2013, ApJ, 772, 117
- Greene & Lada (1996) Greene T. P., Lada C. J., 1996, AJ, 112, 2184
- Greene & Lada (2002) Greene T. P., Lada C. J., 2002, AJ, 124, 2185
- Greene et al. (2010) Greene T. P., Barsony M., Weintraub D. A., 2010, ApJ, 725, 1100
- Gromadzki et al. (2009) Gromadzki M., Mikołajewska J., Whitelock P., Marang F., 2009, Acta Astron., 59, 169
- Großschedl et al. (2019) Großschedl J. E., et al., 2019, A&A, 622, A149
- Guo et al. (2018a) Guo Z., et al., 2018a, ApJ, 852, 56
- Guo et al. (2018b) Guo Z., Gully-Santiago M., Herczeg G. J., 2018b, ApJ, 868, 143
- Guo et al. (2020) Guo Z., et al., 2020, MNRAS, 492, 294
- Gutermuth & Heyer (2015) Gutermuth R. A., Heyer M., 2015, AJ, 149, 64
- Hajdu et al. (2020) Hajdu G., Dékány I., Catelan M., Grebel E. K., 2020, Experimental Astronomy, 49, 217
- Hartmann & Kenyon (1996) Hartmann L., Kenyon S. J., 1996, ARA&A, 34, 207
- Hartmann et al. (2011) Hartmann L., Zhu Z., Calvet N., 2011, arXiv e-prints, p. arXiv:1106.3343
- Hartmann et al. (2016) Hartmann L., Herczeg G., Calvet N., 2016, ARA&A, 54, 135
- Herbig (1989) Herbig G. H., 1989, in Reipurth B., ed., European Southern Observatory Conference and Workshop Proceedings Vol. 33, European Southern Observatory Conference and Workshop Proceedings. pp 233–246
- Herbig (2008) Herbig G. H., 2008, AJ, 135, 637
- Hillenbrand et al. (2018) Hillenbrand L. A., et al., 2018, ApJ, 869, 146
- Hinkle et al. (1984) Hinkle K. H., Scharlach W. W. G., Hall D. N. B., 1984, ApJS, 56, 1
- Hodapp et al. (2012) Hodapp K. W., Chini R., Watermann R., Lemke R., 2012, ApJ, 744, 56
- Hodapp et al. (2020) Hodapp K. W., et al., 2020, AJ, 160, 164
- Ilee et al. (2013) Ilee J. D., et al., 2013, MNRAS, 429, 2960
- Johns-Krull & Valenti (2001) Johns-Krull C. M., Valenti J. A., 2001, ApJ, 561, 1060
- Jose et al. (2020) Jose J., et al., 2020, ApJ, 892, 122
- Kausch et al. (2015) Kausch W., et al., 2015, A&A, 576, A78
- Kenyon & Webbink (1984) Kenyon S. J., Webbink R. F., 1984, ApJ, 279, 252
- Kenyon et al. (1990) Kenyon S. J., Hartmann L. W., Strom K. M., Strom S. E., 1990, AJ, 99, 869
- Kenyon et al. (2000) Kenyon S. J., Kolotilov E. A., Ibragimov M. A., Mattei J. A., 2000, ApJ, 531, 1028
- Kóspál et al. (2011a) Kóspál Á., et al., 2011a, A&A, 527, A133
- Kóspál et al. (2011b) Kóspál Á., et al., 2011b, ApJ, 736, 72
- Kóspál et al. (2016) Kóspál Á., et al., 2016, A&A, 596, A52
- Kóspál et al. (2020) Kóspál Á., Szabó Z. M., Ábrahám P., Kraus S., Takami M., Lucas P. W., Contreras Peña C., Udalski A., 2020, ApJ, 889, 148
- Kraus et al. (2000) Kraus M., Krügel E., Thum C., Geballe T. R., 2000, A&A, 362, 158
- Lada (1987) Lada C. J., 1987, in Peimbert M., Jugaku J., eds, IAU Symposium Vol. 115, Star Forming Regions. pp 1–17
- Lang (2014) Lang D., 2014, AJ, 147, 108
- Lee et al. (2020) Lee Y.-H., et al., 2020, ApJ, 903, 5
- Lin et al. (1985) Lin D. N. C., Papaloizou J., Faulkner J., 1985, MNRAS, 212, 105
- Lodato & Clarke (2004) Lodato G., Clarke C. J., 2004, MNRAS, 353, 841
- Lorenzetti et al. (2009) Lorenzetti D., Larionov V. M., Giannini T., Arkharov A. A., Antoniucci S., Nisini B., Di Paola A., 2009, ApJ, 693, 1056
- Lorenzetti et al. (2012) Lorenzetti D., et al., 2012, ApJ, 749, 188
- Lucas et al. (2001) Lucas P. W., Roche P. F., Allard F., Hauschildt P. H., 2001, MNRAS, 326, 695
- Lucas et al. (2017) Lucas P. W., et al., 2017, MNRAS, 472, 2990
- Lucas et al. (2020) Lucas P. W., et al., 2020, MNRAS,
- MacFarlane et al. (2019) MacFarlane B., Stamatellos D., Johnstone D., Herczeg G., Baek G., Chen H.-R. V., Kang S.-J., Lee J.-E., 2019, MNRAS, 487, 4465
- Mainzer et al. (2014) Mainzer A., et al., 2014, ApJ, 792, 30
- Mauerhan et al. (2009) Mauerhan J. C., Van Dyk S. D., Morris P. W., 2009, PASP, 121, 591
- McClure (2009) McClure M., 2009, ApJ, 693, L81
- Meisner et al. (2017) Meisner A. M., Lang D., Schlegel D. J., 2017, AJ, 153, 38
- Meisner et al. (2018) Meisner A. M., Lang D. A., Schlegel D. J., 2018, Research Notes of the American Astronomical Society, 2, 202
- Meisner et al. (2019) Meisner A. M., Lang D., Schlafly E. F., Schlegel D. J., 2019, PASP, 131, 124504
- Meyer et al. (1997) Meyer M. R., Calvet N., Hillenbrand L. A., 1997, AJ, 114, 288
- Mikołajewska (2007) Mikołajewska J., 2007, Baltic Astronomy, 16, 1
- Minniti (2016) Minniti D., 2016, in Galactic Surveys: New Results on Formation, Evolution, Structure and Chemical Evolution of the Milky Way. p. 10
- Minniti et al. (2010) Minniti D., et al., 2010, New Astronomy, 15, 433
- Muzerolle et al. (1998) Muzerolle J., Hartmann L., Calvet N., 1998, AJ, 116, 455
- Muzerolle et al. (2013) Muzerolle J., Furlan E., Flaherty K., Balog Z., Gutermuth R., 2013, Nature, 493, 378
- Naik et al. (2009) Naik S., Banerjee D. P. K., Ashok N. M., 2009, MNRAS, 394, 1551
- Najita et al. (1996) Najita J., Carr J. S., Tokunaga A. T., 1996, ApJ, 456, 292
- Origlia et al. (1993) Origlia L., Moorwood A. F. M., Oliva E., 1993, A&A, 280, 536
- Pecaut & Mamajek (2013) Pecaut M. J., Mamajek E. E., 2013, apjs, 208, 9
- Phillips (2007) Phillips J. P., 2007, MNRAS, 376, 1120
- Pike et al. (2016) Pike R. E., Geballe T. R., Burton M. G., Chrysostomou A., 2016, ApJ, 822, 82
- Ramstedt & Olofsson (2014) Ramstedt S., Olofsson H., 2014, A&A, 566, A145
- Rayner et al. (2009) Rayner J. T., Cushing M. C., Vacca W. D., 2009, ApJS, 185, 289
- Rebull et al. (2018) Rebull L. M., Stauffer J. R., Cody A. M., Hillenbrand L. A., David T. J., Pinsonneault M., 2018, AJ, 155, 196
- Reid et al. (2014) Reid M. J., et al., 2014, ApJ, 783, 130
- Rodríguez-Flores et al. (2014) Rodríguez-Flores E. R., Corradi R. L. M., Mampaso A., García-Alvarez D., Munari U., Greimel R., Rubio-Díez M. M., Santand er-García M., 2014, A&A, 567, A49
- Rosslowe & Crowther (2015) Rosslowe C. K., Crowther P. A., 2015, Monthly Notices of the Royal Astronomical Society, 447, 2322
- Saito et al. (2012) Saito R. K., et al., 2012, A&A, 537, A107
- Schechter et al. (1993) Schechter P. L., Mateo M., Saha A., 1993, Publications of the Astronomical Society of the Pacific, 105, 1342
- Schlafly et al. (2019) Schlafly E. F., Meisner A. M., Green G. M., 2019, ApJS, 240, 30
- Shu (1977) Shu F. H., 1977, ApJ, 214, 488
- Simcoe et al. (2013) Simcoe R. A., et al., 2013, PASP, 125, 270
- Skrutskie et al. (2006) Skrutskie M. F., et al., 2006, AJ, 131, 1163
- Smette et al. (2015) Smette A., et al., 2015, A&A, 576, A77
- Smith et al. (2018) Smith L. C., et al., 2018, MNRAS, 474, 1826
- Stellingwerf (1978) Stellingwerf R. F., 1978, ApJ, 224, 953
- Turner et al. (1977) Turner J., Kirby-Docken K., Dalgarno A., 1977, ApJS, 35, 281
- Venturini et al. (2004) Venturini C. C., Rudy R. J., Lynch D. K., Mazuk S., Puetter R. C., 2004, AJ, 128, 405
- Vernet et al. (2011) Vernet J., et al., 2011, A&A, 536, A105
- Vorobyov & Basu (2005) Vorobyov E. I., Basu S., 2005, ApJ, 633, L137
- Vorobyov & Basu (2006) Vorobyov E. I., Basu S., 2006, ApJ, 650, 956
- Vorobyov & Basu (2010) Vorobyov E. I., Basu S., 2010, ApJ, 719, 1896
- Wallace & Hinkle (1997) Wallace L., Hinkle K., 1997, ApJS, 111, 445
- Wang & Chen (2019) Wang S., Chen X., 2019, ApJ, 877, 116
- Wenger et al. (2018) Wenger T. V., Balser D. S., Anderson L. D., Bania T. M., 2018, ApJ, 856, 52
- Wheelwright et al. (2010) Wheelwright H. E., Oudmaijer R. D., de Wit W. J., Hoare M. G., Lumsden S. L., Urquhart J. S., 2010, MNRAS, 408, 1840
- Whitelock & Munari (1992) Whitelock P. A., Munari U., 1992, A&A, 255, 171
- Whitelock et al. (1991) Whitelock P., Feast M., Catchpole R., 1991, MNRAS, 248, 276
- Williams (2019) Williams P. M., 2019, MNRAS, 488, 1282
- Wright et al. (2010) Wright E. L., et al., 2010, AJ, 140, 1868
- Zechmeister & Kürster (2009) Zechmeister M., Kürster M., 2009, A&A, 496, 577
- Zhu et al. (2007) Zhu Z., Hartmann L., Calvet N., Hernandez J., Muzerolle J., Tannirkulam A.-K., 2007, ApJ, 669, 483
- Zhu et al. (2009a) Zhu Z., Espaillat C., Hinkle K., Hernandez J., Hartmann L., Calvet N., 2009a, ApJ, 694, L64
- Zhu et al. (2009b) Zhu Z., Hartmann L., Gammie C., 2009b, ApJ, 694, 1045
Appendix A Variable YSOs discovered by W. Stimson
In Paper I, the co-author W. Stimson carefully searched two VVV disc tiles (d064 and d083) for highly variable stars (1 mag) in order to estimate the completeness of the larger search in that work, where strict data quality criteria were used. The search by Stimson found 14 variable stars that were not in the list of 816 variable sources published in Paper I. Spectra for three of these variable stars, Stim1, Stim5 and Stim13, are presented in the present work. No details of these 14 stars were given in Paper I so we list here their coordinates and classifications. We use the abbreviation “Stim” to distinguish these variable stars from sources found in our other searches. The classifications draw on the 2010—2019 VIRAC2 light curves, the infrared colours available from WISE, Spitzer-GLIMPSE and VVV/VIRAC2 and a search for evidence for star formation activity within a 5 arcminute radius of each source using the SIMBAD database and the WISE colour images (see Lucas et al., 2017, for details of the approach with these ancillary data).
| Name | R.A. | Declination | Class | Light Curve Properties |
|---|---|---|---|---|
| Stim1 | 12:57:44.23 | -62:15:06.4 | YSO | Eruptive |
| Stim2 | 12:58:29.27 | -61:47:25.0 | YSO | Eruptive |
| Stim3 | 13:05:30.03 | -62:29:18.7 | YSO | STV |
| Stim4 | 13:06:37.34 | -62:35:04.3 | YSO | Dipper |
| Stim5 | 16:12:14.41 | -51:50:24.4 | YSO | Eruptive |
| Stim6 | 16:13:12.28 | -51:39:03.7 | YSO | Dipper, MTV |
| Stim7 | 16:14:45.48 | -50:57:49.0 | YSO | Fader, MTV |
| Stim8 | 16:14:51.45 | -51:45:41.9 | AGB | P = 860 d |
| Stim9 | 16:16:08.12 | -51:41:31.5 | AGB | P = 591 d |
| Stim10 | 16:16:13.16 | -51:03:56.8 | EB | P = 1.22058 d |
| Stim11 | 16:17:32.79 | -51:16:55.9 | YSO | Eruptive, MTV |
| Stim12 | 16:17:59.50 | -51:57:05.7 | YSO | Dipper, MTV |
| Stim13 | 16:19:10.80 | -51:03:53.0 | YSO | Dipper |
| Stim14 | 16:21:42.16 | -51:23:29.6 | Microlensing | - |
The periods of the two AGB stars and the eclipsing binary (EB) were measured with the PDM2 code of Stellingwerf (Stellingwerf, 1978), giving a very precise result in the case of the EB. Stim14 is listed as a microlensing event, based on visual inspection of the light curve for this isolated blue star. However, the event is not well sampled so this interpretation is not certain. The classification of the YSOs is secure in 8/10 cases. Only Stim2 and Stim12 lack firm evidence for location in a star formation region but their light curve properties and the red colours measured by Spitzer-GLIMPSE, support a YSO interpretation.
Appendix B VVV light curves
This section presents the VVV/VVVX light curves of the 38 sources observed in this work. The phase-folded light curves of periodic and quasi-periodic objects in our series are presented in Figure 9. The VIRAC2 light curves of the 61 spectroscopic confirmed YSOs, and the 5 post-main-sequence objects observed in this work are listed in Table LABEL:tab:lc_example. The infrared magnitudes, including , , from VVV/VVVX, – from ALLWISE, and to MIPS24 from Spitzer are presented in Table 8. Plots of the VIRAC2 light curves of the YSOs from Paper II are presented in Appendix C and are included in the online Supplementary info.
| Name | GLON | GLAT | Observation time | -value | ||
|---|---|---|---|---|---|---|
| deg | deg | MJD | mag | mag | ||
| DR4_v5 | 307.318755 | 0.156974 | 55271.2096 | 14.16 | 0.01 | 1.0 |
| DR4_v5 | 307.318755 | 0.156974 | 55271.2105 | 14.17 | 0.01 | 0.8 |
| DR4_v5 | 307.318755 | 0.156974 | 55293.0966 | 13.51 | 0.25 | 1.5 |
| DR4_v5 | 307.318755 | 0.156974 | 55293.0987 | 13.13 | 0.01 | 0.9 |
| DR4_v5 | 307.318755 | 0.156974 | 55293.0990 | 13.15 | 0.02 | 1.0 |
| Name | W1 | W2 | W3 | W4 | I1 | I2 | I3 | I4 | 24 m | ||||
|---|---|---|---|---|---|---|---|---|---|---|---|---|---|
| v14 | 17.68 | 16.72 | 15.57 | 13.27 | 12.04 | - | - | 12.76 | 11.91 | 11.31 | 10.32 | 5.99 | 0.61 |
| v16 | 16.14 | 14.70 | 13.65 | 11.54 | 10.56 | 6.74 | - | 11.76 | 10.84 | 10.14 | 9.10 | 6.21 | 0.07 |
| v51 | 19.20 | 16.86 | 14.42 | 12.34 | 10.68 | 9.08 | 6.25 | 11.58 | 10.55 | 9.58 | 8.91 | 5.99 | 0.08 |
| v53 | 17.78 | - | 14.54 | 10.98 | 9.65 | 7.72 | - | 11.47 | 10.05 | 9.27 | 8.39 | 4.96 | 0.61 |
| v84 | 17.36 | 14.06 | 12.29 | 10.63 | 9.88 | - | - | 11.55 | 11.04 | 10.66 | 10.36 | - | -1.45 |

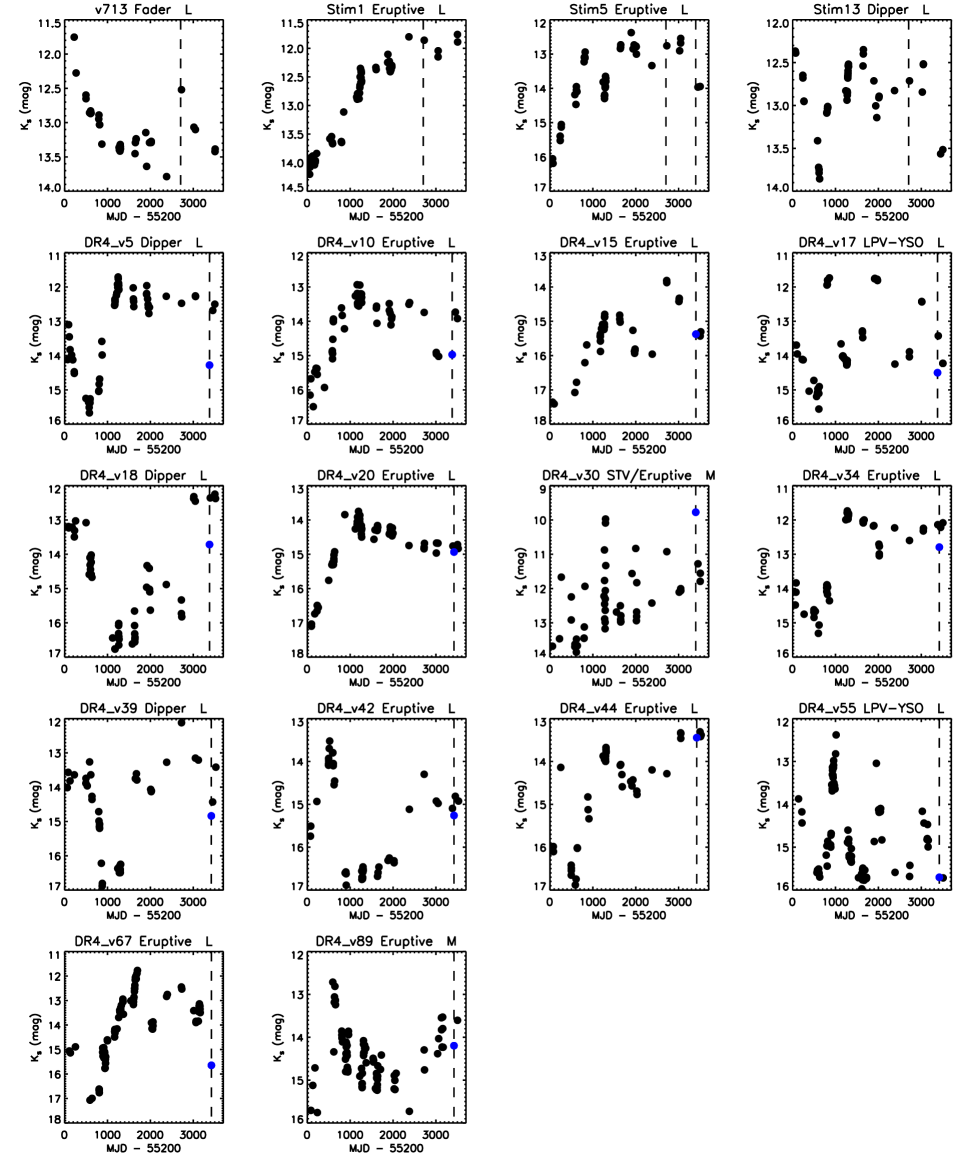
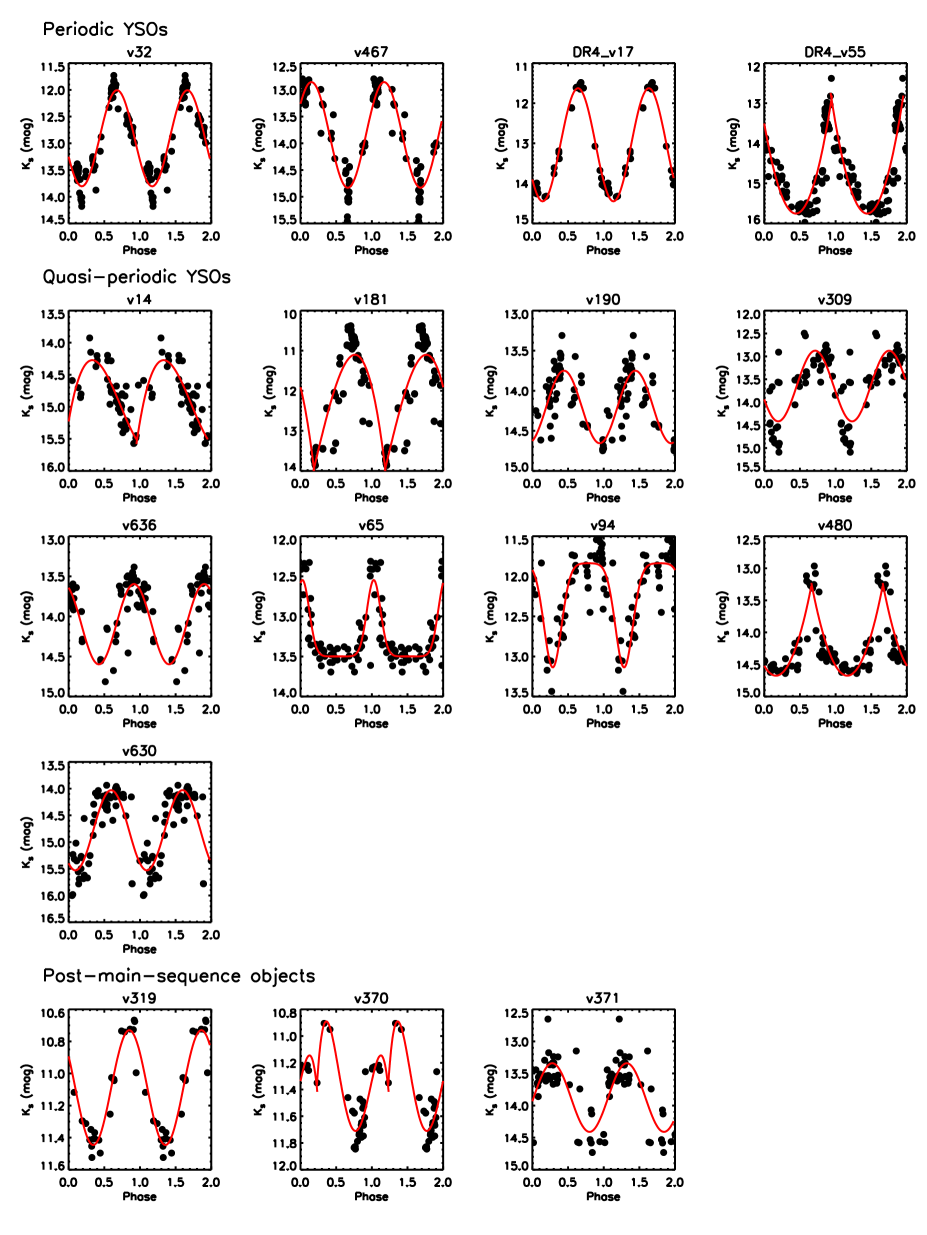
| Name | Observation | Instrument | Slit Width | Nexp | |
|---|---|---|---|---|---|
| Date | (′′) | (s) | |||
| v14 | 2017-05-31 | FIRE | 0.60 | 4 | 253.6 |
| v16 | 2017-05-31 | FIRE | 0.60 | 4 | 158.5 |
| v51 | 2017-06-01 | FIRE | 0.60 | 4 | 158.5 |
| v53 | 2017-06-01 | FIRE | 0.60 | 4 | 253.6 |
| v84 | 2017-06-01 | FIRE | 0.60 | 4 | 253.6 |
Appendix C VVV light curves of sources observed in Paper II
Here, we present the VIRAC2b version of light curves of the variable young stellar objects observed in Paper II.


Appendix D 2MASS data for individual sources

A few 2MASS (MJD 52000) and VVV joint light curves are shown in Figure 12, including 4 FUor-like objects and 5 emission line YSOs. According to the transformation equation provided in González-Fernández et al. (2018), the difference between the 2MASS and VISTA photometric system is negligible (0.05 mag) comparing to the photometric amplitude. The extinction-dominated FUor-like YSO v237 had a similar flux in 2MASS and in the out-of-dip portion of the VVV light curve so it has likely remained in outburst for about two decades.
The light curve of v16 appears to show an outburst with total duration 3800 days. However, the infrared colour variation of v16 during the fading potion is consistent with changing extinction.
The 2MASS photometry of v721, a slowly rising FUor-like YSO, was mag, about 1 mag brighter than faintest magnitude taken by VVV. This suggests that the amplitude of the v721 outburst is not much larger than 3 mag. The quiescent state of DR4_v20 was much fainter than the 2MASS detection limit. The light curve morphology and variation amplitude of three eruptive emission line YSOs (Stim1, Stim5, and DR4_v67) are comparable to the FUor-like YSO v721. In particular, both v721 and Stim1 experienced a slow rise, at a rate of 0.4 – 0.6 mag yr-1, while the intra-year variability of Stim1 is slightly larger than v721. However, Stim1 has spectral features of the magnetospheric accretion process.
The emission line object DR4_v34 had a photometric minima in 2010. Since 2013, it rapidly raised to a brightness plateau that has similar flux as in the 2MASS. Although the morphology of the light curve looks like an extinction dip around 2010, the VVV colour variation between 2010 and 2015 epoch ( mag and mag) does not agree with the extinction curve (). Hence we still classify it as an eruptive object.
Appendix E The measurement of extinction
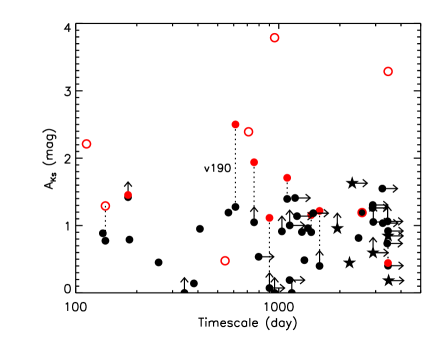
In this work, the line-of-sight extinction () is measured by two methods, as their location on the colour-colour diagram and the flux ratio of emission lines where possible. The near-infrared colours during the outburst stage are preferred. The is measured via de-reddening the location of individual targets on the colour-colour diagram to the Classical T Tauri star locus (Meyer et al., 1997). The extinction estimated by this method is not accurate for targets with outstanding infrared excess. Another method applied the flux ratio between 1-0 Q(3) (2.42 m) and 1-0 S(1) (2.12 m) lines, as the theoretical value is independent to the excitation conditions (Q(3)/S(1) = 0.7; Turner et al., 1977). We measured the Q(3)/S(1) ratio on 15 YSOs with sufficient Q(3) flux, then compared it against the theoretical value to obtain the reddening factor between two wavelengths. Finally, the is derived by the power-law extinction function with (Wang & Chen, 2019). The extinction and duration of eruptive YSOs are shown in Figure 13. Sources lack of measurements are not shown. We see that there is no clear difference between the line-of-sight extinction of FUor-like objects and emission line YSOs.
Both methods have their own limitations and uncertainties. The accuracy of flux ratio method is strongly rely on the accuracy of the line flux measurement. Large uncertainties are seen on the flux measurement of the Q(3) line, as it is heavily veiled by the continuum and the CO overtone emission. Hence, this method was only carried out on objects with enough signal to noise ratio on their Q(3) emission. The typical error of the flux measurement is 8% on Q(3) lines, which leads to a 0.4 mag error on . In addition, extinction from the inner disc, between the stellar surface and the emission region of , will not be measured by this method.
The colour-colour-diagram method is not rely on spectral features, hence it can be applied on many sources. However, this method uses the empirical locus of CTTS, while a large fraction of our objects are Class I sources with infrared excess. The location of YSOs on the colour-colour diagram is also affected by the variable mass accretion process (Figure 21 in Paper I). Although one expected the colour variation introduced by episodic accretion should have a different vector than the reddening, a large scattering of colour variation is seen among eruptive YSOs, which further contributes to the uncertainty of the extinction measurement. This method also requests and -band photometry which are unavailable for most heavily extincted objects.
The measured is time dependent especially on objects with variable line-of-sight extinction. To measure the , the , , photometry in the outburst stage, normally closer to the spectroscopic epochs, were used. However, several sources, either lack of -band detection in later epochs or having rapid photometric variation, have notable variation between the multi-band photometric and spectroscopic epochs. For example, a quasi-periodic object v190 had the 3-band VVV photometric epoch at MJD 55244 and a spectroscopic epoch at MJD 57905, with a separation of 0.35 in phase (P = 611 d). The measured by the 3-band photometry is 1.28 mag and by line flux ratio in the fainter epoch is 2.50 mag, with a difference of 1.22 mag, while the between two epoch is 0.91 mag. We compared the measured on targets with more than one VVV multi-band epoch. Large epoch-to-epoch difference ( mag) is only seen among a small number of targets, and most of them are STVs and MTVs.
To conclude the measurement, both methods have their uncertainties and absolute accurate measurement is not achievable. However, the general picture shows two important results: FUor-type objects have similar line-of-sight extinction as most emission line objects, and some outflow-dominated objects have very large suggesting geometric effect is involved.
Appendix F Year-to-year variability of Stim5
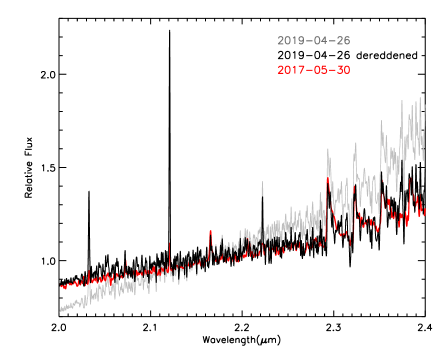
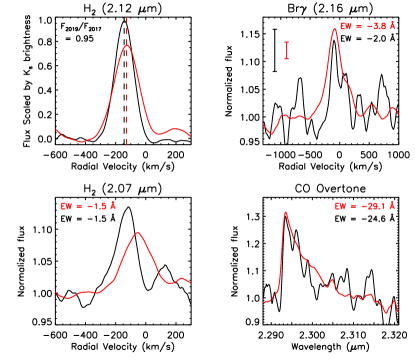
Spectra of the emission line object Stim5 were obtained in 2017 and 2019. In this section, we study the spectroscopic variation of Stim5 over the two-year interval. The overall amplitude of Stim5 is 3.8 mag in the 2010 - 2019 interval of the VVV data. Starting from 2010, Stim5 experienced a rapid rise of mag in three years. After a brief dimming ( mag) in 2014, Stim5 rose further to its photometric maximum, mag, in 2015 (see the lower-middle panel of Figure 12). It then stayed at a bright plateau in the light curve from 2015–2018 and started fading again in 2019. The intra-year variations are modest, mag, in comparison to the inter-year variations. Between the two spectroscopic epochs, it faded by 1.2–1.5 mag in , based on VVV photometry taken within 100 days of each of the two epochs. The spectra of Stim5 in two epochs are shown in Figure 14. Different continuum slopes are seen between two epochs, and the change is well fitted by adding the power law de-reddening curve towards the galactic centre ( 1.2 mag and , Wang & Chen 2019) to the spectrum in the fainter epoch. The Br emission had constant radial velocity in the two epochs, with broad profiles consistent with the accretion disc origin. The equivalent width (EW) of the Br line was slightly larger in the brighter 2017 epoch but the difference was within the error bar. The CO overtone emission and H2 2-1 S(3) line at m also had the similar EWs between the two epochs. Considering the spectroscopic variation and the low / ratio between 2017 and 2019 epochs, we conclude that the fading of Stim5 after 2017 is due to increasing line-of-sight extinction.
The 1-0 S(1) line ( m) shows different variation behaviour against the continuum and other emission features as the EW of the m line is stronger in the fainter 2019 epoch. We measured the flux change of this line by doing an approximate flux calibration based on the VVV -band photometry taken closest to the spectroscopic epochs. After subtracting the reddened continuum, we found that the m line flux in the fainter 2019 epoch is at least 20% larger than the 2017 epoch despite the 1.2–1.5 mag decline in brightness. This indicates that the emission from the outflow arises on a larger spatial scale than the obscuration source causing the change in extinction towards the inner disc. This contrasts with the fading of the H2 2-1 S(3) m line indicated by the constant equivalent width, noted above. In the literature, H2 m emission has been detected from hot components of HH objects (e.g. Pike et al., 2016) and the flux ratio between H2 m and m lines was applied to determine the LTE temperature (Gredel & Dalgarno, 1995). However, in Stim5, the different variation behaviours between these two emission lines suggest that they might have different physical origins. The m line, with similar variation mode as Br emission, could arise from the inner disc associating with mass accretion process.
Appendix G AGB stars and symbiotic systems: v51, v319 and v370
In Paper I, the authors found that long period pulsating AGB stars (Miras) are more abundant than YSOs among the brighter end of the VVV variable samples. Miras are bright ( mag) and have periodic variation driven by the pulsation of the photosphere (e.g. Whitelock et al., 1991). The near-infrared spectra of AGB stars are dominated by molecular absorption features, for example 12CO absorption bands in the bandpass (Origlia et al., 1993) and 12CO absorption bands in the bandpass (Wallace & Hinkle, 1997). As a consequence of nucleosynthesis, strong 13CO absorption lines are seen beyond 2.34 m (Ramstedt & Olofsson, 2014). Water absorption bands are also commonly seen in AGB stars, including steam bands in the , and bandpasses and the 3.1 m water ice band. The key spectral features to distinguish AGB stars from FUors are strong 13CO absorption and 12CO absorption.
Br emission is observed in a few AGB stars, such as Cyg (Hinkle et al., 1984), NSV 11749 (Rodríguez-Flores et al., 2014) and XID 6592 (DeWitt et al., 2013). Although shocks can excite low excitation emission lines during the expansion and contraction of the stellar envelope (Hinkle et al., 1984), Hi recombination lines in AGB stars are associated with binary systems, known as D-type symbiotic stars. Here the HI arises in the accretion flow from the AGB star on to its companion (Kenyon & Webbink, 1984; Mikołajewska, 2007). In D-type symbiotic systems the near-infrared emission arises partly from the photosphere and partly from the circumstellar dust shell (Whitelock & Munari, 1992; Belczyński et al., 2000; Phillips, 2007), such that the near-infrared colours overlap with those of YSOs (Corradi et al., 2008). Due to variable dust obscuration, D-type symbiotic stars have more scattered light curves than most normal Miras (Gromadzki et al., 2009). Similar variable dust obscuration is also seen in the Miras with extreme mass loss rates that dominate the Mira population in VVV due to the effect of the survey saturation limit (Contreras Peña et al., 2017a).
In this work, three objects, v51, v319 and v370, show spectral features of AGB stars including water vapour absorption, 12CO and 13CO absorption. Br emission is detected on v319 and v370 indicating that they are O-rich D-type symbiotic stars. According to Lucas et al. (2017), Mira variable stars in VVV and the United Kingdom Infrared Sky Survey typically have redder 1 to 5 m infrared colours than YSOs, due to being completely enclosed in a shell of warm dust. However, both v319 and v370 are bluer ( mag) than the AGB selection region in that work, suggesting thinner dust shells around these two objects. The WISE colours of v370 fall into the YSO region on the WISE colour-colour diagram ( vs. ) in agreement with D-type symbiotic stars (see Figure 1 from Rodríguez-Flores et al., 2014). Periodic variations are measured with the VIRAC2 light curves of v319 and v370, with = 304 days and 319 days, respectively. There is a large scatter in the phase-folded light curve of v370, which is consistent with symbiotic stars. Given that we have reported several new high amplitude periodic YSOs in this work, the overlap in colour space between YSOs and some D-type symbiotic stars indicates that colours and time series photometry cannot reliably distinguish the two types of variable star. High quality spectroscopy is required for a clear identification. We note that X-ray emission is often detected from symbiotic stars but these two stars do not appear to have been the subject of sensitive X-ray observations and so no detection has been reported.
Strong 13CO () absorption bandheads are detected in v51. A shallow absorption feature around 2.345 m is observed in FUors (e.g. Figure 5 Connelley & Reipurth, 2018) and M-type dwarf stars (Rayner et al., 2009). However, the 13CO bandhead at 2.345 m is much deeper than the feature seen in FUors, comparable to 12CO bandheads. M-type giant stars show similarly strong 13CO (Rayner et al., 2009), having undergone the first dredge up. Consequently, we classified v51 as a post-main-sequence object. The WISE colours of v51 ( and = 2.83) fall outside the empirical colour space of dusty Mira stars defined by Lucas et al. (2017), and the light curve of v51 is dominated by two V-shape dips separated by about 2500 days. Each dip has mag and lasts 600 to 1000 days. The ratio of infrared magnitude variations was observed during the second dip as , consistent with variable line-of-sight extinction. The spectrum of v51 has absorption features including water vapour in the bandpass, Br, 12CO overtone and 13CO in -band.
According to Contreras Peña et al. (2017a), Miras should lie at distances kpc to fall below the saturation limit of VVV, in the absence of foreground extinction. We attempted to measure kinematic distances for v51, v319, and v370 based on the radial velocity of the CO overtone bands. Located at galactic longitude (), the radial velocity of v319 (120 km s-1) cannot be fitted by a Galactic rotation model, indicating that it is a halo object. For v51 and v370, the radial velocity-based kinematic distances are 12.5 and 14.6 kpc, consistent with the range of kinematic distances allowed by the VIRAC2 proper motions. These two stars are therefore identified as Galactic disc members.
Appendix H Spectra of 38 sources observed in this paper
In this section, we present the near-infrared spectra of the 38 sources observed in the 2017 and 2019 spectroscopic epochs. The information of spectroscopic observation is listed in Table LABEL:tab:obs.