Searches for sterile neutrinos and axionlike particles from the Galactic halo with eROSITA
Abstract
Dark matter might be made of “warm” particles, such as sterile neutrinos in the keV mass range, which can decay into photons through mixing and are consequently detectable by X-ray telescopes. Axionlike particles (ALPs) are detectable by X-ray telescopes too when coupled to standard model particles and decay into photons in the keV range. Both particles could explain the unidentified 3.5-keV line and, interestingly, XENON1T observed an excess of electron recoil events most prominent at keV. One explanation could be an ALPs origin, which is not yet excluded by X-ray constraints in an anomaly-free symmetry model in which the photon production is suppressed. We study the diffuse emission coming from the Galactic halo, and calculate the sensitivity of all-sky X-ray survey performed by eROSITA to identify a sterile neutrino or ALP dark matter. We estimate bounds on the mixing angle of the sterile neutrinos and coupling strength of the ALPs. After four years of data-taking by eROSITA, we expect to set stringent constraints, and in particular, we expect to firmly probe mixing angle up to nearly two orders magnitude below the best-fit value for explaining the unidentified 3.5-keV line. Moreover, with eROSITA, we will be able to probe the ALP parameter space of couplings to photons and electrons, and potentially confirm an ALP origin of the XENON1T excess.
I Introduction
The nature of dark matter remains an exciting open question in astrophysics, cosmology and particle physics. The most studied candidate is cold dark matter (CDM), which are particles with negligible thermal velocities during structure formation era and that interact only through gravity with baryons and with themselves Frenk and White (2012). However, the non-observation of CDM with direct detection experiments motivates to search for other candidates besides CDM; for example, dark matter with much lower masses such as warm dark matter (WDM), with non-negligible thermal velocity at early times Roszkowski et al. (2018); Silk et al. (2010). WDM suppresses structure at small scales due to free-streaming effects, and may explain some CDM issues on structure formation, while it behaves as CDM on large scales Bode et al. (2001).
Sterile neutrinos are well motivated WDM candidates Shi and Fuller (1999); Abazajian et al. (2001); Dolgov and Hansen (2002); Canetti et al. (2013). They have much larger mass than active neutrinos and can explain all of the dark matter density in the Universe Boyarsky et al. (2019). Moreover, sterile neutrinos have right-handed chirality in contrary to the three flavour standard model neutrinos which have only left-handed chirality. Presence of right-handed neutrinos is naturally expected in order to explain light neutrino masses found by the neutrino oscillation measurements Kajita (1999); Asaka et al. (2005), and additionally, it may solve the matter-antimatter asymmetry of the Universe Asaka et al. (2005). In the neutrino minimal standard model (MSM) it is possible to simultaneous explain baryogenesis, neutrinos mass, and dark matter, with sterile neutrino as the dark matter candidate Boyarsky et al. (2009).
Through a mixing angle with active neutrinos, sterile neutrinos can decay into an active neutrino and a photon with photon energy , where is the sterile neutrino mass. The rate of decay depends on its mass and mixing angle, and is given by the following decay rate Sicilian et al. (2020); Abazajian (2021),
| (1) |
Sterile neutrinos in the keV mass range will produce X-ray photons, which can be observed by X-ray telescopes as a monochromatic line signal.
Through a stacked X-ray spectrum analysis of 73 galaxy clusters, an emission line at keV was detected Bulbul et al. (2014), hinting towards experimental evidence for sterile neutrino decay. The same emission line was soon after observed in X-ray spectra of the M31 galaxy and the Perseus galaxy cluster Boyarsky et al. (2014), as well as in the Milky-Way center Boyarsky et al. (2015). The signal can be interpreted as a signature of decaying sterile neutrinos with mass of keV and mixing angle of – Boyarsky et al. (2019). Many follow-up studies confirmed the emission line in spectra of dark matter dominated objects with different X-ray instruments Iakubovskyi et al. (2015); Franse et al. (2016); Cappelluti et al. (2018); Neronov et al. (2016). However, other studies did not detect any line emission in dark matter dominated objects Urban et al. (2014); Tamura et al. (2015); Riemer-Sørensen et al. (2015); Malyshev et al. (2014); Anderson et al. (2015); Foster et al. (2021); Bhargava et al. (2020) and suggested non-dark matter explanations including astrophysical effects, statistical fluctuations, and instrumental systematics. Recently, using XMM-Newton data, Ref. Dessert et al. (2020) provides strong constraints on the unassociated X-ray line from decaying dark matter (see also Refs. Abazajian (2020); Boyarsky et al. (2020)). It remains relevant to search for a line emission from sterile neutrino decays.
Another interesting WDM candidate is the axionlike particle (ALP), which is a pseudo-Nambu-Goldstone boson that emerges when a continuous global symmetry is spontaneously broken Arias et al. (2012); Takahashi et al. (2020); Irastorza and Redondo (2018); Chaubey et al. (2020). In contrary to the QCD axions, ALPs do not solve the CP problem, and can be light due to the broken symmetry. ALPs can couple to various standard model particles such as protons, electrons, and photons, and therefore can decay into two photons, producing a narrow X-ray line, possibly explaining the unidentified 3.5-keV line.
As another interesting possibility, ALP decay could explain the observed excess of electron recoil events over known backgrounds at the XENON1T experiment, where a best-fit mass value of keV and coupling to electrons of is found with a significance over the background Aprile et al. (2020). The ALP coupling to standard model particles is already too tightly constrained by X-ray observations to explain this excess. Therefore, the photon coupling needs to be suppressed Irastorza and Redondo (2018). In an anomaly-free symmetry model, the ALP is coupled to leptons without any anomalous coupling to photons, and is dominated by the coupling to the least massive lepton – the electron Nakayama et al. (2014); Pospelov et al. (2008); Takahashi et al. (2020). In this model, photons are only induced through threshold corrections, and, although suppressed, the decay into two photons can be the leading decay mode for ALPs with masses less than twice the electron mass.
The ALP-electron coupling suggested by XENON1T is of the same order as the coupling suggested to explain the observed excess in cooling of various stellar objects like white dwarfs and red giants Giannotti et al. (2017), known as the stellar cooling anomalies Miller Bertolami et al. (2014); Ayala et al. (2014); Corsico et al. (2012a, b). The evolution of these objects are described by well-established cooling process, and indeed, the cooling anomaly based on white dwarf luminosity function analysis is found at Giannotti et al. (2016), hinting towards a preferred region for the ALP parameter space. Following Ref. Takahashi et al. (2020), we consider a model in which ALPs can explain both the XENON1T excess and the stellar cooling anomaly.
Whether dark matter is made of sterile neutrinos or ALPs, they can be well probed with current generation and future X-ray telescopes. In this paper, we estimate the sensitivity of all-sky X-ray survey performed by eROSITA to observe a decaying sterile neutrino and axion-like particle signal. The hierarchical clustering of dark matter predicts that the Milky-Way galaxy is embedded in a halo of dark matter particles, with a higher density towards the Galactic center Navarro et al. (1997a). The largest contribution to the observable dark matter induced X-ray flux originates from the Galactic center, and we study the diffuse emission coming from the Galactic halo around its center. eROSITA has excellent angular and energy resolution, and will also observe the full sky over the course of four years with an average exposure of ks Merloni et al. (2012), making the survey a valuable probe for dark matter decay with a narrow X-ray line emission. By simulating the all-sky X-ray signal due to dark matter decay, we make a sensitivity projection for eROSITA to a sterile neutrino and ALP signal under a background-only hypothesis. We find that the eROSITA will enable us to probe much deeper regions of the parameter space for both the sterile neutrino and ALP dark matter.
II All-sky X-ray map
II.0.1 Sterile neutrino signal from the Galactic halo
The X-ray photon flux produced through sterile neutrino decay inside the Galactic halo depends on the sterile neutrino decay rate , sterile neutrino mass , energy spectrum per decay, and the dark matter density distribution through the so-called D-factor. The X-ray photon intensity is given as follows,
| (2) |
The flux per pixel is given by integrating over the pixel solid angle . The energy spectrum per decay is a delta function:
| (3) |
The D-factor describes the dark matter density profile, , of the Milky Way halo, integrated over the line of sight is given by
| (4) |
where the radial distance from the Galactic center is described as
| (5) |
with the Galactic coordinates, and kpc the distance from the Sun to the Galactic center. We consider both the spherically-symmetric Navarro-Frenk-White (NFW) Navarro et al. (1997b) profile and a cored profile Read et al. (2016). The NFW profile is given by
| (6) |
parameterized by a scale radius and a characteristic density . The cored profile is given by
| (7) |
where the function, , considers the shallowness of the dark matter core below the core radius . is the enclosed mass for the NFW density profile within that is given by
| (8) |
where , , and is the halo concentration parameter Read et al. (2016). In our analysis we consider only complete core formation, reducing the number of parameters needed to specify the dark matter core properties. Adopting the parameters from Abazajian et al. (2020) for both NFW and cored profile, we set the core radius of the Milky Way to 1 kpc and use a scale radius of kpc. For the local dark matter density we take GeV cm-3, for which we find a density at the scale radius of GeV cm-3.
II.0.2 Extragalactic sterile neutrino signal
Additionally, decaying sterile neutrino contributes to the diffuse extragalactic signal, emitting at different redshifts. The average X-ray photon intensity is given as follows,
| (9) |
with the Hubble parameter as a function of redshift , and with , , , , and the critical density .
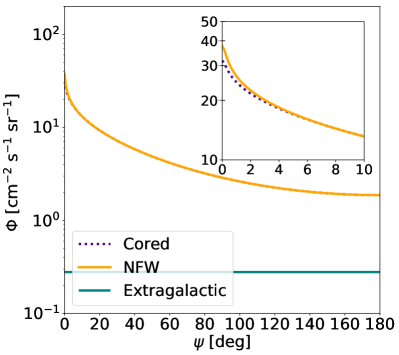
Figure 1 shows the integrated flux for the extragalactic (green solid line) and Galactic component by adopting NFW (orange solid line) and cored (purple dotted line) profiles as a function of angle subtending from the Galactic center in the energy range of keV, with keV and . The Galactic flux associated with the cored profile is only slightly smaller with respect to that with the NFW profile at angles close to the Galactic center, and nearly identical further away. Furthermore, the extragalactic flux is more than an order of magnitude smaller than the Galactic flux within the small energy bins that we adopt in this paper and including the extragalactic flux will thus not lead to any significant improvement.
II.0.3 Axionlike particle signal
ALPs can couple to several standard model particles. Here we consider the coupling to photons and electrons. In the case of a ALP-to-photon coupling, the decay into two photons produces a mono-energetic line at the energy of , with a decay rate given by Higaki et al. (2014)
| (10) |
where is the ALP mass and is the decay constant. One can convert the decay constant to the photon coupling through the following conversion
| (11) |
with Irastorza and Redondo (2018).
In order to explain the XENON1T excess by ALP, the ALP-photon coupling must be suppressed due to existing bounds Irastorza and Redondo (2018). We therefore consider ALPs that couple mainly to electrons, and assume an anomaly-free symmetry, where photons are only induced through threshold corrections. In this model, the decay rate is given by Nakayama et al. (2014)
| (12) |
with the coupling between the ALP and electron. The energy spectrum for the ALP is described by a delta function, as in equation 3, where we replace by . We further multiply the delta function by a factor of two to take into account that two photons are produced from the ALP decay. This allows for a direct comparison with the sterile neutrino flux and allows us to use the obtained X-ray bounds on the mixing angle and to convert to those on the coupling strength or . It is therefore only necessary to construct sky maps for the sterile neutrino case, and the method for producing these maps is described in the following section.
II.0.4 Sky maps
The sky maps are generated with HEALPix111http://healpix.sf.net using the software package healpy Gorski et al. (2005); Zonca et al. (2019), where we adopt its resolution parameter , which corresponds to a pixel size . For each set of parameters , and for each energy bin of width , we obtain the expected number of X-ray photon counts from decaying sterile neutrinos coming from the galactic halo as well as extragalactic from a region on the sky at position by
| (13) |
where ks is the exposure time, is the effective area and takes into account the energy resolution of the detector. We apply the following normal distribution for the energy resolution,
| (14) |
where is related to the full width at half maximum through with eV for eROSITA Merloni et al. (2012). We consider in total 13 energy bins around with bin size for each sterile neutrino mass, and range the mass between keV.
II.0.5 Background events
We consider an overall diffuse cosmic X-ray background (CXB), which is energy dependent and especially dominant at lower keV energies. It is represented by a power-law with photon index and with a normalization at 1 keV of photon cm-2 s-1 keV-1 sr-1 Lumb et al. (2002). Moreover, we consider eROSITA’s detector background, which are high energy particles that show a flat spectral energy distribution with a normalization of counts keV-1 s-1 arcmin-2 Predehl et al. (2021). We distribute both background contributions isotropically over the sky and apply the same energy binning as mentioned above.
Besides the isotropic background contributions, X-ray bubbles are observed in the Milky Way, which are most prominent in the keV energy band and drop below the detector’s background above keV Predehl et al. (2020). An average count rate is measured by eROSITA in the keV energy band of 0.0038 photons s-1 arcmin-2 and 0.0026 photons s-1 arcmin-2 in the northern and southern bubbles respectively. We adopt a thermal spectrum to model the X-ray bubbles with a temperature of keV Predehl et al. (2020), where we fix the normalization with the aforementioned count rates. For its morphology, we consider an uniform template of the Fermi bubbles, downloaded from https://fermi.gsfc.nasa.gov/ssc/data/access/.
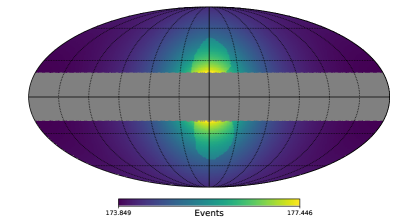
Moreover, in order to exclude the extended emission from the Galactic plane, we remove all pixels with . Figure 2 illustrates a sky map with energy bin around keV with , corresponding to , and additionally the isotropic and anisotropic background components. We analyze the full sky map under the signal hypothesis consisting of a sterile neutrino signal and background components, and under the null hypothesis with background components only.
III Analysis
We calculate the sensitivity to detect a sterile neutrino signal by performing a joint likelihood analysis on simulated data. We generate mock data sets assuming background only (the null hypothesis with ), with Monte Carlo simulations following a Poisson distribution. This is performed for each pixel of our pixelized sky map in the binned energy window under consideration. For each sterile neutrino mass, we generate 500 mock data sets , where runs over the energy bins as well as spatial pixels. The likelihood to obtain as a function of the decay rate for a specific sterile neutrino mass is given by the likelihood functions:
| (15) |
where are the expected counts in each bin under the signal hypothesis with decaying dark matter and background component. The test statistic (TS) to determine the best-fit model under a maximum likelihood estimation is then defined as
| (16) |
where is the the maximum likelihood. We obtain upper limits on the decay rates at 95% confidence level (CL), which corresponds to a test statistic of .
IV Results and discussion
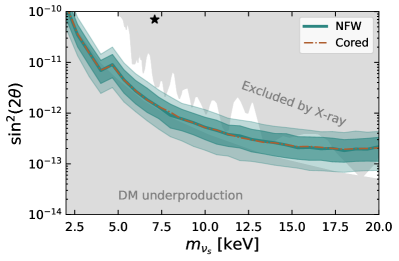
We analyse the simulated sky maps under the null hypothesis, and report the sensitivity of eROSITA on the mixing angle as a function of the sterile neutrino mass. Figure 3 shows the result by applying the NFW profiles by removing the Galactic plane with . The two bands show the 68% and 95% containment regions from the Monte Carlo runs, while the solid line represents the median. The upper grey area represents limits based on current X-ray observations Horiuchi et al. (2014); Ng et al. (2015); Perez et al. (2017); Ng et al. (2019); Abazajian (2017); Caputo et al. (2020); Roach et al. (2020); Foster et al. (2021), while the lower grey area represents the theoretical lower limit for dark matter underproduction Serpico and Raffelt (2005); Cherry and Horiuchi (2017). With eROSITA, we will nearly close the gap between current lower and upper bounds. Reference Barinov et al. (2021) obtains similar estimates at lower sterile neutrino masses by analyzing the signal from the inner region around the Galactic center with eROSITA, whereas our estimates are stronger at larger sterile neutrino masses due to the larger region of interest as well as the removal of the Galactic plane. Moreover, we indicate the best-fit of the unidentified keV line by Ref. Bulbul et al. (2014) as a black star, with mass keV and mixing angle . With an exposure time of ks, eROSITA will be sensitive to the keV line and can even constrain the mixing angles up to nearly two orders of magnitude lower than the best-fit at keV.
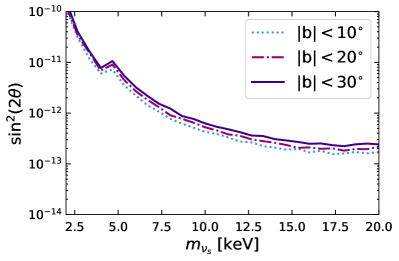
We evaluate how sensitive these results are to some aspects in our analysis. The median of the Monte Carlo runs with a cored profile is illustrated as the orange dashed dotted line, and by comparing with the NFW profile, we find little dependence on the density profiles. Indeed, figure 1 shows that the difference between the density profiles is most prominent at the inner regions, which we exclude with the cut. Additionally, we test the impact of excluding the Galactic plane at different latitudes, as shown in Fig. 4, after removing the galactic latitudes (dashed), (dashed dotted) and (solid line) for a NFW density profile. As expected, including a larger latitude , shows slightly stronger constraints with respect to , however only by a factor of . The X-ray bubbles contribute to the lowest energies we consider. However, since the sky coverage of the Fermi bubbles template is only (before masking), we find that our limits weaken only by a factor 1.1 at most by including the X-ray bubbles.
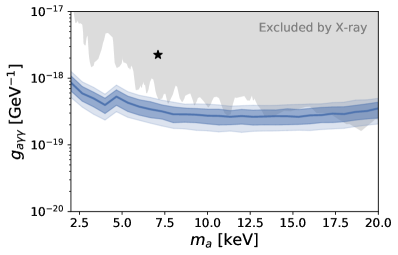
The bounds on the mixing angle can be converted to the ALP-photon coupling and ALP-electron coupling , and the sensitivity of eROSITA to the photon coupling is shown in Fig. 5. Again, the best-fit for the 3.5 keV line is indicated by a black star, and with future eROSITA observations, an ALP scenario can be probed as an explanation for the unidentified X-ray line. Even though recent work found no evidence for an unassociated X-ray line Foster et al. (2021), in which the current X-ray limits are shown as the grey shaded area (see Horiuchi et al. (2014); Ng et al. (2015); Perez et al. (2017); Ng et al. (2019); Abazajian (2017); Caputo et al. (2020); Roach et al. (2020); Foster et al. (2021)), eROSITA will be able to probe a region of the parameter space not yet excluded by current X-ray limits.
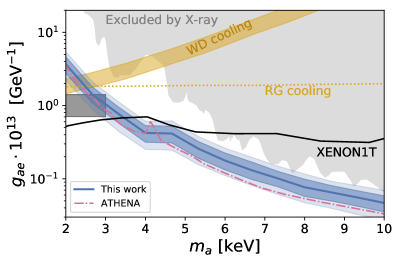
Furthermore, we consider an anomaly-free ALP model in order to explain the XENON1T excess, an excess that has been observed to be most prominent at ALP mass of –3 keV and electron coupling , and has the best fit at keV Aprile et al. (2020). We test if eROSITA will be able to confirm this, and we show its expected sensitivity in Fig. 6, where the two bands show as before the 68% and 95% containment bands from the Monte Carlo runs, while the solid line represents the median. We show the region that is excluded by current X-ray observations in grey, and with eROSITA we can indeed probe a parameter space not yet constrained Horiuchi et al. (2014); Ng et al. (2015); Perez et al. (2017); Ng et al. (2019); Abazajian (2017); Caputo et al. (2020); Roach et al. (2020); Foster et al. (2021). The black solid line represents the XENON1T limits (note that they are however given at 90% CL) Aprile et al. (2020). The XENON1T excess best-fit may not be reached by future eROSITA data, however, if the best-fit alters towards keV, which is still inside the XENON1T excess region of interest with energies between 1–7 keV, an ALP origin could be confirmed. Interestingly, the expected sensitivity of Athena taken from Ref. Neronov and Malyshev (2016) show comparable sensitivity.
Moreover, the stellar cooling anomaly can be explained by an ALP contribution. The preferred region for the white dwarf cooling anomaly is illustrated as the yellow shaded area, while the preferred values for the red giant branch in globular clusters is illustrated as the yellow dotted line Takahashi et al. (2020); Miller Bertolami et al. (2014); Viaux et al. (2013), and the preferred regions are close to the XENON1T excess. Reference Takahashi et al. (2020) points out that the stellar cooling argument and the XENON1T excess cross each other for ALP constituting only a fraction of the total dark matter, since the XENONT1T data scales as . The excess could possibly be explained by a combination of ALP and another background component like tritium, as suggested by Aprile et al. (2020).
V conclusion
In this work, we search for a decaying sterile neutrino and axionlike-particle (ALP) signal from the Galactic halo with all-sky eROSITA survey after four years observations. We generate mock data sets with the diffuse cosmic X-ray background and eROSITA’s detector background, as well as expected sky maps with counts from decaying sterile neutrinos in the Galactic halo. By performing a likelihood analysis, we set stringent bounds on the mixing angle of sterile neutrinos. We also convert these bounds to the ALP-photon coupling () and ALP-electron coupling (). We consider a cored and cusped Navarro-Frenk-White density profiles and find only tiny dependence on the choice of the density profile.
We will be able to probe a value for the mixing angle of sterile neutrinos up to nearly two orders of magnitude below the best-fit value that could explain the unidentified 3.5 keV line Bulbul et al. (2014) and one order of magnitude stronger than the existing upper limits claimed in the literature Horiuchi et al. (2014); Ng et al. (2015); Perez et al. (2017); Ng et al. (2019); Abazajian (2017); Caputo et al. (2020); Roach et al. (2020); Foster et al. (2021). In an accompanying paper Ando et al. (2021), a similar analysis is performed discussing the eROSITA sensitivity to sterile neutrino decay based on analyzing Milky-Way satellite galaxies.
We will also be able to probe a large parameter space for the ALP couplings to photons and electrons that are not yet excluded by X-ray observations, to the same degree of improvement as in the case of sterile neutrinos. We investigate both a generic model for the ALP-to-photon coupling and a more specific anomaly-free symmetry that has been proposed to explain the XENON1T excess of electron recoil events Aprile et al. (2020). Indeed, the XENON1T excess could possibly be explained by an ALP origin for an excess at keV, which might be well tested with eROSITA.
We note that in estimating the sensitivity, all detector and astrophysical lines are neglected. It is understood that the sensitivity at these line energies would decrease significantly due to signal-background degeneracy. Near-future high-energy-resolution detectors, such as Athena and XRISM, may alleviate this by performing line diagnostics analysis based on different line shifts between signal and backgrounds Speckhard et al. (2016); Powell et al. (2017); Zhong et al. (2020).
Acknowledgements.
We thank Marco Chianese and Oscar Macias for helpful discussions. This works was supported by Institute of Physics at the University of Amsterdam, and SA acknowledges the support by JSPS/MEXT KAKENHI Grant Numbers JP17H04836, JP18H04340, JP20H05850, and JP20H05861 (SA).References
- Frenk and White (2012) C. Frenk and S. White, Annalen der Physik 524, 507–534 (2012).
- Roszkowski et al. (2018) L. Roszkowski, E. M. Sessolo, and S. Trojanowski, Reports on Progress in Physics 81, 066201 (2018).
- Silk et al. (2010) J. Silk et al., Particle Dark Matter: Observations, Models and Searches, edited by G. Bertone (Cambridge Univ. Press, Cambridge, 2010).
- Bode et al. (2001) P. Bode, J. P. Ostriker, and N. Turok, The Astrophysical Journal 556, 93 (2001).
- Shi and Fuller (1999) X. Shi and G. M. Fuller, Phys. Rev. Lett. 82, 2832 (1999).
- Abazajian et al. (2001) K. Abazajian, G. M. Fuller, and M. Patel, Phys. Rev. D 64, 023501 (2001).
- Dolgov and Hansen (2002) A. D. Dolgov and S. H. Hansen, Astropart. Phys. 16, 339 (2002), arXiv:hep-ph/0009083 .
- Canetti et al. (2013) L. Canetti, M. Drewes, T. Frossard, and M. Shaposhnikov, Phys. Rev. D 87, 093006 (2013), arXiv:1208.4607 [hep-ph] .
- Boyarsky et al. (2019) A. Boyarsky, M. Drewes, T. Lasserre, S. Mertens, and O. Ruchayskiy, Prog. Part. Nucl. Phys. 104, 1 (2019), arXiv:1807.07938 [hep-ph] .
- Kajita (1999) T. Kajita, Nuclear Physics B - Proceedings Supplements 77, 123–132 (1999).
- Asaka et al. (2005) T. Asaka, S. Blanchet, and M. Shaposhnikov, Physics Letters B 631, 151–156 (2005).
- Boyarsky et al. (2009) A. Boyarsky, O. Ruchayskiy, and M. Shaposhnikov, Annual Review of Nuclear and Particle Science 59, 191–214 (2009).
- Sicilian et al. (2020) D. Sicilian, N. Cappelluti, E. Bulbul, F. Civano, M. Moscetti, and C. S. Reynolds, (2020), arXiv:2008.02283 [astro-ph.HE] .
- Abazajian (2021) K. N. Abazajian, “Neutrinos in astrophysics and cosmology: Theoretical advanced study institute (tasi) 2020 lectures,” (2021), arXiv:2102.10183 [hep-ph] .
- Bulbul et al. (2014) E. Bulbul, M. Markevitch, A. Foster, R. K. Smith, M. Loewenstein, and S. W. Randall, The Astrophysical Journal 789, 13 (2014).
- Boyarsky et al. (2014) A. Boyarsky, O. Ruchayskiy, D. Iakubovskyi, and J. Franse, Physical Review Letters 113 (2014), 10.1103/physrevlett.113.251301.
- Boyarsky et al. (2015) A. Boyarsky, J. Franse, D. Iakubovskyi, and O. Ruchayskiy, Phys. Rev. Lett. 115, 161301 (2015).
- Iakubovskyi et al. (2015) D. Iakubovskyi, E. Bulbul, A. R. Foster, D. Savchenko, and V. Sadova, “Testing the origin of 3.55 kev line in individual galaxy clusters observed with xmm-newton,” (2015), arXiv:1508.05186 [astro-ph.HE] .
- Franse et al. (2016) J. Franse, E. Bulbul, A. Foster, A. Boyarsky, M. Markevitch, M. Bautz, D. Iakubovskyi, M. Loewenstein, M. McDonald, E. Miller, S. W. Randall, O. Ruchayskiy, and R. K. Smith, The Astrophysical Journal 829, 124 (2016).
- Cappelluti et al. (2018) N. Cappelluti, E. Bulbul, A. Foster, P. Natarajan, M. C. Urry, M. W. Bautz, F. Civano, E. Miller, and R. K. Smith, The Astrophysical Journal 854, 179 (2018).
- Neronov et al. (2016) A. Neronov, D. Malyshev, and D. Eckert, Physical Review D 94 (2016), 10.1103/physrevd.94.123504.
- Urban et al. (2014) O. Urban, N. Werner, S. W. Allen, A. Simionescu, J. S. Kaastra, and L. E. Strigari, “A suzaku search for dark matter emission lines in the x-ray brightest galaxy clusters,” (2014), arXiv:1411.0050 [astro-ph.CO] .
- Tamura et al. (2015) T. Tamura, R. Iizuka, Y. Maeda, K. Mitsuda, and N. Y. Yamasaki, Publications of the Astronomical Society of Japan 67 (2015), 10.1093/pasj/psu156.
- Riemer-Sørensen et al. (2015) S. Riemer-Sørensen, D. Wik, G. Madejski, S. Molendi, F. Gastaldello, F. A. Harrison, W. W. Craig, C. J. Hailey, S. E. Boggs, F. E. Christensen, D. Stern, W. W. Zhang, and A. Hornstrup, The Astrophysical Journal 810, 48 (2015).
- Malyshev et al. (2014) D. Malyshev, A. Neronov, and D. Eckert, Phys. Rev. D 90, 103506 (2014).
- Anderson et al. (2015) M. E. Anderson, E. Churazov, and J. N. Bregman, Monthly Notices of the Royal Astronomical Society 452, 3905–3923 (2015).
- Foster et al. (2021) J. W. Foster, M. Kongsore, C. Dessert, Y. Park, N. L. Rodd, K. Cranmer, and B. R. Safdi, “A deep search for decaying dark matter with xmm-newton blank-sky observations,” (2021), arXiv:2102.02207 [astro-ph.CO] .
- Bhargava et al. (2020) S. Bhargava, P. A. Giles, A. K. Romer, T. Jeltema, J. Mayers, A. Bermeo, M. Hilton, R. Wilkinson, C. Vergara, C. A. Collins, and et al., Monthly Notices of the Royal Astronomical Society 497, 656–671 (2020).
- Dessert et al. (2020) C. Dessert, N. L. Rodd, and B. R. Safdi, Science 367, 1465–1467 (2020).
- Abazajian (2020) K. N. Abazajian, (2020), arXiv:2004.06170 [astro-ph.HE] .
- Boyarsky et al. (2020) A. Boyarsky, D. Malyshev, O. Ruchayskiy, and D. Savchenko, (2020), arXiv:2004.06601 [astro-ph.CO] .
- Arias et al. (2012) P. Arias, D. Cadamuro, M. Goodsell, J. Jaeckel, J. Redondo, and A. Ringwald, Journal of Cosmology and Astroparticle Physics 2012, 013 (2012).
- Takahashi et al. (2020) F. Takahashi, M. Yamada, and W. Yin, Phys. Rev. Lett. 125, 161801 (2020), arXiv:2006.10035 [hep-ph] .
- Irastorza and Redondo (2018) I. G. Irastorza and J. Redondo, Prog. Part. Nucl. Phys. 102, 89 (2018), arXiv:1801.08127 [hep-ph] .
- Chaubey et al. (2020) A. Chaubey, M. K. Jaiswal, and A. K. Ganguly, Physical Review D 102 (2020), 10.1103/physrevd.102.123029.
- Aprile et al. (2020) E. Aprile, J. Aalbers, F. Agostini, M. Alfonsi, L. Althueser, F. Amaro, V. Antochi, E. Angelino, J. Angevaare, F. Arneodo, and et al., Physical Review D 102 (2020), 10.1103/physrevd.102.072004.
- Nakayama et al. (2014) K. Nakayama, F. Takahashi, and T. T. Yanagida, Physics Letters B 734, 178–182 (2014).
- Pospelov et al. (2008) M. Pospelov, A. Ritz, and M. Voloshin, Physical Review D 78 (2008), 10.1103/physrevd.78.115012.
- Giannotti et al. (2017) M. Giannotti, I. G. Irastorza, J. Redondo, A. Ringwald, and K. Saikawa, JCAP 10, 010 (2017), arXiv:1708.02111 [hep-ph] .
- Miller Bertolami et al. (2014) M. M. Miller Bertolami, B. E. Melendez, L. G. Althaus, and J. Isern, JCAP 10, 069 (2014), arXiv:1406.7712 [hep-ph] .
- Ayala et al. (2014) A. Ayala, I. Domínguez, M. Giannotti, A. Mirizzi, and O. Straniero, Phys. Rev. Lett. 113, 191302 (2014), arXiv:1406.6053 [astro-ph.SR] .
- Corsico et al. (2012a) A. H. Corsico, L. G. Althaus, M. M. M. Bertolami, A. D. Romero, E. Garcia-Berro, J. Isern, and S. O. Kepler, Mon. Not. Roy. Astron. Soc. 424, 2792 (2012a), arXiv:1205.6180 [astro-ph.SR] .
- Corsico et al. (2012b) A. H. Corsico, L. G. Althaus, A. D. Romero, A. S. Mukadam, E. Garcia-Berro, J. Isern, S. O. Kepler, and M. A. Corti, JCAP 12, 010 (2012b), arXiv:1211.3389 [astro-ph.SR] .
- Giannotti et al. (2016) M. Giannotti, I. Irastorza, J. Redondo, and A. Ringwald, JCAP 05, 057 (2016), arXiv:1512.08108 [astro-ph.HE] .
- Navarro et al. (1997a) J. F. Navarro, C. S. Frenk, and S. D. M. White, The Astrophysical Journal 490, 493–508 (1997a).
- Merloni et al. (2012) A. Merloni, P. Predehl, W. Becker, H. Böhringer, T. Boller, H. Brunner, M. Brusa, K. Dennerl, M. Freyberg, P. Friedrich, A. Georgakakis, F. Haberl, G. Hasinger, N. Meidinger, J. Mohr, K. Nandra, A. Rau, T. H. Reiprich, J. Robrade, M. Salvato, A. Santangelo, M. Sasaki, A. Schwope, J. Wilms, and the German eROSITA Consortium, “erosita science book: Mapping the structure of the energetic universe,” (2012), arXiv:1209.3114 [astro-ph.HE] .
- Navarro et al. (1997b) J. F. Navarro, C. S. Frenk, and S. D. M. White, Astrophys. J. 490, 493 (1997b), arXiv:astro-ph/9611107 [astro-ph] . CITATION = ASTRO-PH/9611107;
- Read et al. (2016) J. I. Read, O. Agertz, and M. L. M. Collins, Monthly Notices of the Royal Astronomical Society 459, 2573 (2016), https://academic.oup.com/mnras/article-pdf/459/3/2573/8105757/stw713.pdf .
- Abazajian et al. (2020) K. N. Abazajian, S. Horiuchi, M. Kaplinghat, R. E. Keeley, and O. Macias, Phys. Rev. D 102, 043012 (2020).
- Higaki et al. (2014) T. Higaki, K. S. Jeong, and F. Takahashi, Phys. Lett. B 733, 25 (2014), arXiv:1402.6965 [hep-ph] .
- Gorski et al. (2005) K. Gorski, E. Hivon, A. Banday, B. Wandelt, F. Hansen, M. Reinecke, and M. Bartelman, Astrophys. J. 622, 759 (2005), arXiv:astro-ph/0409513 .
- Zonca et al. (2019) A. Zonca, L. Singer, D. Lenz, M. Reinecke, C. Rosset, E. Hivon, and K. Gorski, Journal of Open Source Software 4, 1298 (2019).
- Lumb et al. (2002) D. Lumb, R. Warwick, M. Page, and A. De Luca, Astron. Astrophys. 389, 93 (2002), arXiv:astro-ph/0204147 .
- Predehl et al. (2021) P. Predehl, R. Andritschke, V. Arefiev, V. Babyshkin, O. Batanov, W. Becker, H. Böhringer, A. Bogomolov, T. Boller, K. Borm, and et al., Astronomy & Astrophysics 647, A1 (2021).
- Predehl et al. (2020) P. Predehl, R. A. Sunyaev, W. Becker, H. Brunner, R. Burenin, A. Bykov, A. Cherepashchuk, N. Chugai, E. Churazov, V. Doroshenko, and et al., Nature 588, 227–231 (2020).
- Horiuchi et al. (2014) S. Horiuchi, P. J. Humphrey, J. Onorbe, K. N. Abazajian, M. Kaplinghat, and S. Garrison-Kimmel, Phys. Rev. D 89, 025017 (2014), arXiv:1311.0282 [astro-ph.CO] .
- Ng et al. (2015) K. C. Y. Ng, S. Horiuchi, J. M. Gaskins, M. Smith, and R. Preece, Phys. Rev. D 92, 043503 (2015), arXiv:1504.04027 [astro-ph.CO] .
- Perez et al. (2017) K. Perez, K. C. Y. Ng, J. F. Beacom, C. Hersh, S. Horiuchi, and R. Krivonos, Phys. Rev. D 95, 123002 (2017), arXiv:1609.00667 [astro-ph.HE] .
- Ng et al. (2019) K. C. Y. Ng, B. M. Roach, K. Perez, J. F. Beacom, S. Horiuchi, R. Krivonos, and D. R. Wik, Phys. Rev. D 99, 083005 (2019), arXiv:1901.01262 [astro-ph.HE] .
- Abazajian (2017) K. N. Abazajian, Physics Reports 711-712, 1–28 (2017).
- Caputo et al. (2020) A. Caputo, M. Regis, and M. Taoso, JCAP 03, 001 (2020), arXiv:1911.09120 [astro-ph.CO] .
- Roach et al. (2020) B. M. Roach, K. C. Ng, K. Perez, J. F. Beacom, S. Horiuchi, R. Krivonos, and D. R. Wik, Physical Review D 101 (2020), 10.1103/physrevd.101.103011.
- Serpico and Raffelt (2005) P. D. Serpico and G. G. Raffelt, Physical Review D 71 (2005), 10.1103/physrevd.71.127301.
- Cherry and Horiuchi (2017) J. F. Cherry and S. Horiuchi, Physical Review D 95 (2017), 10.1103/physrevd.95.083015.
- Barinov et al. (2021) V. Barinov, R. Burenin, D. Gorbunov, and R. Krivonos, Physical Review D 103 (2021), 10.1103/physrevd.103.063512.
- Neronov and Malyshev (2016) A. Neronov and D. Malyshev, Physical Review D 93 (2016), 10.1103/physrevd.93.063518.
- Viaux et al. (2013) N. Viaux, M. Catelan, P. B. Stetson, G. G. Raffelt, J. Redondo, A. A. R. Valcarce, and A. Weiss, Physical Review Letters 111 (2013), 10.1103/physrevlett.111.231301.
- Ando et al. (2021) S. Ando, S. K. Barik, Z. Feng, M. Finetti, A. G. Chaves, S. Kanuri, J. Kleverlaan, Y. Ma, N. M. D. Serracapriola, M. S. P. Meinema, I. N. Martinez, K. C. Y. Ng, E. Peerbooms, C. A. van Veen, and F. Zimmer, “Decaying dark matter in dwarf spheroidal galaxies: Prospects for x-ray and gamma-ray telescopes,” (2021), arXiv:2103.13242 [astro-ph.HE] .
- Speckhard et al. (2016) E. G. Speckhard, K. C. Y. Ng, J. F. Beacom, and R. Laha, Phys. Rev. Lett. 116, 031301 (2016), arXiv:1507.04744 [astro-ph.CO] .
- Powell et al. (2017) D. Powell, R. Laha, K. C. Y. Ng, and T. Abel, Phys. Rev. D 95, 063012 (2017), arXiv:1611.02714 [astro-ph.CO] .
- Zhong et al. (2020) D. Zhong, M. Valli, and K. N. Abazajian, Phys. Rev. D 102, 083008 (2020), arXiv:2003.00148 [astro-ph.HE] .