Estimating the Effects of Urban Green Regions in terms of Diffusion
2 Institute of Mathematics and Statistics, University of São Paulo, São Paulo, SP, Brazil
3 Department of Computer Science, Federal University of São Carlos, São Carlos, SP, Brazil
)
Abstract
The interaction between cities and their respective green regions corresponds to an interesting issue that has received growing attention over the last decades. These relationships have multiple natures, ranging from providing habitat for animal life to temperature and humidity dynamics. Several methods based on area, size, shape, and distance have been considered in the literature. Given that several important contributions of green regions to urban areas involve temperature, humidity and gases (e.g. oxygen) exchanges, which are intrinsically related to physical diffusion, it becomes particularly interesting to simulate the diffusion of green effects over urban areas as a means of better understanding the respective influences. The present work reports a related approach. Once the green regions of a given city are automatically identified by semantic segmentation and have eventual artifacts eliminated, successive convolutions are applied as a means to obtain the unfolding of the diffusion of the green effects along time. As illustrated, the diffusion dynamics is intrinsically interesting because it can be strongly affected by the spatial distribution of the green mass. In particular, we observed that smaller green regions could substantially contribute to the diffusion. The reported approach has been illustrated with respect to the Brazilian city of Ribeirão Preto, whose small and medium-sized green regions were found to complement in an effective manner the diffusion of the green effects as inferred from the performed simulations under specific parameter settings.
1 Introduction
As we progress into the 21st century, important issues remain as a subject of scientific research, including the study of the quality of life in cities and towns, which is not only a multidisciplinary problem, but also involves many characteristics and dimensions including but not being limited to mobility, security, and access to common resources such as parks, hospitals, etc [12]. Among these several aspects, the presence of green areas, their distribution, access, effects, etc., have constituted the subject of continuous studies and discussions [30, 5, 26, 11]. Green areas are important in an urban environment for several reasons, including: (i) preservation of living species; (ii) contribution to air quality by the production of oxygen and filtering of unwanted molecules; (iii) landscape design; and (iv) leisure. Therefore, it becomes important to devise means for quantifying these effects and interactions in an objective manner, so that different city organizations can be respectively studied and characterized.
Possible quantitative approaches to studying the effect of green regions in urban areas include the consideration of distance from urban spots to the nearest green regions [30], the distribution of the area [5], size [14], shape [41], and distance between green regions [31]. Those studies are intrinsically related to the single large or several small (SLOSS) problem [26, 11]. Though each of these methods are interesting and important in themselves, each of them focuses on a relatively specific property of the studied problem, so that a more complete characterization, modeling and understanding of the presence of green areas in cities should benefit from additional, complementary approaches.
The main purpose of the present work is to develop a framework for quantifying the potential effects of green regions in urban areas by taking into account the physical phenomenon of diffusion. Indeed, several fundamental dynamics in the physical world are directly related and influenced by diffusion, including thermal propagation, dissemination of gases such as oxygen and carbon dioxide, as well as the diffusion of elements in water and other liquids. At the same time, several non-linear dynamics often incorporate a diffusive component. Therefore, it becomes interesting to consider the effect of green areas into an urban environment in terms of numerically simulated diffusion of gases, temperature [21], humidity, as well as other elements to and from the green areas. This constitutes the main objective of the present work.
The proposed methodology is applied as follows. Satellite images are systematically collected from a city of interest. A sample of the images are manually annotated regarding the green regions and a deep learning-based model is trained to automatically identify green regions in the images. Eventual artifacts generated in the segmentation are removed in a post-processing step. The resulting image can then be used as input for the simulation of the diffusion of green effects, which we henceforth call green diffusion. The green regions are used as sources and the diffusion is calculated by successive convolutions with a gaussian kernel. We simulate the green regions role as sources by performing a diffusion with sources, i.e., at each step, the green areas are replenished to full capacity.
In order to illustrate the potential of the reported methodology, we took into account a satellite image of Ribeirão Preto city (São Paulo State, Brazil). Having identified the respective green regions, we also considered two respective versions without the small and medium sized green regions, therefore allowing the study of the effect of those areas into the overall obtained diffusion of green effects. Interestingly, it was observed that the incorporation of relatively small green areas can substantially boost the diffusion of green effects.
This article starts by briefly revising some of the main related works, and proceeds by describing the adopted dataset and segmentation of the respective images regarding their green regions, as well as pre-processing required for removing some segmentation artifacts. The numerical simulation of the diffusion of effects from the green regions is then described. A case example with respect to Ribeirão Preto city is then presented and discussed.
2 Related work
Satellite images are employed in various studies and can reveal valuable information about given regions [36, 4, 15, 10]. One example consists of a study that analyzed the reforestation in China regarding the amount of green vegetation cover along time [36]. Researchers have also investigated the preferences of people regarding different approaches to implementing green areas in cities [4]. Another important aspect that has been studied is the impact of temperature changes on vegetation [32]. Furthermore, the relationship between economic indicators and vegetation was studied with respect to some cities [15, 10, 37]. Interestingly, [15] shows that economic growth can positively impact the green area level, but vegetation development does not necessarily imply economic growth. Researchers also studied the possible relationship between vegetation areas and people’s education and income [23]. The spatiotemporal changes of these green regions, focusing in a particular ecosystem, such as in mountains, is also the topic of several studies, such as in [3].
Many distinct aspects, intrinsically related to the interplay between cities’ green and urban areas, have been explored [18, 14, 17, 28]. Some of these studies reveal characteristics regarding the influence of vegetation in cities, such as the impact on temperature [14] and carbon storage [27]. The information regarding rural areas surrounding the city has also been considered [9]. Interestingly, in [14] the effect of the sizes of the green regions patches on urban heat islands is studied. More specifically, this study indicates that the green area extension can be positively correlated to the city’s temperature. Moreover, the shape of the green patches can also play an important role in the land surface temperature [41]. Although many studies have described the importance and impact of vegetation in cities, the authors of [39] suggest that the greenery of urban parks could play a minor role in air purification.
Other studies deal with model simulations that incorporate characteristics of the real systems [28, 34, 35]. For example, in [28] the authors deal with the problem of the influence of vegetation and water on the city microclimate by considering computational fluid dynamics. Other aspects were also considered, which include heat conduction and airflow [34]. Another simulation approach, proposed in [35], considered the air temperature on the relationship between urban and green areas. More specifically, the author studied real measurements and, from this information, proposed a mathematical simulation for better understanding the diffusion effects on regions surrounding green areas.
3 Material and methods
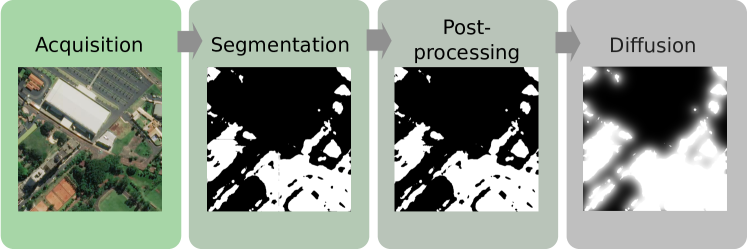
In this section, the diffusion-based methodology for characterizing green areas in satellite images is presented. The main steps of the methodology are: i) dataset acquisition; ii) segmentation of green areas using a convolutional neural network; iii) post-processing using mathematical morphology; and iv) simulation of a diffusion dynamics using the identified green areas as source. These steps, which are illustrated in Figure 1, are explained in the Sections 3.1, 3.2, 3.3 and 3.4 below.
3.1 Dataset acquisition
The images used in this study were obtained from Mapbox [22], which provides high-resolution images from many different places. The boundary of the region of interest (i.e. urban area of the cities) was manually identified. Due to the tileset convention [24] used in Mapbox API, it is necessary to convert latitudes and longitudes into another set of numerical coordinates before requesting the download of satellite images of the area through the API. In this convention, the entire region is divided into square images with the same sizes (tiles). Each column in this division is mapped to a value and each row to a value. This pair uniquely identifies a square of the region and covers an interval of coordinates. Providing the list of coordinates that forms the region, it is possible to retrieve the image of the entire area of interest. If the resolution of the image is high, the coordinate interval captured per tile will be smaller, thus resulting in a larger number of images to cover the total area. The image format and resolution (coverage zoom) can be specified in the API. Specific technical details of the adopted dataset in our experiments are presented in Section 4.
A ground truth dataset was manually generated using the online annotator tool Supervisely [33]. A sample of the images was randomly inspected (preferably at the urban central regions and not at the urban periphery) and polygons covering the class of interest were generated. When polygons are manually annotated in this tool, all points that compose the polygon became available in a json file that is used to generate labels for each class. In our case, using the definition of green area as described in the next section, all of those elements were mapped to the class green, thus generating a binary mask for all annotated images indicating the presence or absence of green for each image.
3.2 Image segmentation of green areas
To characterize a satellite image, it is usually necessary to first identify its main relevant structures. We start this process by green areas segmentation. Many works have approached the problem of segmenting areas of interest in remote sensing images. For instance, [2] considered several types of aerial images and, by using the concept of Shannon entropy [7], sought to distinguish the regions as being urban, rural, or aquatic. More recently, deep learning methodologies have been considered [1, 19, 16, 6, 13, 38, 40], such as in [1], where a CNN (Convolutional Neural Network) was adopted for automatically identifying natural disasters from satellite images. In another study, by using a CNN architecture and temporal information, changes in forest regions have been identified [19].
A deep-learning configuration frequently considered in remote sensing studies is the U-Net [29], which is also based on convolution layers. More information regarding this architecture is presented in Section 3.2. Interestingly, though the U-Net was originally considered for dealing with biomedical image segmentation [29], many studies employed U-Net variations in the analysis of satellite imagery [16, 6, 13, 38]. Some examples of applications include the detection of buildings [16], roads [6], and green areas [13].
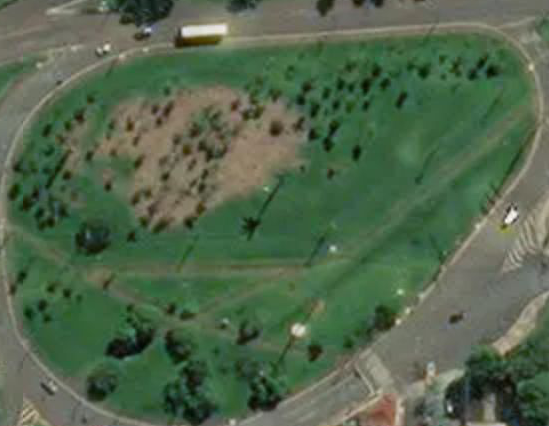
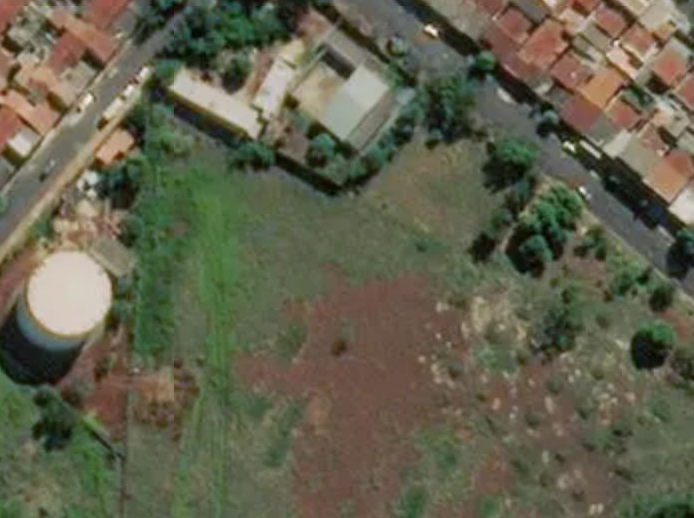
In this study, we focus on inferring the composition of green areas in the urban scenery in satellite images, which do not necessarily have a homogeneously green color. Thus, the segmentation of such areas constitutes a challenging task. Here, we consider mostly urban vegetation with green coloration in the definition of Green area: the presence of trees, gardens, squares, yards, flower beds, recreational space with a grass field, trees at roadsides, sidewalks or between residences. In some cases, plantations near the city borders were included. However, there are some areas for which it is difficult to determine the presence or absence of vegetation, such as plantation harvest regions, muddy or barren regions and dry grass with yellow coloration. For these ambiguous regions, we take into consideration the presence of trees as a crucial factor to determine if the area were to be considered as a green area or not. In general rules, the presence of trees will indicate the presence of green. As an example, in the Figure 2 there are brown regions surrounded by grass. In Figure 2(a) we can observe the presence of small trees between the region without grass and thus, this region was labeled as a green area. In contrast, the region shown in Figure 2(b) also has a brown region but without the presence of any tree and thus was not considered as a green area.
After the construction of the supervised dataset, the data is provided to a supervised learning method to identify the green area regions. The model training process for a segmentation task is challenging because it requires predicting the category of each pixel in the image. Although there are several studies using traditional methods such as Support Vector Machines, powerful deep learning-based methods have been recently developed for this task [42]. A regular convolutional neural network includes downsampling operations, which may incur a loss of spatial information. The neural network-based approach proposed by Long. et al. [20] tries to avoid this problem by transforming the intermediate feature maps back to the size of the input image. In this study, a U-Net [29] architecture was adopted. The model’s architecture is fully convolutional and consists of symmetrical contraction and expansion paths. Additionally, the model associates the contracting path high resolution features with the upsampled output, aiming at preserving spatial location information. By performing pixel-wise classification, the network predicts each pixel belonging to a class by assigning a probability value. Usually, the label assigned to each pixel is that with the highest probability. In our case, we adopted a threshold of 0.6 for considering the pixel as being in the class green.
3.3 Post-processing using mathematical morphology
Because the images are obtained initially as a set of squares, and we employ a tiled-based processing method before assembling the entire image, some artifacts can be respectively implied in the predicted labels. In general, unwanted vertical and horizontal lines result near the square borders. To deal with this problem, we employed a data-based noise reduction post-processing step. First, we apply morphological closing operation using a disk structuring element to reduce noise. Furthermore, morphological closing is also adopted to remove straight line artifacts. More specifically, this step was constrained to the regions composed of pixels that are no further than six pixels from the tile boundaries. In order to remove both the horizontal and vertical unwanted lines, we processed these regions separately, as four rectangles with an overlap at the four corners. These rectangles are named Left (L), Right (R), Up (U), and down (D), according to their positions. With respect to each of the rectangles, kernels with dimensions are defined, as follows
| (1) |
By considering each of these kernels, we compute their convolutions with the respective rectangles. To obtain regions with the same size as the original rectangle, the convolution is performed with zero-padding. The resultant matrix is formed by real numbers. So, in order to convert this matrix to binary numbers, a threshold, , is applied, and the values above are converted to 1, otherwise being assigned 0 (here we use ). This operation starts from the rectangle L, and the remaining are computed by following the order: R, U, and D. Note that, for the overlapped regions, this operation is performed twice so as to remove both the horizontal and vertical artifacts.
3.4 Green diffusion
Nature and vegetation are essential in promoting healthy living on earth. Thus, it becomes important to analyze the distribution of the green and non-green regions in its cities.
Here, we propose a physics-inspired approach for characterizing the interaction between co-existing green and non-green regions, which we call green diffusion. A simple process characterizing several natural phenomena is isotropic diffusion, or simply diffusion [8]. For instance, the diffusion of molecules such as oxygen follows this type of dynamics. This provides one of the main motivations for the present work, namely the simulation of a diffusion process emanating from the green regions into the non-green areas. If allowed to unfold along time, defining a respective signature, such a diffusion dynamics can provide an indication about the potential influence of the green regions over the other areas. The specific profile observed in these signatures can vary largely depending not only on the proximity, but also on the geometry of the green regions. Several desired green effects such as humidity, soil preservation, air filtering – not to mention providing habitat for birds and small animals – which contribute to environmental and urbanistic aspects, can be reasonably modeled in terms of a linear diffusive dynamics. The green regions are represented as corresponding to sources of diffusion. More specifically, their values are kept constant at all times.
In a more practical aspect, this method can be computed through successive convolutions with the green region. First, a mask with value one representing the green areas, and zero otherwise, is created by considering the green areas segmented from the satellite image. For each iteration, the image is convolved with a smooth kernel (e.g., Gaussian). This procedure is repeated times, in order to simulate the diffusion of the green effects throughout the city.
As an alternative dynamics, we consider the diffusion with sources. This approach starts with the same process employed in the former methodology. However, at the end of each iteration, the intensity of the initially detected green regions is set to one again. Here, the number of iterations is controlled by the following equation
| (2) |
where is the number of pixels reached by the green diffusion, and is the total number of pixels in the image. The dynamics finish when , where is a parameter.
The methodology can be employed by considering both green and non-green regions as initial sources. In the first case, the dynamics accounts for the effects of vegetation in the city. However, for non-green regions as sources, this methodology can represent cities’ growth over areas of vegetation. From a more practical point o view, if we consider the non-green areas as sources of diffusion, the overall amount of green decreases over time. Furthermore, non-green regions, in the initial state, will be kept intact throughout the dynamics, and the original green regions, in turn, will gradually decrease in size. An interesting measure, obtained from these simulations, is the time required to achieve a desired overall green level.
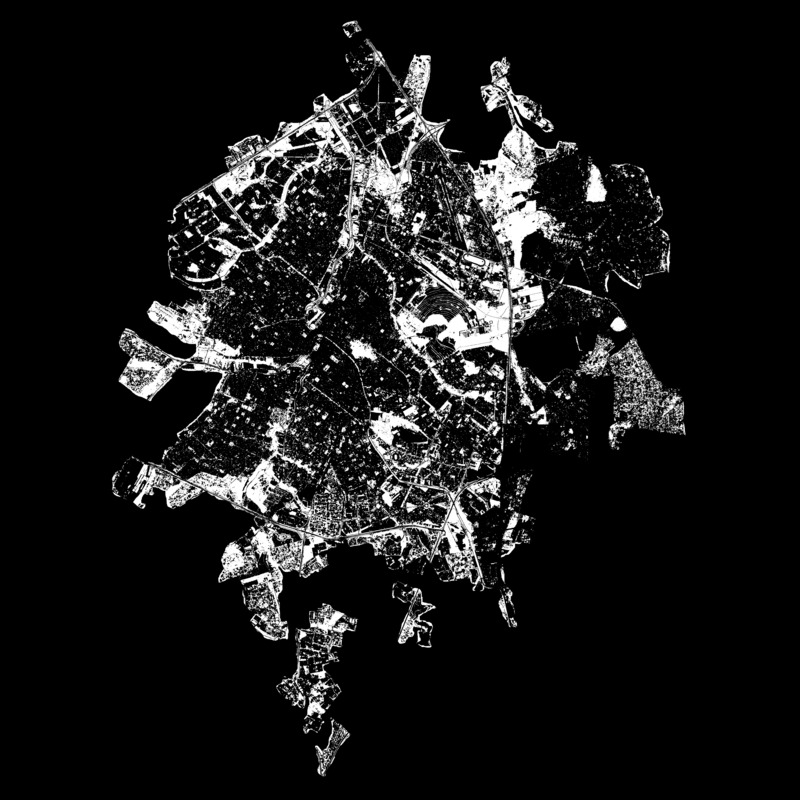
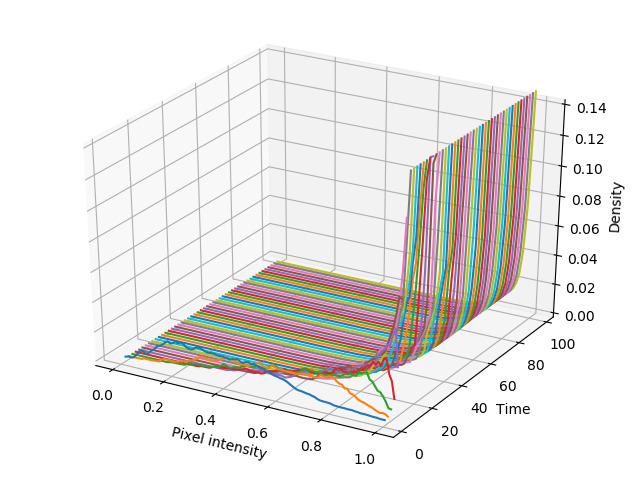
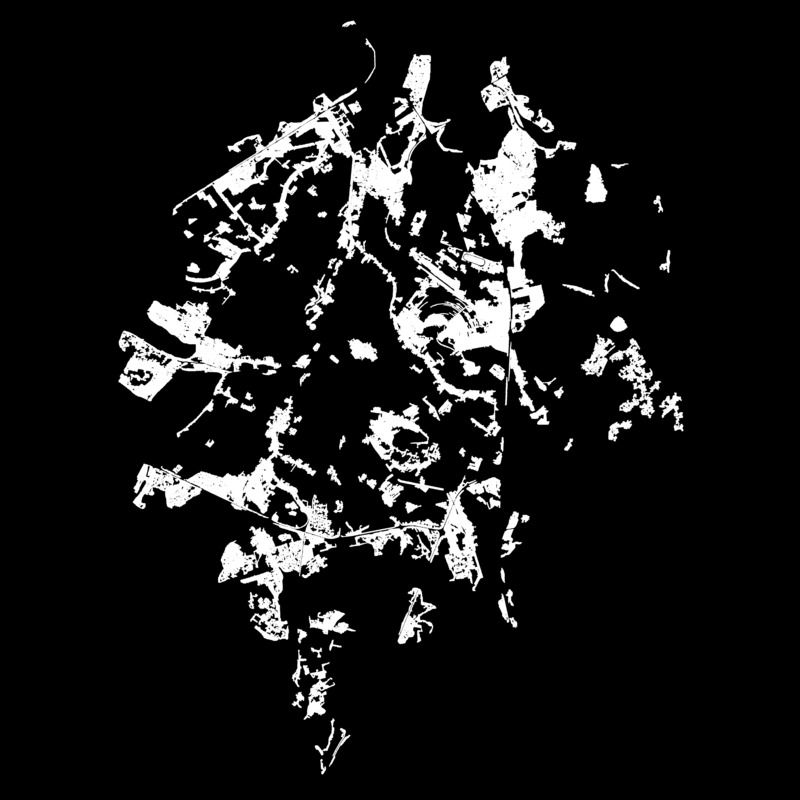
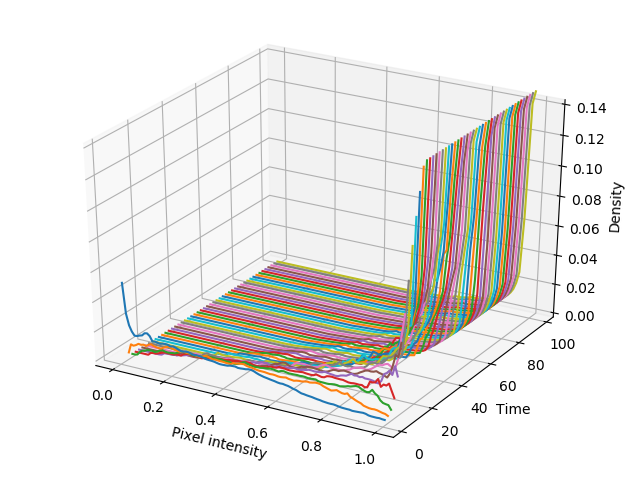
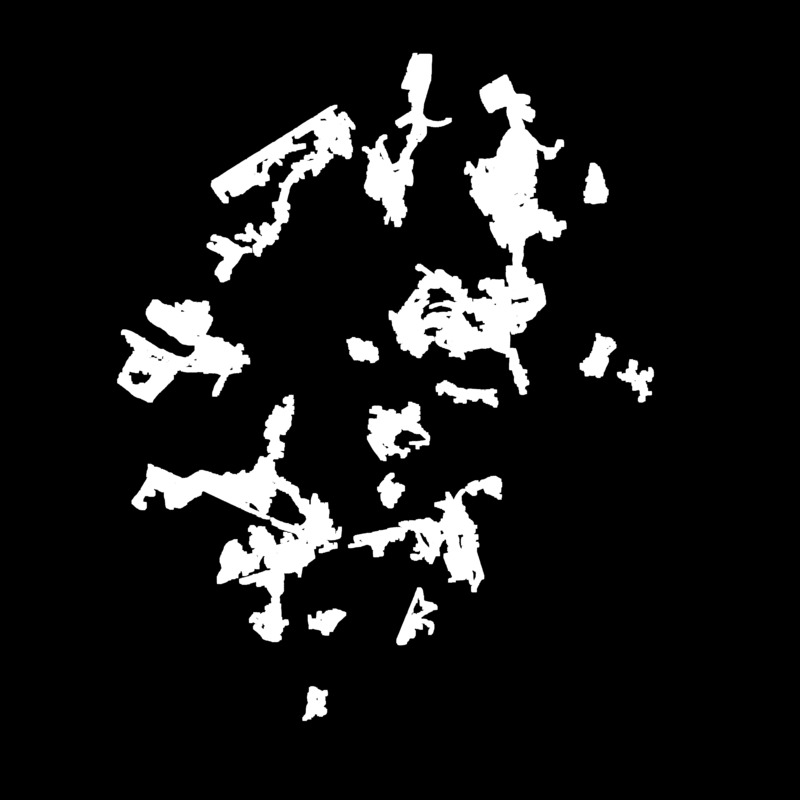
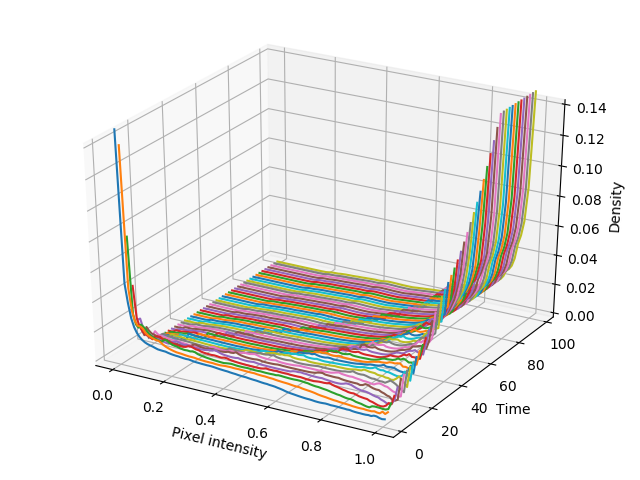
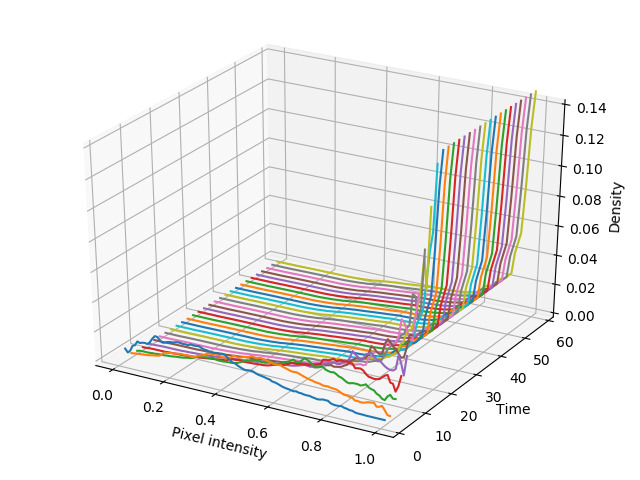
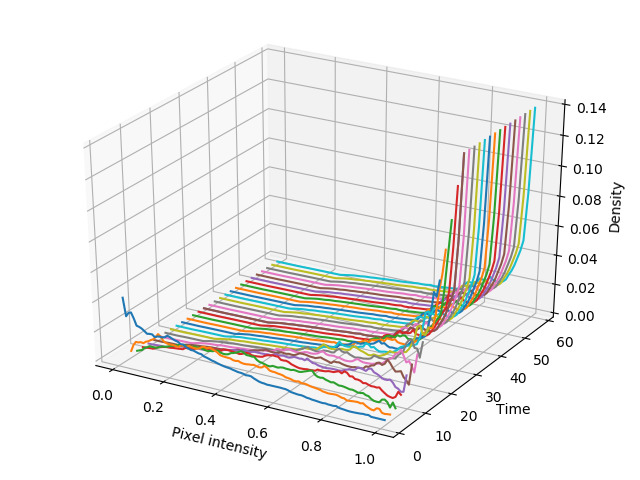
Interestingly, though corresponding to a ubiquitous phenomenon in nature, diffusion dynamics can vary in surprising manners depending on the spatial distribution and size of the green sources. This important issue is illustrated in Figure 3, which depicts three distinct distributions of green regions but with the same total green area. The three considered types of green spatial distributions can be summarized as: (a) a single, large connected area, for instance as corresponding to parks and squares; (b) a branched distribution of vegetation, as typically observed around rivers and streams; and (c) a large number of relatively small vegetation areas, as in gardens and backyards, distributed in a nearly uniform manner. Also shown in Figure 3 are waterfall diagrams containing the histograms of the diffused green effect along time, given by the concentration of pixels, respectively to each of the three considered configurations.

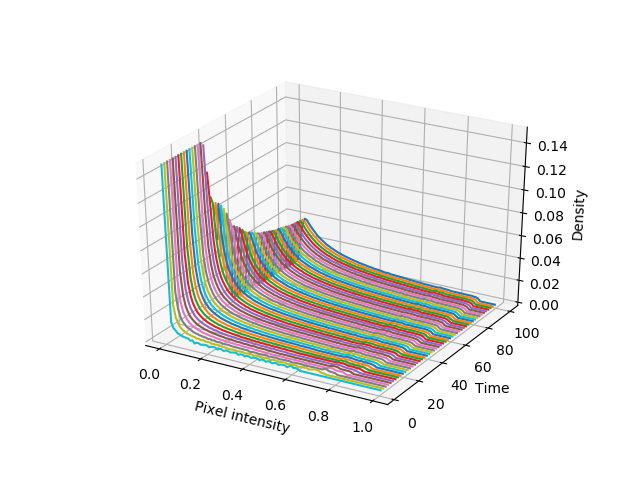
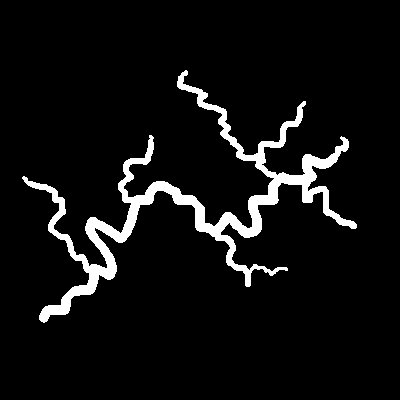
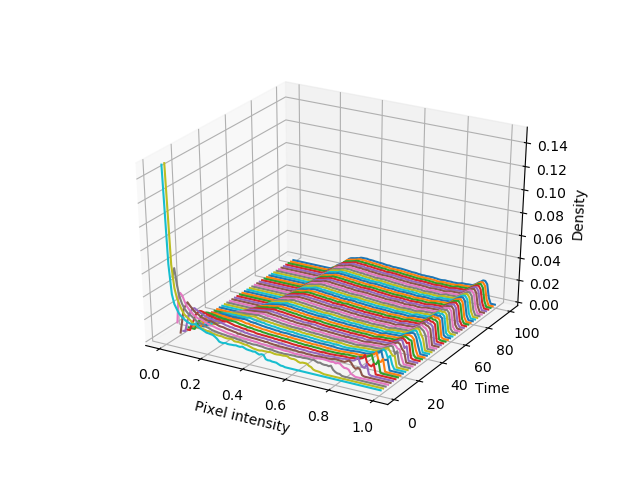
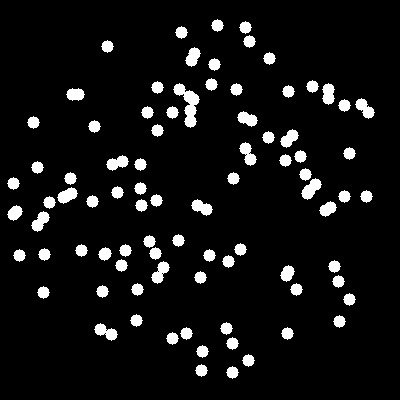
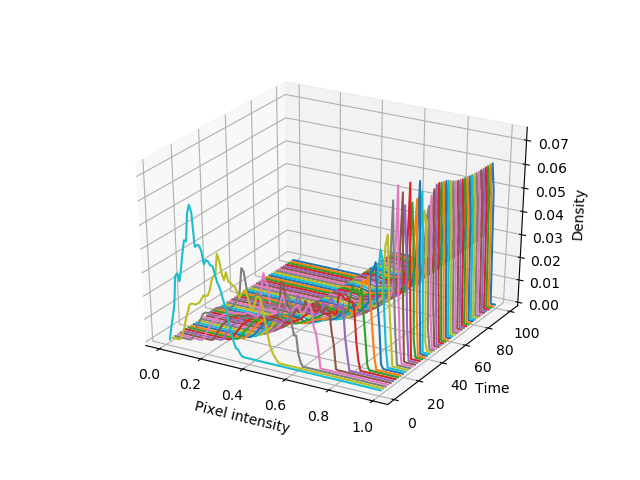
The first important result is that quite distinct green diffusion profiles can be obtained with respect to each of the three types of spatial distribution. The case involving a single, large green area led to histograms indicating large frequency of relatively low diffused effects, therefore corresponding to a little effective influence of the green region as gauged by diffusion. The branched case yielded a relatively more effective diffusion, with histograms being shifted to the right. However, the third type of green spatial distribution, involving a relatively uniform spreading of small vegetation areas, resulted in the most effective diffusion of green effects, being substantially distinct from the other two types of distribution types. This result is particularly important with respect to the present work because: (i) it shows that the diffusion can critic and abruptly vary in non-intuitive manner depending on the size and spatial spread of the green areas; (ii) the most effective diffusion of a total green area takes place for several small regions distributed in nearly uniform manner.
4 Results and discussion
4.1 Dataset and implementation details
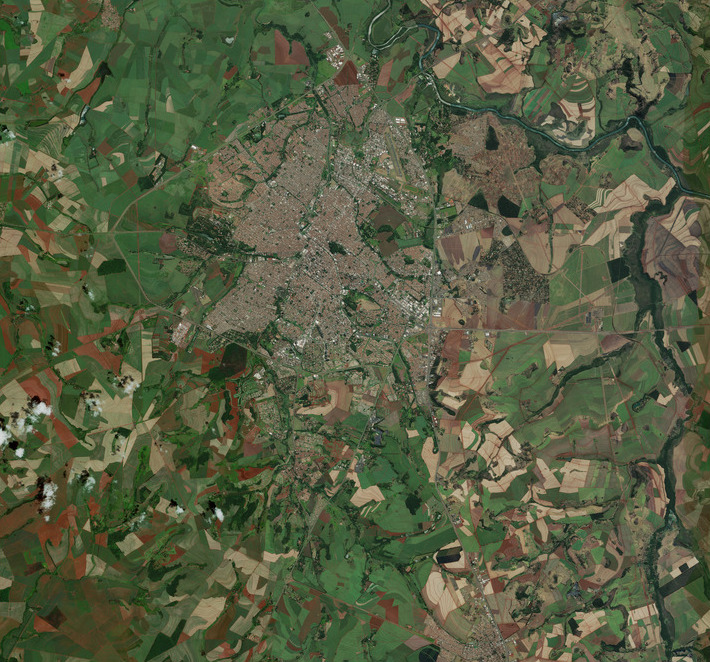
To illustrate the proposed methodology, we select a Brazilian city, Ribeirão Preto, from São Paulo state, with 711,825 inhabitants. It was founded in 1856, and has a total area of 650.916. Furthermore, the region has a tropical climate.
Our methodology starts by acquiring satellite images, identifying green areas, and analyzing a dynamical process considering this topology. The satellite images used in this study were obtained using the Mapbox Raster Tiles API [25], with the zoom at level 18, which corresponds to the resolution of approximately 0.6 m/pixel, providing high-resolution images from the entire region of the city. With this resolution, a total of 49911 tile images were acquired to compose the entire region of the city. The three-band RGB color images, with size 512 x 512 each, were obtained in the year 2018.
As mentioned in Section 3.1 a ground-truth dataset was generated using the online annotator tool Supervisely [33]. A total of 150 images were annotated and for each image, polygons covering the area of interest were generated and mapped into binary labels. Applying rotations of 90, 180 and 270 degrees to augment available data for model training, a total of 600 images were used and then divided into training, validation and test sets with and split proportions respectively.
The model was implemented in python using Keras and Tensorflow libraries. The Adam optimizer was used in the network training with a learning rate 0.00015 and the dice coefficient loss function. The number of epochs was set to 100 and the mean dice coefficient reached on the test dataset. Here we applied a threshold of 0.6 to consider a pixel as belonging to a green area. The segmentation experiments were carried out in Graphics Processing Units (GPU) GeForce GTX 1080 Ti. Training the neural network took approximately 3 hours in this hardware.
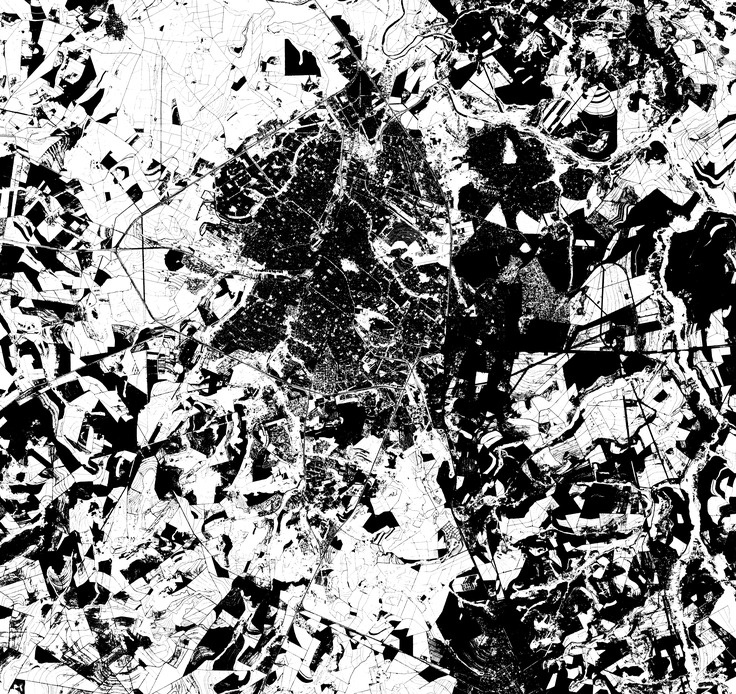
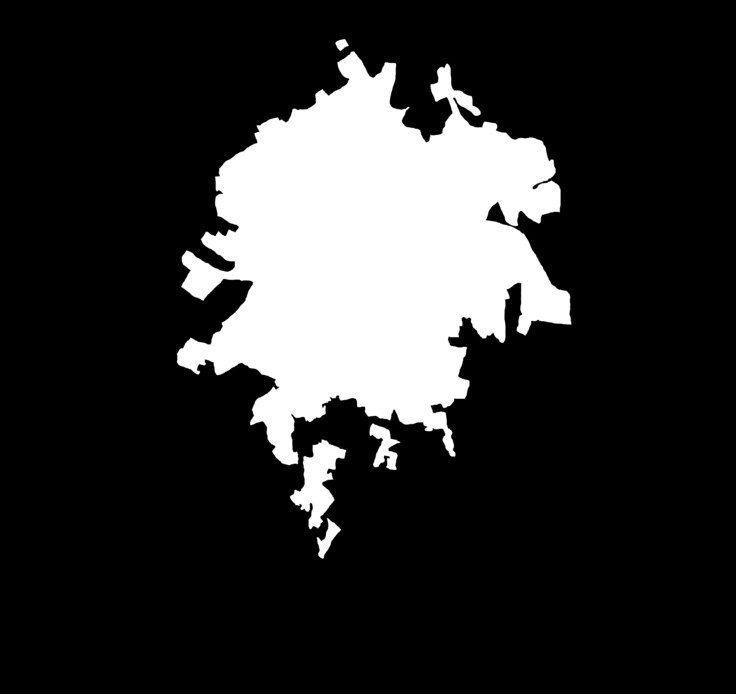
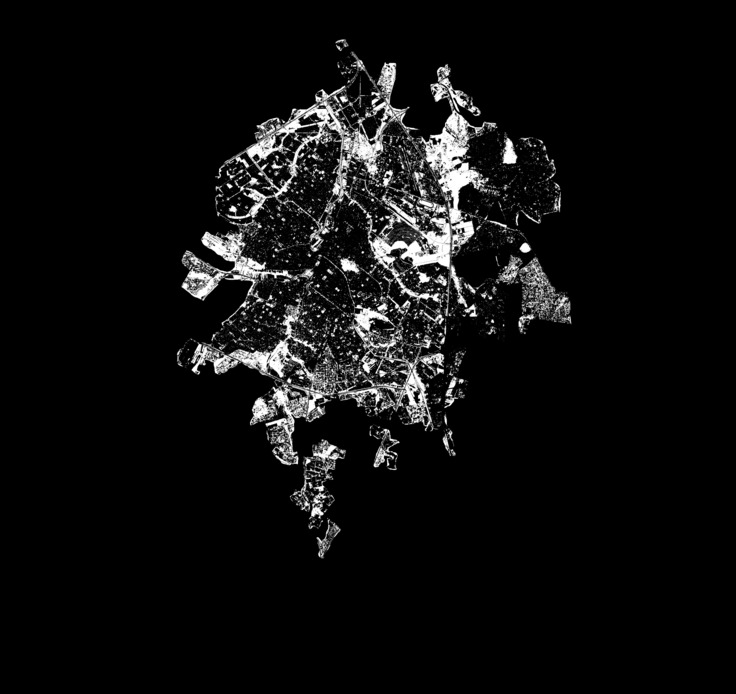
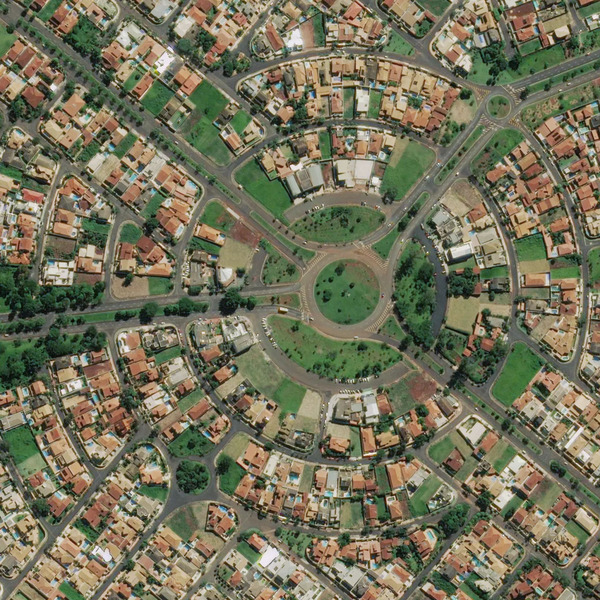
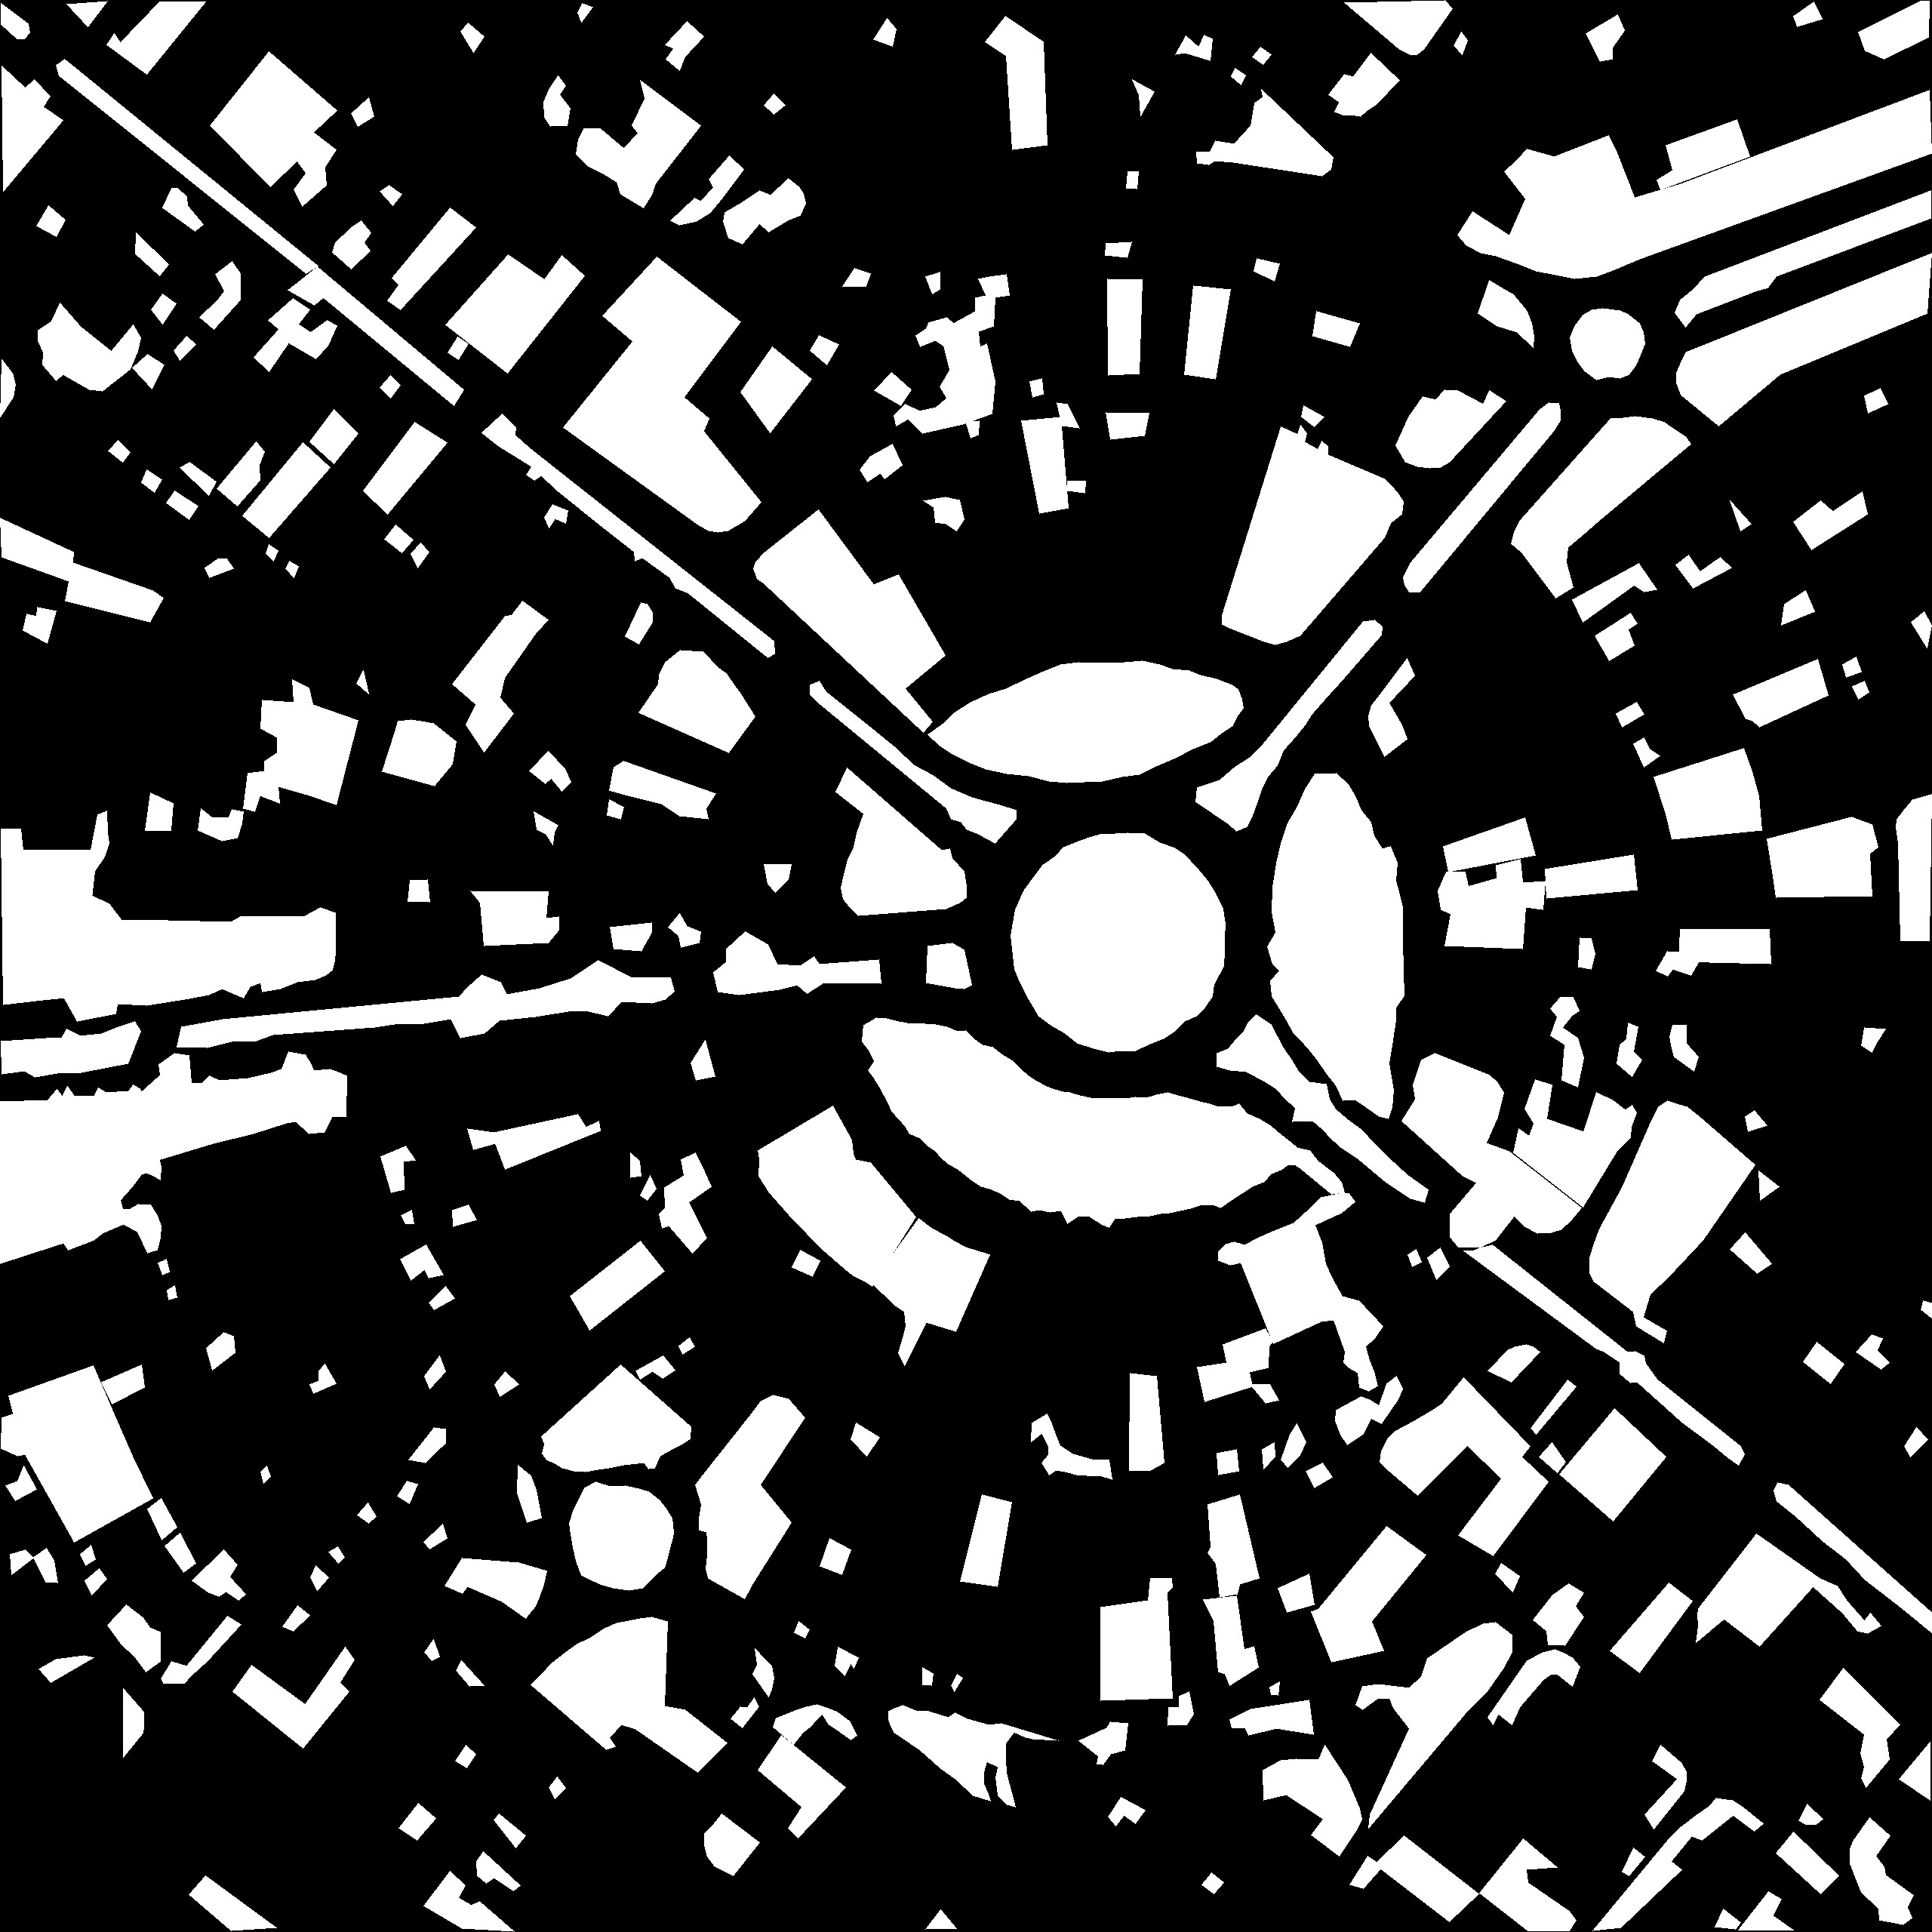
An example of segmentation of the green regions in the satellite image of Ribeirão Preto (Figure 4a) according to the adopted methodology (Section 3.2) is shown in white in Figure 4(b). Rural areas were removed using a mask (Figure 4c) that is applied to the segmentation result, yielding the result shown in Figure 4(d). This mask was obtained by manual segmentation of the estimated urban region.
4.2 Diffusion of the green effects
The process described in Section 3.4 was applied to the considered green areas of the urban region of Ribeirão Preto, comprised by the adopted mask. The image was downsampled by the original image, resulting in a frame of size . A gaussian kernel of mean 0 and standard deviation of 201 was considered in the diffusion. The process was evaluated for 100 steps.
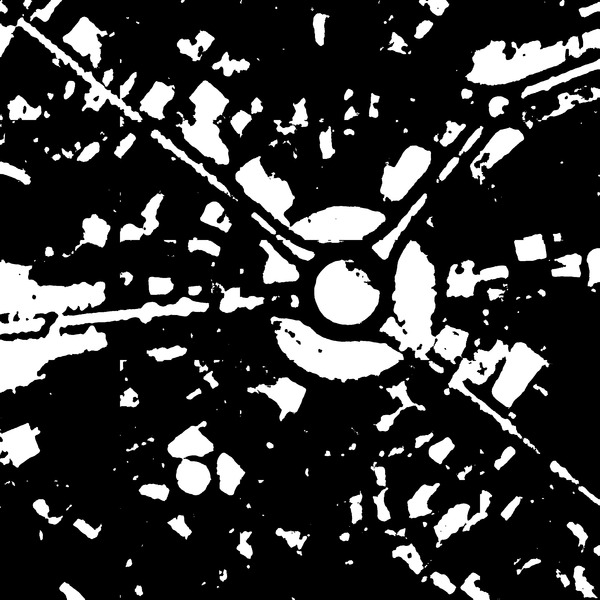
In order to study the effect of the green region area on the overall diffusion, we consider not only all the identified green area, shown in Figure 6(a), but also two additional images obtained by removing the green regions with area smaller than or equal to , where is the typical size of a tree (Figure 5(a)) and in Figure 5(b) by removing medium-sized green regions with area smaller than or equal to , where is the typical size of a block. However, given that the removal of the small and medium sized green regions effectively reduces the overall green area in those images, it would not be proper to compare the diffusion effects between them. In order to ensure identical overall green areas in the three compared images, we dilated the two thresholded images until they all had the same area as the original image in Figure 6(a). These dilated images are depicted in 6(a) and 6(b), respectively to the removal of small and medium sized green regions.
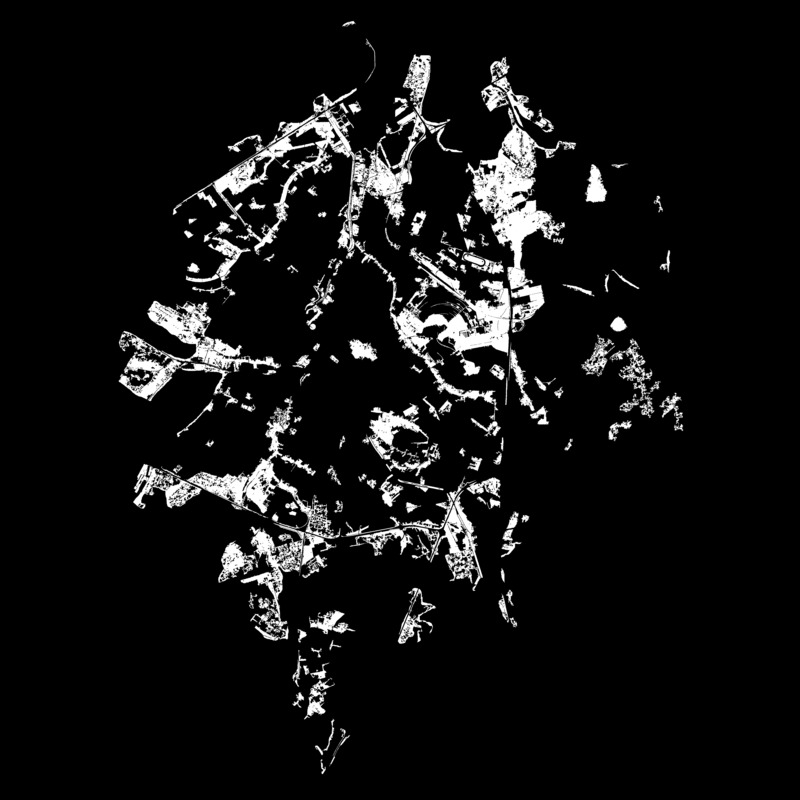
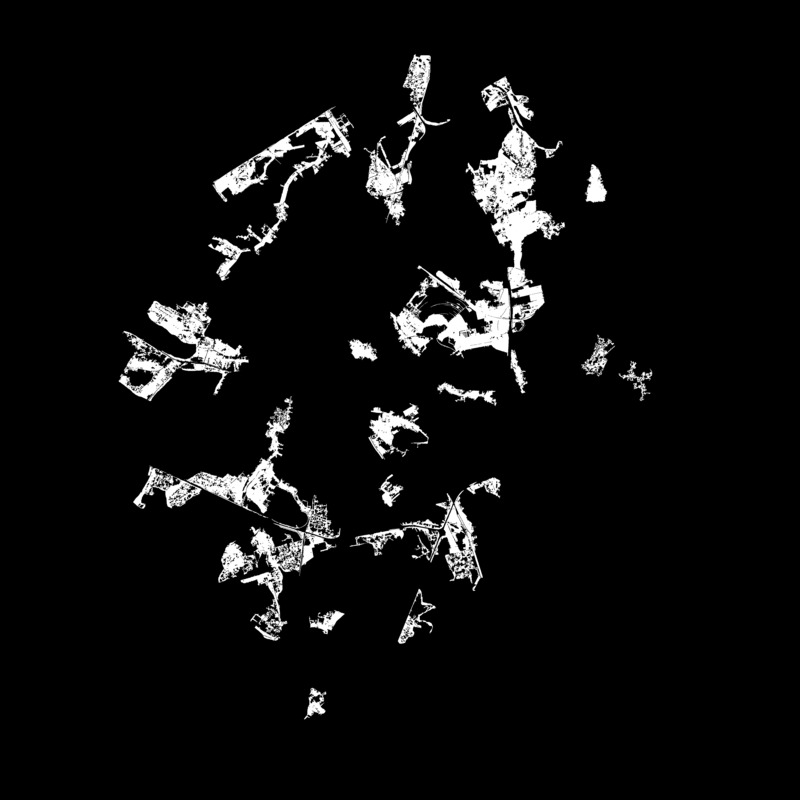
Figure 6 presents the green diffusion results obtained for: (i) the full resolution image of green regions; (ii) the same region after removing connected components smaller than or equal to and (iii) the region in (i) after removing all connected component smaller than or equal to . The consideration of these three situations allows the verification of the effect of the smaller regions on the overall diffusion dynamics.
The results obtained in all the three considered situations confirm the effect of diffusion of the green effects, verified in the progressive right-shift of the mass of the histograms in the waterfall plots along time. However, in case (i) the diffusion takes place at a much faster rate, reaching saturation after about 20 diffusion steps. Contrariwise, the situation in (iii) is completely different, with rather slow right-shifting of the mass in the histograms. Situation (ii) represents an intermediate result, but with saturation being observed only after 40 diffusion steps.
These results are in full agreement with our previous experiments in Section 3.4, corroborating further the particularly important effect of the spatial distribution of the green areas on the velocity in which the green effects diffusion can take place. From a real-world perspective, these results suggest that smaller patches of vegetation may play an important role as far as diffusion of green effects as modeled in the present work are concerned.
4.3 Validation of the detected green areas
It is important to analyze the impact of the quality of the segmentation on the results obtained by the diffusion process. To this end, portions of the city with different visual distributions of green have been chosen. We considered regions equivalent to tiles, resulting in images of size . These regions were manually annotated and we simulated the green diffusion on these images. The results were individually compared to the same process but considering the green areas identified by the DL model. Figure 7 shows one of the chosen regions and the corresponding diffusion process on the manually identified green areas and on the automatically identified green areas. It can be seen significant accordance of the two results, which indicate the good quality of the green areas identified by the DL model.
5 Conclusions
The presence of green patches in urban regions motivates several important and interesting research possibilities, which may involve temperature, carbon storage, economic value of the properties, etc.
Given that a good deal of the influence of green regions in an urban environment take place through diffusion (e.g. temperature variations, oxygen and other gases displacement, as well as air humidity), it becomes interesting to simulate the diffusion of these effects from green regions in segmented areas of cities.
The present work reported a related approach. First, satellite images have their green regions identified and treated as sources of diffusion. Then, diffusion is simulated by using a numerical approach, more specifically successive convolutions with a gaussian kernel. After the diffusion has become nearly stable, histograms of the respectively achieved concentrations at each of the considered pixels are obtained. These histograms provide a particularly effective means for gauging the diffusion of green effects given particular regions and cities of interest.
One particularly interesting question implied by diffusion dynamics concerns the fact that distinct spatial distributions of the green sources can have an unpredictable and even surprising effect. This has been illustrated with respect to three hypothetical images containing the same total green area distributed as a single compact area, a branched structure remindful of rivers and streams, as well as an almost uniform distribution of small patches of green regions. Interestingly, the histograms of green effects obtained in each of these three cases are markedly distinct, with the latter configuration accounting for the most effective diffusion.
As a case example illustrating the proposed methodology, we take into account the Brazilian city of Ribeirão Preto. In order to study the effect of the size of the the green regions, we thresholded the respectively obtained green regions so as to remove the small and medium sized areas, while special care (dilation of the threshold images) is applied in order that all the three compared configurations have the same total green area. The respectively obtained simulation results suggest that the incorporation of small and medium-sized green regions could have a significant effect in boosting the diffusion of green effects.
It should be kept in mind that the obtained results are respective to the dynamics of diffusion as simulated numerically considering specifically adopted city and parameter configurations in simplified settings (e.g. absence of wind and other external influences). In addition, it should be kept in mind that the considered diffusion dynamics is more closely related only to some of the various important roles of green regions in urban areas. In other words, the obtained results related potentially to the aspects of temperature, humidity and gases exchanges, not being directly associated to other important issues such as providing shelter for animal life, leisure, landscaping, rain absorption, biodiversity, etc. These diverse dynamics present other characteristics not modeled by diffusion, such as the need for larger green areas required for animal life, etc. Additional research is required for validating and extending the reported results with respect to more realistic and diverse configurations.
The methodology and results described in the present work pave the way to several interesting subsequent related studies. For instance, it would be interesting to compare the diffusion dynamics with other types of physical dissemination, such as progressive dilation of regions as observed when expanding or reducing the areas of parks. Another interesting possibility regards the incorporation of effects caused by external effects, such as wind. It would also be interesting to enhance the segmentation methodology so as to be able to distinguish between different types of green regions (e.g. trees, lawns, and bushes), as well as their respective conditions (e.g. dry or wet seasons).
Acknowledgments
Eric K. Tokuda thanks Fapesp for sponsorship (grant #2019/01077-3). Henrique F. de Arruda acknowledges FAPESP for sponsorship (grant # 2018/10489-0). Cesar H. Comin thanks FAPESP (grant no. 18/09125-4) for financial support. Luciano da F. Costa thanks CNPq (grant # 307085/2018-0) and NAP-PRP-USP for sponsorship. This work received financial support of the São Paulo Research Foundation (FAPESP) grant #2015/22308-2. We are also grateful to Conselho Nacional de Pesquisa (CNPq) and CAPES.
References
- [1] Siti Nor Khuzaimah Binti Amit, Soma Shiraishi, Tetsuo Inoshita, and Yoshimitsu Aoki. Analysis of satellite images for disaster detection. In 2016 IEEE International Geoscience and Remote Sensing Symposium (IGARSS), pages 5189–5192. IEEE, 2016.
- [2] Andre L Barbieri, GF De Arruda, Francisco A Rodrigues, Odemir M Bruno, and Luciano da Fontoura Costa. An entropy-based approach to automatic image segmentation of satellite images. Physica A: Statistical Mechanics and its Applications, 390(3):512–518, 2011.
- [3] Jinhu Bian, Ainong Li, Guangbin Lei, Zhengjian Zhang, and Xi Nan. Global high-resolution mountain green cover index mapping based on landsat images and google earth engine. ISPRS Journal of Photogrammetry and Remote Sensing, 162:63–76, 2020.
- [4] Sébastien Bonthoux, Simon Chollet, Ianis Balat, Nicolas Legay, and Lolita Voisin. Improving nature experience in cities: What are people’s preferences for vegetated streets? Journal of environmental management, 230:335–344, 2019.
- [5] Mehmet Cetin. Using gis analysis to assess urban green space in terms of accessibility: case study in kutahya. International Journal of Sustainable Development & World Ecology, 22(5):420–424, 2015.
- [6] Alexandre Constantin, Jian-Jiun Ding, and Yih-Cherng Lee. Accurate road detection from satellite images using modified u-net. In 2018 IEEE Asia Pacific Conference on Circuits and Systems (APCCAS), pages 423–426. IEEE, 2018.
- [7] Thomas M Cover. Elements of information theory. John Wiley & Sons, 1999.
- [8] John Crank. The mathematics of diffusion. Oxford university press, 1979.
- [9] Yaoping Cui, Xiangming Xiao, Russell B Doughty, Yaochen Qin, Sujie Liu, Nan Li, Guosong Zhao, and Jinwei Dong. The relationships between urban-rural temperature difference and vegetation in eight cities of the great plains. Frontiers of Earth Science, 13(2):290–302, 2019.
- [10] Teddy Dawson, JS Sandoval, Vasit Sagan, and Thomas Crawford. A spatial analysis of the relationship between vegetation and poverty. ISPRS International Journal of Geo-Information, 7(3):83, 2018.
- [11] Lenore Fahrig. Why do several small patches hold more species than few large patches? Global Ecology and Biogeography, 29(4):615–628, 2020.
- [12] Reza Zanjirani Farahani, Maryam SteadieSeifi, and Nasrin Asgari. Multiple criteria facility location problems: A survey. Applied mathematical modelling, 34(7):1689–1709, 2010.
- [13] Neil Flood, Fiona Watson, and Lisa Collett. Using a u-net convolutional neural network to map woody vegetation extent from high resolution satellite imagery across queensland, australia. International Journal of Applied Earth Observation and Geoinformation, 82:101897, 2019.
- [14] Antonela Gioia, Leonardo Paolini, Agustina Malizia, Rosa Oltra-Carrió, and Jose Antonio Sobrino. Size matters: vegetation patch size and surface temperature relationship in foothills cities of northwestern argentina. Urban ecosystems, 17(4):1161–1174, 2014.
- [15] Zhichao He, Lishan Xiao, Qinghai Guo, Yong Liu, Qizheng Mao, and Peter Kareiva. Evidence of causality between economic growth and vegetation dynamics and implications for sustainability policy in chinese cities. Journal of Cleaner Production, 251:119550, 2020.
- [16] Leonid Ivanovsky, Vladimir Khryashchev, Vladimir Pavlov, and Anna Ostrovskaya. Building detection on aerial images using u-net neural networks. In 2019 24th Conference of Open Innovations Association (FRUCT), pages 116–122. IEEE, 2019.
- [17] Sara Janhäll. Review on urban vegetation and particle air pollution–deposition and dispersion. Atmospheric environment, 105:130–137, 2015.
- [18] Kai Jin, Fei Wang, and Pengfei Li. Responses of vegetation cover to environmental change in large cities of china. Sustainability, 10(1):270, 2018.
- [19] Salman H Khan, Xuming He, Fatih Porikli, and Mohammed Bennamoun. Forest change detection in incomplete satellite images with deep neural networks. IEEE Transactions on Geoscience and Remote Sensing, 55(9):5407–5423, 2017.
- [20] Jonathan Long, Evan Shelhamer, and Trevor Darrell. Fully convolutional networks for semantic segmentation. In Proceedings of the IEEE conference on computer vision and pattern recognition, pages 3431–3440, 2015.
- [21] Matthew Maimaitiyiming, Abduwasit Ghulam, Tashpolat Tiyip, Filiberto Pla, Pedro Latorre-Carmona, Ümüt Halik, Mamat Sawut, and Mario Caetano. Effects of green space spatial pattern on land surface temperature: Implications for sustainable urban planning and climate change adaptation. ISPRS Journal of Photogrammetry and Remote Sensing, 89:59–66, 2014.
- [22] Mapbox. Mapbox. https://www.mapbox.com/, 2010 (Accessed 01 July 2020).
- [23] Lorien Nesbitt, Michael J Meitner, Cynthia Girling, Stephen RJ Sheppard, and Yuhao Lu. Who has access to urban vegetation? a spatial analysis of distributional green equity in 10 us cities. Landscape and Urban Planning, 181:51–79, 2019.
- [24] OpenStreetMap. Tileset. [https://wiki.openstreetmap.org/wiki/Slippy_map_tilenames/, 2018 (Accessed 01 July 2020).
- [25] OpenStreetMap. Tileset. [https://docs.mapbox.com/api/maps/raster-tiles/, 2018 (Accessed 15 July 2020).
- [26] Otso Ovaskainen. Long-term persistence of species and the sloss problem. Journal of Theoretical Biology, 218(4):419–433, 2002.
- [27] Yin Ren, Xing Wei, Xiaohua Wei, Junzhong Pan, Pingping Xie, Xiaodong Song, Dan Peng, and Jingzhu Zhao. Relationship between vegetation carbon storage and urbanization: a case study of xiamen, china. Forest Ecology and Management, 261(7):1214–1223, 2011.
- [28] Mirela Robitu, Marjorie Musy, Christian Inard, and Dominique Groleau. Modeling the influence of vegetation and water pond on urban microclimate. Solar energy, 80(4):435–447, 2006.
- [29] Olaf Ronneberger, Philipp Fischer, and Thomas Brox. U-net: Convolutional networks for biomedical image segmentation. In International Conference on Medical image computing and computer-assisted intervention, pages 234–241. Springer, 2015.
- [30] Karsten Rusche, Mario Reimer, and Rico Stichmann. Mapping and assessing green infrastructure connectivity in european city regions. Sustainability, 11(6):1819, 2019.
- [31] Santiago Saura and Lucía Pascual-Hortal. A new habitat availability index to integrate connectivity in landscape conservation planning: comparison with existing indices and application to a case study. Landscape and urban planning, 83(2-3):91–103, 2007.
- [32] Herbert Sukopp and Angela Wurzel. The effects of climate change on the vegetation of central european cities. Urban habitats, 1, 2003.
- [33] Supervisely. Supervisely. [https://supervise.ly/, 2018 (Accessed 01 July 2020).
- [34] Kazuya Takahashi, Harunori Yoshida, Yuzo Tanaka, Noriko Aotake, and Fulin Wang. Measurement of thermal environment in kyoto city and its prediction by cfd simulation. Energy and Buildings, 36(8):771–779, 2004.
- [35] Hideki Takebayashi. Influence of urban green area on air temperature of surrounding built-up area. Climate, 5(3):60, 2017.
- [36] Xiaowei Tong, Martin Brandt, Yuemin Yue, Stephanie Horion, Kelin Wang, Wanda De Keersmaecker, Feng Tian, Guy Schurgers, Xiangming Xiao, Yiqi Luo, et al. Increased vegetation growth and carbon stock in china karst via ecological engineering. Nature sustainability, 1(1):44–50, 2018.
- [37] Thoreau R Tooke, Brian Klinkenberg, and Nicholas C Coops. A geographical approach to identifying vegetation-related environmental equity in canadian cities. Environment and Planning B: Planning and Design, 37(6):1040–1056, 2010.
- [38] Yong Wang, Dongfang Zhang, and Guangming Dai. Classification of high resolution satellite images using improved u–net. International Journal of Applied Mathematics and Computer Science, 30(3):399–413, 2020.
- [39] Yang Xing and Peter Brimblecombe. Role of vegetation in deposition and dispersion of air pollution in urban parks. Atmospheric Environment, 201:73–83, 2019.
- [40] Zhiyu Xu, Yi Zhou, Shixin Wang, Litao Wang, Feng Li, Shicheng Wang, and Zhenqing Wang. A novel intelligent classification method for urban green space based on high-resolution remote sensing images. Remote Sensing, 12(22), 2020.
- [41] Xiuying Zhang, Taiyang Zhong, Xuezhi Feng, and Ke Wang. Estimation of the relationship between vegetation patches and urban land surface temperature with remote sensing. International Journal of Remote Sensing, 30(8):2105–2118, 2009.
- [42] Xiao Xiang Zhu, Devis Tuia, Lichao Mou, Gui-Song Xia, Liangpei Zhang, Feng Xu, and Friedrich Fraundorfer. Deep learning in remote sensing: A comprehensive review and list of resources. IEEE Geoscience and Remote Sensing Magazine, 5(4):8–36, 2017.