Testing homogeneity of the galaxy distribution in the SDSS using Renyi entropy
Abstract
We analyze a set of volume limited sample of galaxies from the SDSS to study the issue of cosmic homogeneity. We use the Renyi entropy of different order to probe the inhomogeneties present in the galaxy distributions. We also calculate the Renyi diveregence to quantify the deviations of the galaxy distribution from a homogeneous Poisson distribution on different length scales. We separately carry out the analysis using the overlapping spheres and the independent voxels. Our analysis suggests that the scale of homogeneity is underestimated in the smaller galaxy samples due to the suppression of inhomogeneities by the overlapping of the measuring speheres. We find that an analysis with the independent voxels and/or use of a significantly larger galaxy sample can help to circumvent or mitigate this problem. Combining the results from these analyses, we find that the galaxy distribution in the SDSS becomes homogeneous on a length scale beyond .
1 Introduction
The statistical homogeneity and isotropy on large scales is a fundamental prerequisite to our current understanding of the Universe. The standard cosmological model heavily relies on this assumption. The assumption is not provable in a mathematical sense and can be only tested against various cosmological observations. The galaxies are the basic units of the large-scale structures in the Universe. The distribution of galaxies trace the large-scale distribution of matter in the Universe. The present generation galaxy surveys [1, 2] reveal that the galaxies are embedded in a highly inhomogeneous complex weblike network of filaments, sheets and clusters surrounded by nearly empty regions. It is important to test if the galaxy distribution exhibit a transition to homogeneity on sufficiently large-scales.
The homogeneous and isotropic FRW space-time geometry provides great simplicity and ease in describing the global structure of the Universe. In modern cosmology, the FRW geometry is indispensable for analysis and interpretation of data from the cosmological observations. The FRW geometry is a mathematical idealization and requires validation from observations. The present day observable Universe is believed to have originated from the tiny primordial inhomogeneities imprinted on the CMBR maps. The inhomogeneous distribution of matter in the present Universe is a product of the amplification of these seed inhomogeneities by gravity. The inhomogeneity of the matter distribution is thus inherent and are expected to be present upto certain length scales. However, if the inhomogeneities persist on the largest length scales then it would have several implications for cosmology. The inhomogeneities, by virtue of their backreaction on the metric may provide an alternate explanation for the observed cosmic acceleration [3, 4, 5, 6, 7]. The inhomogeneous cosmological models have been explored in a number of comprehensive reviews [8, 9, 10].
Many observations such as the CMBR [11, 12, 13], radio sources [14, 15], X-ray background [16, 17, 18], Gamma ray bursts [19, 20], supernovae [21, 22] and galaxies [23, 24, 25] support the isotropy of the Universe. The homogeneity and isotropy of the Universe are two different aspects which may or may not simultaneously hold for our Universe. So it is important to validate the assumption of homogeneity using various cosmological observations. The homogeneity of the Universe is comparatively more difficult to confirm. This is caused by the difficulty in distinguishing the spatial variation from temporal evolution in the past light cone and the redshift-dependent selection effects in the sample. So testing the statistical homogeneity of the Universe on very large-scales is a challenging task. One may minimize these effects by focusing only on the galaxy distribution in the nearby Universe which may be approximately treated as a constant time spatial hypersurface.
The study of homogeneity with galaxy distribution has a long history dating back to 80s and 90s when the spectroscopic data were made available by first generation galaxy redshift surveys. Early studies show that the galaxy distributions exhibit a fractal nature with a scale invariant behaviour on small scales [26, 27, 28]. Such scale-invariant feature of the galaxy distribution are shown to exist even on large scales by a number of studies [26, 27, 29, 30, 31, 32, 33]. The existence of the fractal nature of the galaxy distribution out to the scale of the survey is clearly in disagreement with the assumption of homogeneity. But many other studies, though confirm the fractal nature of the galaxy distribution on small scales, reported that the galaxy distribution is homogeneous on scales [34, 35, 36, 37, 38, 39, 40, 41, 42, 43, 44, 45, 46].
The present day Universe exhibits a hierarchy of structures where galaxies are assembled into groups and clusters which are then interwoven into larger filamentary superclusters. Gott et al. [47] identified the Sloan Great Wall (SGW) in the SDSS which nearly extends upto Mpc. Clowes et al. [48] reported the existence of a large quasar group (LQG) spanning more than at . Observations suggest that there exists enormous empty regions such as the Eridanus void stretching across Mpc [49] and the KBC void which is a nearly spherical void with diameter of Mpc [50]. Existence of such coherent large-scale structures may pose a challenge to the assumptions of homogeneity and isotropy and the statistical significance of any such structures must be assessed carefully [51, 44].
The multi-fractal analysis of the galaxy distribution [52, 27, 35, 38, 40] remains one of the most popular method for the study of homogeneity. It is based on the scaling of different moments of the number counts of galaxies in spheres centered around the galaxies. The Renyi dimension [53] or the generalized dimension [54] can be used to characterize multi-fractals. A mono-fractal can be considered as homogeneous when it has the same generalized dimension for different moments and all these generalized dimensions coincide with the ambient dimension. But an accurate measurement of generalized dimension or Renyi dimension are hard to achieve due to the finite and discrete nature of the galaxy distributions and the limit in these definitions [55]. Pandey [56] propose an alternative statistical measure based on the count-in-spheres statistics and Shannon entropy [57] and use it to measure the scale of homogeneity in the Main Galaxy sample [45], LRG sample [46] and quasar sample [59] from the SDSS. Renyi [60] provided a more generalized concept of entropy which can be used to quantify the uncertainty or randomness of a system. The Renyi entropy includes the Shannon entropy as a special case. The Shannon entropy is represented by the Renyi entropy of order one. The Renyi entropies of higher order are increasingly determined by the events with higher probability. Naturally, they are more sensitive to the inhomogeneities present in a distribution. Recently, Pandey [62] defined a measure of homogeneity based on the Renyi entropy.
The Sloan Digital Sky Survey (SDSS) is the most successful redshift survey of all times. It has measured the photometric and spectroscopic information of millions of galaxies, which revolutionized our knowledge about the large-scale structures in the Universe. The high quality and volume of data provided by the SDSS has led to us to an era where many important cosmological questions can be addressed in a manner which were never possible before. The SDSS has reveled the three-dimensional distribution of galaxies in the nearby Universe in its full glory.
In the present work, we employ a Renyi entropy based measure [62] to study the issue of homogeneity using the SDSS main galaxy sample. We compare our findings against the results obtained from the previous studies.
The plan of the paper is the following. We outline our method in Section 2 and describe the data in section 3. The results and conclusions of the analysis are presented in Section 4.
2 Method of Analysis
The Renyi entropy [60] provides a more generalized concept
of entropy which was originally proposed by Alfred Renyi. The Renyi
entropy associated with a discrete random variable is given by,
| (2.1) |
, where is the probability of outcome and . We have with a total outcomes. It can be shown that for , the Renyi entropy is same as the Shannon entropy. The Renyi entropy is a mildly decreasing function of . For higher values of , the Renyi entropy is increasingly decided by the the events with higher probabilities. So the higher order Renyi entropies are more sensitive to inhomogeneitis as compared to the Shannon entropy. If probabilities of all the events become equal then we have independent of the order of the Renyi entropy. Pandey [62] propose a simple measure of homogeneity for galaxy distribution based on this property of Renyi entropy.
The Renyi dimension or the generalized dimension [53]
is a widely used measure of homogeneity. The Renyi dimension of order
is defined as,
| (2.2) |
Here is the scaling factor. The limit in this definition can not be achieved in a meaningful way in galaxy samples with finite number of galaxies. This often leads to inaccuracies in the measured spectrum of the generalized dimension. The Renyi dimension is estimated for both the positive and the negative values of . The positive and the negative values of assign greater weights to the overdense and the underdense regions respectively. In a finite sample, the generalized dimension for the negative values of are very sensitive to the underdensities present in the sample [63]. This may dramatically affect the generalized dimension for making it difficult to distinguish empty space from regions with large underdensities. The method used in the present analysis is based only on the maximization of uncertainty. It does not require any such limit and is restricted to only positive values of . The generalized dimension is also prone to the effects of survey geometry and incompleteness [43, 64] whereas the normalized entropies are less susceptible to these issues [45].
Given a distribution of galaxies over a volume , we
consider a sphere of radius centered around each galaxies and
count the number of galaxies within it. The number count
around the galaxy is given by,
| (2.3) |
, where is the Heaviside step function. Here
and are the radius vector corresponding to the
and galaxies respectively. The number counts for the galaxies
near the boundary of the volume will be smaller due to partial
coverage. We take into account this effect by ignoring all the centers
which lie within a distance from the boundary of the volume. This
provides us with a finite number of centers for each specific
radius . The number of available centres will decrease with the
increasing radius due to the finite volume occupied by the
distribution. These centres at each can be used to
calculate the Renyi entropies of the distribution. We can define a
random variable corresponding to each radius . If a center is
randomly chosen from the centers available at a radius then
there are a total possible outcomes. The probability of choosing
the centre is . This is decided by the density at the location of the
centre which is given by
. By definition, we
have, . We can then define the Renyi
entropy of order associated with the random variable as,
| (2.4) | |||||
The base of the logarithm is arbitrary and here we choose it to . If the distribution is perfectly homogeneous on a length scale , then the spheres centered on centres available at that radius are expected to contain exactly same number of galaxies within them. It implies that for each centre i.e. all centres are equally likely to be selected. This maximizes the uncertainty in . All the Renyi entropies of different orders would reduce to under such a situation. We label this maximum entropy as . We calculate the Renyi entropies of different orders at each length scale and then normalize it by the maximum entropy as corresponding to that radius. When the distribution is homogeneous the ratio for different values are expected to be or in other words, all the Renyi entropies of different orders have the same value. In a real situation, is never going to be exactly . We measure the deviation from homogeneity using the measure and consider a distribution to be homogeneous when this deviation for different order are statistically indistinguishable. We set an arbitrary but sufficiently small limit () for the observed differences below which we treat them to be identical. We consider values upto keeping in mind the finite and discrete nature of the distributions. However it should be also noted that some fluctuations in the number count would be present in any discrete and finite distributions. Even a homogeneous random distribution is expected to exhibit some degree of inhomogeneity on small scales. The effect of Poisson noise would gradually diminish with increasing length scales due to the increase in the number counts. We expect this Poisson noise to be also present in the analysis of the galaxy distributions. Keeping this in mind, we also calculate the Renyi divergence between the SDSS galaxy distribution and corresponding mock random distributions on different length scales.
The Renyi divergence [60] of order is defined as,
| (2.5) |
where is the probability of finding a randomly chosen point in the mock random sample within a radius from the location of the galaxy in the real galaxy distribution. The Renyi divergence for the value can be obtained by taking a limit which gives the Kullback-Liebler divergence [61].
The Renyi divergence can provide an alternative definition of the
scale of homogeneity. It compares two distributions and would be
ideally zero when the two distribution are identical. The galaxy
distributions are certainly not identical with the homogeneous
Poisson distribution. However if galaxy distribution becomes
homogeneous on larger length scales then any small signal of
inhomogenety present on and above this length scales may be purely
an outcome of the Poisson noise. The Poisson distributions are
homogeneous by definition and the inhomogeneity at any length scale
in these distributions arises due to the Poisson noise alone. When
compared with a homogeneous random distribution, a very small value
of the Renyi divergence on a given length scale suggests that the
galaxy distribution is also homogeneous on that length scale.
It may be also noted that the different outcomes in Equation 2.1 are expected to be independent of each other. However this assumption does not hold due to the overlaps between different spheres. This becomes particularly important on larger length scales where a greater degree of overlap between the spheres may significantly affect the measurement of the scale of homogeneity in the present framework. We also analyze our data using independent volumes in order to address this issue. We superpose the galaxy sample with an uniform three dimensional rectangular grid and identify all the grid cells that lie completely inside the boundary of the sample. These grid cells or voxels are independent as there are no overlaps between them. The galaxy counts in these voxels are used to calculate the Renyi entropy and Renyi divergence. The Renyi entropy and Renyi divergence can be calculated following equations similar to the Equation 2.4 and Equation 2.5. The sum in these equations are now carried out over all the available voxels () within the sample. One can vary the grid size and calculate the Renyi entropies and Renyi divergences associated with the distribution on different length scales. Albeit the number of the available voxels would decrease significantly on larger length scales. A somewhat higher tolerance values for and should be allowed to identify the scale of homogeneity in this framework.
3 Data
We apply the method to data from the SDSS and Monte-Carlo simulations of the homogeneous Poisson point process.
3.1 SDSS Data
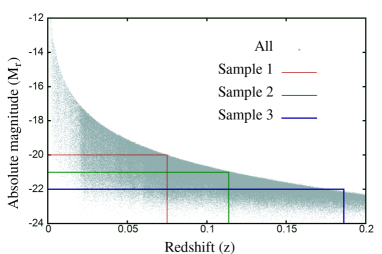
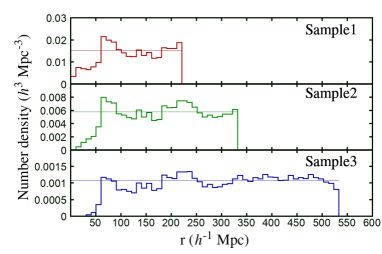
The Sloan Digital Sky survey (SDSS) [2] is the most successful redshift survey in the history of astronomy. The SDSS photometric camera is described in Gunn et al [65]. Strauss et al. [66] describe the target selection algorithm for the SDSS main sample. The SDSS provides spectral sky coverage of square degrees targeting around 3 million galaxies in its third phase. We extract data from the sixteenth data release (DR16) [67] of SDSS using a SQL query in the CasJobs 111https://skyserver.sdss.org/casjobs/. We identify a contiguous region in the northern galactic hemisphere between the right ascension and and declination and . We prepare three different volume limited samples with r-band Petrosian absolute magnitude limit , and . We name these samples as Sample 1, Sample 2 and Sample 3 respectively. The three volume limited samples are defined in the redshift-absolute magnitude plane in the left panel of Figure 1. The right panel of Figure 1 shows the comoving number density in these samples as a function of radial distance. The properties of these volume limited samples are summarized in Table 1.
For conversion of redshift to comoving distance we use the CDM cosmological model with , and [68].
3.2 Random data
We simulate a set of mock random distributions using Monte Carlo simulations described in Pandey [62]. We generate 10 mock random realizations for each volume limited sample from the homogeneous Poisson point processes. The mock random data sets contain same number of points as there are galaxies in the volume limited sample. The geometry and volume of each random data sets are also exactly identical with the actual SDSS samples.
| Absolute | Redshift | Number of | Volume of | Number | Mean | |
|---|---|---|---|---|---|---|
| magnitude range | range | Galaxies | the region | density | separation | |
| (N) | ||||||
| Sample 1 | ||||||
| Sample 2 | ||||||
| Sample 3 |
4 Results
4.1 Analysis with the overlapping spheres
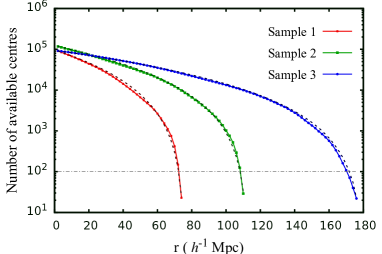
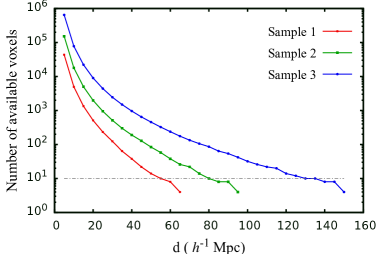
We show the number of available centres as a function of length scales in the three SDSS volume limited samples in the left panel of Figure 2. The left panel of Figure 2 shows that the number of centres in Sample 1 decreases rapidly with increasing length scales due to its smaller size. The number of centers drops to at in the Sample 1. The number of centers falls more slowly in Sample 2 reaching at around . The decrease is much slower in Sample 3 due to its larger volume. Sample 3 has an order of magnitude larger volume than Sample 1 (Table 1). The number of centers reach to at in this sample. The number of valid centres for the corresponding mock random datasets are shown together using dashed lines in the same panel. Their similarity suggests that the availability of the valid centers on different length scales are largely decided by the geometry and volume of the sample and the number of galaxies contained within it. In principle, it should also depend on the nature of the clustering in the data but the dependence is much weaker [56]. We show the availability of the number of independent voxels as a function of length scale for the three samples in the right panel of the same figure. The number of voxels for the actual data and random data are exactly same as it depends only on the geometry and volume of the sample.
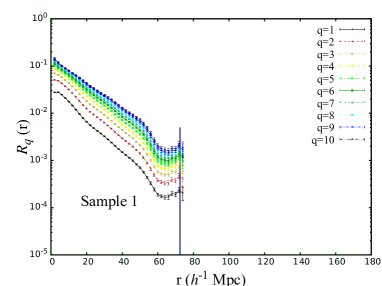
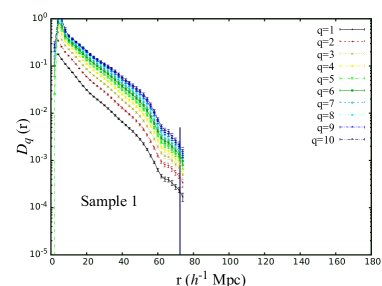
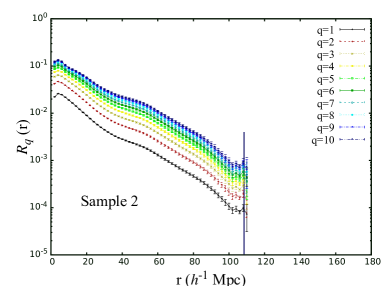
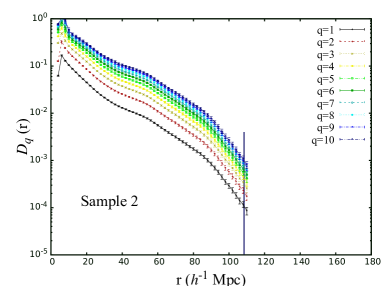
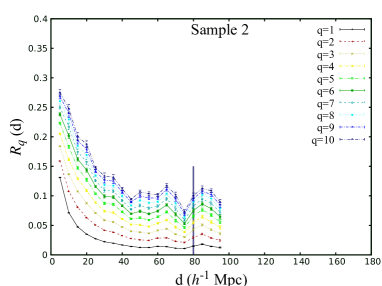
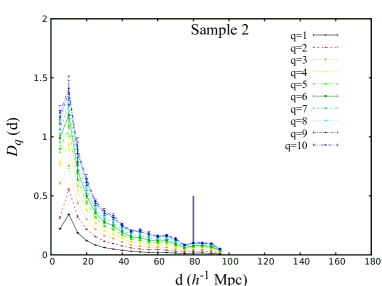
We now measure the Renyi entropies of different order for the SDSS and random data. We show as a function of length scales in Figure 3. The top left, middle left and bottom left panels of this figure show the results for Sample 1, Sample 2 and Sample 3 respectively. The corresponding Renyi divergences are shown in the top right, middle right and bottom right panels of the same figure.
The top left panel of Figure 3 shows that the deviation from homogeneity as quantified by decreases with increasing length scales for each values. The higher values show a larger deviation at smaller length scales. The differences diminish with the increasing length scales and for different values becomes of the order of at . This may apparently indicate a transition to homogeneity at . However, this can be misleading. The curve for each value for Sample 1 shows a sudden change in its slope around . This is caused by a progressive overlap of the measuring spheres eventually enforcing an artificial homogeneity. A solid vertical line is used to indicate the length scale at which only measuring spheres are available for the analysis. The number is arbitrarily chosen keeping in mind the severity of the contamination with a very a small number of spheres. Though this occurs at for Sample 1, a sudden change in the slopes of the curves are noticeable even before this length scale. This indicates that the process is gradual and becomes dominant on larger length scales.
The Renyi divergences for Sample 1 are shown in the top right panel of this figure. The Renyi divergence measures the deviation of the galaxy distribution from a Poisson random distribution. We find that it decreases with the increasing length scales and for different values become or smaller on a length scale of . This amounts to time reduction in the peak value of the Renyi divergence for each . However the predominance of the overlapping bias on such length scales in Sample 1 does not allow us to identify this length scale as the scale of homogeneity. The fact that we see a deviation from homogeneity upto in the SDSS Sample 1 indicates the presence of real inhomogeneity on such length scales in the galaxy distribution. The apparent transition to homogeneity at for the Sample 1 is forced by the confinement and overlapping bias [56, 69]. This is clear from the Figure 2 which shows that the number of available centres in Sample 1 shows a sudden drop beyond . Pandey [56] pointed out that the available valid centers in any finite dataset would gradually migrate towards the centre of the volume with increasing length scales. This would lead to a larger degree of overlap between the measuring spheres undermining the actual degree of inhomogeneities present on such length scales. Thus the small number of spheres (a few hundred to less than hundred) available beyond in Sample 1 may have a large degree of overlap. These spheres are probing nearly the same volume thereby reflecting very little differences between them. Such artificial homogeneity may be commonplace in all the number count based methods applied to the finite datasets.
In the middle left and middle right panels of Figure 3, we respectively show the and curves for different values in Sample 2. The peaks at certain length scales in these plots corresponds to the mean intergalactic separation in these distributions [45]. Clearly, the inhomogeneities in SDSS Sample 2 now persists beyond and extends at least upto . This is related to the fact that the inhomogeneities can be now detected upto a larger length scales due to the greater size of Sample 2. But despite the larger size of Sample 2, the overlapping and confinement bias eventually overshadow the inhomogeneities present in the galaxy distribution beyond Figure 2. The Renyi divergences for Sample 2 in the middle right panel show that a reduction of by a factor of are observed on a scale of . The inhomogeneities may be present in the galaxy distribution beyond . But we can not detect them due to the dominance of the overlapping bias beyond this length scale. A solution to this problem is to consider significantly larger sample of galaxies so that the overlapping bias becomes important on much larger length scales. This would allow us to probe the transition scale to homogeneity provided such a transition occurs on a relatively smaller length scale.
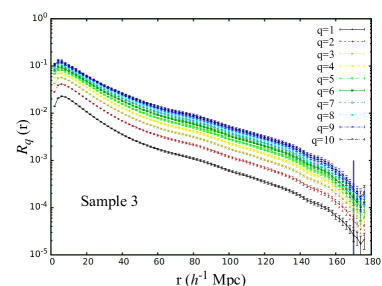
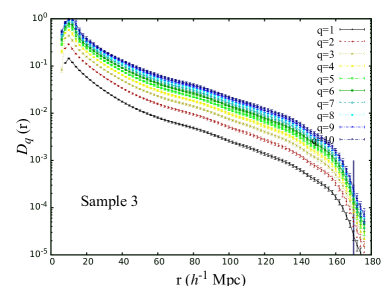
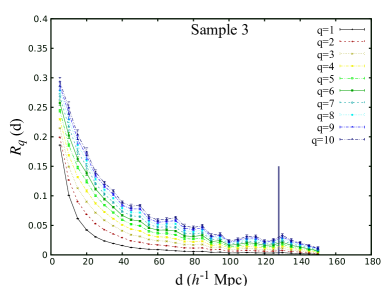
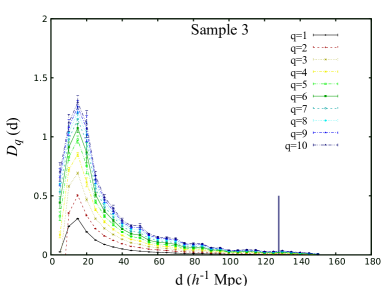
We analyze a large galaxy sample (Sample 3, Table 1) from the SDSS to explore the possibility of identifying the transition scale to homogeneity in the observed galaxy distribution. The results are shown in the bottom panels of Figure 3. It may be noted that the Sample 3 has a volume which is times larger than Sample 1 and times larger than Sample 2. The overlapping bias in Sample 3 dominates on much larger length scales at . This enables us to probe the presence of inhomogeneties in this sample on a length scales . Interestingly, we find that the for all the values becomes of the order of on a scale of . We note that there are a few thousands of centres available at this radius. So this should not be considered as a necessary consequence of the overlapping bias. Shifting our focus to the Renyi divergences shown in the bottom right panel, we also find that values for different show a reduction by a factor of on a length scale of . This indicates that the galaxy distribution in the SDSS can be considered as homogeneous on a length scale of and beyond.
4.2 Analysis with the independent voxels
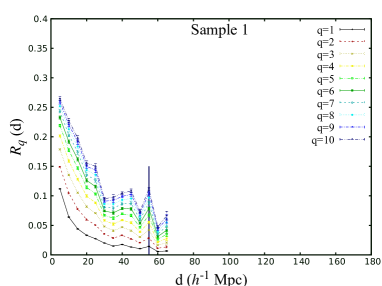
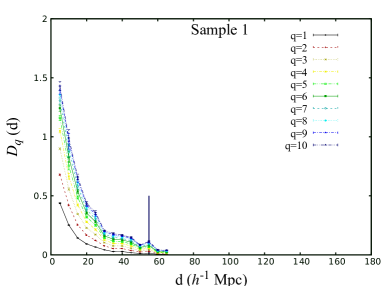
The overlapping bias suppresses the inhomogeneities on larger length scales. An inhomogeneous distribution may thus appear as homogeneous under the influences of the confinement and overlapping bias. In order to avoid these biases, we also carry out the same analysis using the galaxy counts in independent voxels. The results are shown in Figure 4. The top left anf top right panels of this figure respectively show and for different values in Sample 1. Here is the size of the independent voxels. The right panel of Figure 2 show that the available number of independent voxel decreases much faster (as compared to the overlapping spheres) with the increasing length scales. The solid vertical line on the x-axis indicates the length scale () at which only independent voxels are available within Sample 1. We do not consider the results beyond this length scale as there are too few voxels available for the analysis. We find that the the Renyi divergence decreases with the increasing length scales for each value. The results clearly show that the curves for different values do not coincide with each other even on the largest length scale. This indicates the presence of inhomogeneities upto the largest length scale probed by Sample 1. The Renyi divergence quantifies the deviation from a homogeneous Poisson distribution. The for different values in Sample 1 decrease with the increasing length scales. It indicates that the galaxy distribution in the SDSS tends towards a homogeneous distribution on larger length scales. However the difference in the curves in the top left panel and a noticeable difference in the curves in the top right panel at indicate the presence of inhomogeneities in the galaxy distribution on such length scales. The middle left and middle right panels of this figure show the results for Sample 2. Similar trends are observed in the and curves for Sample 2. We can probe upto a length scale of due to the larger size of Sample 2. The results for Sample 2 suggest that smaller but significant inhomogeneities are present even on a length scale of . We show the results for the largest sample (Sample 3) in the two bottom panels of Figure 4. The Renyi entropies for different values in Sample 3 are very small () and quite close to each other on a length scale of . The Renyi divergences for different values in Sample 3 reduce by a factor of nearly times (from their peak value) at . The different curves suggest that the galaxy distribution in the SDSS can be considered as quite homogeneous on a length scale of .
5 Conclusions
We analyze a set of volume limited samples from the SDSS to study the inhomogeneities in the galaxy distribution and test the possible existence of homogeneity on larger length scales. We measure the Renyi entropies and the Renyi divergences as a function of length scales in each of the galaxy distributions. The Renyi divergence is used to quantify the deviation of the galaxy distribution from a homogeneous Poisson distribution. We carry out our analysis with two different schemes, one using the number counts within the overlapping spheres and another using the number counts within the independent voxels. The analysis of the largest galaxy sample with the overlapping spheres indicates a homogeneity scale of and that with the independent voxels suggests the scale of homogeneity to be . Combining the results from the two analysis, we consider as an upper limit to the scale of homogeneity. Our analysis thus suggests that the inhomogeneities in the galaxy distribution decrease with the increasing length scales and a transition to homogeneity occurs on a length scale between .
We consider the Renyi entropy and the Renyi divergence upto the order in this analysis. The spacing between the successive and the curves become narrower with the increasing values of . In principle, one can consider the entire spectrum of the Renyi entropy and the Renyi divergence. However keeping in mind the finite and discrete nature of the galaxy samples, it would be sufficient to consider only the first few values in the analysis. It may be noted that considering values upto 5 instead of 10 does not significantly change the conclusions of the present analysis.
The results of this analysis agree well with our previous analyses of the SDSS main galaxy sample and the LRG sample using Shannon entropy [45, 46]. The filaments are known to be the largest known coherent features present in the galaxy distribution. Earlier studies with SDSS show that they can extend upto length scales of [70, 71]. The filaments longer than these length scales may be present in the data but they are not statistically significant and arise purely from chance alignments. The results of the present analysis are consistent with these findings.
Our study indicates that if the galaxy samples are not large enough then the study of homogeneity using the number count based methods would underestimate the scale of homogeneity. This is caused by the suppression of the real inhomogeneities by the overlapping bias. The effects of the overlapping bias can be reduced by considering galaxy samples with larger size. However, we need to take into account the evolutionary effects for very large survey volume. The anti-Copernican models may appear homogeneous in such case. But such models can be also constrained from other observations such as SNe, CMB and BAO [72, 73, 74, 75]. It is also difficult to construct a precisely volume limited sample from the observational data due to issues such as the galaxy evolution, the K-corrections, the angular selection functions and the fibre collisions. Such limitation can introduce spurious signals of inhomogeneity even in a homogeneous distribution.
We analyze the SDSS galaxy distribution using independent voxels to avoid the contamination caused by the overlapping bias. The analysis with the independent voxels is more sensitive to the presence of inhomogeneities and clearly shows the absence of homogeneity in the smaller galaxy samples. Combining the two analyses using the overlapping spheres and the independent voxels, we identify a transition to homogeneity in the SDSS galaxy distribution on scales beyond . The results of these analyses thus reaffirms the validity of the assumption of cosmic homogeneity.
Acknowledgments
We sincerely thank the anonymous reviewer for providing valuable comments and suggestions that helped us to improve the manuscript. BP acknowledges the financial support from SERB, DST, Government of India through the project CRG/2019/001110. BP would also like to acknowledge IUCAA, Pune for providing support through associateship programme. SS acknowledges IISER, Tirupati for providing support through a postdoctoral fellowship.
References
- [1] M. Colless, B. A. Peterson, C. Jackson, J. A. Peacock, S. Cole, P. Norberg, I. K. Baldry, et al., arXiv:astro-ph/0306581 (2003)
- [2] D. G. York, et al., AJ, 120, 1579 (2000)
- [3] T. Buchert, & J. Ehlers, A&A, 320, 1 (1997)
- [4] D. J. Schwarz, arXiv:astro-ph/0209584 (2002)
- [5] E. W. Kolb, S. Matarrese & A. Riotto, New Journal of Physics, 8, 322 (2006)
- [6] T. Buchert, General Relativity and Gravitation, 40, 467 (2008)
- [7] G. F. R. Ellis, Classical and Quantum Gravity, 28, 164001 (2011)
- [8] V. Marra, A. Notari, Classical and Quantum Gravity, 28, 164004 (2011)
- [9] K. Bolejko, M.-N. Célérier, A. Krasiński, Classical and Quantum Gravity, 28, 164002 (2011)
- [10] M. Redlich, K. Bolejko, S. Meyer, G. F. Lewis, M. Bartelmann, A&A, 570, A63 (2014)
- [11] A. A. Penzias & R. W. Wilson, ApJ, 142, 419 (1965)
- [12] G. F. Smoot, C. L. Bennett, A. Kogut, et al., ApJ Letters, 396, L1 (1992)
- [13] D. J. Fixsen, E. S. Cheng, J. M. Gales, et al., ApJ, 473, 576 (1996)
- [14] R. W. Wilson & A. A. Penzias, Science, 156, 1100 (1967)
- [15] C. Blake & J. Wall, Nature, 416, 150 (2002)
- [16] P. J. E. Peebles, Principles of Physical Cosmology. Princeton, N.J., Princeton University Press (1993)
- [17] K. K. S. Wu, O. Lahav & M. J. Rees, Nature, 397, 225 (1999)
- [18] C. A. Scharf, K. Jahoda, M. Treyer, et al., ApJ, 544, 49 (2000)
- [19] C. A. Meegan, G. J. Fishman, , R. B. Wilson, et al., Nature, 355, 143 (1992)
- [20] M. S. Briggs, W. S. Paciesas, G. N. Pendleton, et al., ApJ, 459, 40 (1996)
- [21] S. Gupta & T. D. Saini, MNRAS, 407, 651 (2010)
- [22] H.-N. Lin, S. Wang, Z. Chang & X.Li,MNRAS, 456, 1881 (2016)
- [23] C. Marinoni, J. Bel & A. Buzzi, JCAP, 10, 036 (2012)
- [24] D. Alonso, A. I. Salvador, F. J. Sánchez, et al., MNRAS, 449, 670 (2015)
- [25] S. Sarkar, B. Pandey, R. Khatri, MNRAS, 483, 2453 (2019)
- [26] L. Pietronero, Physica A Statistical Mechanics and its Applications, 144, 257 (1987)
- [27] P. H. Coleman, L. Pietronero, Physics Reports, 213, 311 (1992)
- [28] B. B. Mandelbrot, Astrophysical Letters and Communications, 36, 1 (1997)
- [29] L. Amendola,& E. Palladino, ApJ Letters, 514, L1 (1999)
- [30] M. Joyce, M. Montuori & F. S. Labini, ApJ Letters, 514, L5 (1999)
- [31] F. Sylos Labini, N. L. Vasilyev & Y. V. Baryshev, A&A, 465, 23 (2007)
- [32] F. Sylos Labini, N. L. Vasilyev & Y. V. Baryshev, A&A, 508, 17 (2009)
- [33] F. Sylos Labini, Europhysics Letters, 96, 59001 (2011)
- [34] V. J. Martinez & P. Coles, ApJ, 437, 550 (1994)
- [35] S. Borgani, Physics Reports, 251, 1 (1995)
- [36] L. Guzzo, New Astronomy, 2, 517 (1997)
- [37] A. Cappi, C. Benoist, L. N. da Costa, & S. Maurogordato, A&A, 335, 779 (1998)
- [38] S. Bharadwaj, A. K. Gupta & T. R. Seshadri, A&A, 351, 405 (1999)
- [39] J. Pan & P. Coles, MNRAS, 318, L51 (2000)
- [40] J. Yadav, S. Bharadwaj, B. Pandey & T. R. Seshadri, MNRAS,364, 601 (2005)
- [41] D. W. Hogg, D. J. Eisenstein, M. R. Blanton, N. A. Bahcall, J. Brinkmann, J. E. Gunn & D. P. Schneider, ApJ, 624, 54 (2005)
- [42] P. Sarkar, J. Yadav, B. Pandey & S. Bharadwaj, MNRAS, 399, L128 (2009)
- [43] M. I. Scrimgeour, T. Davis, C. Blake, et al. 2012, MNRAS, 3412 (2012)
- [44] S. Nadathur, MNRAS, 434, 398 (2013)
- [45] B. Pandey, S. Sarkar, MNRAS, 454, 2647 (2015)
- [46] B. Pandey, S. Sarkar, MNRAS, 460, 1519 (2016)
- [47] J. R., III, Gott, M. Jurić, D. Schlegel, et al., ApJ, 624, 463 (2005)
- [48] R. G. Clowes, K. A. Harris, S. Raghunathan, et al., MNRAS, 429, 2910 (2013)
- [49] I. Szapudi, A. Kovács, B. R. Granett, et al., MNRAS, 450, 288 (2015)
- [50] R. C. Keenan, A. J. Barger, L. L. Cowie, ApJ, 775, 62 (2013)
- [51] C. Park, Y.-Y. Choi, J. Kim, J. R. Gott , S. S. Kim , K.-S. Kim, ApJL, 759, L7 (2012)
- [52] V. J. Martinez & B. J. T. Jones, MNRAS, 242, 517 (1990)
- [53] A. Renyi, Probability Theory, Published by North-Holland Publishing Company, Amsterdam (1970)
- [54] H.G.E. Hentschel, I. Procaccia, Physica 8D, 435 (1983)
- [55] W. C. Saslaw, The Distribution of the Galaxies. Published by Cambridge University Press, (1999)
- [56] B. Pandey, MNRAS, 430, 3376 (2013)
- [57] C. E. Shannon, Bell System Technical Journal, 27, 379 (1948)
- [58] T. Van Erven, P. Harremoës, arXiv:1206.2459, (2012)
- [59] S. Sarkar, B. Pandey, MNRAS, 463, L12 (2016)
- [60] A. Renyi, Proceedings of the fourth Berkeley Symposium on Mathematics, Statistics and Probability, pp. 547-561 (1961)
- [61] S. Kullback & R. A. Leibler, The Annals of Mathematical Statistics, 22(1), 79 (1951)
- [62] B. Pandey, JCAP, 02, 023 (2021)
- [63] A. J. Roberts , 2005, arXiv, nlin/0512014
- [64] F. Avila, C. P. Novaes, A. Bernui, E. de Carvalho, J. P. Nogueira-Cavalcante, MNRAS, 488, 1481 (2019)
- [65] J. E. Gunn, M. Carr, C. Rockosi, M. Sekiguchi, K. Berry, B. Elms, E. de Haas, et al., AJ, 116, 3040 (1998)
- [66] M. A. Strauss, D. H. Weinberg, R. H. Lupton, V. K. Narayanan, J. Annis, M. Bernardi, M. Blanton, et al., AJ, 124, 1810 (2002)
- [67] R. Ahumada, C. A. Prieto, A. Almeida, F. Anders, S. F. Anderson, B. H. Andrews, B. Anguiano, et al., ApJS, 249, 3 (2020)
- [68] Planck Collaboration, N. Aghanim, Y. Akrami, M. Ashdown, J. Aumont, C. Baccigalupi C., M. Ballardini, et al.,A&A, 641, A6 (2020)
- [69] D. Kraljic, MNRAS, 451, 3393 (2015)
- [70] B. Pandey, S. Bharadwaj, MNRAS, 357, 1068 (2005)
- [71] B. Pandey, G. Kulkarni, S. Bharadwaj, T. Souradeep, MNRAS, 411, 332 (2011)
- [72] J. P. Zibin, A. Moss & D. Scott, Physical Review Letters, 101, 251303 (2008)
- [73] T. Clifton, P. G.Ferreira, , & K. Land, Physical Review Letters, 101, 131302 (2008)
- [74] T. Biswas, A. Notari, & W. Valkenburg, JCAP, 11, 30 (2010)
- [75] C. Clarkson, Comptes Rendus Physique, 13, 682 (2012)