A millikelvin scanning tunneling microscope in ultra-high vacuum with adiabatic demagnetization refrigeration
Abstract
We present the design and performance of an ultra-high vacuum (UHV) scanning tunneling microscope (STM) that uses adiabatic demagnetization of electron magnetic moments for controlling its operating temperature in the range between 30 mK and 1 K with the accuracy of up to 7 K. The time available for STM experiments at 50 mK is longer than 20 h, at 100 mK about 40 h. The single-shot adiabatic demagnetization refrigerator (ADR) can be regenerated automatically within 7 hours while keeping the STM temperature below 5 K. The whole setup is located in a vibrationally isolated, electromagnetically shielded laboratory with no mechanical pumping lines penetrating through its isolation walls. The 1K pot of the ADR cryostat can be operated silently for more than 20 days in a single-shot mode using a custom-built high-capacity cryopump. A high degree of vibrational decoupling together with the use of a specially-designed minimalistic STM head provides an outstanding mechanical stability, demonstrated by the tunneling current noise, STM imaging, and scanning tunneling spectroscopy measurements all performed on atomically clean Al(100) surface.
I Introduction
Scanning tunneling microscopy (STM) performed in ultra-high vacuum (UHV) at millikelvin (mK) temperatures enables studies of delicate quantum phenomena that occur on surfaces Niimi, Kambara, and Fukuyama (2009); Song et al. (2010a); Levy et al. (2013); Eltschka et al. (2014); Roychowdhury et al. (2015); Sun et al. (2015); Jäck et al. (2015); Ast et al. (2016); Jäck et al. (2016); Natterer et al. (2016); Hamidian et al. (2016); Feldman et al. (2017); Clark et al. (2018); Machida et al. (2019); Senkpiel et al. (2020); van Weerdenburg et al. (2020); Nuckolls et al. (2020); Steinbrecher et al. (2021). The growing interest in phenomena like quantum entanglement will most probably boost the demand for mK STM instrumentation. In contrast to STMs operating at higher temperatures, the mK STM technology is much less common. Virtually all of the existing mK STMs share one common feature: They use the technique of 3He-4He dilution refrigeration (DR) to reach base temperatures below 100 mK Moussy, Courtois, and Pannetier (2001); le Sueur and Joyez (2006); Kambara et al. (2007); Song et al. (2010b); Singh et al. (2013); Assig et al. (2013); Misra et al. (2013); Roychowdhury et al. (2014); von Allwörden et al. (2018); Machida, Kohsaka, and Hanaguri (2018); Balashov, Meyer, and Wulfhekel (2018); Wong et al. (2020); Schwenk et al. (2020). DR is a powerful technique which combines well with high magnetic fields and UHV conditions, but it also has its shortcomings. Most critically for the STM operation, DR continuously circulates cryoliquids in the microscope’s vicinity, leading to a higher level of mechanical noise. In these circumstances, the search for alternative implementations of mK STM seems to be well justified.
Here we describe the design and performance of the first-ever mK STM cooled by adiabatic demagnetization refrigeration (ADR) of electronic spins Pobell (2007). Although ADR was the first technique to reach temperatures below 1 K, it has never been applied to STM, presumably, due to the low thermal stability of inorganic salts typically used for ADR. Despite this, our results show that an ADR-based mK STM operating under UHV conditions is feasible, and, in some respects, perhaps an even more attractive alternative to the existing approaches. In particular, the use of ADR provides several significant advantages: First, it enables operation in a mechanically quiet environment. Second, the solid-state character of ADR-based devices makes the mK STM design very modular, which simplifies its everyday operation and makes the process of its further development much more efficient. Third, ADR enables accurate and fast control of the STM temperature in a wide range without using additional heaters.
II System layout
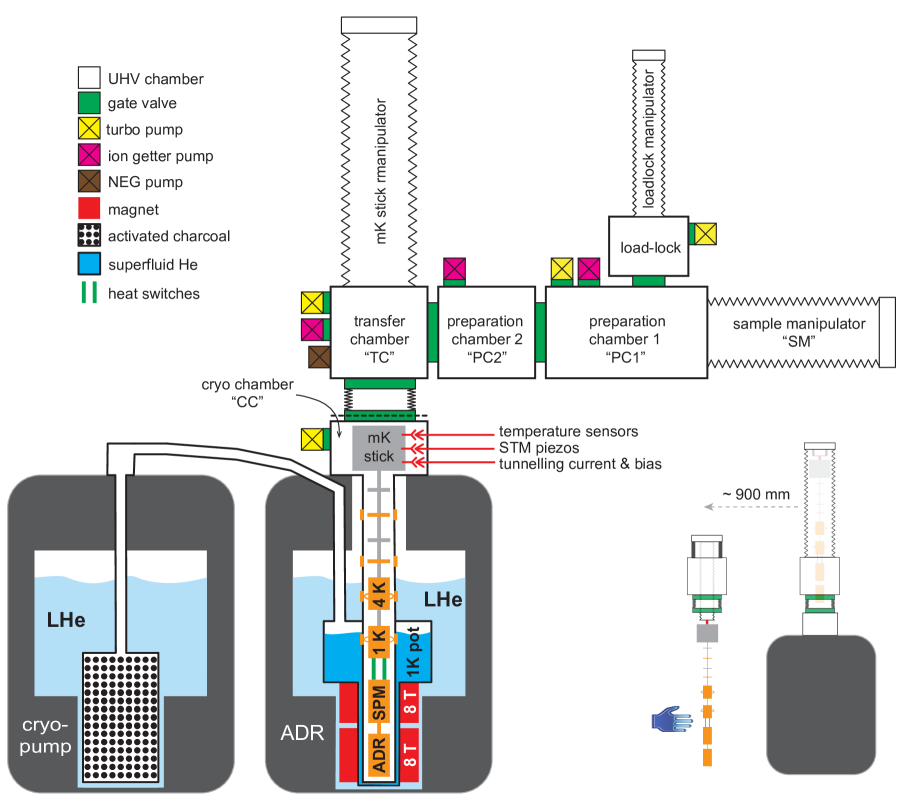
We start presenting our UHV ADR mK STM by describing the system’s layout. The aim is to provide a general understanding of the system functionalities rather than to present full details of its technical design. The setup comprises a UHV system, two superinsulated 300 liter liquid helium (LHe) dewars, and a removable millikelvin insert (mK stick) on which the STM is mounted (see Fig. 1). One of the LHe dewars hosts the ADR cryostat and the mK stick, while the other one houses a high-capacity cryopump that operates the 1K pot of the ADR cryostat during the silent regime of the mK STM operation. The whole setup fits inside a vibrationally isolated and electromagnetically shielded laboratory Voigtländer et al. (2017) with an area of 5 4 m2 and a height of 4 m.
II.1 UHV chamber
The UHV chamber consists of five sections separated by gate valves, as Fig. 1 shows. Below we give a brief description of each section. Preparation chamber 1 (PC1) serves for the UHV sample preparation. It is equipped with a UHV sample manipulator (SM) manufactured by VAb VAB . The SM is used to prepare samples and to transfer them to the STM. The equipment of the PC1 also includes a focused ion gun from Focus GmbH Foc and AES-LEED optics from SPECS Spe . The preparation chamber 2 (PC2) is meant to host more preparation techniques in the future, but at the moment, it is not in use. The base pressure in the PC1 and the PC2 is typically around mbar.
The cryochamber (CC) that hosts the mK stick during STM experiments as shown in Fig. 1 comprises the ADR cryostat bore and a small chamber inside which the mK stick head is locked and which is positioned directly on top of the cryostat. The CC has three linear motion feedthroughs equipped with pogo-pin contact plates, which establish electrical connections to the mK stick by pressing against the corresponding contact plate of the mK stick head (cf. Fig. 2). The low-voltage wiring necessary for the temperature sensors’ readout and control of the heat-switches passes through a 51-pin micro SUB-D UHV feedthrough from VACOM VAC . The high-voltage cabling of the STM piezo passes through a separate 15-pin SUB-D UHV feedthrough. Finally, the tunneling current and the bias wires pass through a 4SMA coaxial feedthrough purchased from Allectra All . The chamber has two additional linear motion stages for operating the mechanisms, which lock (unlock) the mK stick to (from) the manipulator or the cryostat.
The transfer chamber (TC) hosts a custom-designed UHV manipulator for lifting and loading the mK stick (section III.2). In addition to the ion and turbopump, the TC is equipped with a non-evaporable getter (NEG) pump from SAES SAE . The TC connects to the CC through a 50 mm long flexible DN100 UHV bellow with a gate valve attached on each side. The mechanical connection between the TC and the CC can be interrupted without disrupting the STM experiment. Having such an option could in future be useful for minimizing electrical or vibrational noise further. More importantly, disconnecting the TC from the CC makes it possible to remove the mK stick out of the UHV without warming-up the cryostat. Because the current version of the mK stick is not bakeable (section II.4), the pressure in the TC is at the level of mbar.
II.2 ADR cryostat
The superinsulated LHe bath cryostat that cools the mK stick to 1 K has been designed and manufactured by Cryovac Cry (a). The boil-off rate of LHe from the dewar of the cryostat is about 0.85 l of LHe per hour. This relatively high boil-off rate is mainly a consequence of the wide neck of the cryostat, necessary for the magnet setup, compared to its relatively short height which was intentionally minimized to fit the whole setup in the 4 m high laboratory space. The four retractable evaporation-cooled current leads of the magnets do not contribute to the LHe losses noticeably. The maximum holding time of the LHe cryostat reaches 14 days. Typically, it is refilled every 7–10 days.
The system of superconducting magnets installed in the ADR cryostat was custom-designed by Cryomagnetics Cry (b). It consists of a pair of superconducting coils stacked axially on top of each other, as shown schematically in Fig. 1. The lower coil with a maximum field of 8 T performs the ADR, while the upper 8 T coil generates the field in the sample region. The ADR magnet provides the necessary field homogeneity in the ADR pill region. The sample magnet has a set of compensating coils that reduce its stray field in the ADR magnet region below 5 mT at the maximum field of 8 T.
The inner bore of the cryostat, comprises a 50 mm wide stainless steel tube, which at the same time is the inner wall of the CC, interrupted at specific heights by four gold plated copper rings (see Fig. 1). These copper rings serve as thermal coupling of the mK stick to the cryostat. The upper two rings contact the two mK stick copper baffles (see Fig. 2). The lower two rings thermalize the 4K and 1K stages, respectively, of the mK stick.
The lowest copper ring thermalizing the 1K stage is a part of the outer wall of the 1K pot. The 1K pot with a volume of 1.3 liter receives LHe from the dewar of the bath cryostat via a capillary equipped with a needle valve for the regulation of the LHe flow. The 1K pot is thermally isolated by the surrounding inner vacuum chamber (IVC) (not shown in Fig. 1 to avoid clutter). When the supply capillary is closed, the 1K pot enters the single-shot mode, reaching a minimal temperature of 0.975 K. The 1K pot was designed to operate at least two weeks under a load of up to 3 mW. In practice, the operation time of the 1K pot is about 25 days in the single-shot mode without interruption, indicating a much smaller thermal load in our setup.
II.3 High-capacity sorption pump
The high-capacity cryopump was also designed and manufactured by Cryovac Cry (a) and uses activated charcoal as the sorption material Haefer (1989). Sorption pumps have been extensively used for 3He and 4He cryogenics for more than half a century Shvets (1966), allowing miniaturization of sub-Kelvin coolers Torre and Chanin (1985). The capacity of our sorption pump as well as its external mode of operation makes it suitable for any pumped Helium stage that is usually operated with a mechanical pump, without any modification of the latter. The cryopump capacity was designed to provide more than two weeks of uninterrupted operation of the 1K pot of the ADR cryostat under a heat load of 3 mW. It operates steadily for about a month in real conditions, after which it can be fully regenerated within three hours. The sorption pump is surrounded by an evacuated volume (not shown in Fig. 1 to avoid clutter) that can be filled with LHe from the main LHe bath through a needle valve. When evacuated, this volume provides thermal insulation from the LHe bath and allows the regeneration of the pump by heating it to 40 K and pumping the desorbing helium gas with a scroll pump. The boil-off rate of the superinsulated LHe dewar of the cryopump is about 0.5 liter LHe per hour, which results in a maximum holding time of three weeks. We typically refill the cryopump dewar once in 14 – 20 days.
II.4 mK stick
The mK stick is a crucial part of the mK STM, as it hosts both the STM and the paramagnetic pill (ADR pill) necessary for reaching millikelvin temperatures. As noted above, the mK stick has no permanent electrical or mechanical connections to the rest of the setup. Therefore, it can be quickly extracted out of UHV and even exchanged without warming up the ADR cryostat. This feature allows for a unique degree of modularity of our setup.
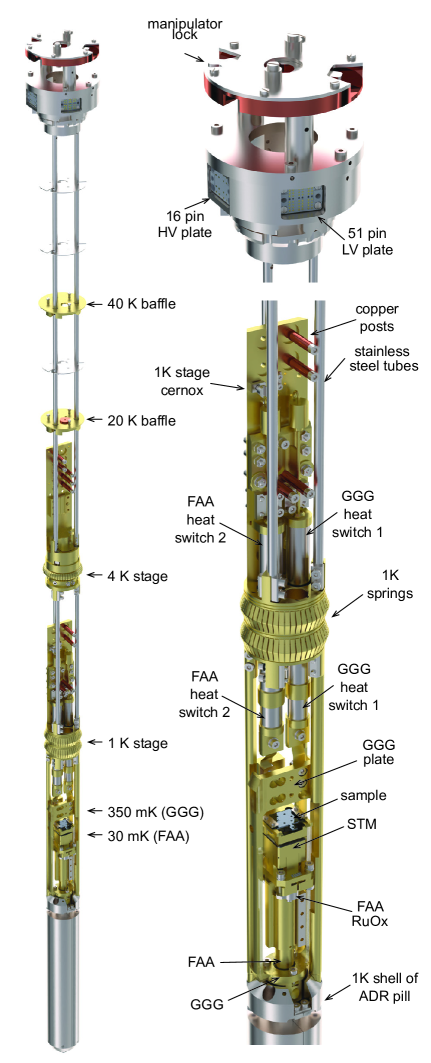
The mK stick comprises the following essential parts (cf. Fig. 2): the head featuring electrical contact plates and the locking mechanism for attaching the mK stick either to the manipulator or to the top of the cryostat; three thin-walled stainless steel tubes forming the structural backbone of the mK stick down to its 1K stage, below which the structure is supported by three gold plated copper rods; three stainless-steel baffles for radiation protection; two copper baffles thermalized to the 40 K and 20 K copper rings of the CC (section II.2); the 4K stage with the gold plated CuBe spring establishing the thermal contact to the 4K copper ring of the CC; the 1K stage with the two gold plated CuBe springs coupling it thermally to the 1K pot; two 3He gas-gap heat switches, designed and manufactured by Chase Research Cryogenics Cha ; a home-built STM; and finally a two-stage ADR pill, designed and manufactured by Entropy Ent and attached to the very bottom of the mK stick.
For monitoring the mK stick temperature, we use four temperature sensors: Two calibrated Cernox sensors (Lakeshore) Lak are mounted at the 1K and 4K stages, respectively. Two calibrated RuOx sensors from Entropy Ent monitor the temperature of the two stages of the ADR pill (see below). The sensor wiring running between 300 K and 1 K is made of a twelve-twisted-pair constantan ribbon from CMR CMR . Below the 1K stage, the wiring continues with three individual four-twisted-pair NbTi ribbons acquired from CMR.
For the wiring of the STM, we use a shielded twisted-pair cable obtained from GVL Cryogenics GVL . This cable has a braided constantan shield with a resistance of 6 /m, while the 0.1 mm diameter inner brass conductors have a resistance 8 /m. The inner conductors are varnished and covered with Teflon for additional electric isolation. We have tested the cables in UHV and detected no appreciable outgassing at the highest tested temperature of 150 °C.
Due to its construction, the piezo system of our home-built STM (section II.5) needs only five electrical connections for its operation. These are implemented with three shielded twisted-pair lines. The wiring of the STM bias and the tunneling current consists of two twisted-pair lines in which we turned the two inner conductors of the pair into one by soldering them together at both ends. All twisted-pair cables run from 300 K down to 30 mK without physical interruption. Each cable is wrapped around two copper posts for thermalization: one located at the 4K and the other at the 1K stage (Fig. 2). Furthermore, we thermalize these cables by pushing them into 5 to 15 cm long, 3 mm deep, and 0.8 mm wide groves in the copper bodies of both the 300 mK and the 30 mK plates of the mK stick. The last few centimeters of the bias and the tunneling current wires consist of unshielded NbTi superconducting wire to improve thermal decoupling and additionally block high-frequency noise von Allwörden et al. (2018).
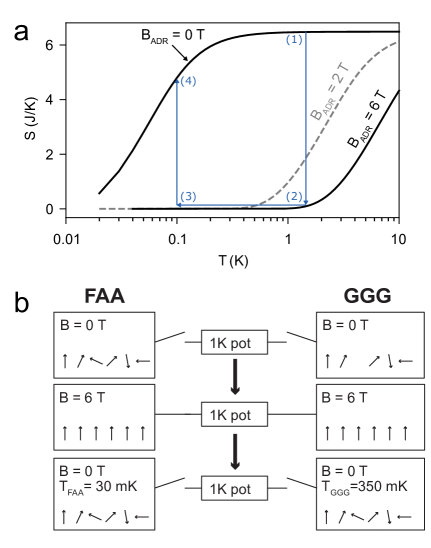
The bottom of the mK stick features a commercially acquired ADR pill that contains two paramagnetic materials: Ferric ammonium alum (FAA) with the chemical formula NH4Fe(SO4)H2O, and gadolinium gallium garnet (GGG)—Gd3Ga5O12. Fig. 3 reveals the principal scheme of the ADR pill, which consists of three thermally decoupled stages. The outer aluminum shell is in good thermal contact with the 1K stage of the mK stick. It encloses the second shell made of gold-plated copper with a 201 g single crystal of GGG firmly attached to it. This assembly that we refer to as the GGG stage reaches 350 mK during the ADR cooling cycle (section III.3). As mentioned above, the GGG stage provides precooling for the wiring that passes to the STM and simultaneously reduces the heat leak from the 1K stage towards the ADR pill lowest temperature, FAA stage. The GGG stage is also attached to one of the two gas-gap heat switches (cf. Fig. 2 and section III.3) that connects it to the 1K stage of the mK stick. A calibrated RuOx sensor fixed to the GGG stage provides the reading referred to as “GGG temperature” or .
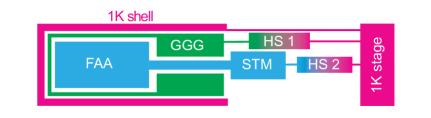
The core of the ADR pill – the FAA stage – that reaches the lowest temperature of 26 mK comprises a single crystal of FAA with a mass of 210 g enclosed in a UHV-tight stainless steel container. The FAA crystal is in good thermal contact with a thick copper rod that sticks out of the container and provides thermalization for the STM and the second RuOx sensor, the reading of which is then referred to as FAA temperature or . The FAA stage of the ADR pill is also connected to the 1K stage of the mK stick through its own gas-gap heat switch (cf. Fig. 2 and section III.3).
One final note on the temperature stability of the ADR pill is due. Unlike the GGG crystal that is thermally stable, the FAA crystal contains water and its melting temperature is about 40 °C Wilson and Timbie (1999). This makes the ADR pill and the whole mK stick not-bakeable. As will be demonstrated below, this technical complication does not prevent us from preparing and working with atomically clean sample surfaces. At the same time, we are also developing a new type of bakeable ADR pill using novel, thermally-stable magnetocaloric materials Jang et al. (2015).
II.5 STM
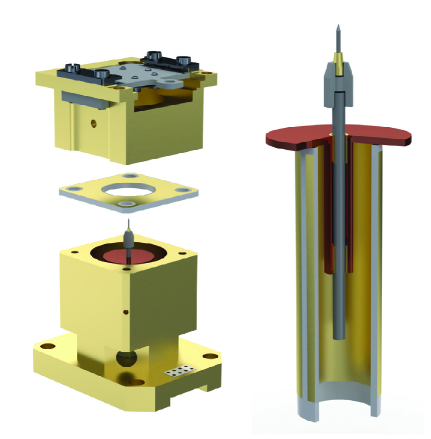
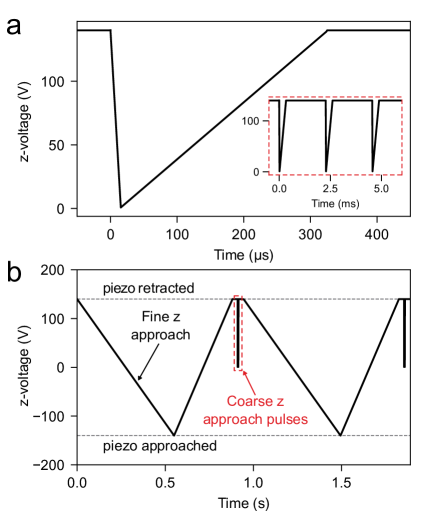
A unique feature of our home-built STM (cf. Fig. 4) is that both -coarse and -scanning functions are implemented in a single piezoceramic tube. Such a design makes the STM very compact and thus less sensitive to mechanical noise. It also needs fewer high voltage lines for its operation, thus also reducing the thermal load on the mK stick. As shown in the right panel of Fig. 4, the -coarse approach motor of our STM exploits the slip-stick mechanism: A tungsten rod, held by two CuBe springs inside a CuBe tube, which is firmly attached to the upper end of the piezo tube, can be accelerated slowly in the direction of the long axis of the tube by extending (contracting) the piezo. The tungsten rod makes a coarse step when the extension (contraction) of the piezo tube reverses rapidly, causing a high acceleration of the rod that eventually overcomes its friction with the springs. The voltage pulse used to produce a single coarse step towards the surface is shown in Fig. 5a. The pulse is applied to the inner contact of the piezo tube against all its four outer contacts. To move in the opposite direction, the time profile of the pulse is inverted. The coarse steps are made with the piezo in its fully contracted state (i.e., under high positive voltage), which is necessary for the subsequent test of the tunneling contact after the coarse step during auto-approach. The pulse sequence used for auto-approach is shown in Fig. 5b.
The STM fine scanner is operated conventionally by applying voltages of opposite polarity to the corresponding pairs of and electrodes. For fine scanning of , the inner contact of the piezo tube is biased against all four outer contacts. Operating with voltages of up to 150 V, we can scan an area of 2.5 2.5 m2 at the lowest millikelvin temperatures. It should be possible to reach a 6.5 6.5 m2 scan range by applying voltages of up to 400 V.
Our STM accepts standard flag-type sample plates. The sample is inserted into the top part of the STM, electrically isolated from the rest of the STM body by a 1 mm thick sapphire plate covered from both sides with a thin film of gold to improve thermal contact.
III System operation and characteristics
III.1 Initial cooldown
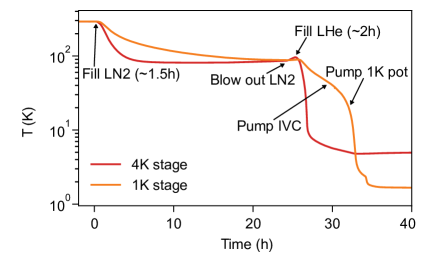
The initial cooldown of the ADR cryostat starts with precooling it to liquid nitrogen (LN2) temperature. Fig. 6 shows that the cooling of the mK stick from room temperature to 80 K takes about 24 hours. During this time, the IVC is kept at a pressure of few millibars of helium gas. After reaching the desired temperature and blowing LN2 out of the superinsulated dewar, the filling with LHe starts. When the temperature of the 1K stage reaches 40 K, the IVC has to be evacuated, and briefly afterwards the pumping of 1K pot with a mechanical pump starts. As Fig. 6 shows, after about 35 hours, the temperature of the 1K stage drops below 2 K. The cooldown of the cryopump proceeds analogously and is not described here in detail. The final temperatures of the 4K and 1K stages of the mK stick reached in different regimes of the ADR cryostat’s operation are listed in Table 1.
| heat switches on | heat switches off | |
|---|---|---|
| 4K Stage | 4.55 K to 5.10 K | 4.55 K to 5.10 K |
| 1K Stage | 1.70 K | 1.03 K |
| GGG stage | 1.66 K | 1.02 K |
| FAA stage | 1.68 K | 1.03 K |
| 1K pot | 1.04 K | 0.98 K |
III.2 mK stick manipulation
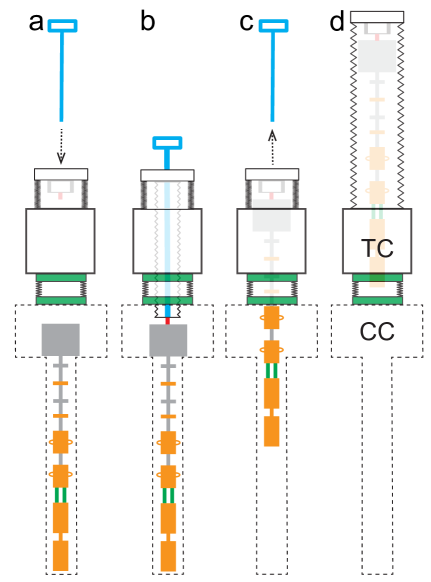
Our mK STM is designed for full operation in laboratory rooms with a minimal height of only 4 m. This required the design and manufacture of a special manipulator for in-situ sample exchange and the extraction of the mK stick from the bath cryostat. The manipulator is motorized and operated with the help of a custom-made software. A typical mK stick manipulation cycle that is performed to load the sample into the STM (or remove it from the STM) is exhibited in Fig. 7.
In the initial position (Fig. 7a), both the outer and inner bellows of the manipulator are in the contracted state and the stick resides in the STM measurement position (inside the CC) while all the electrical contacts to the mK stick are disengaged, i.e. all corresponding linear stages in the CC (Fig. 1) are in the retracted position. Next, a push-pull rod is attached to the bottom of the inner bellow (Fig. 7a) and the bellow is expanded downwards until it reaches the head of the mK stick (Fig. 7b). Then, the head of the mK stick is fixed to the manipulator by actuating the lock situated in the upper part of the mK stick (Fig. 2), and the manipulator lifts the mK stick (Fig. 7c) by contracting the inner bellow to its original state. Here, the push-pull rod is removed, and the outer bellow of the manipulator is expanded, lifting the mK stick (Fig. 7d) to the position at which the sample can be loaded into (or extracted from) the STM using the sample manipulator SM (see Fig. 1 and section II.1). The combined action of the outer and inner bellows allows for a vertical travel distance of the mK stick that exceeds the elongation of the manipulator itself.
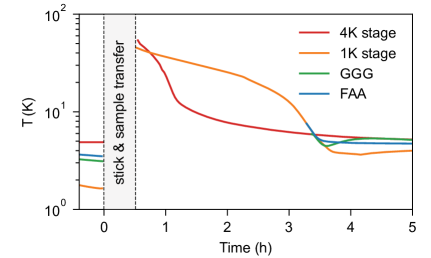
After extracting or loading the sample, the mK stick is loaded back by the reversed manipulation sequence. Fig. 8 shows that the full manipulation cycle, i.e. lifting the mK stick, extracting or loading the sample, and loading the mK stick back into the cryostat takes about 30 to 40 minutes, during which the 4K and 1K stages of the mK stick warm up to 40–50 K. A subsequent cooldown of both stages back to 4K takes about 4–5 hours. Note that during the sample manipulation, the mK stick’s temperature remains low, which prevents it from outgassing.
The extraction of the mK stick out of UHV starts with lifting the mK stick up from the cryostat, i.e. executing the steps shown in Fig. 7. After reaching the stage shown in Fig. 7d the gate valve to the CC is closed, the TC is disconnected from the CC and vented. Then, the frame supporting the UHV system (PC1, PC2 and TC) is moved relative to the CC in the direction perpendicular to the plane of Fig. 1 by a distance of 900 mm (see the inset of Fig. 1). After this translation, the space below the TC is free and the manipulator is brought back to the state shown in Fig. 7b, so that the mK stick can be removed manually from it as the inset of Fig. 1 suggests.
III.3 ADR cycle
The ADR technique is well-established, and its detailed description can be found in numerous literature sources Pobell (2007). Here we give a brief account of it, noting that the cooling is possible due to the magnetocaloric effect in certain paramagnetic materials that possess a large magnetic entropy at low temperatures. Assuming FAA to be a collection of noninteracting magnetic dipoles, one obtains the dependence of its magnetic entropy on the temperature and the external field Wikus, Burghartí, and Figueroa-Feliciano (2011) as:
| (1) |
with and . Here is the number of moles of FAA in the ADR pill, R is the ideal gas constant, is the Bohr magneton, is the g-factor of an electron, is the Boltzmann constant, and =5/2 is the total angular momentum of the paramagnetic ions in FAA Wikus, Burghartí, and Figueroa-Feliciano (2011).
Fig. 9a shows plots of calculated with Eq.1. The ADR cooling cycle starts at a fixed temperature and zero field (point 1). In the first step, the field is increased to a maximum (6 T in our case) while keeping the paramagnetic material in isothermal contact with its environment (point 2). The increase of the field leads to a drop in the magnetic entropy of the paramagnetic material. At the same time, its thermal entropy initially rises, because the heat corresponding to the magnetic entropy before magnetization remains present. However, since the paramagnetic material is in contact with the thermal reservoir of the environment, this heat is transported away (isothermal conditions). In the second step, the paramagnetic material and that part of the environment that is to be refrigerated are decoupled from the thermal reservoir. In this adiabatic condition, the field is then decreased to zero. While the total entropy remains constant (adiabatic condition), there is a transfer from thermal to magnetic entropy as the magnetic moments overcome the alignment in the field. This heat transfer leads to a drop in temperature. The ADR base temperature that can be achieved in this way is defined by two parameters: the starting temperature in point 1 and the maximum field value in point 2. Note that the magnetic ordering temperature of FAA defines the absolute lower boundary of temperatures that are attainable by ADR with FAA. Of course, also the heat capacity of the load to be cooled has an effect on the effective base temperature. However, this is usually much smaller than the heat capacity of the system of paramagnetic moments, because the specific heat of FAA in the relevant range of temperatures is much larger than that of e.g. copper Vilches and Wheatley (1966); Pobell (2007).
Alternatively, stopping the demagnetization at a target temperature before the field reaches zero (point 3) allows one to hold this temperature constant by slowly decreasing the field, such that the increase in the magnetic entropy of FAA balances the residual heat flux from the thermal reservoir into the decoupled system (FAA plus load to be cooled). Clearly, the temperature regulation becomes impossible when the filed reaches zero. The holding time depends on the magnetic entropy of the FAA at the given temperature and the heat leak (for more details, see section III.4).
To establish adiabatic conditions in the mK stick, we employ two commercially acquired UHV-compatible gas-gap heat switches (Fig. 2). Here we show the procedure schematically in Fig. 9b. A gas-gap heat switch typically comprises a thin-walled stainless steel tube containing 3He at a pressure of a few mbar and a miniature charcoal pump attached to it. The principle of its operation has been described in detail in the literature Torre and Chanin (1984). Briefly, heating the charcoal in the switches to about 15–20 K increases their thermal conductivity to 10–50 mW/K, thereby establishing a thermal connection between the 1K pot and both stages (FAA and GGG) of the ADR pill. With the heat switches in this ON state, the ADR magnet is ramped up to 6 T. The 1K pot bath removes the heat generated during the magnetization (magnetic entropy is transferred in thermal entropy). When and approach the 1K pot temperature, the heat switches are turned to their OFF state by deactivating the heating of the charcoal. The 3He pressure inside the switches decreases, reducing the heat conductivity to 1 W/K (per switch). When the FAA and GGG stages decouple from the 1K pot bath, the final step of demagnetization may start.
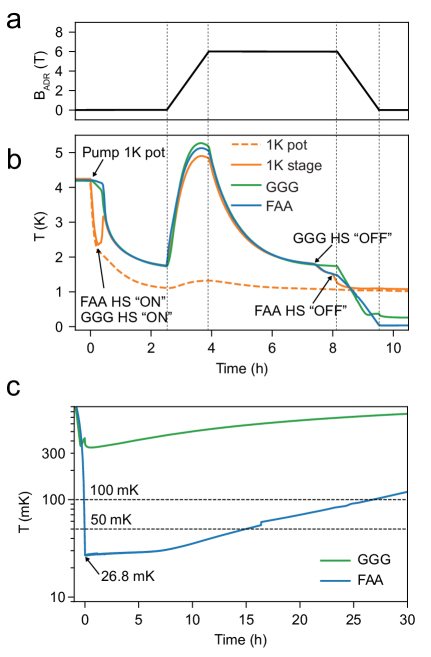
Fig. 10 shows an actual ADR run that starts with turning on the pumping of the 1K pot. As becomes apparent from Fig. 10b, the whole system needs about 2 h to reach the base temperature near 1 K (see 1). The following ramp up of the ADR magnet proceeds with the rate of 8 mT/s in order to keep the temperature of the FAA and GGG stages below 5 K. After reaching the maximum field, it takes about 3.5 h until the temperature of the ADR pill drops again to 1.6 K. Next, the GGG heat switch is turned off. Turning off the FAA heat switch with a delay of 0.5 h lets us decrease the FAA temperature further to 1.4 K, because the power dissipated by the heaters of the charcoal in the heat switches only half as large when only one switch remains in the ON state (see Fig. 10). With both heat switches in the OFF state, the ADR magnet is demagnetized with the rate of 8 mT/s. This relatively slow demagnetization prevents the generation of excessive heat by eddy currents. However, our experience shows that the demagnetization rate can be increased to at least 20–30 mT/s without noticeable deterioration of the thermal performance.
The demagnetization results in a decrease of the temperature of the ADR pill. The GGG temperature reaches 350 mK when the field of the ADR magnet is about 1 T. At these conditions, GGG experiences an antiferromagnetic ordering transition Schiffer et al. (1994) which precludes further cooling. In contrast, the FAA temperature keeps dropping further and reaches a minimum of 26.8 mK, close to which temperature the electron spins inside FAA also order Vilches and Wheatley (1966). This point marks the end of the ADR cycle. After reaching its lowest temperature, the ADR setup starts warming up, because of the residual heat leak. Fig. 10c shows that it takes about 15 h to reach 50 mK and more than 25 hours to 100 mK. After the warming up, the ADR pill needs to be regenerated by repeating the cycle. In our setup, the described ADR cooling cycle is fully automated and performed without any human intervention.
III.4 Temperature regulation
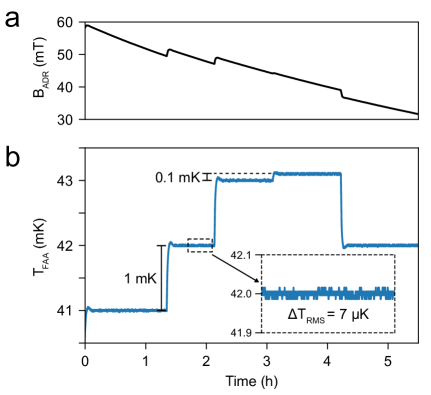
One of the unique features of ADR is the possibility to precisely control the temperature via regulating the field. We establish such a control by introducing a software feedback loop that receives an input from the FAA temperature sensor and responds by regulating the current that flows through the ADR magnet’s coil. As Fig. 11 shows, within several minutes, the regulation achieves a 7 K accuracy in stabilizing a desired temperature in the lower millikelvin range. Notably, regulation works well also at higher temperatures, albeit with a somewhat smaller accuracy.
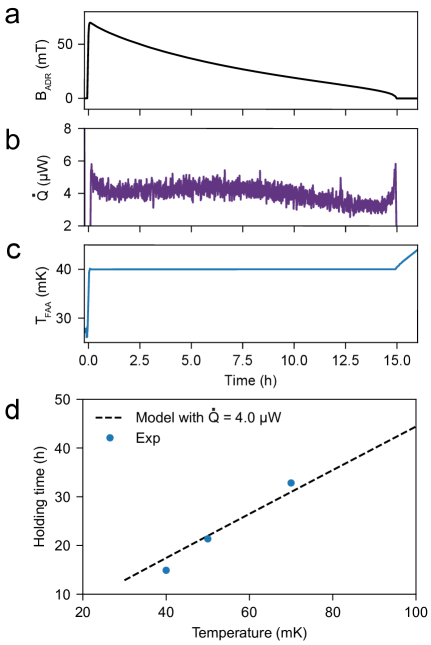
Using the temperature regulation technique, we also evaluate the residual heat leak towards the FAA stage from the environment. Setting the temperature to 40 mK immediately after finishing the demagnetization cycle, we measure the FAA’s holding time at this temperature. As Fig. 12 shows, the holding time equals 15 h. Applying the analytical formula for for FAA, we obtain the heat leak W from the experimental data. Recalling that the expected heat leak of the FAA heat switch should be about 1 W we conclude that the STM and RuOx sensor wiring plus the FAA stage’s thermal isolation inside the ADR pill introduce an additional heat leak of 3 W.
Calculating the total heat that can be absorbed by the FAA stage of the ADR pill at the temperature (point 3 in Fig. 9) as Wikus, Burghartí, and Figueroa-Feliciano (2011) and using the obtained value of the heat leak, we predict the holding time of our FAA stage at different temperatures. As Fig. 12 shows, the calculated values agree well with the experimentally measured holding time data. The model curve also shows that the holding time at 100 mK may be as long as two days.
III.5 STM perfomance
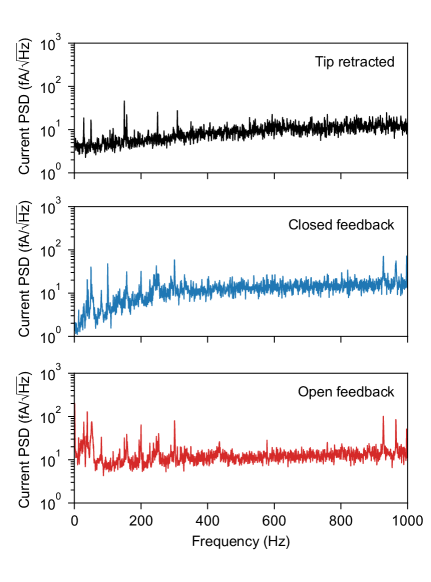
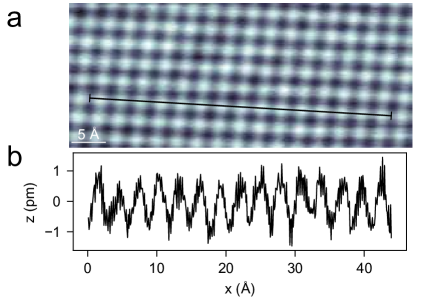
We demonstrate the STM performance by first showing in Fig. 13 the power spectral density of the tunneling current measured at 29 mK over an atomically clean Al(100) surface prepared in UHV by repeated cycles of Ar+ sputtering and annealing at 500°C. The tunneling current was measured using a fixed gain amplifier from NF Corporation NF at a setpoint of = 100 pA, = 10 mV. The noise data, as well as the STM images and spectra, were acquired with Nanonis SPM control electronics Nan . The spectra in Fig. 13 show that our system reaches a remarkable degree of mechanical stability. The high stability of our STM junction also results in topographic noise smaller than 0.5 pm (peak to peak), as the scanned image of the Al(100) surface demonstrates (Fig. 14). Finally, neither the warming up of the STM after finishing an ADR cooling cycle nor the ADR regulation of the temperature affect the STM noise.
III.6 STM junction effective temperature
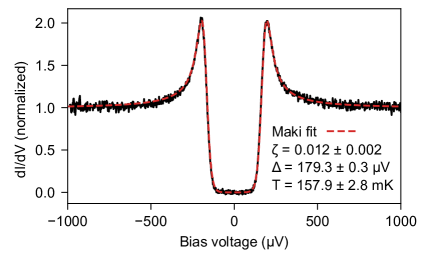
It has become a common practice to demonstrate the effective electronic temperature of mK STM junction by measuring the density of states around a superconducting gap. Such a measurement is necessary because the phonon bath’s temperature, measured in our case by the RuOx sensor, may not reflect the electronic temperature. Therefore, we present a scanning tunneling spectroscopy (STS) measurement of the superconducting gap of the Al(100) surface. Fig. 15 displays a single spectrum (raw data) acquired with the help of the internal lock-in of the Nanonis controller electronics Nan . We filtered the bias and all five high-voltage lines to the STM piezo to minimize the electric noise. The bias line was filtered with a commercial 5000 pF pi-filter API mounted in line with a 3 k resistor, while for the high-voltage lines we used 4500 pF pi-filters Fil . As one can see in Fig. 15, the Maki fit Assig et al. (2013); Machida, Kohsaka, and Hanaguri (2018) of the spectrum comprising the gap and the coherence peaks yields the effective temperature =157 mK. Although the obtained value is higher than the (phonon bath) temperature of 27.5 mK at which the measurement has been performed, it is within the range of the values reported for the DR-based mK STMs Song et al. (2010b); Singh et al. (2013); Assig et al. (2013); Misra et al. (2013); Roychowdhury et al. (2014); von Allwörden et al. (2018); Machida, Kohsaka, and Hanaguri (2018); Balashov, Meyer, and Wulfhekel (2018); Wong et al. (2020).
Surprisingly, however, we find that the electric noise filtering scheme does not substantially affect in our case. Removing the bias line filter increases to 225 mK. Grounding the temperature sensor wiring does not affect at all. At the same time, in agreement with ref. Schwenk et al. (2020), we see that the type of the current amplifier used for STS influences : Switching to a Femto DLPCA 200 Fem increased to 200 mK.
IV Conclusion and outlook
In conclusion, we have built – to the best of our knowledge – the first UHV STM that uses adiabatic demagnetization of electronic spins to perform measurements at well-controlled millikelvin temperatures. Due to its all-solid-state design, our UHV ADR mK STM is relatively simple, compact and very modular. In particular, the mK stick, which carries the STM and the paramagnetic ADR pill, can be easily extracted from UHV without warming up the main LHe bath cryostat. We expect that this feature of our setup should make its further development and service simple, allowing for an efficient everyday operation. Although the current version of the mK stick is not bakeable due to the low thermal stability of the paramagnetic salt in the ADR-pill, we show that this complication does not preclude work on atomically clean surfaces prepared in UHV. At the same time, the continuing discovery of new magnetocaloric materials makes the prospects of fully bakeable ADR setups reaching 100 mK very realistic Jang et al. (2015).
Another technical novelty demonstrated in this work is the successful use of the high-capacity cryopump as a substitution for mechanical pumping of the 1K pot. We find that the cryopump’s silent operation mode is essential for reaching the remarkable noise figures demonstrated in our measurements. Finally, we showed that the lowest attainable effective electronic temperature of our STM junction is = 157 mK. This value is comparable with the data reported by other groups that use mK STMs based on dilution refrigerators. In our case, reacts weakly on the removal of high-frequency noise filters. The factors limiting the in our junction will be analyzed in upcoming publications.
Acknowledgements.
We acknowledge fruitful discussions with Josef Baumgartner (Entropy GmbH, Munich, Germany), Simon Chase (Chase Research Cryogenics Ltd, Sheffield, UK), Kurt Haselwimmer, Michael Krzyzowski (CryoVac GmbH & Co KG, Troisdorf, Germany), George Lecomte (GVL Cryoengineering GmbH, Stolberg, Germany), Gilbert G. Lonzarich (Cavendish Laboratory, University of Cambridge, UK), Jose Martinez Castro (PGI-3, Forschungszentrum Jülich), Stefan Stahl (Stahl-Electronics, Mettenheim, Germany), and Doreen Wernicke (Entropy GmbH, Munich, Germany). We also thank Werner Hürttlen, Jens Prigge, and Helmut Stollwerk for technical support. RT acknowledges the support from the Young Investigator Group program of the Helmholtz Association.data availability
The data that support the findings of this study are available from the corresponding author upon reasonable request.
References
- Niimi, Kambara, and Fukuyama (2009) Y. Niimi, H. Kambara, and H. Fukuyama, “Localized distributions of quasi-two-dimensional electronic states near defects artificially created at graphite surfaces in magnetic fields,” Phys. Rev. Lett. 102, 026803 (2009).
- Song et al. (2010a) Y. J. Song, A. F. Otte, Y. Kuk, Y. Hu, D. B. Torrance, P. N. First, W. A. de Heer, H. Min, S. Adam, M. D. Stiles, A. H. MacDonald, and J. A. Stroscio, “High-resolution tunnelling spectroscopy of a graphene quartet,” Nature 467, 185–189 (2010a).
- Levy et al. (2013) N. Levy, T. Zhang, J. Ha, F. Sharifi, A. A. Talin, Y. Kuk, and J. A. Stroscio, “Experimental evidence for -wave pairing symmetry in superconducting single crystals using a scanning tunneling microscope,” Phys. Rev. Lett. 110, 117001 (2013).
- Eltschka et al. (2014) M. Eltschka, B. Jäck, M. Assig, O. V. Kondrashov, M. A. Skvortsov, M. Etzkorn, C. R. Ast, and K. Kern, “Probing absolute spin polarization at the nanoscale,” Nano Lett. 14, 7171–7174 (2014).
- Roychowdhury et al. (2015) A. Roychowdhury, M. Dreyer, J. R. Anderson, C. J. Lobb, and F. C. Wellstood, “Microwave photon-assisted incoherent cooper-pair tunneling in a Josephson STM,” Phys. Rev. Applied 4, 034011 (2015).
- Sun et al. (2015) Z. Sun, M. Enayat, A. Maldonado, C. Lithgow, E. Yelland, D. C. Peets, A. Yaresko, A. P. Schnyder, and P. Wahl, “Dirac surface states and nature of superconductivity in noncentrosymmetric BiPd,” Nat. Commun. 6, 6633 (2015).
- Jäck et al. (2015) B. Jäck, M. Eltschka, M. Assig, A. Hardock, M. Etzkorn, C. R. Ast, and K. Kern, “A nanoscale gigahertz source realized with Josephson scanning tunneling microscopy,” Appl. Phys. Lett. 106, 013109 (2015).
- Ast et al. (2016) C. R. Ast, B. Jäck, J. Senkpiel, M. Eltschka, M. Etzkorn, J. Ankerhold, and K. Kern, “Sensing the quantum limit in scanning tunnelling spectroscopy,” Nat. Commun. 7, 13009 (2016).
- Jäck et al. (2016) B. Jäck, M. Eltschka, M. Assig, M. Etzkorn, C. R. Ast, and K. Kern, “Critical Josephson current in the dynamical coulomb blockade regime,” Phys. Rev. B 93, 020504 (2016).
- Natterer et al. (2016) F. D. Natterer, J. Ha, H. Baek, D. Zhang, W. G. Cullen, N. B. Zhitenev, Y. Kuk, and J. A. Stroscio, “Scanning tunneling spectroscopy of proximity superconductivity in epitaxial multilayer graphene,” Phys. Rev. B 93, 045406 (2016).
- Hamidian et al. (2016) M. H. Hamidian, S. D. Edkins, S. H. Joo, A. Kostin, H. Eisaki, S. Uchida, M. J. Lawler, E.-A. Kim, A. P. Mackenzie, K. Fujita, J. Lee, and J. C. S. Davis, “Detection of a Cooper-pair density wave in ,” Nature 532, 343–347 (2016).
- Feldman et al. (2017) B. E. Feldman, M. T. Randeria, J. Li, S. Jeon, Y. Xie, Z. Wang, I. K. Drozdov, B. Andrei Bernevig, and A. Yazdani, “High-resolution studies of the Majorana atomic chain platform,” Nat. Phys. 13, 286–291 (2017).
- Clark et al. (2018) O. J. Clark, M. J. Neat, K. Okawa, L. Bawden, I. Marković, F. Mazzola, J. Feng, V. Sunko, J. M. Riley, W. Meevasana, J. Fujii, I. Vobornik, T. K. Kim, M. Hoesch, T. Sasagawa, P. Wahl, M. S. Bahramy, and P. D. C. King, “Fermiology and superconductivity of topological surface states in ,” Phys. Rev. Lett. 120, 156401 (2018).
- Machida et al. (2019) T. Machida, Y. Sun, S. Pyon, S. Takeda, Y. Kohsaka, T. Hanaguri, T. Sasagawa, and T. Tamegai, “Zero-energy vortex bound state in the superconducting topological surface state of Fe(Se,Te),” Nat. Mater. 18, 811–815 (2019).
- Senkpiel et al. (2020) J. Senkpiel, J. C. Klöckner, M. Etzkorn, S. Dambach, B. Kubala, W. Belzig, A. L. Yeyati, J. C. Cuevas, F. Pauly, J. Ankerhold, C. R. Ast, and K. Kern, “Dynamical coulomb blockade as a local probe for quantum transport,” Phys. Rev. Lett. 124, 156803 (2020).
- van Weerdenburg et al. (2020) W. M. J. van Weerdenburg, M. Steinbrecher, N. P. E. van Mullekom, J. W. Gerritsen, H. von Allwörden, F. D. Natterer, and A. A. Khajetoorians, “A scanning tunneling microscope capable of electron spin resonance and pump-probe spectroscopy at mK temperature and in vector magnetic field,” (2020), arXiv:2007.01835 [cond-mat.mes-hall] .
- Nuckolls et al. (2020) K. P. Nuckolls, M. Oh, D. Wong, B. Lian, K. Watanabe, T. Taniguchi, B. A. Bernevig, and A. Yazdani, “Strongly correlated Chern insulators in magic-angle twisted bilayer graphene,” Nature 588, 610–615 (2020).
- Steinbrecher et al. (2021) M. Steinbrecher, W. M. J. van Weerdenburg, E. F. Walraven, N. P. E. van Mullekom, J. W. Gerritsen, F. D. Natterer, D. I. Badrtdinov, A. N. Rudenko, V. V. Mazurenko, M. I. Katsnelson, A. van der Avoird, G. C. Groenenboom, and A. A. Khajetoorians, “Quantifying the interplay between fine structure and geometry of an individual molecule on a surface,” (2021), arXiv:2007.01928 [cond-mat.mes-hall] .
- Moussy, Courtois, and Pannetier (2001) N. Moussy, H. Courtois, and B. Pannetier, “A very low temperature scanning tunneling microscope for the local spectroscopy of mesoscopic structures,” Rev. Sci. Instrum. 72, 128–131 (2001).
- le Sueur and Joyez (2006) H. le Sueur and P. Joyez, “Room-temperature tunnel current amplifier and experimental setup for high resolution electronic spectroscopy in millikelvin scanning tunneling microscope experiments,” Rev. Sci. Instrum. 77, 123701 (2006).
- Kambara et al. (2007) H. Kambara, T. Matsui, Y. Niimi, and H. Fukuyama, “Construction of a versatile ultralow temperature scanning tunneling microscope,” Rev. Sci. Instrum. 78, 073703 (2007).
- Song et al. (2010b) Y. J. Song, A. F. Otte, V. Shvarts, Z. Zhao, Y. Kuk, S. R. Blankenship, A. Band, F. M. Hess, and J. A. Stroscio, “Invited review article: A 10 mK scanning probe microscopy facility,” Rev. Sci. Instrum. 81, 121101 (2010b).
- Singh et al. (2013) U. R. Singh, M. Enayat, S. C. White, and P. Wahl, “Construction and performance of a dilution-refrigerator based spectroscopic-imaging scanning tunneling microscope,” Rev. Sci. Instrum. 84, 013708 (2013).
- Assig et al. (2013) M. Assig, M. Etzkorn, A. Enders, W. Stiepany, C. R. Ast, and K. Kern, “A 10 mK scanning tunneling microscope operating in ultra high vacuum and high magnetic fields,” Rev. Sci. Instrum. 84, 033903 (2013).
- Misra et al. (2013) S. Misra, B. B. Zhou, I. K. Drozdov, J. Seo, L. Urban, A. Gyenis, S. C. J. Kingsley, H. Jones, and A. Yazdani, “Design and performance of an ultra-high vacuum scanning tunneling microscope operating at dilution refrigerator temperatures and high magnetic fields,” Rev. Sci. Instrum. 84, 103903 (2013).
- Roychowdhury et al. (2014) A. Roychowdhury, M. A. Gubrud, R. Dana, J. R. Anderson, C. J. Lobb, F. C. Wellstood, and M. Dreyer, “A 30 mK, 13.5 T scanning tunneling microscope with two independent tips,” Rev. Sci. Instrum. 85, 043706 (2014).
- von Allwörden et al. (2018) H. von Allwörden, A. Eich, E. J. Knol, J. Hermenau, A. Sonntag, J. W. Gerritsen, D. Wegner, and A. A. Khajetoorians, “Design and performance of an ultra-high vacuum spin-polarized scanning tunneling microscope operating at 30 mK and in a vector magnetic field,” Rev. Sci. Instrum. 89, 033902 (2018).
- Machida, Kohsaka, and Hanaguri (2018) T. Machida, Y. Kohsaka, and T. Hanaguri, “A scanning tunneling microscope for spectroscopic imaging below 90 mK in magnetic fields up to 17.5 T,” Rev. Sci. Instrum. 89, 093707 (2018).
- Balashov, Meyer, and Wulfhekel (2018) T. Balashov, M. Meyer, and W. Wulfhekel, “A compact ultrahigh vacuum scanning tunneling microscope with dilution refrigeration,” Rev. Sci. Instrum. 89, 113707 (2018).
- Wong et al. (2020) D. Wong, S. Jeon, K. P. Nuckolls, M. Oh, S. C. J. Kingsley, and A. Yazdani, “A modular ultra-high vacuum millikelvin scanning tunneling microscope,” Rev. Sci. Instrum. 91, 023703 (2020).
- Schwenk et al. (2020) J. Schwenk, S. Kim, J. Berwanger, F. Ghahari, D. Walkup, M. R. Slot, S. T. Le, W. G. Cullen, S. R. Blankenship, S. Vranjkovic, H. J. Hug, Y. Kuk, F. J. Giessibl, and J. A. Stroscio, “Achieving eV tunneling resolution in an in-operando scanning tunneling microscopy, atomic force microscopy, and magnetotransport system for quantum materials research,” Rev. Sci. Instrum. 91, 071101 (2020).
- Pobell (2007) F. Pobell, Matter and Methods at Low Temperatures (Springer-Verlag Berlin Heidelberg, 2007).
- Voigtländer et al. (2017) B. Voigtländer, P. Coenen, V. Cherepanov, P. Borgens, T. Duden, and F. S. Tautz, “Low vibration laboratory with a single-stage vibration isolation for microscopy applications,” Rev. Sci. Instrum. 88, 023703 (2017).
- (34) VAb Vakuum-Anlagenbau GmbH, Marie-Curie-Str. 11, 25337 Elmshorn, Germany.
- (35) Model FDG 150, FOCUS GmbH, Neukirchner Str. 2, 65510 Huenstetten, Germany.
- (36) Model ErLEED 150, SPECS Surface Nano Analysis GmbH, Voltastrasse 5, 13355 Berlin, Germany.
- (37) VACOM Vakuum Komponenten & Messtechnik GmbH, In den Brückenäckern, 307751 Großlöbichau, Germany.
- (38) Model 242-SMAD50-C40-4, Allectra GmbH, Traubeneichenstr. 62-66, 16567 Schönfliess, Germany.
- (39) Model NEXTorr Z100, SAES Getters S.p.A., Viale Italia 77, 20045 Lainate, Italy.
- Cry (a) (a), CryoVac GmbH & Co KG, Heuserweg 14, 53842 Troisdorf, Germany.
- Cry (b) (b), Cryomagnetics, Inc., 1006 Alvin Weinberg Drive, Oak Ridge, TN 37830, USA.
- Haefer (1989) R. Haefer, Cryopumping: Theory and Practice (Clarendon Press, 1989).
- Shvets (1966) A. Shvets, “The use of liquid helium-3 to obtain temperatures down to 0.3k,” Cryogenics 6, 333–337 (1966).
- Torre and Chanin (1985) J. P. Torre and G. Chanin, “Miniature liquid 3He refrigerator,” Review of Scientific Instruments 56, 318–320 (1985).
- (45) Chase Research Cryogenics Ltd., Unit 2, Neepsend Industrial Estate, 80 Parkwood Rd, Neepsend, Sheffield S3 8AG, UK.
- (46) Entropy GmbH, Gmunder Str. 37a, 81379 Munich, Germany.
- (47) Lake Shore Cryotronics, Inc., 550 Tressler Dr, Westerville, OH 43082, USA.
- (48) CMR-Direct, Willow House, 100 High Street, Somersham PE28 3EH, UK.
- (49) Type GVLZ141, GVL Cryoengineering Dr. George V. Lecomte GmbH, Aachener Strasse 89, 52223 Stolberg, Germany.
- Wilson and Timbie (1999) G. W. Wilson and P. T. Timbie, “Construction techniques for adiabatic demagnetization refrigerators using ferric ammonium alum,” Cryogenics 39, 319–322 (1999).
- Jang et al. (2015) D. Jang, T. Gruner, A. Steppke, K. Mitsumoto, C. Geibel, and M. Brando, “Large magnetocaloric effect and adiabatic demagnetization refrigeration with YbPt2Sn,” Nature Communications 6, 8680 (2015).
- Wikus, Burghartí, and Figueroa-Feliciano (2011) P. Wikus, G. Burghartí, and E. Figueroa-Feliciano, “Optimum operating regimes of common paramagnetic refrigerants,” Cryogenics 51, 555–558 (2011).
- Vilches and Wheatley (1966) O. E. Vilches and J. C. Wheatley, “Measurements of the specific heats of three magnetic salts at low temperatures,” Phys. Rev. 148, 509–516 (1966).
- Torre and Chanin (1984) J. P. Torre and G. Chanin, “Heat switch for liquid-helium temperatures,” Rev. Sci. Instrum. 55, 213–215 (1984).
- Schiffer et al. (1994) P. Schiffer, A. P. Ramirez, D. A. Huse, and A. J. Valentino, “Investigation of the field induced antiferromagnetic phase transition in the frustrated magnet: Gadolinium gallium garnet,” Phys. Rev. Lett. 73, 2500–2503 (1994).
- (56) Model SA-606F2, NF Corporation, 6-3-20 Tsunashima Higashi, Kohoku-ku, Yokohama 223-8508, Japan.
- (57) Nanonis SPM control system, SPECS Zurich GmbH, Technoparkstrasse 1, 8005 Zurich, Switzerland.
- (58) Model 51-726-017, API Technologies Spectrum Control GmbH, Hansastrasse 6, 91126 Schwabach, Germany.
- (59) Tusonix / CTS 4106-001LF, Mouser part number 800-4106-001LF, 1000 N. Main Street, Mansfield, TX 76063, USA.
- (60) Model DLPCA-200, FEMTO Messtechnik GmbH, Klosterstr. 64, 10179 Berlin, Germany.