Proton-electron mass ratio by high-resolution optical spectroscopy of ion ensembles in the resolved-carrier regime
Abstract
Optical spectroscopy in the gas phase is a key tool to elucidate the structure of atoms and molecules and of their interaction with external fields. The line resolution is usually limited by a combination of first-order Doppler broadening due to particle thermal motion and of a short transit time through the excitation beam. For trapped particles, suitable laser cooling techniques can lead to strong confinement (Lamb-Dicke regime, LDR) and thus to optical spectroscopy free of these effects. For non-laser coolable spectroscopy ions, this has so far only been achieved when trapping one or two atomic ions, together with a single laser-coolable atomic ion Rosenband2007 ; Chou2011 . Here we show that one-photon optical spectroscopy free of Doppler and transit broadening can also be obtained with more easily prepared ensembles of ions, if performed with mid-infrared radiation. We demonstrate the method on molecular ions. We trap approximately 100 molecular hydrogen ions (HD+) within a Coulomb cluster of a few thousand laser-cooled atomic ions and perform laser spectroscopy of the fundamental vibrational transition. Transition frequencies were determined with lowest uncertainty of fractionally. As an application, we determine the proton-electron mass ratio by matching a precise ab initio calculation with the measured vibrational frequency.
The pursuit of increasingly higher resolution in spectroscopy is of fundamental importance in the field of atomic and molecular physics. Techniques such as nonlinear spectroscopy, particle trapping, laser cooling, buffer gas cooling, and improved microwave and laser sources have permitted continuous progress in resolution over more than half a century, resulting in major advances in understanding of radiation-matter interactions and in controlling quantum systems, especially in the optical domain. One key approach to ultra-high (Doppler-free) resolution is the Lamb-Dicke regime (LDR), achieved by confinement of particles, at least in one spatial dimension, to a range significantly smaller than the wavelength of the spectroscopy radiation Dicke1953a . Historically, spectroscopy in this regime was first introduced for radiofrequency and microwave spectroscopy, for diverse neutral and charged particles. For hyperfine structure spectroscopy of trapped atomic ion clouds, it was shown already in the earliest studies Major1973 that spectral lines with extremely high quality factors are achievable if the cloud radius is smaller than the wavelength.
For visible radiation (), the LDR imposes greater experimental challenges, but is today achieved in many experiments. LDR optical spectroscopy has already led to spectacular advances in atomic clock performance (for both atomic ions and neutral atoms) Rosenband2008 ; Derevianko2011 ; Poli2013 ; Ludlow2015-1 and is also an enabling technique for atom-based quantum information processing, cold-atom many-body system studies, and quantum simulations.
For laser-coolable atomic ions, optical LDR spectroscopy has been demonstrated for ion numbers ranging from 1 to 18, arranged in a string Diedrich1989 ; Lechner2016 . For some atomic ions species and most molecular ion species, direct laser cooling is impractical or not possible. One then resorts to the technique of sympathetic cooling. LDR spectroscopy of a single and of two sympathetically cooled atomic ions has been demonstrated, using quantum logic spectroscopy Schmidt2005 ; Rosenband2007 ; Chou2011 .
For molecules, the LDR has very recently been achieved in a few different configurations: (i) one-photon rotational spectroscopy of molecular ion ensembles at 1.3 THz transition frequency Alighanbari2018 ; Alighanbari2020 , (ii) two-photon Raman rotational spectroscopy of a single molecular ion Chou2020 , (iii) two-photon Raman vibrational spectroscopy (25 THz) of laser-photoassociated diatomic neutral molecule ensembles in an optical lattice trap Kondov2019 , (iv) two-photon vibrational spectroscopy of molecular ion ensembles, using counter-propagating waves of close wavelength Patra2020 . Some of the line resolutions (defined as transition frequency divided by full width at half maximum) of up to achieved in these works Kondov2019 have surpassed the highest values achieved with room temperature gaseous ensembles and on molecular beams (see Methods).
In this letter, we demonstrate that it is possible to perform ultra-high-resolution one-photon mid-infrared optical spectroscopy of cold ions, on comparatively large and easily prepared ensembles of ions. While this is here demonstrated on sympathetically cooled ions, it is expected to work also with ions that are laser cooled directly. The present demonstration is a powerful extension of the previously introduced technique TICTES (Trapped Ion Cluster Transverse Excitation Spectroscopy) from rotational ( THz) to vibrational spectroscopy ( THz) Alighanbari2018 ; Alighanbari2020 . The technique operates on ion ensembles in a macroscopic linear ion trap and with standard Doppler laser cooling. The crucial aspect is the use of a string-like spatial arrangement of the spectroscopy ions and a spectroscopy radiation having a relatively large wavelength (here 5.1 m) and propagated at right angle to the ion trap axis. The technique is to be contrasted with quantum-logic spectroscopy Schmidt2005 ; Wolf2016a ; Chou2020 . Although the latter is powerful and likely extendable to vibrational spectroscopy of molecular ions, its ion preparation technique and the actual spectroscopy procedures are complex and so far restricted to a few specialized research groups world-wide.
In TICTES, two species of ions are simultaneously trapped in a linear ion trap, where one species (LC) is laser-cooled, the other, “target” species (SC) is sympathetically cooled. The corresponding ion numbers are assumed to be . If the two species have charges () and masses () such that , the species SC will be confined to the region near the trap axis. Here, we focus on a configuration in which the SC ions form an ion string embedded in the LC ion cluster. The dynamics of such a two-species cluster at finite ion temperature has been previously analyzed by means of molecular dynamics simulations Alighanbari2018 . The time-averaged spatial distribution of SC ions has a finite width in radial direction, . For ensembles of HD+ ions cooled by beryllium ions to a temperature of and arranged in a string-like configuration, was found in the simulations, for our trap parameters. A Doppler-free carrier signal with frequency unaffected by ion dynamics was predicted to occur for a spectroscopy wave () irradiation direction transverse to the trap axis (radial direction) Zhang2008 , assuming that the intrinsic linewidth of the transition is sufficiently narrow. Both numerically and within an approximate analytical model it was furthermore predicted that the strength of the carrier spectroscopy signal decreases continuously from near-unity if (LDR) to zero for . At the carrier signal is 0.5. While in the first experimental investigation the regime was studied Alighanbari2018 , in this work we explore whether a carrier signal is still observable for a small spectroscopy wavelength, . At this wavelength, the carrier signal strength is predicted to be less than 0.02 Alighanbari2018 . We note that in microwave spectroscopy of trapped atomic ion ensembles, ultra-high resolution of the carrier transition has been observed in the non-LD regime. Major1973 ; Lakkaraju1982 ; Cutler1985 ; Prestage1990 ; Fisk1997 .
Wavelengths of 5 m and longer permit addressing fundamental and/or first overtone vibrational transitions of most molecular ions, except for hydrides. Such vibrational transitions have natural linewidths in the range from 10 Hz in heteronuclear molecules to nano-Hz in homonuclear diatomics. Attainment of the resolved carrier regime can in principle take advantage of these small linewidths to provide e.g. a high spectral resolution of hyperfine structure, a high sensitivity in the study of frequency shifts caused by interaction with externally applied fields, and precise measurements of transition frequencies.
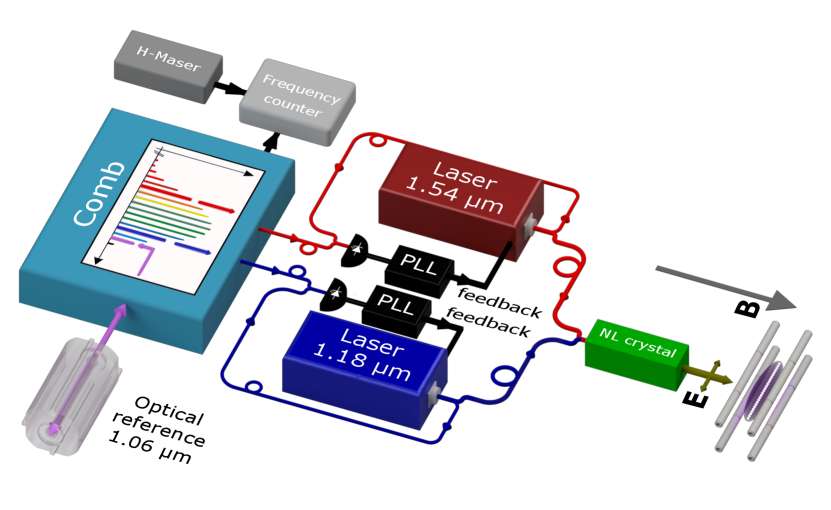
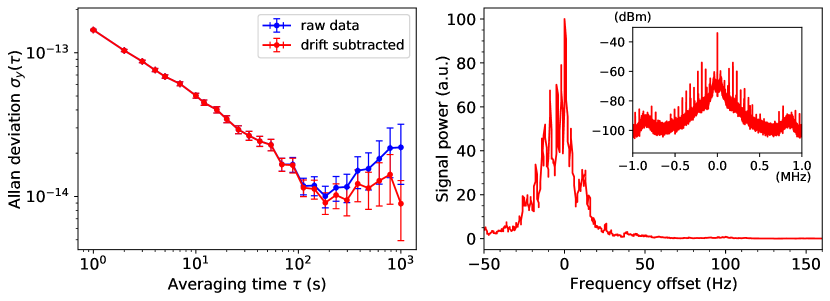
To achieve a thorough exploration of the technique’s potential in terms of resolution and accuracy required we developed an appropriate laser source with ultra-narrow spectral linewidth, ultra-high long-term absolute frequency stability, and precise frequency calibration. In the mid-infrared spectral range such sources are not routinely available. Our source is based on generation of difference-frequency radiation () from two individually frequency-stabilized, commercial semiconductor lasers (, ), see Fig. 1. We compute the frequency of the mid-infrared radiation from the two laser frequencies, that we measure using a near-infrared frequency comb. Figure 2 presents data on the spectral purity and frequency stability of our source. We estimate the linewidth of the m radiation to be less than 100 Hz (see Methods).
Our test ion is the one-electron diatomic molecular ion of mass 3 u. The choice of this ion is owed to the feasibility of ab initio calculation of transition frequencies, so that the experimentally assessed spectroscopic accuracy of the method can also be independently verified. The ab initio calculation method itself has been stringently tested by a recent related experiment in the same ion trap Alighanbari2020 . We interrogate the electric-dipole-allowed, one-photon fundamental vibrational transition in the ground electronic state . denote the rotational and vibrational quantum number, respectively. The transition frequency is . See Methods for details.
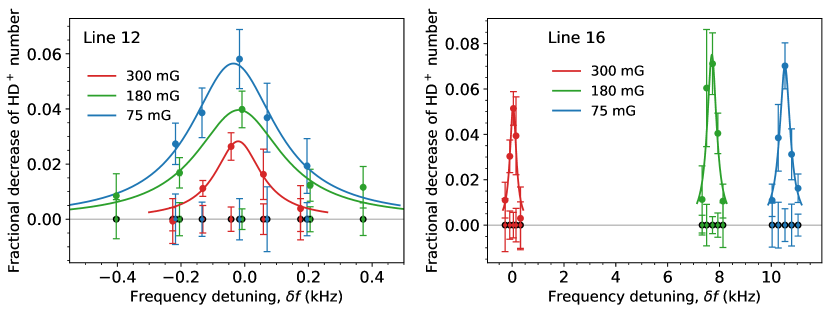
possesses hyperfine (spin) structure and we focus on two transition components, denoted by line 12 and line 16 (see Methods and Supplementary Information, SI), which share the same lower hyperfine state. The respective upper hyperfine states have the same particle spin coupling but differ in the coupling between total particle spin and rotational angular momentum. This results in different total angular momenta in the upper states. For maximum resolution we address individual Zeeman components of the spin structure of the vibrational transition in the presence of a small magnetic field. We specifically measure the Zeeman components, because they exhibit only a comparatively small quadratic Zeeman shift (see Methods). Here, () is the projection of the total angular momenta () on the static magnetic field direction.
Figure 3 shows one Zeeman component of line 12 and of line 16. The highest line resolutions obtained were (full linewidths smaller than 0.2 kHz). We measured several systematic shifts. 1) Zeeman shift; we measured the transition frequency of each line for three values of the magnetic field . The shifts are consistent with the ab initio prediction. Assuming the predicted quadratic-in- scaling, an extrapolation to was performed. 2) The laser light for beryllium ion laser cooling ( mW at 313 nm) potentially causes a light shift via the polarisability of the molecular ion. A measurement showed that there is no effect at kHz level, and the theoretical estimate justifies setting this shift to zero in our analysis. 3) A shift caused by the trap RF electric field. Measurement of the transition frequency of each line for three RF amplitude values allowed for an extrapolation to zero amplitude. The extrapolated values are approximately 0.3 kHz smaller than the values at our nominal operational RF amplitude. 4) We irradiate the spectroscopy wave and the two photodissociation lasers alternatingly to avoid light shifts caused by the latter. 5) Our theoretical estimation reveals that other systematic shifts are negligible compared to the uncertainties resulting from the above determinations. See Methods for further details.
We obtain the extrapolated zero-field frequencies
| (1) | ||||
The indicated uncertainties result from the realized linewidths and the achieved precision of the determination of the systematic shifts. Thus, the lowest experimental uncertainty is fractionally.
The difference of the frequencies in eq. (1) is a spin-rotation splitting. Its experimental value can be compared with the predicted splitting, eq. (9) (see Methods). Theory and experiment agree very well within the combined uncertainty of 0.54 kHz.
We furthermore compare the above values with ab initio values , computed using the approach described in Methods. Using current (2018) Committee on Data for Science and Technology (CODATA 2018) values of the fundamental constants Tiesinga2019 and their uncertainties (case I) results in
| (2) |
For both frequencies, the indicated uncertainties are in fractional terms. The first uncertainty of both frequencies, 0.5 kHz, is an estimate of the unevaluated QED contributions. It has been reduced by a factor 42 in theoretical work spanning the last 9 years. If for , , the most accurate Penning trap mass values Koehler2015 ; Heisse2019 ; Rau2020 are used (case II), instead of their CODATA 2018 values, the predictions are shifted by +1.5 kHz, and the last uncertainty contribution reduces to 1.1 kHz. Our experimental values are consistent with both predictions I, II within the combined uncertainties.
Any normalized linear combination of the two experimental vibrational frequencies, with respective theoretical spin structure contributions subtracted, yields the spin-averaged vibrational frequency,
| (3) |
We may choose the weight in this composite frequency so that the total spin theory uncertainty is minimized Alighanbari2020 . However, we find that the uncertainty is minimized over a wide range of values between 0 and 1, without any significant reduction compared to that of and . For ,
| (4) |
The value agrees with the prediction , eq. (7), both for case I and II. The combined uncertainty of experimental and predicted values is . This realizes a test of three-body quantum physics with state-of-the-art precision, and limited by the uncertainties of of the mass values.
The fundamental vibrational frequency depends on the nuclear masses dominantly via the reduced nuclear mass , being closely proportional to . We may therefore determine the ratio by requiring ,
| (5) |
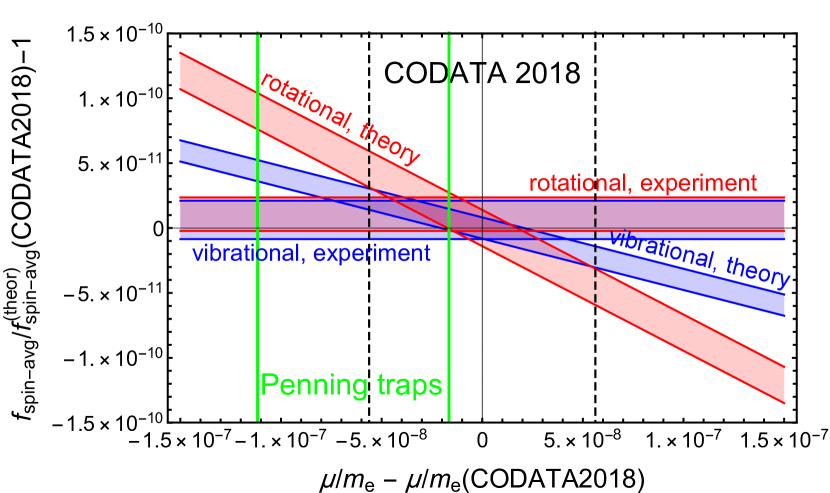
The last uncertainty contribution is due to that of the nuclear charge radii and the Rydberg constant , and the total fractional uncertainty is . As shown in Fig. 4, the value eq. (5) is consistent with the values from (i) CODATA 2018, (ii) recent Penning trap measurements of , , and Sturm2014 ; Heisse2019 ; Fink2020 ; Rau2020 , and (iii) our HD+ experimental rotational frequency and its theory Alighanbari2020 . The consistency between our vibrational and rotational values represents a direct test of the correctness of our QED and spin theory for this molecule, where today’s uncertainties of the fundamental constants do not enter at a relevant level.
Since the CODATA uncertainty of contributes most to the CODATA 2018 uncertainty of , we may alternatively fit . In this case, for we use the mean of the two recent precise values measured with Penning traps Fink2020 ; Rau2020 . For the remaining fundamental constants we use the CODATA 2018 values. We obtain
| (6) |
with total fractional uncertainty . The value is in agreement with other recent precision measurements:
(1) , obtained from Penning trap determinations Koehler2015 ; Heisse2019 ,
(2) obtained from combining rotational spectroscopy of HD+ and one Penning trap measurement of Fink2020 , and
(3) obtained from a HD+ high-overtone vibrational frequency, its theory and CODATA2018 constants Patra2020 .
We note that our result, eq. (6), is limited in precision by the hyperfine structure theory. In the future this limitation may be overcome by an improved theory Korobov2020 .
In conclusion, we demonstrated a one-photon optical spectroscopy method for ensembles of molecular ions that achieved a more than higher fractional resolution Bressel2012 and a 400-fold higher fractional accuracy than previously Bressel2012 ; Biesheuvel_2016 . We improved the absolute accuracy in determining a molecular-ion hyperfine splitting by optical spectroscopy by a factor 400. We also achieved an uncertainty in the experimental determination of a vibrational transition frequency of the present test ion, by measurement and theoretical evaluation of the systematic shifts. Because the employed test molecule is not particularly insensitive to external perturbations, we expect that similar () inaccuracy levels should be achievable for numerous other molecular ion species. An independent test of the accuracy was possible by comparing our experimental composite transition frequency with the ab initio calculation. We found agreement at the level. We also showed the usefulness of the technique for the field of precision physics, by deriving values of fundamental mass ratios with uncertainties close to those of the most precise measurements Sturm2014 ; Heisse2019 ; Alighanbari2020 ; Patra2020 . A possible further exploitation of the technique is the study of molecular ions for tests of the equivalence principle Schiller2005 . We believe that the present technique is applicable also to electric quadrupole vibrational transitions of homonuclear diatomic ions Germann2014 , which are relevant for the above studies Schiller2014 ; Karr2014 .
While we employed a light coolant atomic ion in the present demonstration, coolant atomic ions of larger mass are suitable for co-trapping and sympathetic cooling molecular ions of correspondingly larger mass. With a coolant ion mass upper bound of 160 u a vast variety of singly charged molecular ions can be covered. The experimental configuration and employed techniques are comparatively accessible and should lend themselves to adoption by the spectroscopy community. Future work will explore the resolution and accuracy limits of this novel technique, and applicability to single-species ensembles.
References
- (1) Rosenband, T. et al. Observation of the Clock Transition in . Phys. Rev. Lett. 98, 220801 (2007).
- (2) Chou, C. W., Hume, D. B., Thorpe, M. J., Wineland, D. J. & Rosenband, T. Quantum Coherence between Two Atoms beyond . Phys. Rev. Lett. 106, 160801 (2011).
- (3) Dicke, R. H. The effect of collisions upon the Doppler width of spectral lines. Phys. Rev. 89, 472–473 (1953).
- (4) Major, F. G. & Werth, G. High-Resolution Magnetic Hyperfine Resonance in Harmonically Bound Ground-State Ions. Phys. Rev. Lett. 30, 1155–1158 (1973).
- (5) Rosenband, T. et al. Frequency ratio of Al+ and Hg+ single-ion optical clocks; Metrology at the 17th decimal place. Science 319, 1808–1812 (2008).
- (6) Derevianko, A. & Katori, H. Colloquium: Physics of optical lattice clocks. Rev. Mod. Phys. 83, 331–347 (2011).
- (7) Poli, N., Oates, C. W., Gill, P. & Tino, G. M. Optical atomic clocks. Rivista del Nuovo Cimento 36, 555–624 (2013).
- (8) Ludlow, A. D., Boyd, M. M., Ye, J., Peik, E. & Schmidt, P. O. Optical atomic clocks. Rev. Mod. Phys. 87, 637–701 (2015).
- (9) Diedrich, F., Bergquist, J. C., Itano, W. M. & Wineland, D. J. Laser cooling to the zero-point energy of motion. Phys. Rev. Lett. 62, 403–406 (1989).
- (10) Lechner, R. et al. Electromagnetically-induced-transparency ground-state cooling of long ion strings. Phys. Rev. A 93, 053401 (2016).
- (11) Schmidt, P. O. et al. Spectroscopy using quantum logic. Science 309, 749–752 (2005).
- (12) Alighanbari, S., Hansen, M. G., Korobov, V. I. & Schiller, S. Rotational spectroscopy of cold and trapped molecular ions in the Lamb-Dicke regime. Nat. Phys. 14, 555 – 559 (2018).
- (13) Alighanbari, S., Giri, G. S., Constantin, F. L., Korobov, V. I. & Schiller, S. Precise test of quantum electrodynamics and determination of fundamental constants with ions. Nature 581, 152 – 158 (2020).
- (14) Chou, C. W. et al. Frequency-comb spectroscopy on pure quantum states of a single molecular ion. Science 367, 1458–1461 (2020).
- (15) Kondov, S. S. et al. Molecular lattice clock with long vibrational coherence. Nat. Phys. 15, 1118–1122 (2019).
- (16) Patra, S. et al. Proton-electron mass ratio from laser spectroscopy of HD+ at the part-per-trillion level. Science 369, 1238–1241 (2020).
- (17) Wolf, F. et al. Non-destructive state detection for quantum logic spectroscopy of molecular ions. Nature 530, 457–460 (2016).
- (18) Zhang, C. Production and sympathetic cooling of complex molecular ions. Ph.D. thesis, Heinrich-Heine-Universität Düsseldorf (2008).
- (19) Lakkaraju, H. S. & Schuessler, H. A. Motional side-band resonances in the microwave spectrum of stored ions. J. Appl. Phys. 53, 3967–3974 (1982).
- (20) Cutler, L. S., Giffard, R. P. & McGuire, M. D. Thermalization of 199Hg ion macromotion by a light background gas in an RF quadrupole trap. Appl. Phys. B 36, 137–142 (1985).
- (21) Prestage, J. D., Dick, G. J. & Maleki, L. Ultrastable Hg+ Trapped Ion Frequency Standard. In 22nd Annual Precise Time and Time Interval (PTTI) Applications and Planning Meeting, Vienna, VA, 4-6 Dec., 171–186 (1990).
- (22) Fisk, P. T. H., Sellars, M. J., Lawn, M. A. & Coles, C. Accurate Measurement of the 12.6 GHz ”Clock” Transition in Trapped Yb+ Ions. IEEE Trans. Ultrasonics, Ferroelectrics, and Freq. Control 44, 344–354 (1997).
- (23) Tiesinga, E., Mohr, P. J., Newell, D. B. & Taylor, B. N. Values of Fundamental Physical Constants (2019). URL https://physics.nist.gov/cuu/Constants/index.html.
- (24) Köhler, F. et al. The electron mass from -factor measurements on hydrogen-like carbon 12C5+. J. Phys. B: At. Mol. Opt. Phys. 48, 144032 (2015).
- (25) Heiße, F. et al. High-precision mass spectrometer for light ions. Phys. Rev. A 100, 022518 (2019).
- (26) Rau, S. et al. Penning trap mass measurements of the deuteron and the HD+ molecular ion. Nature 585, 43–47 (2020).
- (27) Sturm, S. et al. High-precision measurement of the atomic mass of the electron. Nature 506, 467–470 (2014).
- (28) Fink, D. J. & Myers, E. G. Deuteron-to-Proton Mass Ratio from the Cyclotron Frequency Ratio of to with in a Resolved Vibrational State. Phys. Rev. Lett. 124, 013001 (2020).
- (29) Korobov, V. I., Karr, J.-P., Haidar, M. & Zhong, Z.-X. Hyperfine structure in the and molecular ions at order . Phys. Rev. A 102, 022804 (2020).
- (30) Bressel, U. et al. Manipulation of individual hyperfine states in cold trapped molecular ions and application to HD+ frequency metrology. Phys. Rev. Lett. 108, 183003 (2012).
- (31) Biesheuvel, J. et al. High-precision spectroscopy of the HD+ molecule at the 1-p.p.b. level. Appl. Phys. B 123, 23 (2016).
- (32) Schiller, S. & Korobov, V. Test of time-dependence of the electron and nuclear masses with ultracold molecules. Phys. Rev. A 71, 032505 (2005).
- (33) Germann, M., Tong, X. & Willitsch, S. Observation of dipole-forbidden transitions in sympathetically cooled, state-selected, homonuclear diatomic molecular ions. Nat. Phys. 10, 820–824 (2014).
- (34) Schiller, S., Bakalov, D. & Korobov, V. I. Simplest molecules as candidates for precise optical clocks. Phys. Rev. Lett. 113, 023004 (2014).
- (35) Karr, J.-P. H and HD+: candidates for a molecular clock. J. Mol. Spectrosc. 300, 37 – 43 (2014).
I Methods
I.1 Experimental Apparatus
The ion trap apparatus used in the present work (Fig. 1) has been described previously Alighanbari2018 ; Alighanbari2020 . The ion trap exhibits a minimum distance between diagonally opposing electrodes of 8.6 mm. We have newly developed the laser system, which consists of two continuous-wave high-power diode lasers (L1, L2) emitting at 1.18 m and 1.54 m, whose radiation is mixed in a periodically-poled LiNbO3 crystal to produce the difference-frequency wave having a wavelength of 5.1 m.
L1 and L2 are each phase-locked to a femtosecond fiber frequency comb, which is itself phase-locked to a 1.06 m laser. We stabilize this laser to an ultra-low-expansion glass cavity [37], representing the optical flywheel reference of the whole system. Our phase locking scheme allows flexible tuning of the mid-infrared radiation, limited by tunability of the pump lasers.
The three optical beats required to implement the three phase locks are continuously monitored with spectrum analyzers. The beats exhibit RF linewidths below 1 Hz. To independently verify the quality of the frequency comb stability, we show in Fig. 2 (right) the beat between a fourth diode laser (1.56 m) stabilized to its own reference cavity [36] (both not shown in Fig. 1) and an appropriate comb mode. This wavelength 1.56 m is significantly different from wavelength of the phase-locked comb mode, 1.06 m and therefore the beat is a sensitive monitor of comb frequency noise. The full-width-at-half-maximum linewidth of the beat is less than 50 Hz. We infer that the linewidths of the lasers L1, L2 are also less than 50 Hz. The linewidth of the mid-infrared radiation is probably significantly less than 100 Hz because there is common-mode frequency noise in L1 and L2, originating from the 1.06-m-laser’s frequency instability.
We determine the absolute optical frequencies of L1, L2 in real time by measuring the repetition rate of the frequency comb and the carrier envelope offset frequency . A hydrogen maser provides the reference frequency for the frequency counter. The frequency of the mid-infrared radiation is computed as . Note that drops out. The absolute frequency measurement uncovers the slow frequency drift of the mid-infrared radiation (of order 0.1 Hz/min). We take this into account during spectroscopy. The frequency instability of the mid-infrared radiation is less than on time scales exceeding 1 s, and drops to below . The maser frequency itself is measured by comparison with a 1 pulse-per-second signal obtained from GNSS satellites. The maser frequency’s deviation from 10 MHz is corrected for in the data analysis.
I.2 Experimental procedures
The preparation and spectroscopy sequence is a variation of a previously described procedure Alighanbari2020 .
A destructive spectroscopy is performed, where the vibrationally excited molecular ions are subsequently dissociated by sequential excitation by two additional lasers (resonance-enhanced multiphoton dissociation, REMPD). The fractional decrease in number of trapped, intact HD+ ions is determined. The first laser for REMPD is a continuous-wave 1475 nm laser tuned to the transition, and the second one is a 266 nm continuous-wave laser for subsequent dissociation.
Before the spectroscopy wave irradiation we perform 40 s of rotational laser cooling to increase the population in the ground state .
An important difference compared to our previous work is that the spectroscopy radiation and the nm and 266 nm waves for REMPD are not on simultaneously. Instead, we use a 5.2 s long sequence during which spectroscopy and REMPD lasers are alternatingly blocked and unblocked for 100 ms each. Power broadening of the transition by the spectroscopy laser wave power is present but is kept moderate (Fig. 2 in SM) by operating at sufficiently low power. However, performing spectroscopy with high laser power is helpful for finding transitions.
I.3 Vibrational transition
The HD+ molecule harbors four angular momenta: electron spin, proton spin, deuteron spin and rotational angular momentum. The associated magnetic moments cause a hyperfine structure [38]. The ground rovibrational level has zero rotational angular momentum , giving rise to 4 spin states with total angular momentum (this and other values are in part approximate quantum numbers). The first excited vibrational level has 10 spin states, having values . Spin states are -fold degenerate in zero magnetic field. A small applied magnetic field leads to a quadratic Zeeman shift for states, to a linear shift for the stretched states and to a combined linear plus quadratic shift for the remaining Zeeman states.
We study two spin components having the same lower state (see Fig. 1
in SM):
line 12: ,
line 16: .
Here refers to the sum of electron and proton spin, to the sum of and deuteron spin, and to the sum of and rotational angular momentum. We denote the transition frequencies in zero external fields by , .
I.4 Ab initio theory of the HD+ vibrational transition
An ab initio transition frequency is composed of two contributions, . The main one is the spin-averaged frequency , the difference between the level energies of the three-body system. The energies include the (essentially exact) non-relativistic energy plus relativistic, quantum-electrodynamic and finite-nuclear-size corrections evaluated by perturbation theory [39]. The calculated value is
| (7) |
CODATA 2018 values Tiesinga2019 of the fundamental constants have been used (case I); the frequency value is updated compared to the value presented in ref. [40]. The contributions of relative order to eq. (7) are , kHz. The proton size contributes , the deuteron size ; these contributions are included in the term of relative order . Several further corrections were added, e.g. stemming from the polarizability of the deuteron, from second-order vibrational contributions (of relative order ), etc., amounting to . The first uncertainty indicated in eq. (7), kHz ( fractionally), is an estimate of the unevaluated QED contributions. The second uncertainty is due to the uncertainties of the fundamental constants. Here, the most important contribution is from the uncertainty of , 1.1 kHz.
To obtain the functional dependence of the spin-averaged frequency on we calculated ab initio the derivative ; it is close to the Born-Oppenheimer value .
The hyperfine structure in both the ground and the excited vibrational level results in the hyperfine shifts . The main contribution to the hyperfine structure of each level comes from the Fermi contact interaction between electron spin and proton spin, followed by the contact interaction between the electron spin and the deuteron spin. These and further interactions are described by an effective Hamiltonian [38] and quantified by corresponding spin structure coefficients: for the level and for the () level. The different strengths of the interactions in the two levels lead to a nonzero hyperfine shift. Given the aim of this work, it is important to have an accurate prediction for the hyperfine shift, implying the need for an accurate ab initio computation of the coefficients . A high-precision calculation [41] provides the set of Fermi contact interaction coefficients : . The values for the ground state have already played a role in rotational spectroscopy Alighanbari2020 . For the level , are computed here for the first time and are given in SM. These coefficients have fractional theoretical uncertainties, , of order . We estimate . The set contributes approximately kHz to both and . The sensitivities are taken from Tab. 1 in SM.
The coefficient is the next-largest spin coefficient. It has recently been the subject of intense theory work beyond the Breit-Pauli approximation, resulting in the value shown in Tab. 1 of SM, with an improved theory uncertainty of kHz [29, 42]. The set comprising the remaining spin coefficients , , , has been computed within the Breit-Pauli approximation. It neglects terms of relative order ; therefore we assume that the fractional uncertainties of the set’s elements are . As a result, the dominant contribution of the set to the uncertainties of and is from the coefficient and , respectively.
In summary, the individual spin frequencies are
| (8) |
The uncertainties were here estimated as
The uncertainties from the various spin coefficients are not added quadratically because we cannot assume that they are independent random errors. The sum of eq. (7) and eq. (8) is eq. (2).
The hyperfine splitting depends only on the spin coefficients of the upper level, since line 12 and line 16 have a common lower state. The uncertainty of the splitting is not affected by the uncertainties of , since , . The uncertainty is mostly determined by the uncertainties of the next-next-largest coefficients and ,
| (9) |
The difference of the two measured vibrational frequencies is
in very good agreement with the prediction.
I.5 Systematic shifts
We have previously computed several external-field shifts of vibrational transition frequencies: Zeeman shift [43], electric quadrupole shift [44], d.c. Stark shift, black-body radiation shift, and spin-state dependence of the d.c. Stark and light shift [45]. Black-body radiation shift and electric quadrupole shift are negligible.
The Zeeman shifts for the components of line 12 and 16 are kHz/G2 and kHz/G2, respectively. For the transitions between stretched states, of line 16, the Zeeman shift is purely linear, with coefficients kHz/G.
The light shift of the lower and upper vibrational levels due to the 313 nm cooling radiation can be computed using the ab initio frequency-dependent polarisability values. The latter can be calculated using the procedure described in [45]. For the lower level, they have already been reported in ref. Alighanbari2020 . For the upper level the scalar () and tensor () polarisabilities are atomic units, atomic units. They are within 1.5 atomic units of the values for the lower level. The calculated light shift is therefore negligible.
Following ref. Alighanbari2020 , we also investigated the effect on the transition frequency of a substantial displacement of the atomic ion cluster in radial direction. When doing so, the HD+ ion string does not visibly shift. The deformation was obtained by changing substantially the d.c. voltages on the two lower trap electrodes by 5 V, shifting the beryllium cluster by approximately 0.10 mm orthogonally to the trap axis. No frequency shift was observed, with an upper bound of (Fig. 3 in SM). The upper bound of the corresponding frequency shift of the rotational transition Alighanbari2020 was significantly smaller than this value. We expect the shifts to be of similar absolute magnitude for the two cases. We therefore do not apply any correction or uncertainty for this perturbation in our analysis. Thus, the only systematic shifts corrected for in this work are Zeeman and trap-induced d.c. Stark shifts, see main text.
For every measured transition line we assigned one-half of the fitted full width as statistical uncertainty of the line center transition frequency.
I.6 Composite frequency
The spin theory uncertainty of the composite frequency is computed as
where .
I.7 Previous results on high-resolution spectroscopy and mid-infrared spectroscopy sources
We briefly review the work achieving the highest line resolutions without Lamb-Dicke or resolved-carrier regime. For gas-phase neutral molecules at non-cryogenic temperature, line resolutions up to were achieved for vibrational transitions [46-48] and for electronic transitions [49], using saturation or Ramsey spectroscopy (for a special case, see [50]). In contrast, for atomic and molecular ions under gaseous conditions the best resolutions have been significantly lower. For example, saturation spectroscopy of gas-phase molecular ions has led to resolution (absolute full linewidths at the 50 MHz level) [51]. Using the ion beam technique, electronic and vibrational transitions have been observed with resolutions up to [52] and [53, 54], respectively. In ion traps equipped with cooling by collisions with cold helium buffer gas, resolution in vibrational spectroscopy (30 MHz linewidth) has been reached [55].
Previously, one-photon vibrational spectroscopy of sympathetically cooled molecular ion ensembles has been reported [30, 33, 56-59]. However, in these experiments, the spectroscopy wave was irradiated along the trap axis and/or the laser linewidth was high, leading to highest line resolution of (3 MHz absolute linewidth) Bressel2012 .
Difference-frequency sources emitting at shorter wavelength were reported earlier (see ref. [60] for an overview), but had larger linewidth and/or higher frequency instability than the present one. At 3.4 m, linewidths of 60 kHz [61] and more recently of 3.5 kHz [62] were achieved. An alternative approach are quantum cascade lasers. They have been shown to allow ultra-narrow linewidth and precise frequency calibration [63, 64] (see ref. [65] for a review).
Acknowledgements.
We are indebted to E. Wiens for assistance with the frequency comb measurements. We are very grateful to J.-P. Karr for communicating the value of before publication. This work has received funding from the European Research Council (ERC) under the European Union’s Horizon 2020 research and innovation programme (grant agreement No. 786306, “PREMOL”), from the Deutsche Forschungsgemeinschaft (Schi 431/23-1) and from both DFG and the state of Nordrhein-Westfalen via grant INST-208/737-1 FUGG. I.K. was partly supported by FP7-2013-ITN “COMIQ” (Grant No. 607491). V.I.K. acknowledges support from the Russian Foundation for Basic Research under Grant No. 19-02-00058-a.Author Contributions
I.K., M.G.H., and S.S. developed the laser system, I.K., S.A., and G.S.G. performed the experiments and analyzed the data, I.K., S.S. and V.I.K. performed theoretical calculations, S.S. conceived the study, supervised the work and wrote the paper. All authors contributed to editing of the manuscript.
Data Availability
Source data are available for this paper. All other data that support
the plots within this paper and other findings of this study are
available from the corresponding author upon reasonable request.
Additional Information
Supplementary Information is available for the paper at [DOI link to be inserted]
Correspondence and requests for materials should be addressed to S. Schiller.
The authors declare no competing financial or non-financial interests.
Reprints and permissions information is available at www.nature.com/reprints.
References for Methods
[36] Chen, Q.-F. et al. A compact, robust, and transportable ultra-stable laser with a fractional frequency instability of . Rev. Sci. Instrum. 85, 113107 (2014).
[37] Wiens, E., Nevsky, A. Y. & Schiller, S. Resonator with ultrahigh length stability as a probe for equivalence-principle-violating physics. Phys. Rev. Lett. 117, 271102 (2016).
[38] Bakalov, D., Korobov, V. I. & Schiller, S. High-precision calculation of the hyperfine structure of the HD+ ion. Phys. Rev. Lett. 97, 243001 (2006).
[39] Korobov, V. I., Hilico, L. & Karr, J.-P. Fundamental Transitions and Ionization Energies of the Hydrogen Molecular Ions with Few ppt Uncertainty. Phys. Rev. Lett. 118, 233001 (2017).
[40] Aznabayev, D. T., Bekbaev, A. K. & Korobov, V. I. Leading-order relativistic corrections to the rovibrational spectrum of and molecular ions. Phys. Rev. A 99, 012501 (2019).
[41] Korobov, V. I., Koelemeij, J. C. J., Hilico, L. & Karr, J.-P. Theoretical Hyperfine Structure of the Molecular Hydrogen Ion at the 1 ppm Level. Phys. Rev. Lett. 116, 053003 (2016).
[42] Karr, J.-P. & Haidar, M. private comm. (2020).
[43] Bakalov, D., Korobov, V. & Schiller, S. Magnetic field effects in the transitions of the HD+ molecular ion and precision spectroscopy. J. Phys. B: At. Mol. Opt. Phys. 44, 025003 (2011). Corrigendum: J. Phys. B: At. Mol. Opt. Phys. 45, 049501 (2012).
[44] Bakalov, D. & Schiller, S. The electric quadrupole moment of molecular hydrogen ions and their potential for a molecular ion clock. Appl. Phys. B 114, 213–230 (2014).
[45] Schiller, S., Bakalov, D., Bekbaev, A. K. & Korobov, V. I. Static and dynamic polarizability and the Stark and blackbody-radiation frequency shifts of the molecular hydrogen ions H, HD+, and D. Phys. Rev. A 89, 052521 (2014).
[46] Hall, J. L., Bordé, C. J. & Uehara, K. Direct optical resolution of the recoil effect using saturated absorption spectroscopy. Phys. Rev. Lett. 37, 1339–1342 (1976).
[47] Salomon, C., Bréant, C., Bordé, C. & Barger, R. Ramsey fringes using transitions in the visible and 10--m spectral regions - experimental methods. Journal de Physique Colloques 42, 3–14 (1981).
[48] Bagayev, S. N., Baklanov, A. E., Chebotayev, V. P. & Dychkov, A. S. Superhigh resolution spectroscopy in methane with cold molecules. Appl. Phys. B 48, 31–35 (1989).
[49] Cheng, W.-Y., Chen, L., Yoon, T. H., Hall, J. L. & Ye, J. Sub-Doppler molecular-iodine transitions near the dissociation limit (523 - 498 nm). Opt. Lett. 27, 571–573 (2002).
[50] Bagayev, S. N. et al. Second-order doppler-free spectroscopy. Appl. Phys. B 52, 63–66 (1991).
[51] Markus, C. R., Kocheril, P. A. & McCall, B. J. Sub-Doppler rovibrational spectroscopy of the fundamental band of D2H+. J. Mol. Spectrosc. 355, 8–13 (2019).
[52] Mills, A. A. et al. Ultra-sensitive high-precision spectroscopy of a fast molecular ion beam. J. Chem. Phys. 135, 224201 (2011).
[53] Wing, W. H., Ruff, G. A., Lamb, W. E. & Spezeski, J. J. Observation of the Infrared Spectrum of the Hydrogen Molecular Ion HD+. Phys. Rev. Lett. 36, 1488–1491 (1976).
[54] Coe, J. V. et al. Sub-Doppler direct infrared laser absorption spectroscopy in fast ion beams: The fluorine hyperfine structure of HF+. J. Chem. Phys. 90, 3893–3902 (1989).
[55] Markus, C. R., Thorwirth, S., Asvany, O. & Schlemmer, S. High-resolution double resonance action spectroscopy in ion traps: vibrational and rotational fingerprints of CH2NH. Phys. Chem. Chem. Phys. 21, 26406–26412 (2019).
[56] Roth, B., Koelemeij, J. C. J., Daerr, H. & Schiller, S. Rovibrational spectroscopy of trapped molecular hydrogen ions at millikelvin temperatures. Phys. Rev. A 74, 040501 (2006).
[57] Koelemeij, J. C. J., Noom, D. W. E., de Jong, D., Haddad, M. A. & Ubachs, W. Observation of the vibrational overtone in cold trapped HD+. Appl. Phys. B 107, 1075–1085 (2012).
[58] Biesheuvel, J. et al. Probing QED and fundamental constants through laser spectroscopy of vibrational transitions in HD+. Nat. Commun. 7, 10385 (2016).
[59] Calvin, A. T. et al. Rovibronic Spectroscopy of Sympathetically Cooled 40CaH+. J. Phys. Chem. A 122, 3177–3181 (2018).
[60] Liao, C.-C., Lien, Y.-H., Wu, K.-Y., Lin, Y.-R. & Shy, J.-T. Widely tunable difference frequency generation source for high-precision mid-infrared spectroscopy. Opt. Express 21, 9238–9246 (2013).
[61] Takahata, K. et al. Absolute frequency measurement of sub-doppler molecular lines using a 3.4 m difference-frequency-generation spectrometer and a fiber-based frequency comb. Phys. Rev. A 80, 032518 (2009).
[62] Sera, H. et al. Sub-Doppler resolution mid-infrared spectroscopy using a difference-frequency-generation source spectrally narrowed by laser linewidth transfer. Opt. Lett. 40, 5467–5470 (2015).
[63] Hansen, M. G., Magoulakis, E., Chen, Q.-F., Ernsting, I. & Schiller, S. Quantum cascade laser-based mid-IR frequency metrology system with ultra-narrow linewidth and -level frequency instability. Opt. Lett. 40, 2289–2292 (2015).
[64] Argence, B. et al. Quantum cascade laser frequency stabilization at the sub-Hz level. Nat. Photonics 9, 456–460 (2015).
[65] Borri, S. et al. High-precision molecular spectroscopy in the mid-infrared using quantum cascade lasers. Appl. Phys. B 125, 18 (2019).