UTe2: a nearly insulating half-filled
heavy fermion metal
Abstract
Correlated band theory implemented as a combination of density functional theory with exact diagonalization [DFT+U(ED)] of the Anderson impurity term with Coulomb repulsion in the open 14-orbital shell is applied to UTe2. The small gap for =0, evidence of the half-filled subshell of uranium, is converted for =3 eV to a flat band semimetal with small heavy-carrier Fermi surfaces that will make properties sensitive to pressure, magnetic field, and off-stoichiometry, as observed experimentally. Two means of identification from the Green’s function give a mass enhancement of the order of 12 for already heavy (flat) bands, consistent with the common heavy fermion characterization of UTe2. The predicted Kondo temperature around 100 K matches the experimental values from resistivity. The electric field gradients for the two Te sites are calculated by DFT+U(ED) to differ by a factor of seven, indicating a strong site distinction, while the anisotropy factor is similar for all three sites. The calculated uranium moment of 3.5 is roughly consistent with the published experimental Curie-Weiss values of 2.8 and 3.3 (which are field-direction dependent), and the calculated separate spin and orbital moments are remarkably similar to Hund’s rule values for an ion. The =3 eV spectral density is compared with angle-integrated and angle-resolved photoemission spectra, with agreement that there is strong character at, and for several hundred meV below, the Fermi energy. Our results support the picture that the underlying ground state of UTe2 is that of a half-filled subshell with two half-filled orbitals forming a narrow gap by hybridization, then driven to a conducting state by configuration mixing (spin-charge fluctuations). UTe2 displays similarities to UPt3 with its dominated Fermi surfaces rather than a strongly localized Kondo lattice system.
I Introduction
Recently discovered superconductivity (SC) in the heavy fermion material UTe2 Ran2019 ; Aoki2019 below 1.7K, earlier studied in single crystal form,Ikeda2006 shows a number of peculiar aspects. Unlike in several other U superconductors (UGe2, UCoGe, URhGe, UCoAl) which display coexisting superconductivity and ferromagnetism, no long range magnetic order in the ground state has been observed. The magnetic susceptibility Ran2019 ; Aoki2019 has Curie-Weiss character, with magnetic moment in 2.8-3.3/U range. Magnetic moments in a metal that do not order suggest UTe2 is associated with a class of conducting spin liquids. The large and anisotropic Curie-Weiss magnetic susceptibility suggest antiferromagnetic coupling, whereas other probes [NMR Knight shift and spin-lattice relaxation rate ()] suggest critical ferromagnetic fluctuations that could mediate SC in UTe2.Ran2019 ; Aoki2019 ; Tokunaga2019 The phase diagrams versus field and its direction, temperature, and pressure – including re-entrant superconductivity with application of field – are unusually complex, but those complications will not be addressed in this paper.
UTe2 is however a heavy fermion metal, with a large Sommerfeld coefficient mJ/K2,Ran2019 ; Aoki2019 indicative of Kondo screening of local moments. The resistivity cm is slowly increasing from room temperature down to 75K, then it decreases rapidly over two orders of magnitude just above Tc, typical heavy-fermion (HF) behavior with a Kondo temperature of 100K.Ran2019 The susceptibility for field along the easy axis increases strongly below 100K, becoming a factor of five or more larger than in the other two directions. The interpretation has been that of critical magnetic fluctuations around incipient FM order along the axis. A considerable number of measurements of electrical and thermal conductivity, NMR spectra, and penetration depth in magnetic fields gives strong justification of a point-node, Weyl superconducting state.
Based on a non-vanishing specific heat coefficient below Tc, UTe2 had originally been suggested by Ran and collaborators Ran-arxiv to provide a new phase of superconducting matter with a ‘Bogoliubov Fermi surface,’ a Fermi surface that is gapless over not points, or lines, but an area. However, subsequent extension of the measurements to 50 mK revealed an upturn in . The normal state , i.e. above the critical magnetic field) was fit with the conventional form augmented by a residual contribution of unknown origin, modeled by a form in the region of 50mK to Tc. would arise from thermal excitations that are not gapped by SC.Ran2019 ; Aoki2019 ; Metz2019 Supposing this extrapolation is reasonable up to around 2K (taken literally, it would give a divergent entropy), the excess entropy is (we estimate) of the order of , with , small enough to be extrinsic in origin.
U-based compounds provide a spectacular variety of behaviors, from ground states to unusual spectra. The ferromagnetic superconductors mentioned above have been reviewed and compared by Aoki, Ishida, and Floquet. Aoki2019a These compounds seem to require correlation corrections beyond conventional density functional theory (DFT) in its local or semilocal approximations to account for their properties. Superconducting UPt3 (T1 K), on the other hand, has six complicated Fermi surfaces that are described quite well by DFT calculations,Wang1987 ; McMullan with excellent agreement requiring only energy shifts of a few tens of meV. Isovalent and isostructural UPd3, on the other hand, is reproduced only when the U states are localized (removed from the valence states).Oguchi1986
The electronic structure of UTe2 has been studied from a first-principles itinerant (local density approximation [LDA]) viewpoint making use of density functional theory (DFT), initially by Aoki and collaborators Aoki2019 and Fujimori et al.Fujimori2019 . LDA however predicts a small gap for this heavy fermion metal, so these works were followed by others who have incorporated some correlation correction related to a (semi)localized nature of the states. Two of the current authors applied a DFT+orbital polarization approach [DFT+U(OP), using a Coulomb repulsion =], obtaining heavy bands giving large Fermi surfaces (FSs).Shick2019 In these calculations the uranium 5 states are treated as basically itinerant, with the repulsion and Hund’s exchange encouraging orbital polarization. Analysis indicated two roughly half-filled orbitals, , at the Fermi level, suggesting multiband half-filled physics.
Some of the most basic theoretical questions are unsettled. Standard DFT calculations give a U occupation near . From the viewpoint of strongly localized orbitals (=6 eV), Miao et al. investigated the effect of removing the 5-states from consideration, i.e. using ThTe2 without occupation as an underlying model of Fermi level bands.Miao2019 Applying dynamical mean field theory (DFT+DMFT) to UTe2 with a large value of repulsion (with similar results obtained by Xu et al.Xu2019 ), the bands were shifted in Mott insulator fashion away from EF, leaving a dispersive Te band and a large Fermi surface that was supported by their angle-resolved photoemission spectra (ARPES). A similar shift of bands was observed by Ishizuka and coauthorsIshizuka2020 applying the DFT+ method, even for moderate values of in the 1-2 eV range. ARPES data taken at higher energy with longer escape depth however give clear evidence of strong character extending to EF.Fujimori2019 Both the DFT+ and DFT+DMFT methods predict a predominant configuration (our own DFT+ calculations do so as well), whereas uranium core level spectroscopyFujimori2020 indicates the configuration is dominant, as in several other itinerant uranium intermetallics. We will present evidence that supports a dominant configuration. We address these differences within this paper, with some emphasis on angle-integrated PES (AIPES).
Less strongly correlated methods, such as we will present, leave flat bands at EF in a hybridized band picture consistent with dominated Fermi surfaces and with AIPES data, whereas transport and thermodynamic properties will be enhanced by residual (dynamic) interactions. Note that some U compounds, for example UPt3 and UBe13, are also heavy fermion metals that do not order magnetically but display exotic superconducting gap symmetry and electron dominated Fermi surfaces.Aoki2019a
This itinerant-localized dichotomy is itself not so unusual in metallic actinide compounds, reflecting the “dual” nature Zwicknagl2007 often exhibited by open 5 shells. Early on, Hill recognized the shortest U-U separation as a critical parameter in uranium intermetallics and provided the “Hill plot”Hill1970 ; Boring2000 of ordering temperature (magnetic or superconducting) versus U-U separation. If shorter than 3.5 Å, the states are itinerant and sometimes superconducting, if longer they display a local moment and usually order. This critical separation is not absolute: the Hill criterion was found to be violated when the heavy fermion metals UPt3 and UBe13 were synthesized and found to be superconducting without magnetic order. Still, the Hill criterion is a very useful and physically motivated guide. In this picture, the nearest neighbor U-U separation in UTe2 of 3.78 Å puts it well into the localized regime of the Hill plot: magnetic rather than superconducting. Just how UTe2 violates the Hill criterion is a fundamental question in the understanding of this fascinating compound.
This dual nature of the shell requires that both local and itinerant features of the -electrons may need to be allowed in a description of the electronic structure of UTe2. Ishizuka et. al. Ishizuka2020 performed DFT+ calculations (related somewhat to the DFT+(OP) results mentioned above) for empirically reasonable values of the effective Coulomb = = 1.1–2.0 eV, =0. Constraining their DFT+ calculations to the nonmagnetic phase, they obtained a metallic band structure, with reconstruction occurring around 1.1 eV. Contrary the results of Refs. [Miao2019, ; Xu2019, ], the electronic states near the Fermi energy () formed narrow bands with predominantly 5-character. The fundamental limitation of these calculations is that they rely on a single-determinant approximation for the 5-manifold of the U atom, and the DFT+ method is more adept in describing occurrence and effects of long-range magnetic order. Our calculations parallel to those of Ishizuka et al. indicate that their choice of Hund’s exchange =0, which neglects the anisotropy of the repulsive interaction and misses Hund’s exchange, has a substantial effect of the resulting band structure.
In this work we study electron correlation effects in UTe2 beyond the static mean-field DFT+ approximation. We extend DFT method making use an Anderson impurity treatment of the shell treated with exact diagonalization (ED) techniques and including the full self-consistency over the charge density. In Sec. II we describe the basic equations of the DFT+(ED) method. In Sec. III the electronic structure results for a conventional value of Coulomb =3 eV are presented and compared to large Coulomb =6 eV results. Sec. IV is devoted to a comparison with photoemission results, and a Summary in Sec. V concludes the paper.
II Structure and Methods
II.1 Structure
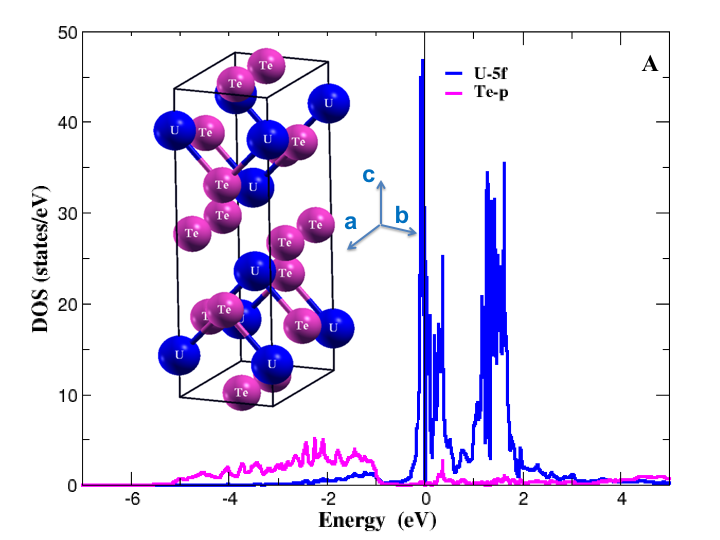
UTe2 crystallizes in a body-centered orthorhombic structure Ikeda2006 (space group #71) with =4.161 Å, =6.122 Å, =13.955 Å, this volume containing two formula units (f.u.) (see Fig.1A). The atomic sites and symmetries are: U, (0,0,0.13544) ; Te1, ( ; Te2, (0,0.2509,) . The U-U separations are, in increasing order, 3.78 Å dimer separations directed along the -axis, 4.16 Å along the -axis (the lattice constant), 4.89 Å in the plane, and 6.12 Å along the -axis (the lattice constant). The normal to the cleavage plane lies 23.7∘ from the -axis in the plane. The structure is sometimes pictured as U ladders lying in the cleavage plane, or even two sets of U ladders, but the large U-U separation makes any quasi-one-dimensional aspects difficult to identify. Note: much of our description will use the orthorhombic pseudo-zone with dimensions
II.2 Formalism of the DFT+U(ED) method
Given the combination of itinerant behavior with localized physics in actinide materials and the Fermi liquid character of UTe2, we aim for an effective (low energy) band structure that nevertheless includes essential effects of on-site repulsion and Hund’s exchange on the uranium site and related configurations, and does so self-consistently. We use an extension of the widely used DFT+U methodylvisaker that makes use of a combination of DFT with the exact diagonalization (ED) of the multiconfigurational shell of uranium, in the spirit of a generalized and orbital-occupation (charge, with spin) self-consistent generalization of the Anderson impurity model analogous that that done in dynamical mean field theory.
This DFT+U(ED) method takes advantage of the fact that electron interactions in the , , and shells are well described in DFT, whereas interelectronic interactions within the shell are treated explicitly. We use the fully anisotropic, rotationally invariant implementation of the interaction in the DFT+U method in the full-potential linearized augmented plane wave (FP-LAPW) basis that includes both scalar-relativistic and spin-orbit coupling (SOC) effects shick99 ; shick01 . The calculations were carried out in the observed paramagnetic state, however both spin and orbital moment effects, such as rms values of the moments, are included in this U(ED) extension.
The effects of the interaction Hamiltonian on the electronic structure are described with the aid of an auxiliary impurity model describing the complete fourteen-orbital U 5 shell. This multi-orbital impurity model includes the full Coulomb interaction, the SOC that is very strong in both U and Te, and the crystal field. The corresponding Hamiltonian can be written (see, for example, HewsonHewson ),
| (1) | ||||
Here creates an electron in orbital and spin in the 5 shell and creates an electron in state in the “bath” that consists of those host band states that hybridize with the impurity 5 shell. is the energy position of the non-interacting ‘impurity’ level, and are the bath energies.
The parameter specifies the strength of SOC obtained from the atomic potential, and is the crystal-field (CF) potential at the impurity, as described below. The matrices describe the hybridization between the 5 states and the bath orbitals at energy .
In these calculations two sets of Slater integrals (in eV)
, , , 2.94, and
, , , 2.94
were chosen
to specify the Coulomb interaction matrix
in Eq. (II.2).
They correspond to values of eV and eV respectively,
with exchange eV.
II.3 Computational procedure
II.3.1 Overview
The calculation uses the same DFT foundation and interaction matrix as implemented by Shick and collaboratorsshick99 and used in conventional DFT+U calculations, but it generalizes the Shick et al.shick09 ionic limit approximation (“Hubbard I”) to (a) include hybridization with the environment, and (b) applies exact diagonalization to evaluate the impurity Green’s function, much like some versions of dynamical mean field theory. A crystal field potential is included in the formalism, but for UTe2 it is expected that the DFT treatment of CF is sufficient, as done for other actinides.shick09
To specify the bath parameters, we use the previously reported LDA results for non-magnetic UTe2 Shick2019 (the conventional basic underlying electronic structure before many-body interaction is considered), repeated for this study. Since the interaction -terms in are couched in spin-orbital rather than language, it is judicious to treat SOC in . It is assumed that the first and fourth terms in Eq. (II.2) are diagonal in representation.
Next, we obtain and , for and , from the hybridization functions
| (2) |
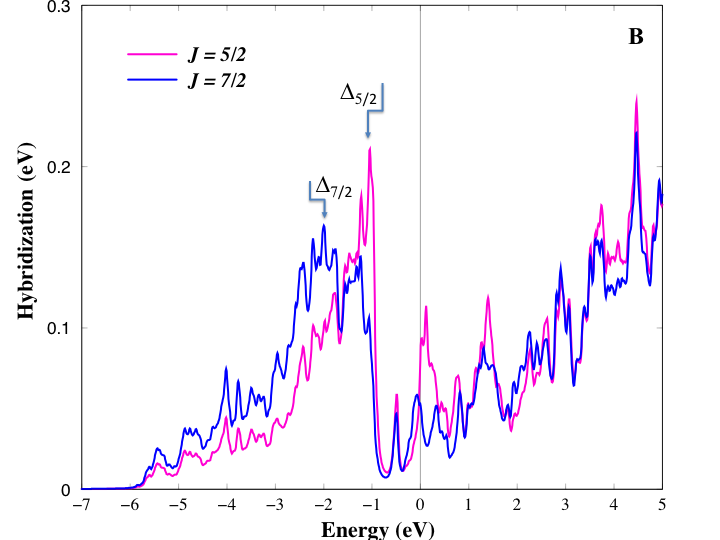
where is the trace over the -subspace, with for , for . is the non-interacting DFT Green’s function extended to the complex energy plane, equal to the crystal Green’s function in Eq. (4) with the self-energy set to zero. The hybridization functions , obtained from the LDA calculation without additional adjustment, are shown in Fig. 1B. Since the essential hybridization occurs in the energy region of Te states [see Fig. 1(A)], we set to the eV peak position of , and to the eV peak position of . From the value of , we obtain eV and eV.
II.3.2 Local approximation for
The band Lanczos method J.Kolorenc2012 is employed to find the lowest-lying eigenstates of the many-body Hamiltonian and to calculate the one-particle Green’s matrix in the subspace of the spin-orbitals at low temperature ( eV, T40 K). The expression for is
| (3) |
where is the partition function, is the energy of the eigenstate of Eq.(II.2), and is the (complex) energy. The self-energy matrix is then obtained from the inverse of the Green’s function matrix .
The self-energy is then inserted into the local Green’s function
| (4) |
calculated in a single-site approximation as described previously,shick09 ; Kristanovski2018 from which 5 orbital occupations are obtained. is the volume of the Brillouin zone (BZ). The self-energy is adjusted at each iteration until self-consistency is reached. Since this method has not been used previously, we provide additional details for purposes of clarity in Appendix A, which provides a flow chart and a step-by-step description of the procedure.
II.3.3 Density matrix self-consistency
In a single site approximation, the local Green’s function matrix for the 5 electrons in the manifold is
| (5) |
where is the non-interacting Green’s function is a correction to the chemical potential chosen to ensure that is equal to the number of correlated -electrons obtained from Eq.(7). Then, with the aid of this local Green’s function , we evaluate the occupation matrix
| (6) |
For the energy integrations we use eV, and a grid along the real axis of 0.01 eV.
The matrix is used to construct an effective LDA+ potential , which is inserted into the Kohn–Sham-like equations shick99 :
| (7) |
For the spherically-symmetric LDA+U double-counting term (included in the potential ) we have adopted the fully localized limit (FLL) form . We also note that the LDA potential in Eq.(7) acting on the -states is corrected to exclude the non-spherical double-counting with .Kristanovski2018 The equations in Eq. (7) are iteratively solved until self-consistency over the charge density is reached. The DFT+U Green function matrix is calculated from Eq. (4) substituting the self-energy by the DFT+U potential .
The new value of the 5-shell occupation is obtained from the solution of Eq. (7), and defines the new value of in Eq. (II.2).shick09 The -shell SOC parameter (an atomic quantity), and the CF matrix in Eq. (II.2) are determined in each iteration. The CF matrix in Eq.(II.2) is obtained by projecting the self-consistent solutions of Eq.(7) into the local -shell basis, giving the “local Hamiltonian”
| (8) | |||||
where is the -projected density of states (fDOS) matrix (whose integral to gives the familiar occupation matrix), is the bottom of the valence band, is the upper cut-off, and is the mean position of the non-interacting level. The matrix is then obtained by removing the interacting DFT+ potential and SOC from Eq.( 8). As mentioned, for UTe2 it is anticipated that the CF is represented sufficiently by DFT+U, and this step is neglected.
The self-consistency loop is closed by calculating the non-interacting Green’s function ,
| (9) |
and the next iteration is started by solving Eq. (II.2) for the updated , , and , and calculating the new self-energy . The self-consistent procedure was repeated until the convergence of the 5-manifold occupation matrix, with converged to less than 0.01.
III Computational Results
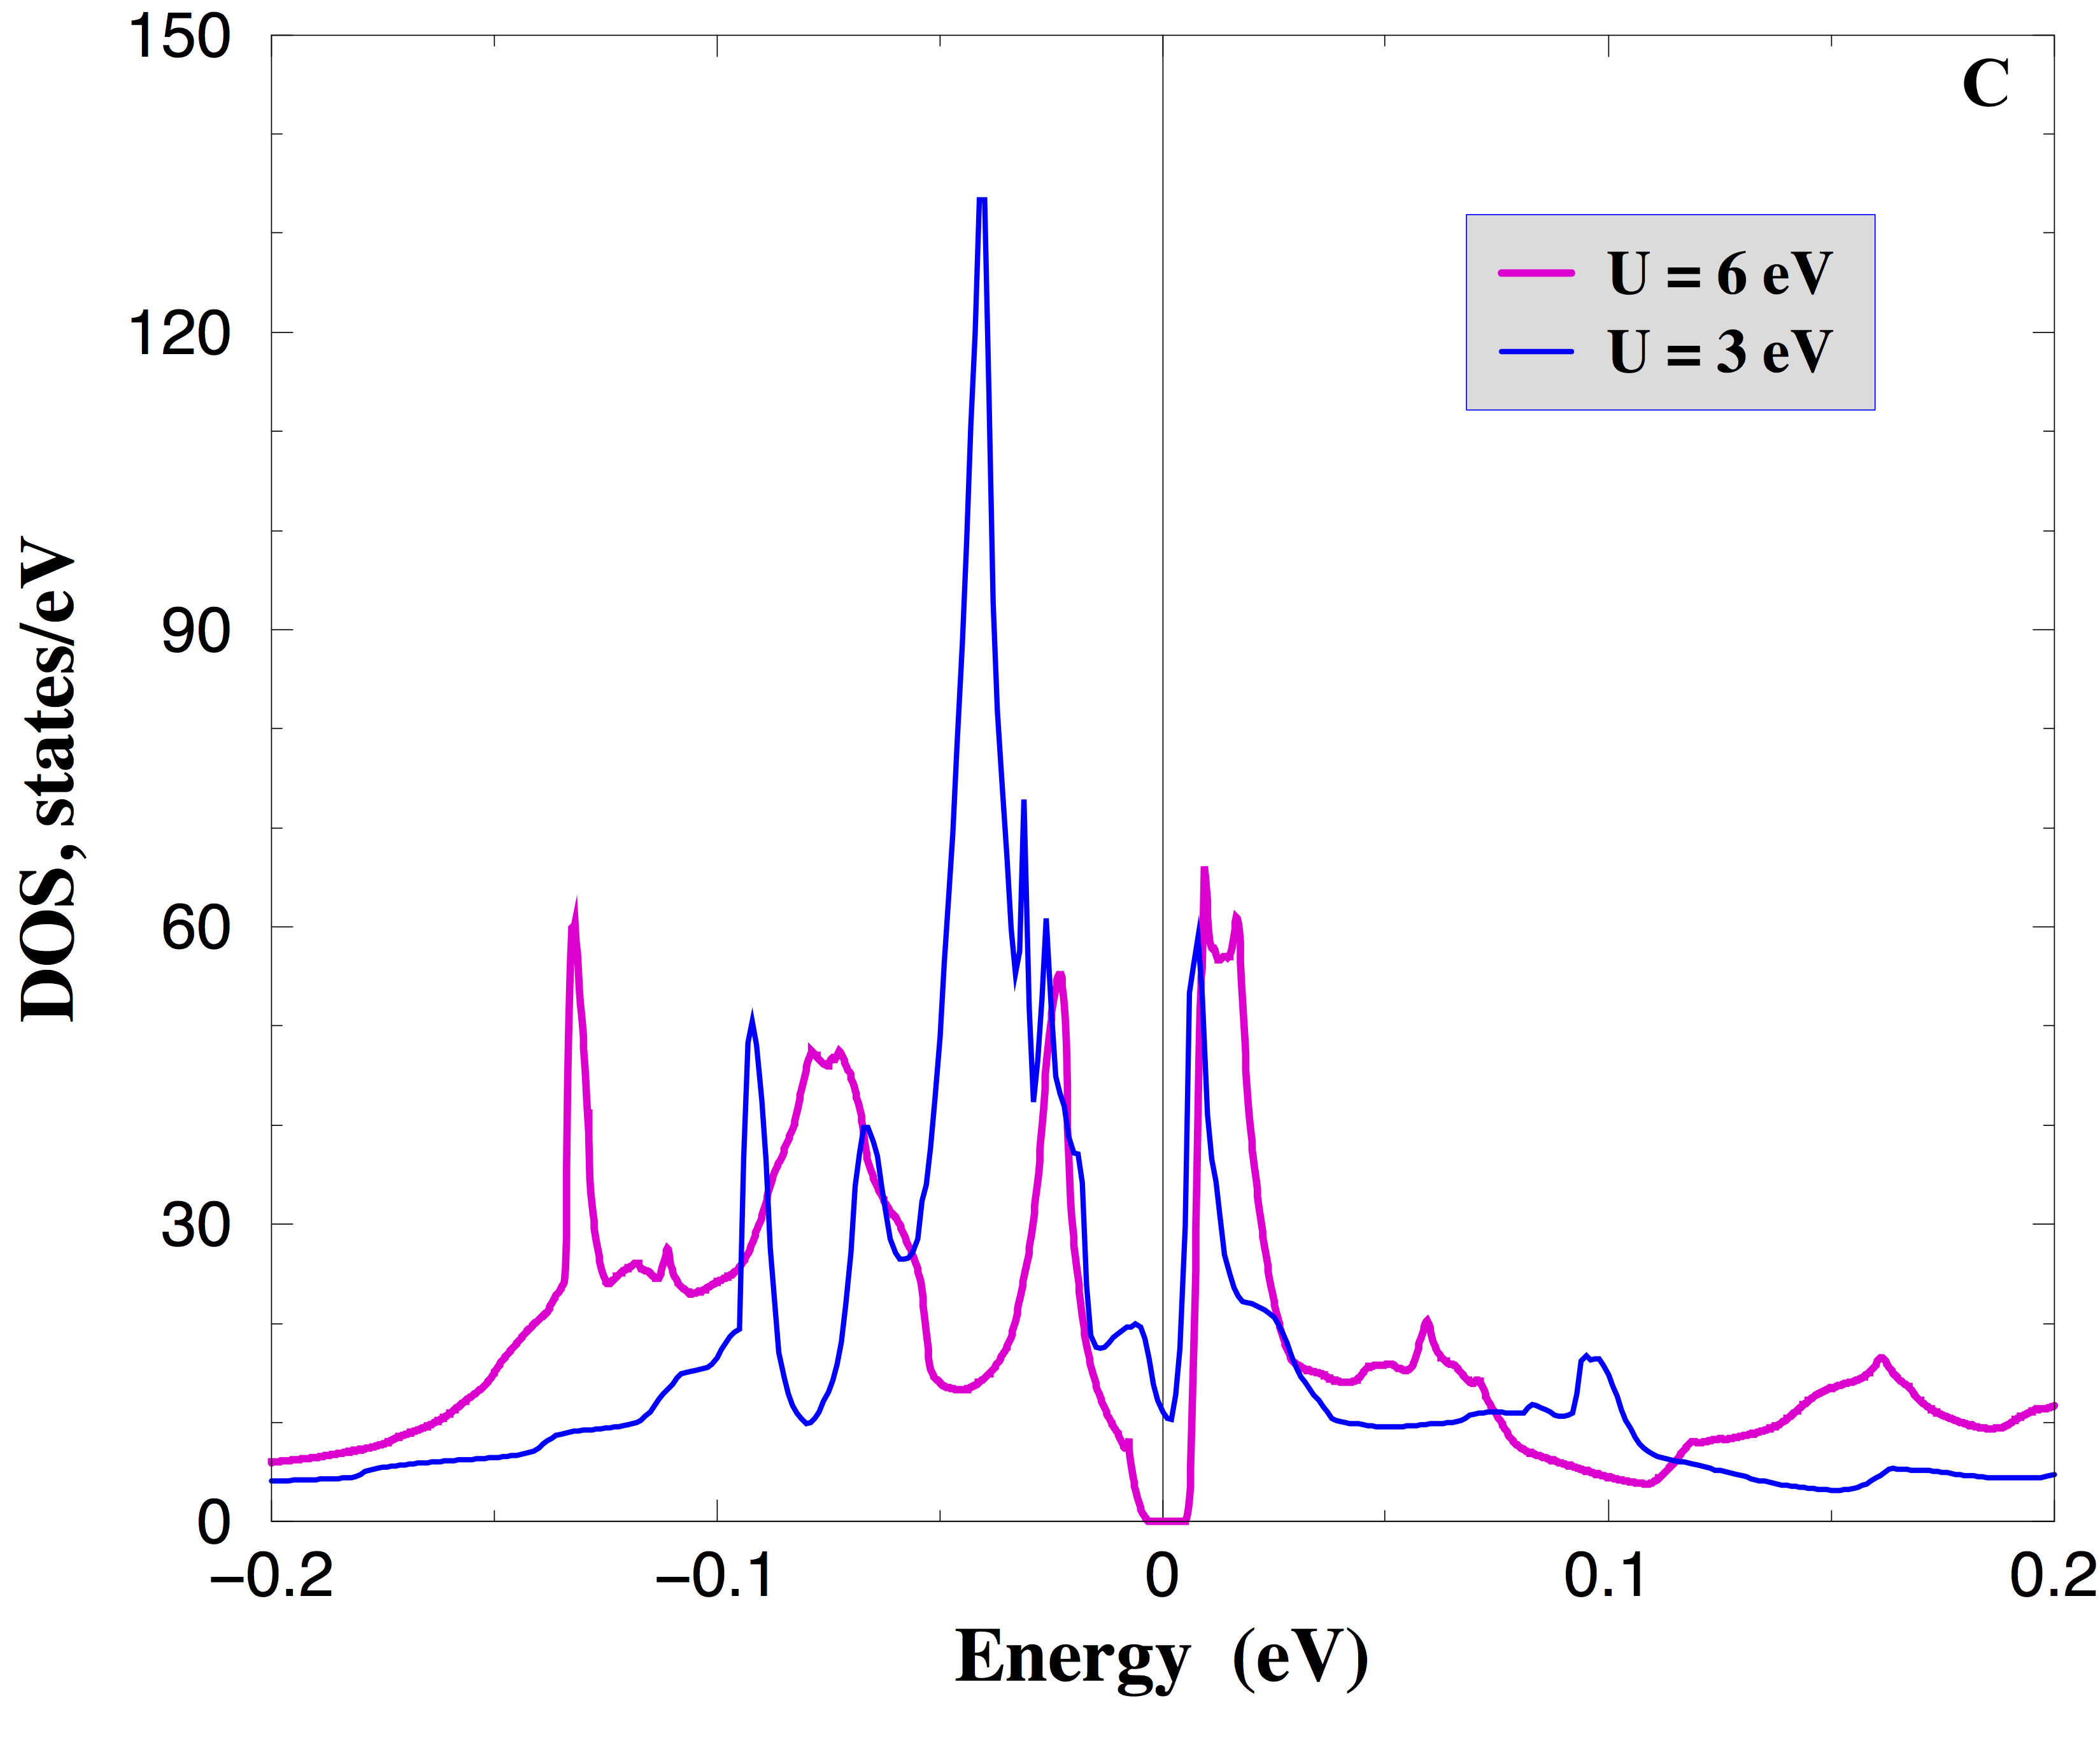
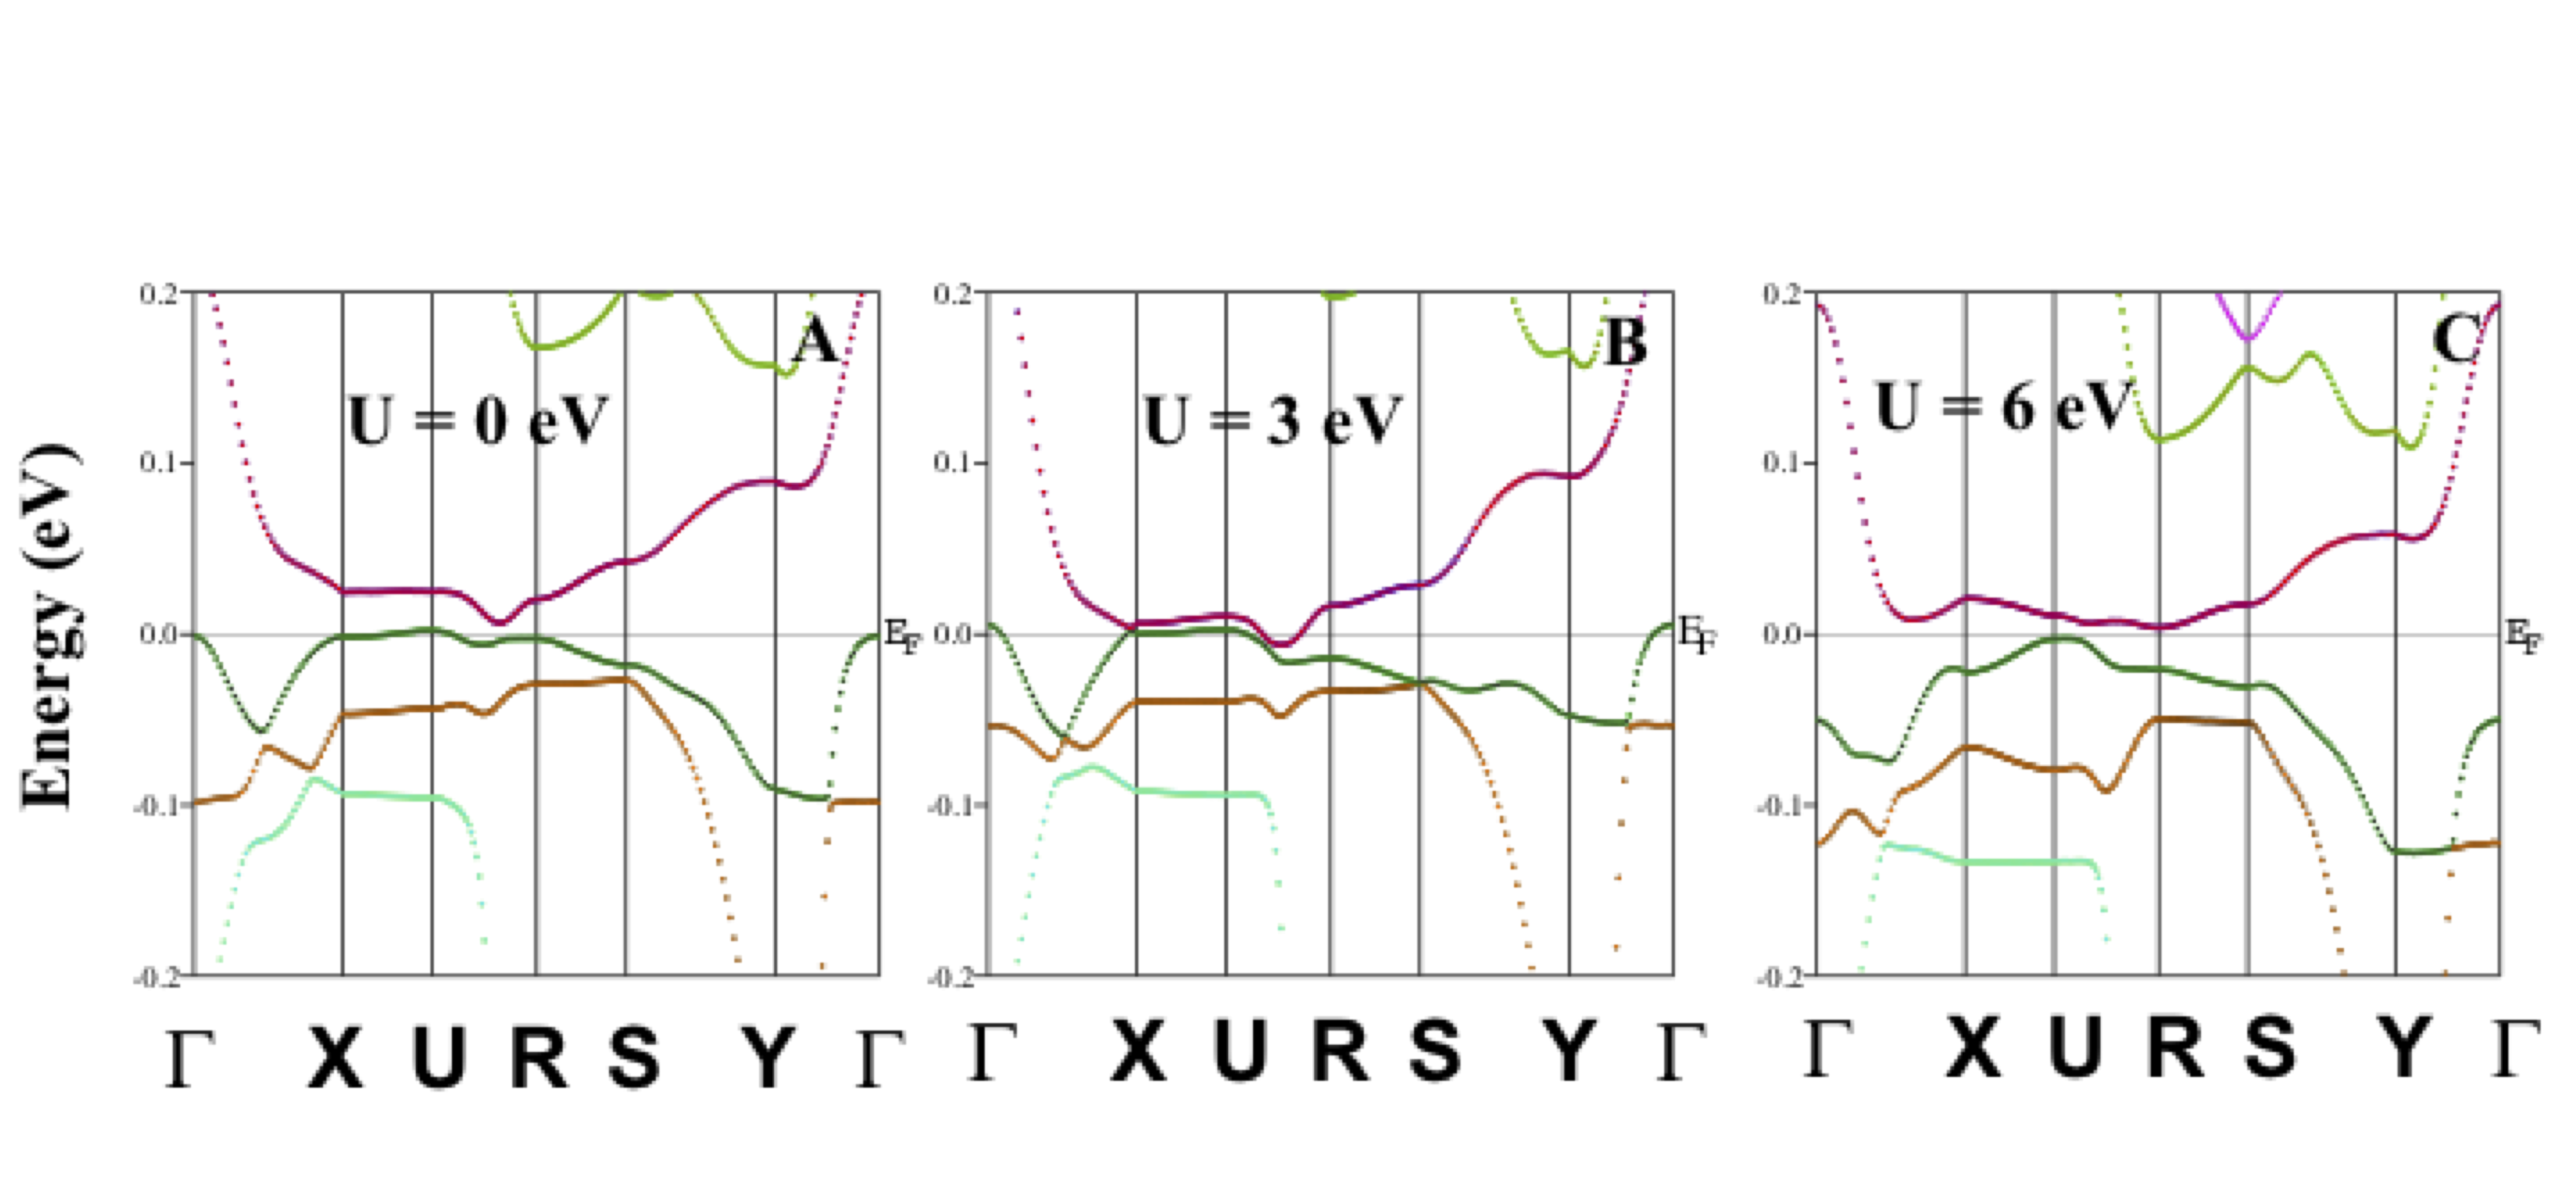
The U and Te atoms projected densities of states (DOS) for =3 eV, and the total densities of states for =3 eV and 6 eV, are shown in Fig. 1 The band structures for two different Coulomb values are shown in Fig. 2. For all values of , the DOS near is almost entirely due to U 5 states (see Table I). As several groups have noted, there is a small gap for =0, the curious LDA result.
Increasing , the two flat bands near EF become flatter, approach each other, and by =3 eV become inverted, leaving a band crossing along very near almost exactly at the Fermi level. Increasing to 6 eV, the bands separate leaving a small 10 meV bandgap, again separating disjoint valence and conduction bands. This moving away from of the bands is qualitatively consistent with DMFT results using =6 eV. However, we do not obtain any highly dispersive Te , U band in the background, crossing EF, as in DMFT. In fact, for =6 eV we obtain again a small gap, whereas (to repeat) UTe2 is observed to be a heavy fermion metal, not necessarily in conflict with a semimetal before dynamic correlations are included. Henceforward we focus on our =3 eV results with flat bands crossing .
III.1 Band structure and Fermi level quantities
Density functional theory with (semi)local exchange-correlation functionals (=0) give an insulating band structure for UTe2, albeit with a very small 10-15 meV gap. Such a gap generally signals a bonding-antibonding separation of bands, but no such description has been forthcoming for UTe2. The gap reflects a different brand of band insulator. Every calculation reveals that the large uranium SOC separates the and subshells separated by 1.5 eV (see Fig. 1), and with a configuration the former subshell is half-filled. This SOC separation is much larger than any crystal field splitting. The previous work of some of the present authorsShick2019 established that, with ferromagnetic order imposed, two orbitals, , are half-filled, then hybridized, leading to the gap which is however very small. How physical UTe2 obliterates this gap and in the process emerges as a nearly magnetic but superconducting material is the fundamental issue in the electronic structure of this compound.
Henceforward we focus on =3 eV results unless otherwise stated, since this value is sufficient to restore a conducting band structure, and is typical of values in most uranium intermetallics. From Fig. 2, this “insulator-metal” transition arises from a hybridization reconfiguration of energy levels at the zone boundary points and . A distinctive feature is that all four bands shown in Fig. 2 are exceedingly flat along (the direction), unlike for =0 or =6 eV. Another feature is the band crossing along very near the point . The unoccupied band for =6 eV is nearly dispersionless along the three directions , before mixing with dispersive bands in other regions of the zone.
The values of , ), and Fermi velocities along the three crystal axes for =3 eV are provided in Table 1. The Fermi velocities are the r.m.s. FS averaged values , and similarly for and components. The anisotropy is only 10-15%, indicative of three dimensional conduction; anisotropy is larger for the individual bands. The magnitudes for the separate bands, 0.3-1.4 cm/s, indicate very heavy carriers even before renormalization by dynamical processes (electronic and phononic).
| N() | () | ||||
| Total | 11.04 | 10.01 | 0.88 | 0.64 | 0.56 |
| FS-I | 6.23 | 5.67 | 0.48 | 0.72 | 0.32 |
| FS-2 | 4.81 | 4.34 | 1.44 | 0.80 | 0.80 |
| Electric Field Gradient | |||||
| Atom | site | ||||
| U | 4i | 0.183 | 13.85 | -8.19 | -5.66 |
| Te1 | 4j | 0.173 | 4.56 | -2.67 | -1.89 |
| Te2 | 4h | 0.176 | 33.28 | -19.56 | -13.71 |
From Table 1 one sees that 90% of is provided by the U 5 states. = 11.0 states/eV for eV corresponds to a band Sommerfeld constant =13.0 mJ/mol-K-2. This implies a mass enhancement of nearly 9 from dynamic interactions compared to the experimental value. Note that there is a strong peak in the DOS (up to 59 states/eV) just 10 meV above , corresponding to =70 mJ/mol-K-2 which is within a factor of two of the experimental value of =120 mJ K-2 mol-1.Ran2019 The narrow peak just above implies a strong dependence of properties on stoichiometry.
In materials with large SOC where the splitting dominates site anisotropy and crystal field splitting but symmetry is low, state characters are not very transparent. The and decompositions of are provided in Appendix B, Table 2. The important bit of information is that the components (equal by symmetry) are three times larger than the components, and five times larger than components, with the components being negligible. This values reflect strong spin-orbital polarization at the Fermi level in UTe2, which also shows up in the strong anisotropy of the electric field gradients, below.
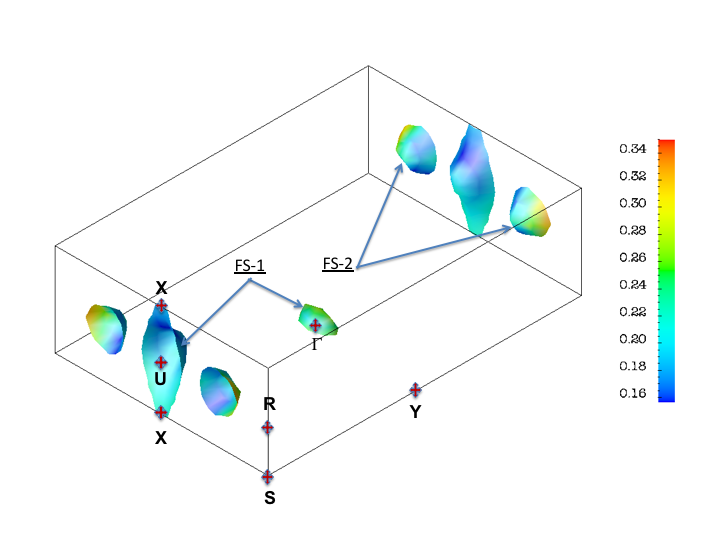
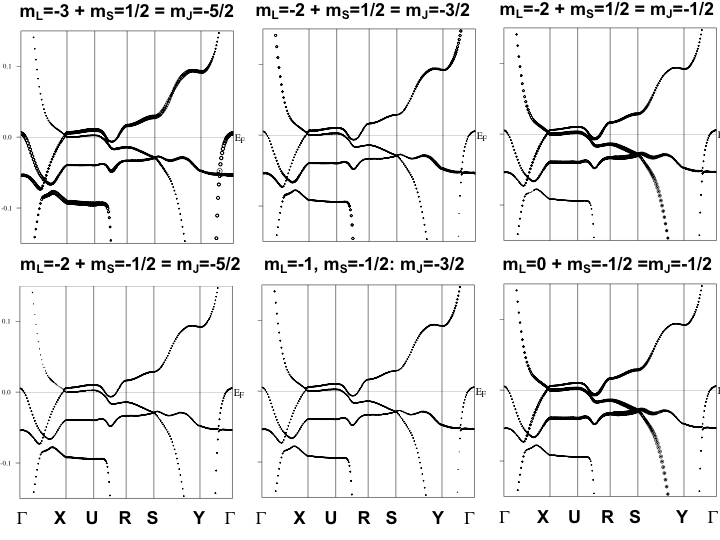
The Fermi surfaces (FS) are displayed in the upper panel of Fig. 3. The FS has three types of sheets: from the lower band is the hole sheet centered at and a fluted hole column along , with masses varying by 50% over the sheets. The second band gives two symmetry related electron ellipsoids midway between and , providing the required charge compensation. The corresponding Fermi velocities, with relative values shown by the colorbar in Fig. 3 and mean values provided in Table 1, have somewhat less than factor-of-two anisotropies.
The array of band graphics in the lower part of Fig. 3, presented with fat-band character and plotted along Cartesian directions, provides the relative amounts of the stated spin-orbital characters of bands near the Fermi level. The major contribution to FS-1 along the line arises from orbitals. The -point centered hole spheroid is more in character. The electron sheet along arises from a mixture all three of these orbitals. As in our previous workShick2019 , we find that the Fermi level states are dominated by orbitals with some contribution from the orbital.
Our DFT+U(ED) results, obtained without restriction to a single-determinant reference state in determining the density, can be contrasted with previous beyond-DFT results. Admittedly, the groups that are involved are searching for a treatment that will provide a realistic platform for further considerations and experimental properties. Conventional DFT+ was applied by Ishizuka et al. Ishizuka2020 , who chose the non-standard Hund’s =0 approach, neglecting Hund’s exchange and anisotropy of the matrix. A crossover in behavior was found for values of in the 1-1.5 eV range. Our earlier treatment of orbital polarization by the DFT+U(OP) methodShick2019 focused on ferromagnetic alignment based on the observed large Curie-Weiss moment (which however does not order) so it is less directly comparable. The problem posed by the unphysical gap in LDA was addressed by HarimaHarima2019 with a hands-on shift of the U energy by 1.36 eV, giving small Fermi surfaces arising from flat bands much as we find, and by 2.72 eV, which led to a band structure with large Fermi surfaces. As mentioned, the work of Miao et al.Miao2019 was strongly influenced by the apparent similarity of a dispersive band crossing in ARPES that is like that in ThTe2, which has no bands.
III.2 Local U atom -shell properties
The calculated 5 occupation within the uranium atomic sphere is =2.73, close to the value obtained in DFT+U(OP) calculations Shick2019 , and supporting the viewpoint of a reference U 5 configuration. This value is a slight underestimate, since orbitals extend somewhat beyond the atomic spheres used to obtain this number. The electronic structure results discussed above have been more consistent with an viewpoint, but without the comparison of calculated moments with the experimental Curie-Weiss moment that we have provide below.
III.2.1 X-ray absorption
X-ray absorption spectroscopy (XAS) provides additional local information. XAS yields two intensities and , and the branching ratioMoore ==0.71. These are connected to the partial occupations = 2.47 and = 0.26. Our value of can be directly compared to future experimental results for XAS and electron energy-loss spectroscopies. The decompositions of the U 5-occupations are provided in Appendix B.
III.2.2 Curie-Weiss moment
For the self-consistently determined impurity energy position , we obtain a doubly (Kramers) degenerate ground state with spin, orbital, and total moments of =-1.34, =5.80, =4.53, in . The calculated -factor is 0.78, and . The Curie-Weiss magnetic moment = 3.52 , calculated as the rms value over occupied uranium configurations, is in reasonable agreement with experimental values of 2.8 Ran2019 , and 3.3 Aoki2019 . These can be compared to the textbook values for an configuration: , resulting in g=0.72. These Hund’s rule numbers, not normally reliable for materials, are remarkably similar to the DFT+U(ED) results.
III.2.3 Mass enhancement
We obtain an estimated average mass enhancement, without contributions from dynamical corrections, in two ways. From the mean spectral density,
where is the quasiparticle residue matrix, and is the spectral density matrix obtained from Eq.(4). The quasiparticle weight 0.06 is obtained. This small value of indicates the strongly correlated character of -electrons at . The renormalized perturbation theory Hewson expression for the Kondo temperature is
| (10) |
From the value of the hybridization function 50 meV, the predicted 100 K, very similar to experimental values from resistivity.Ran2019
III.2.4 Electric field gradients
Electric field gradients (EFG) provide a measure of the charge distribution (mostly from the local charge) that is available from all-electron calculations. Following the analysis of the electronic structure quantities given above, we have calculated the electric field gradients Mohn2000 in UTe2. Their values, together with the dimensionless asymmetry parameter for the plane values,
are provided in Table 1. The second expression follows from the traceless nature of the EFG tensor. The EFG component is proportional to the nuclear quadrupolar resonance (NQR) frequency . Experimental measurements of NQR require stable isotopes with nuclear spin . No such measurements have performed to date, so our calculations provide a prediction of this measure of the anisotropy of the charge density and resulting Hartree potential at the nuclei.
The most notable result is that the values for the Te2 site are roughly a factor of 7 larger than for the Te1 site, reflecting a substantially different charge distribution around the two sites. The values for uranium lie midway between, and the anisotropy factors are the same for all three atomic sites. Measurement of some of these will provide useful information on the electronic density distribution, and orbital polarization, of UTe2.

IV Comparison between band structure and photoemission data
Comparison of calculated bands (or spectral density) with PES data is the most direct means of determining the basis of the electronic structure. Due to a number of experimental challenges – matrix element effects, energy and resolution, band broadening due to dynamical effects, surface sensitivity – comparison can yet leave uncertainty, especially in quantum materials with strong dynamical processes. Angle-integrated averages over the momentum and matrix element dependence, giving the zone-averaged spectral density, provides the most unambiguous information – the spectral distribution of valence band states – on fundamental aspects of the electronic structure. We remind that a band picture provides an optimum set of single particle characteristics (orbitals and eigenvalues) to best describe ground state characteristics – energies, charge and spin densities and quantities derivable from them, for example, EFGs – and by continuity in metals, near ground state quantities. Single particle excitations involve self-energies that are minor in many metals but become central in describing heavy fermion metals. Occupied multiplets and configurations are sampled in the DFT+U(ED) method to determine spin-orbital occupations, while dynamic effects are not included in the band structure we present.
IV.1 AIPES
Data taken at 20K with =800 eV photon energy and 120 meV resolution are compared in Fig. 4 with the resolution-broadened DFT+U(ED) DOS; other details of the experiment and analysis are described by Fujimori and collaborators.Fujimori2019 . The unbroadened DOS is shown in Fig. 1. As mentioned above, the most significant region for comparison is at and close below the Fermi energy, where the dynamical self-energy is small. The leading edges at low energy in Fig. 4 are in extremely good experiment-theory agreement. This result is crucial, because DFT+U(ED) displays flat bands at and immediately below EF, whereas both DFT+Ishizuka2020 and DFT+DMFTMiao2019 displace weight away from EF by several hundred meV for DMFT, or more for DFT+. This energy shift is much larger than the experimental resolution, so the corresponding “ edge” in those spectra should be displaced by this amount from EF, which is not seen in the data. These AIPES data thus support the view that flat bands lie at EF, consistent with giving small renormalized Fermi surfaces that provide the platform for the observed exotic superconducting states that are observed to be extraordinarily sensitive to magnetic field, pressure, and stoichiometry.
The AIPES intensity extending to 3-4 eV binding energy can be interpreted in terms of the excitations involving and multiplets, as discussed by Miao et al.Miao2019 These considerations involve the relative participations of populations and . The DFT+DMFT treatment of Miao et al. lead to a dominant (, 84%) state; DFT+ (with and values described above) gives exactly (two strongly bound bands). Our DFT+(ED) method leads to a dominant description. Summing the spin-orbital occupations provided in Appendix B (2.73) gives a slight underestimate due to orbital tails extending beyond the sphere boundary. The disjoint valence and conduction bands discussed above argues for a half-filled subshell, which is .
IV.2 ARPES
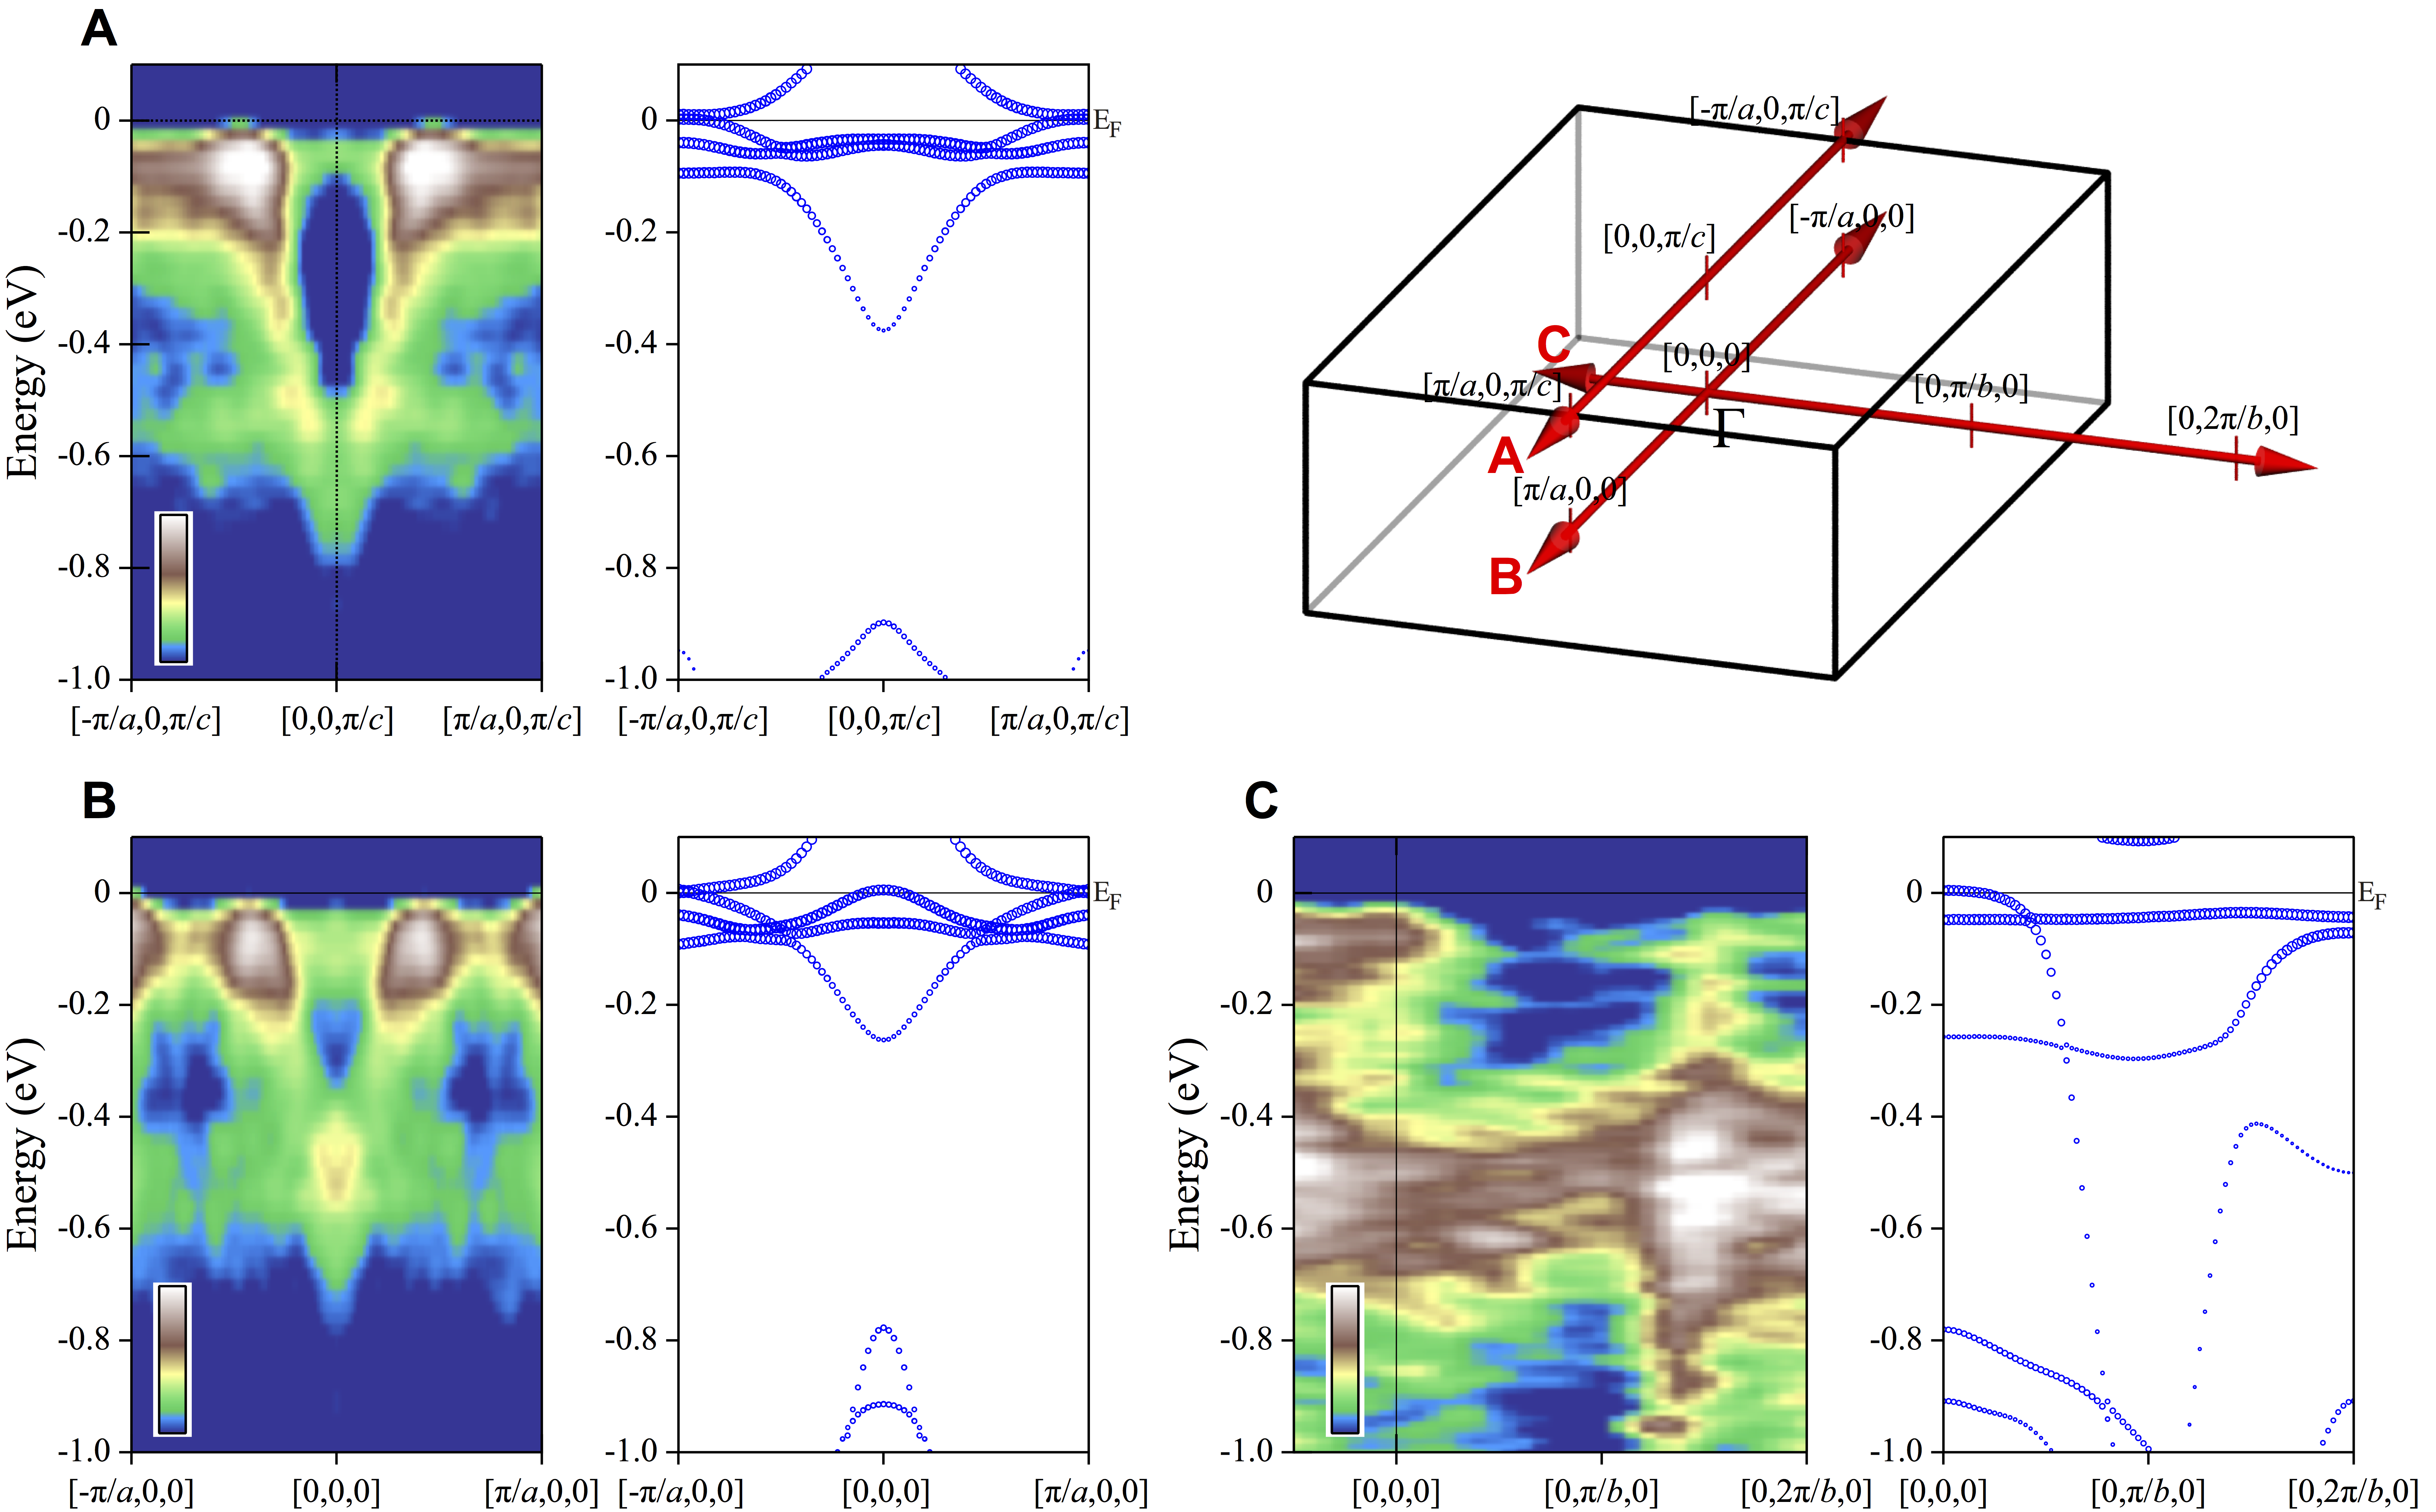
ARPES data were obtained in the photon energy range 565-800 eV with energy resolution of 90-115 meV, with other aspects of the sample and setup described in Ref. Fujimori2019 . In Fig. 5 we show ARPES results compared with the relevant band lines. For the U-Z-U line shown in Fig. 5A, agreement between the correlated bands and ARPES data near is apparent, with a dispersive band dropping down at being resolved clearly. For the X--X direction in Fig. 5B, the calculations yield heavy -bands located near and touching . The bands lie at the same energy as intense emission in the experimental data, and are separated by less than the experimental resolution and sometimes crossing, so theory and experiment are consistent although incoherence in the data at this low energy cannot be ruled out. This intensity is at variance with the presence of a light band observed by Miao et al.Miao2019 using photon energies in the 30-150 eV range.
Along the -Y- line in Fig. 5C, incoherence in the data lies in the energy region of a dispersive band, apparently reflecting weakly dispersing, largely incoherent, shell excitations. The strong intensity at [0,0,0] around -60 meV is in a region where our band structure predicts flat bands. Note also that Fig. 5C indicates a dispersive Te band passing through the bands and mixing strongly in the calculations. Thus mixing is substantial, with a result that the Te character is strongly excluded from the band regions, as is clear from the projected DOS in Fig. 1.
Both the calculated bands near EF as well as this data, and also the ARPES data of Ref. [Fujimori2019, ], differ from the results of Ref. [Miao2019, ]. We attribute the differences in the experimental ARPES data to the higher surface sensitivity of the spectra taken in the 30-150 eV Miao2019 where the escape depth is 8-12Å. The energy dependence of the electron escape depthdamascelli2004 indicates that it is roughly twice as largedamascelli2004 in our energy range. Thus our data are more bulk sensitive while those of Miao et al. are more surface impacted, where confinement imposed by the surface can lead to the U 5-electrons becoming more localized than in the bulk. The low energy ARPES data of Miao et al. were mostly interpreted by the band structure of ThTe2, i.e. any without bands whatsoever. Conversely, our ARPES data together with our correlated band results, along with earlier AIPES data,Fujimori2019 emphasize the presence of heavy 5 bands near .
V Summary
While a great deal of experimental data has been collected that is relevant to the complex phase diagram of UTe2, and there are several theoretical suggestions about the character and symmetry(s) of its superconducting and magnetic phases, there is not yet any consensus emerging on its basic electronic structure. Given its heavy fermion properties this may not be so surprising, but relative to modestly correlated DFT-based calculations, the dynamical mass enhancement is substantial but not particularly large. The Hill criterion for the critical uranium atom separationHill1970 ; Boring2000 is 3.5 Å, and clearly UTe2 lies on the localized side of that limit, but it does not order magnetically at zero field. The Hill criterion is however sometimes violated in uranium compounds, so th guidance it provides is limited.
There is evidence that neither a fully localized nor simple itinerant picture holds for UTe2. Our correlated band DFT+U(ED) calculations, motivated by the Anderson impurity model and taking into account the multiconfiguration aspect of the U shell, suggest that both local and itinerant characteristics of the -electrons appear near the Fermi level and need to be treated together. The uranium magnetic moment is given well compared to the two experimental reports, and an unexpected result is that the spin, orbital, and total moments are near the Hund’s rule prediction for an ion, and not representative of an ion.
The simplest and clearest experimental information on the electronic structure is from angle-integrated PES. The occupied spectral densityFujimori2019 peaks immediately below the Fermi level, and is strong within 1 eV of EF but contains structure (presumably) satellites out to 4 eV binding energy. The measured spectrum spectrum represents broadening of a dynamical origin that our method does not take into account. The other two means of including Coulomb repulsion , DFT+ and DFT+DMFT, both displace the spectral density to higher binding energy, leaving only a -function-like Kondo peak at EF (DMFT), not consistent with AIPES data. Our spin-orbital occupations also support dominance of a ion.
We have compared the DFT+U(ED) bands with the ARPES spectra of Fujimori and collaboratorsFujimori2019 and new data, which used higher photon energy with a larger escape depth and thus more bulk sensitivity than the data of Miao et al.Miao2019 The comparison at low binding energy is encouraging, especially considering some uncertainty in extracting bulk (three-dimensional) band information from emission of electrons through a single surface. For these reasons, we propose that our DFT+U(ED) bands provide an appropriate basis of understanding and building on the electronic structure. We further comment that the flat bands crossing EF lead to small Fermi surfaces that will be responsive to pressure and magnetic field, a sensitivity that is very clear in the emerging experimental phase diagram.
Finally, our low energy band structure shows evidence of Te – U mixing, which repels the Te character from the low energy region rather than opening up to allow a dispersive Te band to cross the Fermi level. Still, the Te influence is important, and the large U-U separation placing it in magnetic ion regime suggests that exchange coupling in UTe2 proceeds primarily of RKKY character mediated through the Te conduction bands. The overall picture is one of Fermi level bands dominated by character as in UPd3 versus a more strongly localized moment as in the Kondo lattice picture.
VI Acknowledgments
We thank G. R. Stewart for guiding us to the updated uranium Hill plot published in Ref. [Boring2000, ]. A.B.S. acknowledges partial support provided by Operational Programme Research, Development and Education financed by European Structural and Investment Funds and the Czech Ministry of Education, Youth, and Sports (Project No. SOLID21 - CZ.02.1.01/0.0/0.0/16-019/0000760), and by the Czech Science Foundation (GACR) Grant No. 18-06240S. The experiment was performed under Proposal No.2019A3811 at SPring-8 BL23SU. S.-i.F. was financially supported by JSPS KAKENHI Grant Numbers JP16H01084 and No. JP18K03553. W.E.P. was supported by National Science Foundation Grant DMR 1607139.
Appendix A Density matrix self-consistency in DFT+U(ED)
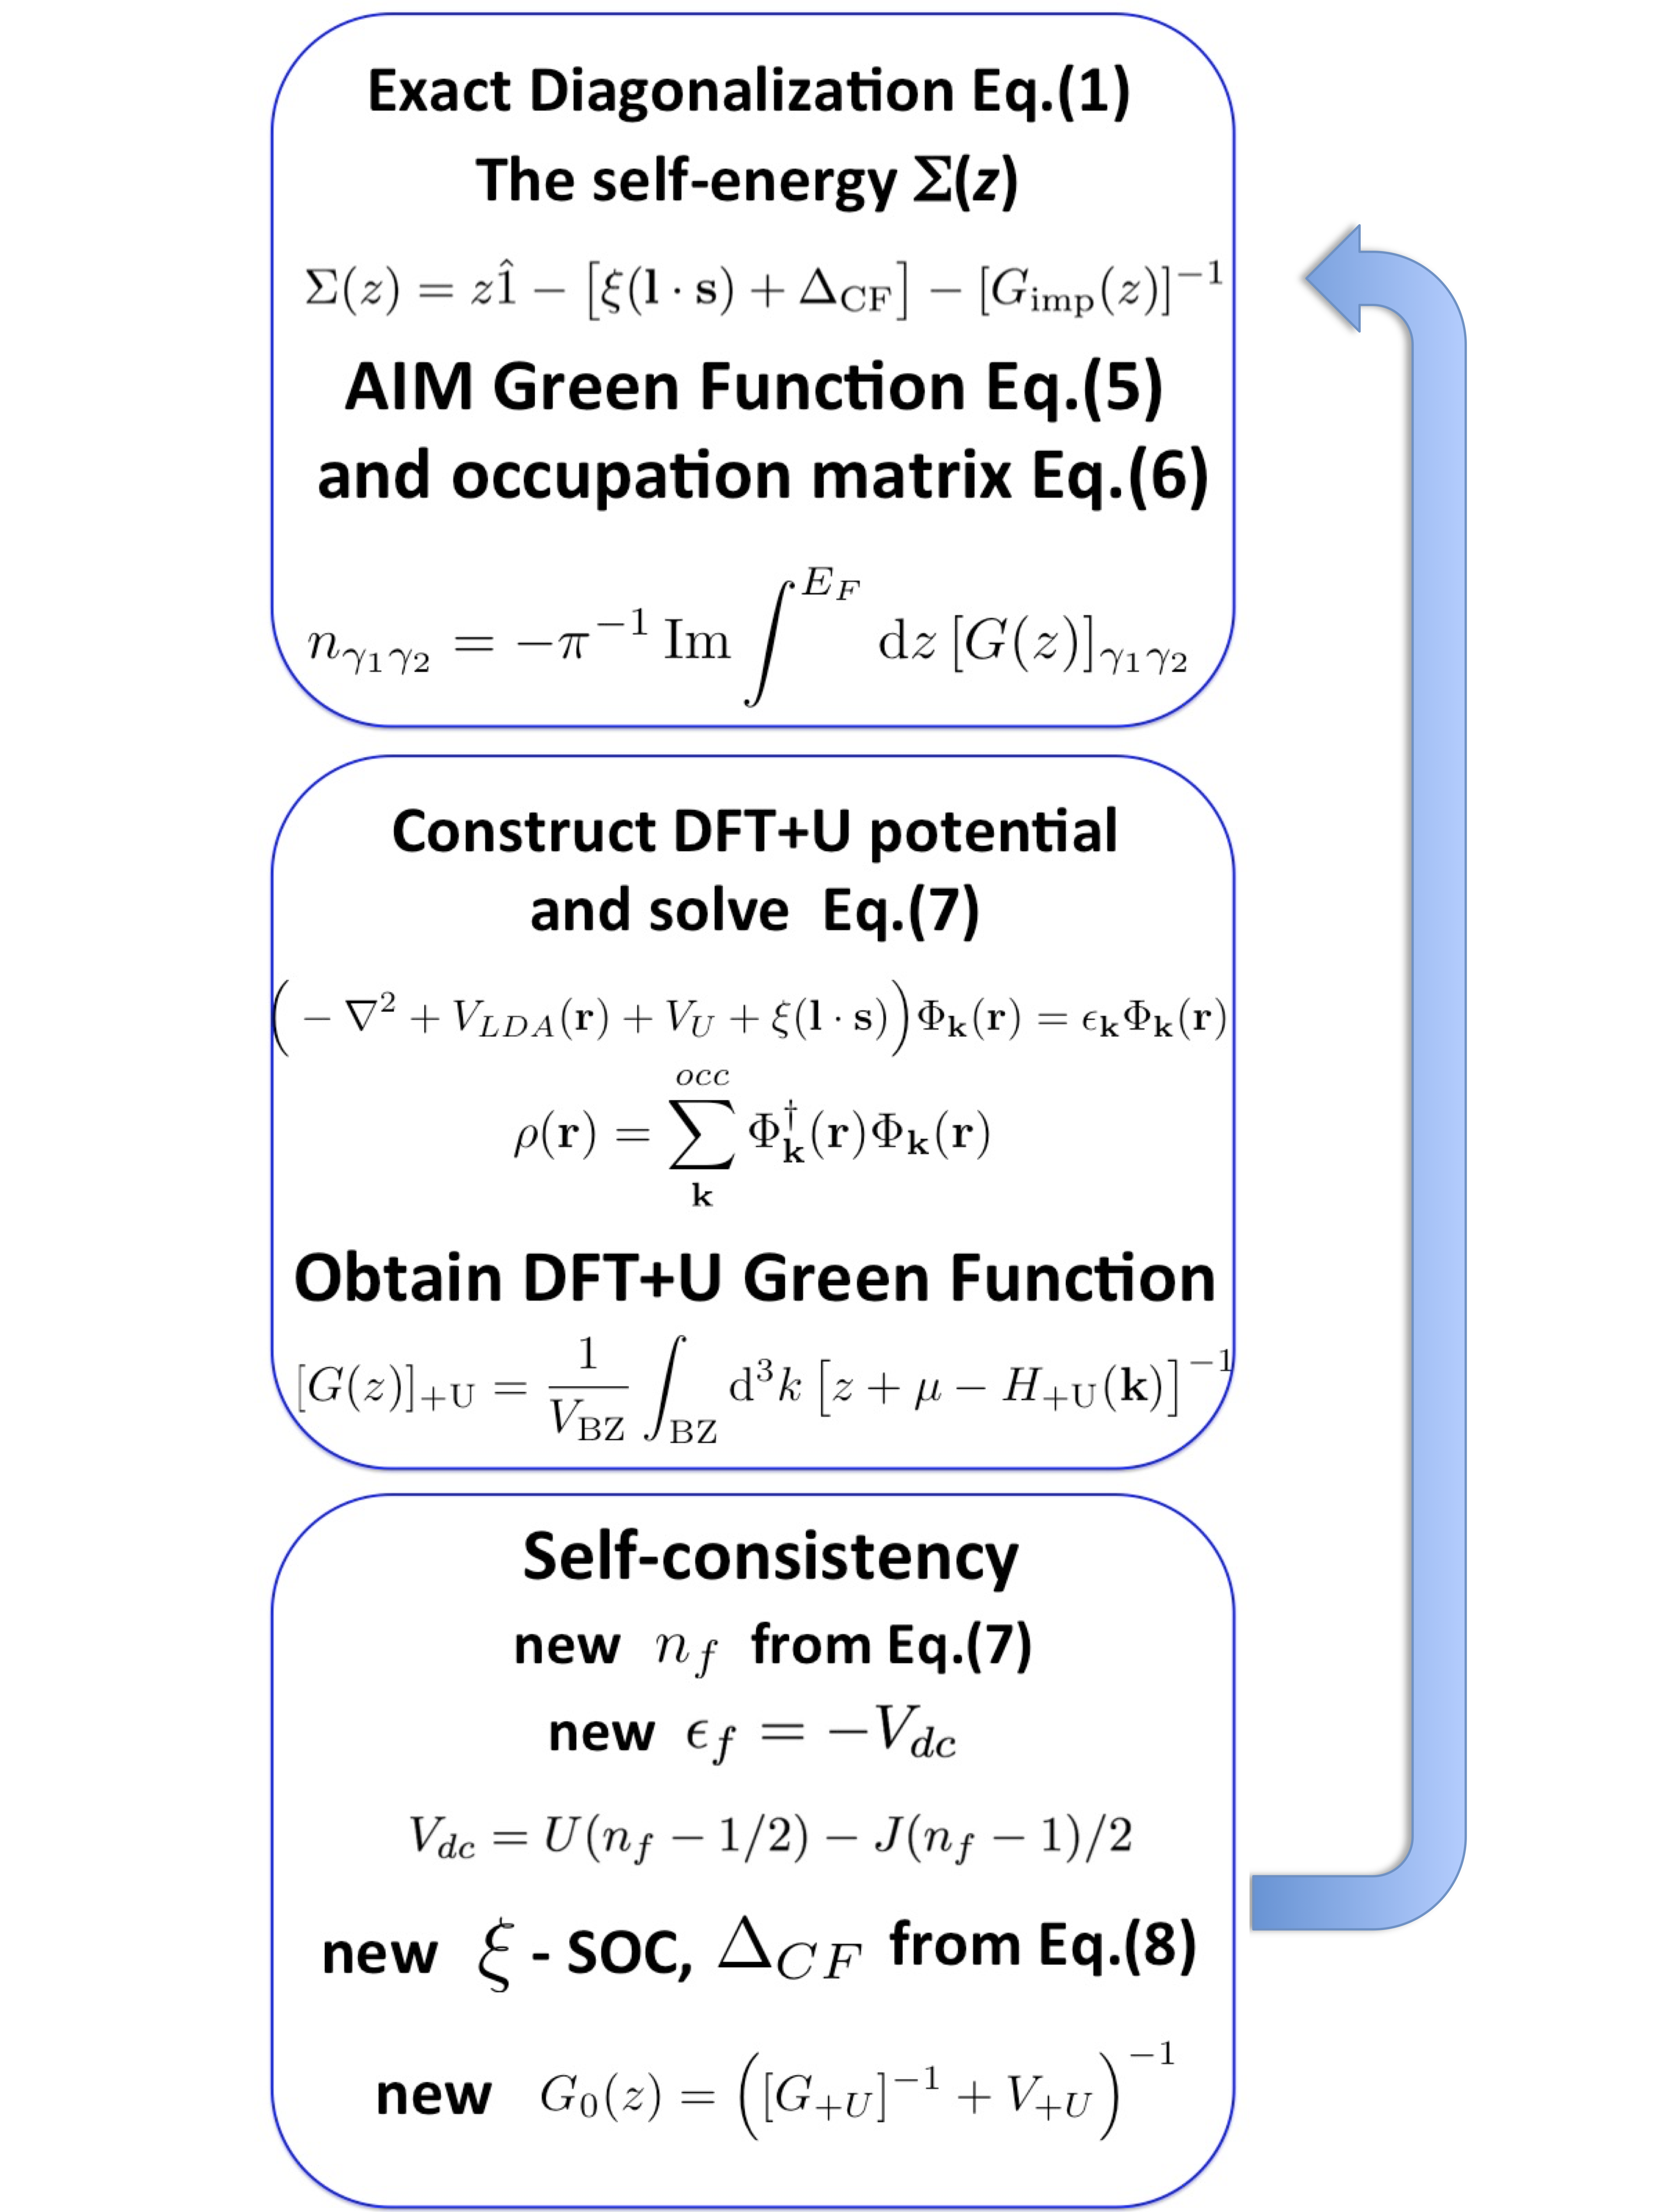
The calculation follows in several respects that of Shick and collaboratorsshick09 for their “DFT+Hubbard I approximation” study of elemental actinides. A few generalizations have been adopted here, with the main steps being illustrated in the flow diagram in Fig. 6. The various steps occur in the following order.
-
1.
From a DFT/LDA calculation the crystal Green’s function is constructed and initial parameters to solve Eq.(1) are chosen as reasonable estimates. For example, the repulsion and Hund’s rule constants (from the Slater parameters) must be specified.
-
2.
From the (self-consistent) DFT calculation, the hybridization matrix is evaluated, from which the bath energies and hybridization strengths are chosen to represent mixing with the environment, as described in Sec. II.C. The input parameters to the DFT+U(ED) calculation are now determined.
-
3.
Carry out an exact diagonalization of of Eq. (1). This step is represented by the top panel of the flow chart in Fig. 6. Use eigenvalues and eigenvectors to construct the impurity Green’s function in Eq. (3) and the corresponding self-energy; adjust in Eq. (5) to fix the value of to the current value from the full calculation equation (7). Calculate the occupation matrix equation (6) as stated in Sec. II.C.3.
- 4.
-
5.
Obtain a new non-interacting Green’s function , a new position of the impurity level, a new and (when used) . This step is represented in the bottom panel in Fig. 6.
-
6.
Now close the self-consistency loop. When output and input of the -manifold occupation convergence agree within a specified criterion, the self-consistency loop is exited, and analysis of the results follows.
Appendix B Decomposition of the U 5 DOS at , and the U 5 occupations
The essential aspects of the electronic structure of UTe2 finally reduce to participation of various spin-orbitals in the occupation, and to their play in states at the Fermi level. Table 2 provides the Fermi level quantities in both (,s) and () representations. The primary result to notice is the large and equal participation at EF of the orbitals.
| -3 | -2 | -1 | 0 | 1 | 2 | 3 | ||
|---|---|---|---|---|---|---|---|---|
| Spin- | 0.48 | 0.23 | 0.85 | 0.81 | 0.10 | 0.07 | 0.01 | |
| Spin- | 0.01 | 0.07 | 0.10 | 0.81 | 0.85 | 0.23 | 0.48 | |
| -7/2 | -5/2 | -3/2 | -1/2 | 1/2 | 3/2 | 5/2 | 7/2 | |
| 0.01 | 0.55 | 0.33 | 1.66 | 1.66 | 0.33 | 0.55 | 0.01 |
Table 3 provides the strong spin-orbit decompositions for moment along the easy -axis. The contribution is minor.
| = 3 eV | ||||||||
|---|---|---|---|---|---|---|---|---|
| / | -7/2 | -5/2 | -3/2 | -1/2 | 1/2 | 3/2 | 5/2 | 7/2 |
| 5/2 | 0.412 | 0.410 | 0.415 | 0.415 | 0.410 | 0.412 | ||
| 7/2 | 0.031 | 0.037 | 0.031 | 0.030 | 0.030 | 0.031 | 0.037 | 0.031 |
| = 6 eV | ||||||||
| 5/2 | 0.410 | 0.417 | 0.410 | 0.410 | 0.417 | 0.410 | ||
| 7/2 | 0.027 | 0.019 | 0.033 | 0.022 | 0.022 | 0.033 | 0.019 | 0.027 |
References
- (1) S. Ran, C. Eckberg, Q.-P. Ding, Y. Furukawa, T. Metz, S. R. Saha, I.-L. Liu, M. Zic, H. Kim, J. Paglione, and N. P. Butch, Nearly ferromagnetic spin-triplet superconductivity, Science 365, 684 (2019).
- (2) D. Aoki, A. Nakamura, F. Honda, D. Li, Y. Homma, Y. Shimizu, Y. J. Sato, G. Knebel, J.-P. Brison, A. Pourret, D. Braithwaite, G. Lapertot, Q. Niu, M. Valiska, H. Harima, and J. Flouquet, Unconventional Superconductivity in Heavy Fermion UTe2, J. Phys. Soc. Japan 88, 043702 (2019).
- (3) S. Ikeda, H. Sakai, D. Aoki, Y. Homma, E. Yamamoto, A. Nakamura, Y. Shiokawa, Y. Haga, and Y. Onuki, Single Crystal Growth and Magnetic Properties of UTe2, J. Phys. Soc. Jpn. 75, 116 (2006).
- (4) Y. Tokunaga, H. Sakai, S. Kambe, T. Hattori, N. Higa, G. Nakamine, S. Kitagawa, K. Ishida, A. Nakamura, Y. Shimizu, Y. Homma, D. Li, F. Honda, and D. Aoki, 125Te-NMR study on a single crystal of heavy fermion superconductor U, J. Phys. Soc. Japan 88, 073701 (2019).
- (5) S. Ran, C. Eckberg, Q.-P. Ding, Y. Furukawa, T. Metz, S. R. Saha, I.-L. Liu, M. Zic, J. Paglione, and N. P. Butch, Spontaneously polarized half-gap superconductivity, arXiv:1811.11808.
- (6) T. Metz, S. Bae, S. Ran, I-L. Liu, Y. S. Eo, W. T. Fuhrman, D. F. Agterberg, S. Anlage, N. P, Butch, and J. Paglione, Point Node Gap Structure of Spin-Triplet Superconductor UTe2, Phys. Rev. B 100, 220504(R) (2019).
- (7) D. Aoki, K. Ishida, and J. Flouquet, Review of U-based Ferromagnetic Superconductors: Comparison between UGe2, URhGe, and UCoGe, J. Phys. Soc. Jpn. 88, 022001 (2019).
- (8) C. S. Wang, M. R. Norman, R. C. Albers, A. M. Boring, W. E. Pickett, H. Krakauer, and N. E. Christensen, Fermi surface of UPt3 within the local-density approximation, Phys. Rev. B 35, 7260 (1987).
- (9) G. J. McMullan, P. M. C. Rourke, M. R. Norman, A. D. Huxley, N. Doiron-Leyraud, J. Flouquet, G. G. Lonzarich, A. McCollam, and S. R. Julian, The Fermi surface and -valence electron count of UPt3, New J. Phys. 10, 053029 (2008).
- (10) T. Oguchi and A. J. Freeman, Hybridization, electronic structure and properties of uranium intermetallics: URu3, URh3, UPd3, UIr3 and UPt3, J. Magn. Magn. Matter 61, 233 (1986).
- (11) S.-I. Fujimori, I. Kawasaki, Y. Takeda, H. Yamagami, A. Nakamura, Y. Homma, and D. Aoki, Electronic Structure of UTe2 Studied by Photoelectron Spectroscopy, J. Phys. Soc. Japan 88, 103701 (2019).
- (12) A. B. Shick and W. E. Pickett, Spin-orbit coupling induced degeneracy in the anisotropic unconventional superconductor UTe2, Phys. Rev. B 100, 134502 (2019).
- (13) L. Miao, S. Liu, Y. Xu, E. C. Kotta, C.-J. Kang, S. Ran, J. P. Paglione, G. Kotliar, N. P. Butch, J. D. Denlinger, and L. A. Wray. Low Energy Band Structure and Symmetries of UTe2 from Angle-Resolved Photoemission Spectroscopy, Phys. Rev. Lett. 124, 076401 (2020).
- (14) Y. Xu, Y. Sheng, and Y.-F. Yang, Quasi-two-dimensional Fermi surfaces and unitary spin-triplet pairing in the heavy fermion superconductor UTe2, Phys. Rev. Lett. 123, 217002 (2019).
- (15) J. Ishizuka, S. Sumita, A. Daido, and Y. Yanese, Insulator-metal transition and topological superconductivity in UTe2 from a first-principles calculation, Phys. Rev. Lett. 123, 217001 (2019).
- (16) S.-I. Fujimori, I. Kawasaki, Y. Takeda, H. Yamagami, A. Nakamura, Y. Homma, and D. Aoki, Core-Level Photoelectron Spectroscopy of UTe2, J. Phys. Soc. Japan 90, 015002 (2021).
- (17) G. Zwicknagl, electrons in actinides: dual nature and photoemission spectra, Int. J. of Modern Phys. B, 21, 2232 (2007).
- (18) H. H. Hill, The early actinides: the periodic system’s electron transition metal series, in Plutonium 1970 and Other Actinides, edited by W. N. Miner ( Metallurgical Society of the AIME, New York, 1970), p. 2.
- (19) A. M. Boring and J. L. Smith, Plutonium condensed matter physics: A survey of theory and experiment, Los Alamos Sci., 26, 90 (2000).
- (20) E. R. Ylvisaker, W. E. Pickett, and K. Koepernik, Anisotropy and magnetism in the LSDA+U method, Phys. Rev. B 79, 035103 (2009).
- (21) A. B. Shick, A. I. Liechtenstein, and W. E. Pickett, Implementation of the LDA+U method using the full-potential linearized augmented plane-wave basis, Phys. Rev. B 60, 10763 (1999).
- (22) A. B. Shick and W. E. Pickett, Magnetism, Spin-Orbit Coupling, and Superconducting Pairing in UGe2, Phys. Rev. Lett. 86, 300 (2001).
- (23) A. Hewson, The Kondo Problem to Heavy Fermions (Cambridge University Press, Cambridge U.K., 1993).
- (24) A. B. Shick, J. Kolorenc, A. I. Lichtenstein, and L. Havela, Electronic structure and spectral properties of Am, Cm, and Bk: Charge-density self-consistent LDA+HIA calculations in the FP-LAPW basis, Phys. Rev. B 80, 085106 (2009).
- (25) J. Kolorenc, A. Poteryaev,and A. I. Lichtenstein, Valence-band satellite in ferromagnetic nickel: LDA+DMFT study with exact diagonalization, Phys. Rev. B 85, 235136 (2012).
- (26) O. Kristanovski, A. B. Shick, F. Lechermann, and A. I. Lichtenstein, Role of nonspherical double counting in DFT+DMFT: Total energy and structural optimization of pnictide superconductors, Physical Review B 97, 201116(R) (2018).
- (27) H. Harima, How to obtain Fermi surfaces of UTe2, JPS Conf. Proc. 29, 011006 (2020).
- (28) K. T. Moore and G. van der Laan, Nature of the 5 states in actinide metals, Rev. Mod. Phys. 81, 235 (2009).
- (29) P. Mohn, Theoretical aspects of hyperfine interactions, Hyperfine Interact. 128, 67 (2000).
- (30) A. Damascelli, Probing the electronic structure of complex systems by ARPES, Phys. Scr. T109, 61 (2004).