Effects of collision enhanced charging on dust crystal
Abstract
Numerical simulations of monolayer dust crystals in an RF complex plasma were performed to examine the crystal structure and quantify the effects of including the collision enhanced ion current in the charging model. A GEC cell similar to a previous experimental work was modeled for a range of RF voltages, using a continuum description for the plasma and a particle description for dust grains. The time history of each dust grain was monitored. The dust charge was computed using both the OML and the collision enhanced charging (CEC) model applicable to the sheath region. The dust model accounted for the electric force, ion drag force, neutral drag force, gravity, and the ion wake. The CEC model produced a lower charge and lower electric force which agreed better with the experimental data. Then dust crystals composed of 40 to 100 grains were modeled and the levitation height and inter-particle spacing of the resulting crystals was examined. Including the collision enhanced current reduced the inter-particle spacing but only had a minor effect on the levitation height.
This article may be downloaded for personal use only. Any other use requires prior permission of the author and AIP Publishing. This article appeared in A. Wilson and B. Shotorban, Physics of Plasmas 28, 033705 (2021) and may be found at https://doi.org/10.1063/5.0031596
I Introduction
Low temperature plasmas containing micro- or nanometer-size solid particles, are common in both nature and industrial setups Shukla (2001). Such complex (or dusty) plasmas naturally occur in many astrophysical phenomena such as nebula, comets and planetary rings Goertz (1989). Protoplanetary disks are dusty plasmas where the aggregate-plasma interaction has significant effects on the formation and properties of the dust aggregates Matthews, Land, and Hyde (2011). Dusty low temperature plasmas are also common in manufacturing setups where plasmas are utilized to fabricate semiconductors or coat micro-particles. Further, microelectronics manufacturing is concerned about contamination due to dust Selwyn, Heidenreich, and Haller (1990), which is the byproduct of laser etching or chemical reactions and can degrade the semiconductors if the grains settle on the chip. On the other hand, in materials processing applications such as plasma enhanced chemical vapor deposition (PECVD), dust grains in the form of micro- or nano-particles are deliberately introduced to be coated Cao and Matsoukas (2002). PECVD is also used to deposit films onto substrates Stoffel et al. (1996) and grow carbon nanotubes Meyyappan et al. (2003).
The observation of Coulomb crystallization Ikezi (1986); Thomas et al. (1994) in dusty plasmas inspired additional interest. In Coulomb crystallization, the dust grains form an organized structure that is suspended in the plasma. In RF plasmas, small dust crystals formed under the influence of gravity are flat Thomas et al. (2005) and only a few layers thick while crystals formed in micro-gravity are three-dimensional and often contain central voids Goedheer and Land (2008); Schwabe et al. (2014). The horizontal structure is typically hexagonal, however the vertical structure is aligned rather than close-packed Schweigert et al. (1996). The crystal structure interests physicists because it allows solid state physics to be examined on a scale accessible with optical techniques as well as displaying some unique features such as melting Schweigert et al. (1998); Rubin-Zuzic et al. (2006). The phase transition between crystalline structures and liquids is related to the energy of the grains as well as the presence of structural defects Klumov (2010) and is an area of ongoing research for both two-dimensional Hartmann et al. (2010); Klumov (2019) and three-dimensional Steinmüller et al. (2018); Reshetniak and Filippov (2019) systems. Experimental observations of Coulomb crystals have examined dislocations Nosenko, Morfill, and Rosakis (2011), density waves Schwabe et al. (2007) and the dust acoustic wave Barkan, Merlino, and D’angelo (1995); Merlino et al. (1998) among other topics.
In the modeling of dusty plasmas, the dust is either treated as a continuum medium (fluid description) Goedheer, Land, and Venema (2009) or dust grains are tracked in the Lagrangian framework (particle description). A fluid description of the dust assumes the presence of a large quantity of dust so it does not typically deal with relatively small crystals or provide information on the crystal structure. On the other hand, the spatial distribution of the dust density distribution is readily calculated in the fluid description so it is useful for investigation of phenomena such as void formation in microgravity experiments Land et al. (2010) where a precise description of the crystal structure is usually not of interest.
A critical aspect of modeling dusty plasmas is the charging representation. The traditional method of determining the ion and electron currents is orbital motion limited (OML) theory Allen (1992) which assumes a collisionless plasma where the electrons have a Maxwellian distribution and the ions are treated assuming either a Maxwellian distribution, for the bulk of the plasma, or a monoenergetic beam, for the sheathBarnes et al. (1992). Sometimes, the OML model is modified to use a shifted Maxwellian distribution for the ions Douglass et al. (2011) which allows the model to handle both the bulk and sheath. However, the OML model neglects charge exchange collisions which can thermalize ions that can become trapped by a negatively charged dust grain and reduce the dust grain charge. Since the collision enhanced current depends on the ion motion, there are two models that incorporate it, one for the bulk Khrapak et al. (2005) where the ion velocity is low and one for the sheath Piel and Schmidt (2015) where the ion velocity is significant. The work by Piel and Schmidt (2015) showed the effects of the collision enhanced current on the surface potential of a single dust grain, the current work examines the effects on a dust crystal.
Modeling efforts through a particle description of dust have been more interested in waves or voids Schwabe and Graves (2013); Schwabe et al. (2014) than in the structure of the plasma crystal. These studies either significantly simplified the problem to allow for tracking a large number of dust grains Schwabe and Graves (2013) or examined smaller crystals with fewer simplifications Davoudabadi and Mashayek (2007). An example of a simplified model of a large crystal is the work by Klumov, Rubin-Zuzic, and Morfill (2007) which examined a crystallization wave. In this work, the plasma profile was prescribed, not computed, the ion wake was neglected and the dust grain charge was specified which allowed for examining a crystal containing 900 dust grains. The other approach is demonstrated by the work of Davoudabadi and Mashayek (2007) which examined small dust crystals, composed of 4-19 grains, in a cylindrical plasma reactor. The plasma was modeled using a continuum approach via a local field approximation for the plasma, the ion wake was modeled as a dipole, and the dust grain charge was computed as a function of time for each individual grain. The study performed a qualitative comparison of the crystal structure against the experimental data, however due to differences in the reactor conditions, quantitative comparisons were not be performed.
The present work is a computational study examining dust crystals in a GEC cell, a setup previously investigated experimentally Thomas et al. (2005); Hartmann et al. (2014). The GEC cell was first proposed to facilitate comparisons of experimental plasma studies done by different groups Boeuf and Pitchford (1995) and its popularity with the plasma community Kong et al. (2016); Siari et al. (2020) led to it being a common choice for complex plasma research. The reactor cross-section is shaped like an ‘H’ and the electrodes do not extend radially to the outer edge of the reactor. The shape of the GEC cell reactor results in a strong radial dependence with a maximum plasma density that is not on the reactor centerline Land et al. (2009). While GEC cells are commonly investigated in experiments, they are less common in computational studies. Models often treat the reactor as either a one-dimensional parallel plate setup Davoudabadi and Mashayek (2006) or a cylinderDavoudabadi and Mashayek (2007) which complicates comparing experimental and computational results.
The present study models a GEC cell dust experiment performed by Douglass et al. (2012) to gain further understanding of the dust crystal in this experiment. Further, the dust charging was separately represented by the OML approach and the collision enhanced charging (CEC) approach Piel and Schmidt (2015) to quantify the effect of the collision enhanced charge on the crystal. The plasma is modeled using a continuum approach illustrated in §II. To model dust dynamics, dust grains are individually tracked using equations described in §II. The numerical methods are illustrated in §III. The results are discussed in §IV and conclusions are made in §V.
II Governing Equations
II.1 Plasma Equations
The plasma model, which was presented in detail and validated previously Wilson and Shotorban (2018), is based on a continuum description using a second-order local mean energy approximationGogolides and Sawin (1992). In this model, the equations governing the electron number density , ion number density , and electron energy density are:
| (1) |
| (2) |
where
| (3) |
| (4) |
and is for ions and for electrons and electron energy. Here, is the electric field calculated by:
| (5) |
where is the electric potential which satisfies Poisson’s equation:
| (6) |
where is the electron charge. In the equations above, is the electron (ion) mobility, is the electron (ion) diffusion coefficient and is the electric field. Eqs. (3-4) define the fluxes of electrons (ions) and energy, respectively. The source term in Eq. (1) accounts for the electrons and ions created by ionization. The gas is assumed to be singly ionized, therefore where is the ionization rate coefficient. The ionization rate was determined by BOLSIG+ Hagelaar and Pitchford (2005) which solves the electron Boltzmann equation and tabulates the ionization rate and excitation rates as a function of the mean electron energy. The mean electron energy , the electron temperature and are correlated through
| (7) |
where is the Boltzmann constant. In the energy equation, Eq. (2), the term accounts for the ohmic or joule heating of the electrons in the electric field and the term accounts for the energy loss due to ionization and excitation, where is the ionization energy. Since this study examines small mono-layer dust crystals containing 40 - 100 dust grains, the dust loading is low enough that the dust does not significantly affect the plasma Havnes, Aanesen, and Melandsø (1990) and the plasma can be modeled without accounting for the modification of plasma by dust.
The boundary conditions for the plasma model are an applied voltage on the lower electrode with the remaining surfaces grounded. For the powered electrode, the electric potential is given by:
| (8) |
where is the direct current voltage, is the radio-frequency voltage and is the RF frequency. For the reactor geometry considered here, there is a difference in the area of the powered electrode and the total grounded area, which causes a natural DC bias Passchier and Goedheer (1993); Land et al. (2009). The bias in the model was set to match the bias measured in the experiments Douglass et al. (2012). The number and energy density boundary conditions assume that all surfaces are perfectly absorbing with no reflection Passchier and Goedheer (1993); Davoudabadi, Shrimpton, and Mashayek (2009), therefore, the ion and electron number density at the surface are zero, i.e., , and correspondingly, . Modeling the electron drift, thermal, and diffusion fluxes to the surface produces a slightly higher plasma density Wilson and Shotorban (2018) however the simpler boundary condition is used here to enable comparisons with the work of Douglass et al. (2012).
II.2 Dust Equations
Once the plasma reaches the quasi-steady state, the plasma values are averaged over one RF cycle and the dust grains are added. Because the dust loading is very low here, the plasma is assumed not affected by the dust; hence, it is not updated during the dust simulation.
Dust grain motion is fully three-dimensional with the position, velocity, and charge evolving over time. The equations for the position and velocity vectors of each grain are:
| (9) |
and
| (10) |
where is the total force on the grain and is the mass of the dust grain. The specific forces experienced by the dust particle is illustrated in sec. II.2.3.
The charge of the dust grain varies with time and is determined by the electron and ion currents to the grain, denoted by and , respectively:
| (11) |
The dust charge and the floating potential of the dust grain, , are related by:
| (12) |
where is the grain radius. Two different charging approaches are used in the present study, which are discussed in the following two subsections. For the plasma regions of interest here, the modified OML model using a shifted Maxwellian for the ions produces the same results as the standard OML model using a monoenergetic beam, so the shifted Maxwellian variation is not considered separately.
II.2.1 Orbital-motion limited (OML) charging
The classic approach to determine the ion and electron currents is the OML theory Allen (1992) which assumes a Maxwellian distribution for the electrons and a monoenergetic beam for the ions Barnes et al. (1992). The electron current is written in terms of the floating potential as:
| (13) |
where is the radius of the dust grain and is the electron thermal velocity. The ion current is defined as:
| (14) |
The velocity used to obtain the ion current is the ion mean speed toward the dust grain, , where is the ion thermal velocity and the is the drift motion velocity relative to the dust grain.
II.2.2 Collision Enhanced Charging (CEC)
The second charging method examined here is the collision enhanced ion current model proposed by Piel and Schmidt (2015). In this model, the ion current includes the effect of collisions which can cause a flowing ion to become a thermal ion. If the resulting potential energy is below a certain threshold, the ion will become trapped and collected by the negatively charged dust grain which can substantially reduce the dust charge compared to the collisionless OML model. In CEC, the electron current to the dust grain is the same as in the OML model, viz. Eq. (13).
The ion current is the sum of the collisionless current and the collision enhanced current :
| (15) |
| (16) |
where is the ion mean speed toward the dust grain, and is the ion mean free path, which is based on the charge exchange cross-section of argon ions Phelps (1991). The terms and and the major semi-axis and the minor semi-axis, respectively, of the ellipse that defines the trapping region, the calculation of these variables is illustrated in Appendix A. It is noted that the total ion current, the summation of Eq. (15) and Eq. (16), reduces to the OML model if is zero.
II.2.3 Dust Forces
The forces experienced by the dust grain are: the gravitational force, the electric force, the ion drag force, the neutral drag force, and the force due to interactions with other dust grains.
The force on the dust grain due to gravity is given by where is the unit vector in the vertical direction.
The electric force is defined as:
| (17) |
where
| (18) |
is the effective (linearized) Debye length at the grain location. The second term in the brackets in Eq. (17) accounts for the fact that the grain is not a geometric point charge.
The ion drag force accounts for the effect of ions that are collected by the grain as well as ions that are scattered in the field of the grain. The ion drag force is calculated by Barnes et al. (1992):
| (19) |
where the first term accounts for the ions collected by the grain with the collection impact parameter defined as:
| (20) |
and the second, orbital, term accounts for the ions that are scattered in the field of the grain due to Coulomb collisions. The orbital impact parameter corresponding to a deflection is:
| (21) |
The Coulomb logarithm is given by:
| (22) |
where is the electron Debye length. It is noted that Hutchinson (2006) showed that the accuracy of the ion drag force model of Barnes et al. (1992) may not be sufficient for an ion Mach number ranging between 1 and 2. As will be seen, the dust crystals simulated here levitate near the edge of the sheath where the ion Mach number is significantly larger; and hence, Barnes et al. (1992)’s model is adequate.
While there is no neutral gas flow, the neutral drag force has a damping effect on dust grain motion Nitter (1996) so it is included here. The model for the neutral drag force assumes specular reflection of the neutral particles after collision with the dust grain. The force is defined by the Epstein relation:
| (23) |
The neutral temperature is constant and equal to the ion temperature, , and the neutral density is .
Since the model assumes that the dust does not affect the plasma, the ion wake that occurs around the negatively charged dust grains is modeled in the interaction force instead of in the plasma profile. There are a variety of models proposed for the ion wake ranging from detailed models that include collisions and non-Maxwellian ions Kompaneets, Morfill, and Ivlev (2016) to simple models which treat the particle and wake as a dipole Davoudabadi and Mashayek (2007) or a pair of particles Qiao, Matthews, and Hyde (2010). Since the most significant effect of the ion wake is the vertical alignment Samarian, Vladimirov, and James (2005) seen between layers in a dust crystal and this study only examines mono-layer crystals, the simple image particle model is used for the ion wake. Using this model means effects of the ion wake on crystal parameters, such as the crystal stability, can not be examined in detail, however since the ion wake is not the focus of this work, the image particle model is adequate. In the image particle model, the dust grain and ion wake are modeled by including a positively charged image particle downstream of the dust grain Qiao, Matthews, and Hyde (2010). The image particle has a charge and is located at a distance downstream of the dust grain, where ‘downstream’ is defined based on the direction of the ion flow at the location of the dust grain. Here, the values of these two parameters are set to and , as suggested by Qiao, Matthews, and Hyde (2010).
The force on grain due to grain is a function of the potential around particle , which is indicated by , and the grain separation distance . The potential around the dust grain is modeled using the screened Coulomb potential since the particle separation distance is comparable to the plasma screening length. Since the plasma screening length has been experimentally measured to be on the same order as the bulk electron Debye length Konopka, Morfill, and Ratke (2000); Fortov et al. (2005) but is sometimes attributed to the ions Carstensen, Greiner, and Piel (2010); Kompaneets et al. (2007), this study uses the linearized Debye length at the grain location, given by Eq. (18), as the screening length.
The negatively charged dust grain will attract the positive ions which results in a reduction of the apparent charge viewed from a long distance Laframboise (1966). This effect is referred to as plasma screening and is modeled using the screened Coulomb potential where the potential around grain is given by:
| (24) |
and the potential around the image particle associated with grain is given by:
| (25) |
The force on grain due to grain is the summation of the force due to the grain itself and the force due to the image particle:
| (26) |
where is the distance between grain and grain , is the unit vector from grain to grain , and and are the distance and unit vector, respectively, between grain and the image particle associated with grain . The force on grain due to the ion wake that forms around it is included in the ion drag force and not the interaction force.
III Numerical Method
Details of the numerical methods used for the plasma simulation were provided in a previous workWilson and Shotorban (2018) with a summary here. The time derivatives in the plasma equations use a second order scheme and the equations are iterated until the system is solved simultaneously. The spatial discretization of the fluxes uses the Scharfetter-Gummel scheme Scharfetter and Gummel (1969); Boeuf (1987); Hagelaar and Kroesen (2000). The remaining spatial discretizations use a second-order finite difference method applied in an axisymmetric cylindrical coordinate consistent with the axisymmetric geometry of the plasma reactor. A uniform, staggered grid is used with the primary variables, , , and , evaluated on the nodes, and the electric field and the fluxes evaluated halfway between the nodes. The boundary passes through the nodes.
Once the plasma has reached a quasi-steady state, i.e., the time-averaged plasma properties do not change with time, the plasma properties are averaged over one RF period and used as an input to the dust model. The individual dust grains are tracked in a three dimensional Lagrangian framework with no axisymmetric assumption. A linear interpolation in both the and directions is used to obtain the plasma values at the location of each grain and the forces on the grains are determined from the interpolated plasma values. The interaction between dust grains is computed for pairs of grains based on the current location of each dust grain and the local plasma Debye length. Then, the dust Eqs. (9-11) are solved using the second-order Adams-Bashforth scheme to advance to the next time step.
IV Results and Discussion
The configuration of the reactor studied here resembles a GEC cell experimentally investigated in a previous work Douglass et al. (2012). The reactor was 22.81 cm high with a 2.54 cm gap between the electrodes. The reactor and electrode radii were 12.7 cm and 5.4 cm, respectively. The lower electrode had a 1.27 cm radius circular cutout with a 1mm depth, needed to create a parabolic profile Klumov (2019) in the radial electric field to confine the dust to the center of the reactor. The operating parameters used in the simulation are given in Table 1. Cases were simulated with 40, 60, 80, and 100 dust grains. Three sizes of dust grains were examined, with diameters of 6.37, 8.89 and 11.93 .
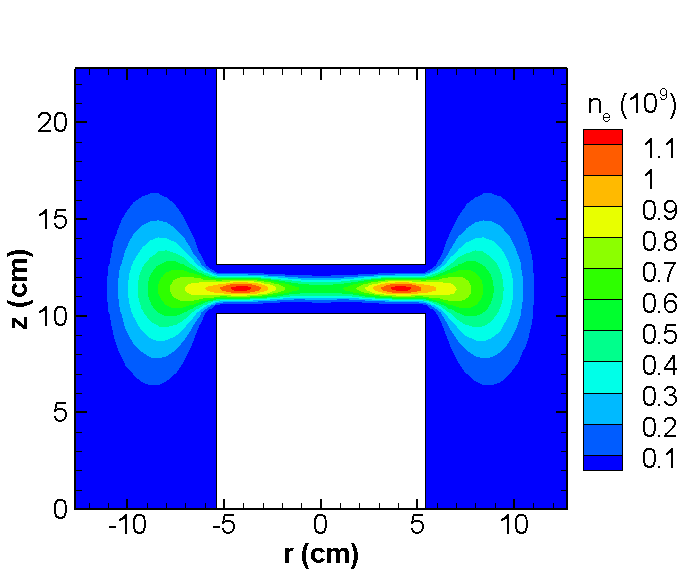
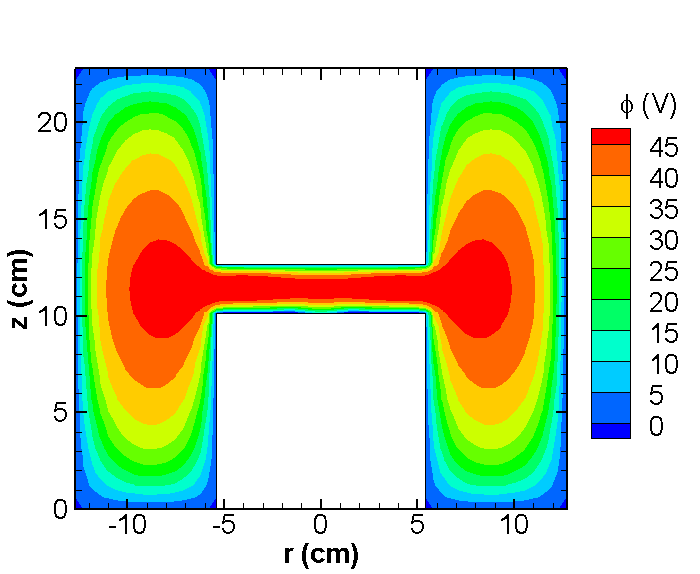
Figure 1 shows the contours of electron number density and electric potential for the case with an RF voltage of 60 V. The geometric form of the reactor including side regions past the electrodes causes the plasma to expand radially and as a result, the maximum plasma density to occur away from the reactor centerline, viz. , as seen in Fig. 1(a). The specific role of the electrode cutout is to confine the dust crystal radially by slightly altering the electric field in the radial direction. Hence, the region of interest for the dust crystal, as will be seen, is the section of the reactor between the electrodes with a radius less than the radius of the cutout (cm).
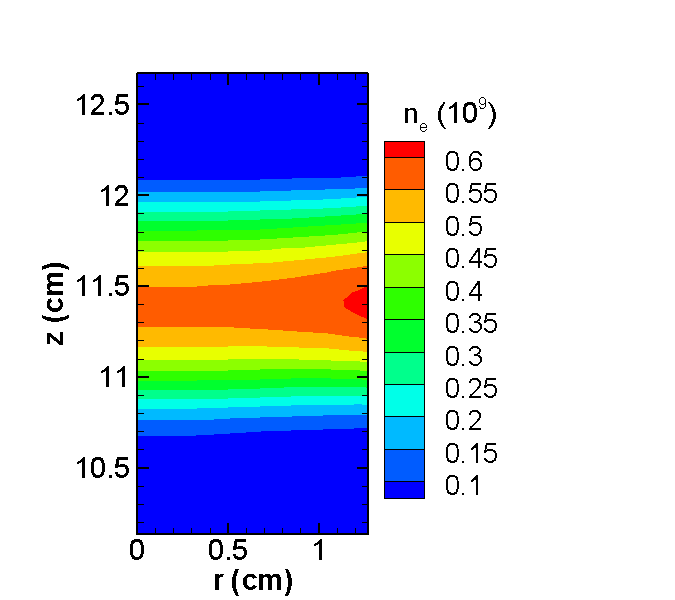
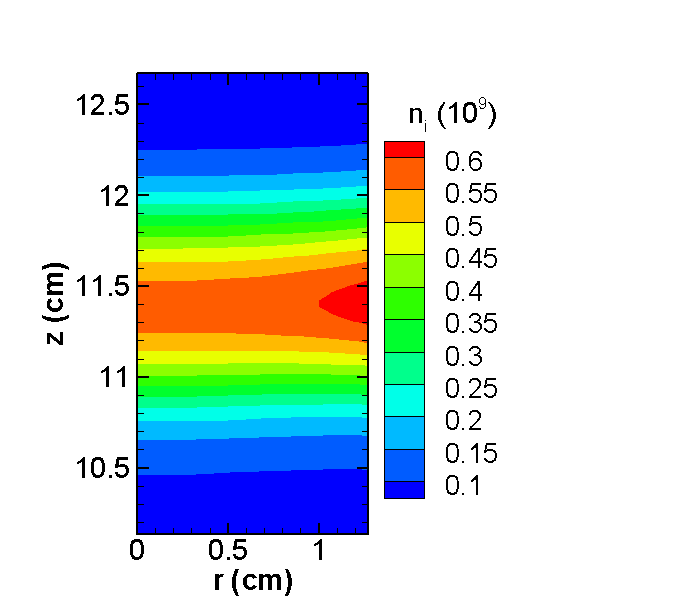
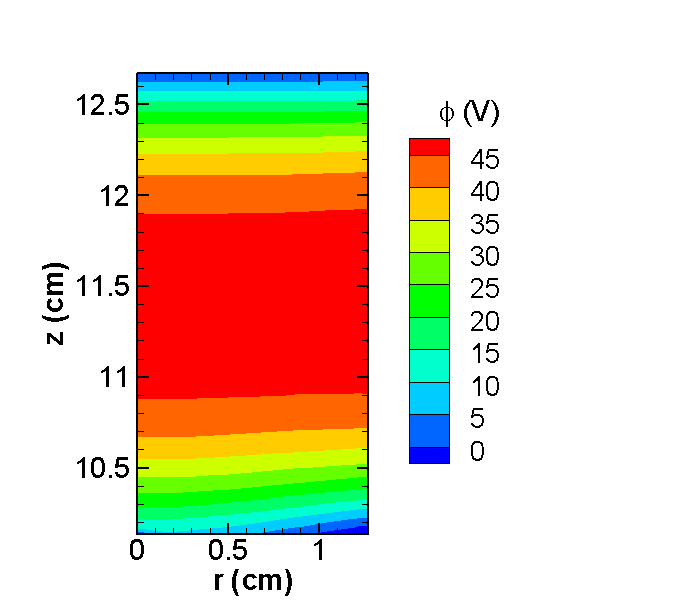
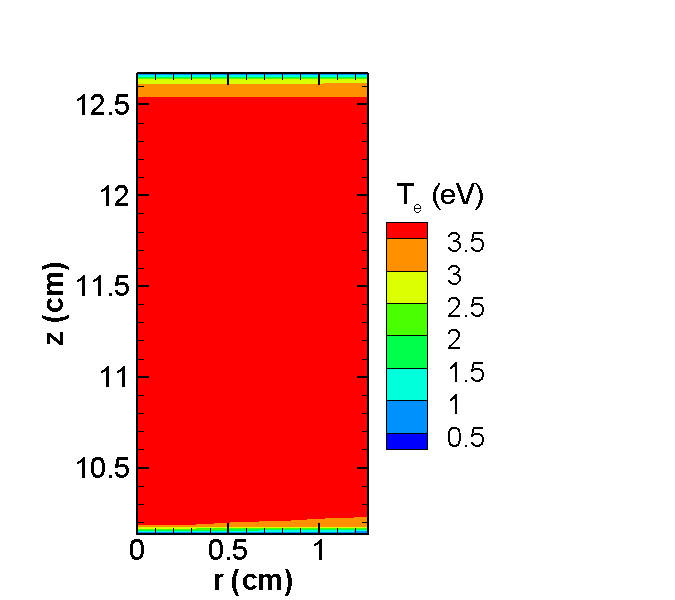
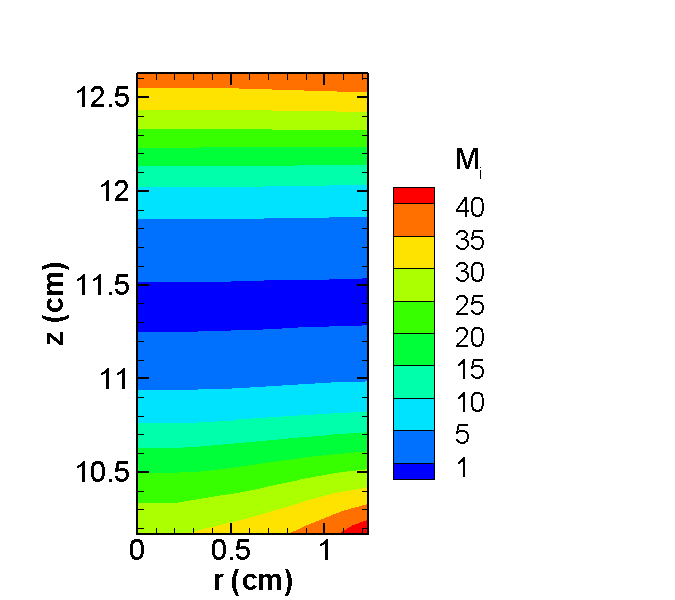
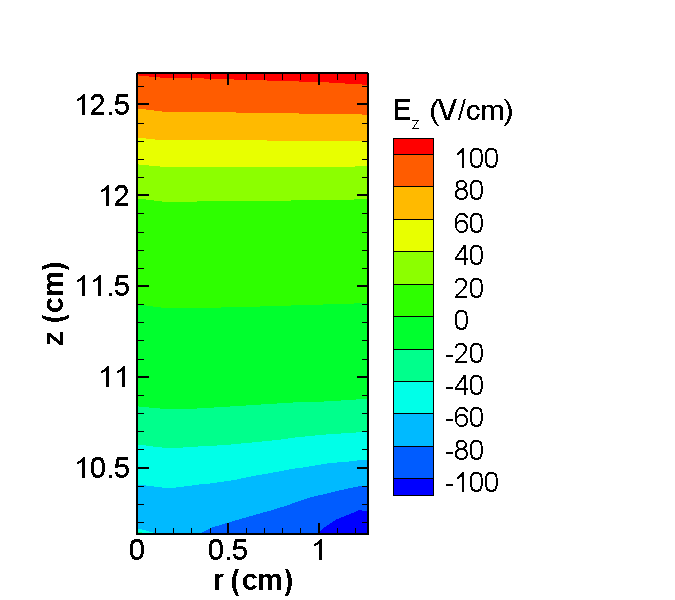
Figure 2 shows the contour plots of plasma variables in the region of interest. This is the region where the dust crystal is confined. The maximum plasma density in the reactor occurs outside this region, as seen in Fig. 1(a), and the maximum plasma density within the region of interest is about half of that in the entire reactor. Both electric potential and electric field, shown in Fig. 2(c) and (f), respectively, have a radial dependence along the lower electrode because of the electrode cutout. Based on correspondence with the authors of Douglass et al. (2012), a parabolic voltage distribution is added to the applied RF voltage to model this cutout on the electrode in the radial direction. The ion Mach number is shown in Fig. 2(e). Due to the assumption that the ion temperature is constant, the ion thermal velocity is constant. The ion drift velocity is obtained from the ion flux by . Since the ion flux is a function of the electric field, the ion drift velocity is also dependent on the electric field. The ion Mach number is supersonic over most of the region with the exception of a narrow band in the bulk of the plasma where the electric field is close to zero. The subsonic band is 2.5 mm in height and is located 11 mm above the lower electrode. Since the OML model assumes a monoenergetic beam for the ions and the CEC model assumes a significant ion velocity, neither model is valid for the region in the bulk where the ion velocity is low. Therefore, the dust results are only displayed for the region in the lower sheath below 11.2cm in the vertical direction, which is within 10mm above the lower electrode.
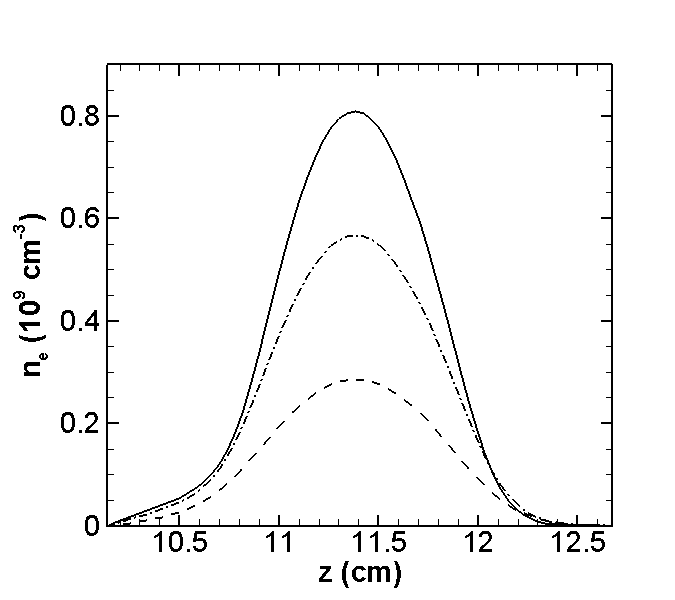
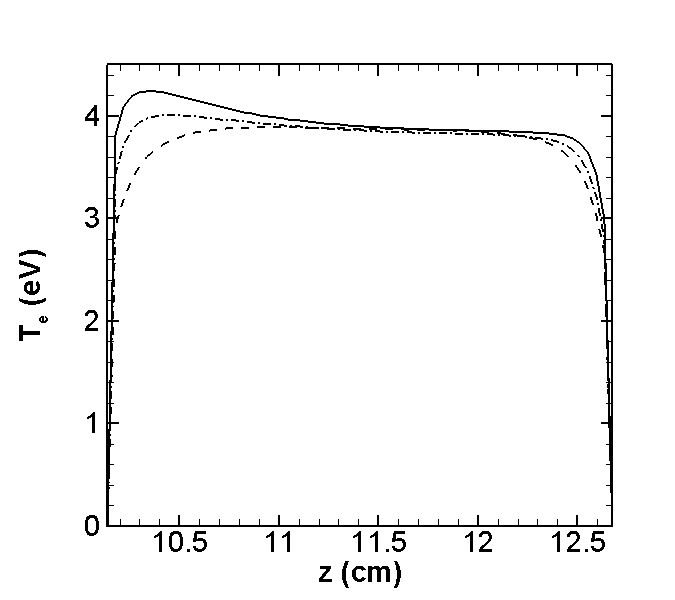
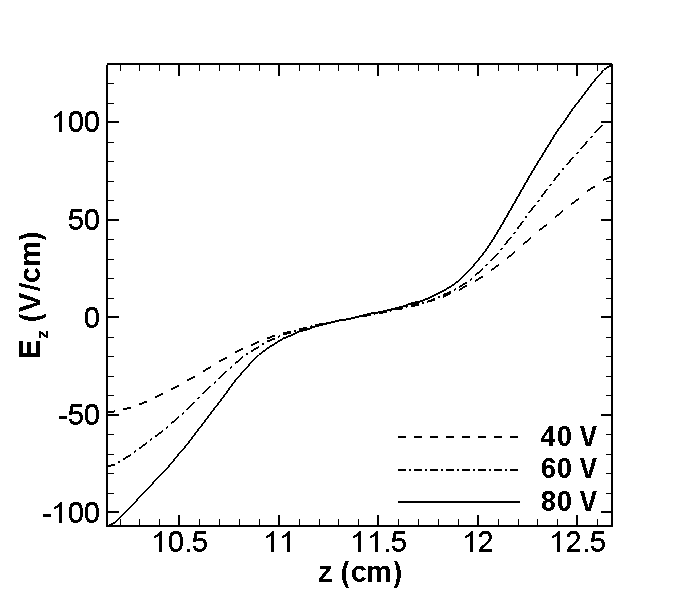
Figure 3 shows the effect of changing the RF voltage on the plasma. The number density in the bulk is a function of the RF voltage. For this setup, the maximum number density increased by a factor of four as the RF voltage was doubled from 40 to 80 V. The electron temperature was less sensitive to the RF voltage; the only effect was a small increase in the electron temperature in the sheath as the RF voltage increased. The electric field did not show an effect in the bulk however the electric field in the sheath doubled when the RF voltage doubled. There is an asymmetry in the plasma due to the constant DC voltage of -5 V, this is most obvious in the temperature profile and can also be seen in the larger sheath near the upper electrode and the higher electric field there.
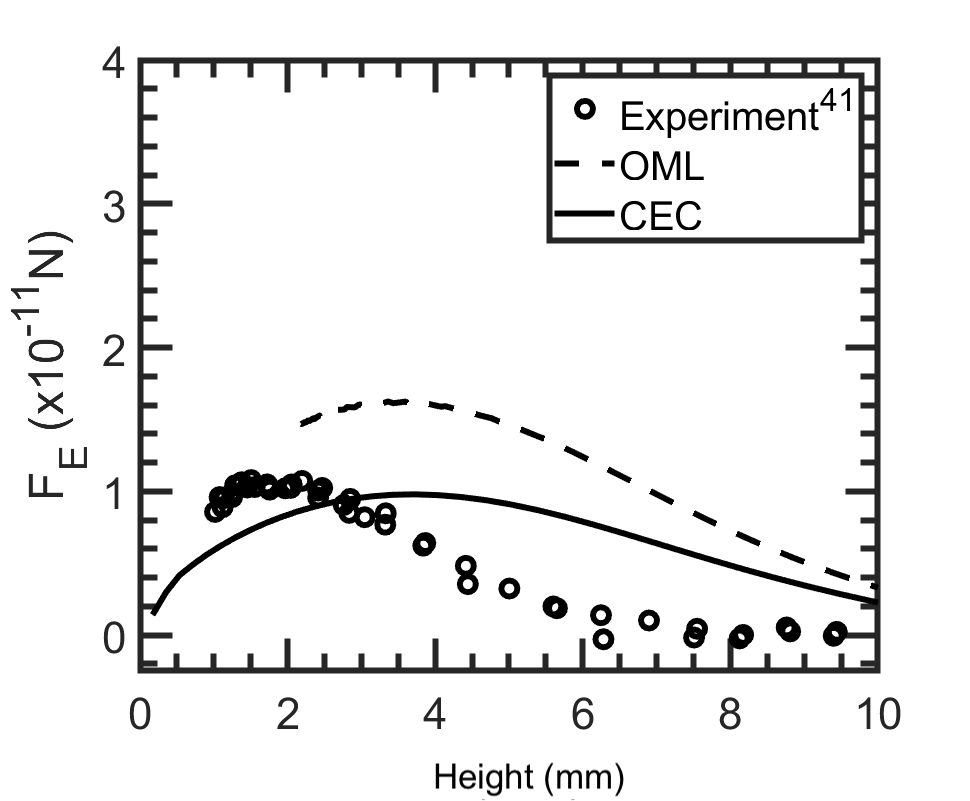
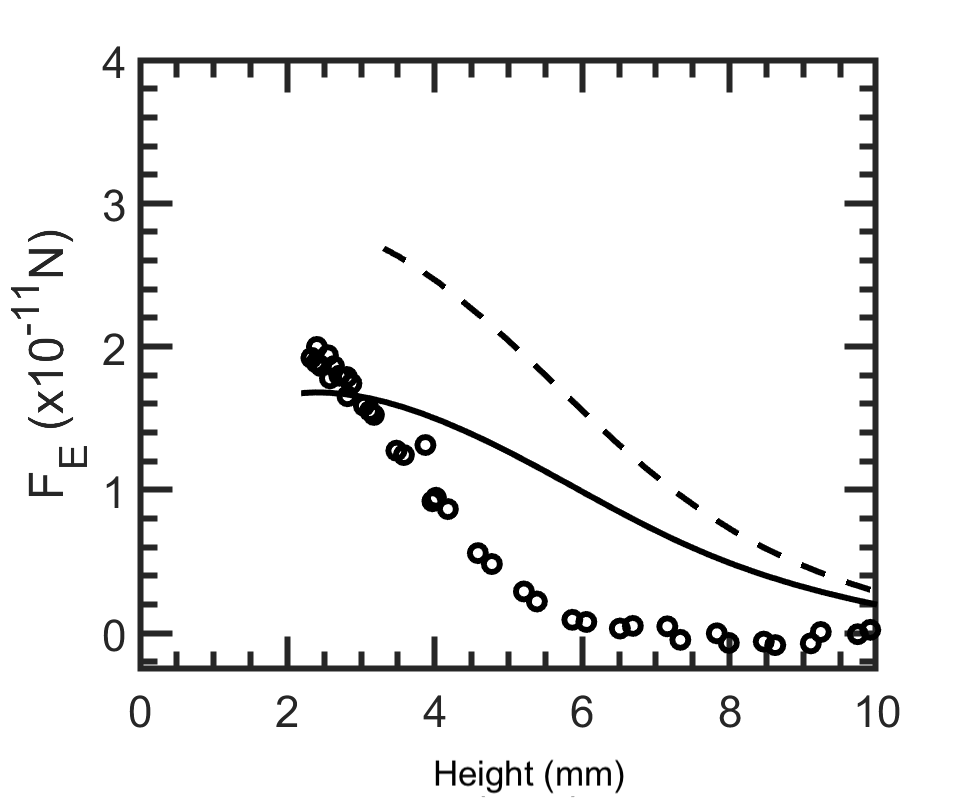
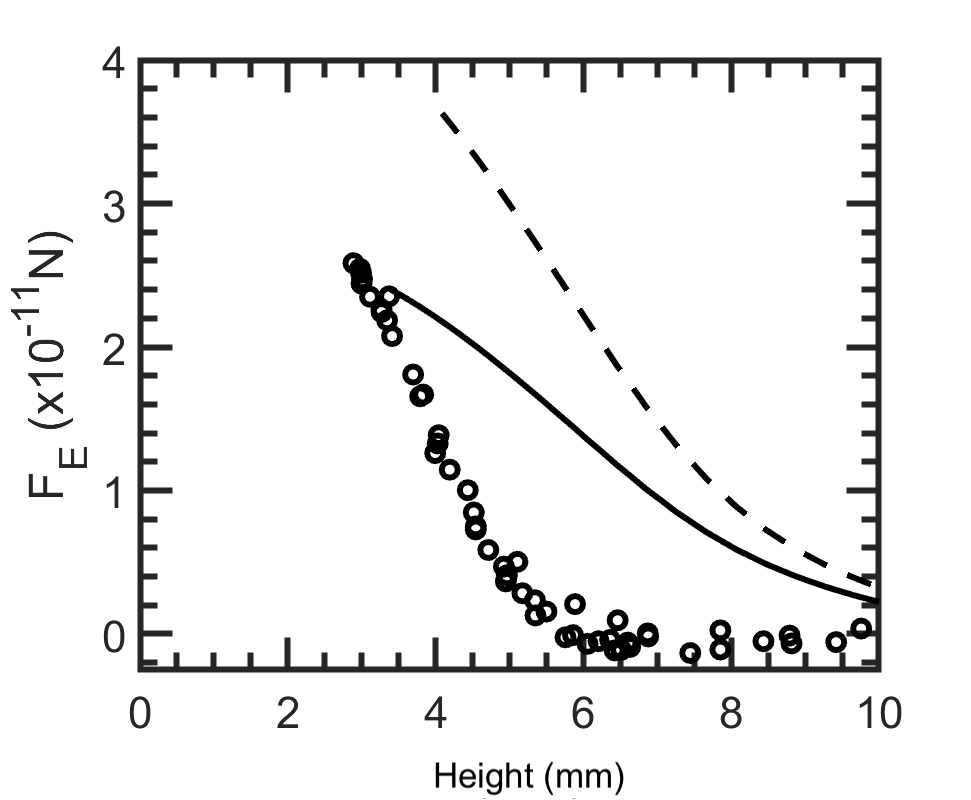
The experimental data of Douglass et al. (2012) was used to validate the dust model. In the experiments, the trajectory of a single grain was recorded and the electric force was determined from the acceleration using an Epstein drag coefficient to calculate the drag force on the dust grain. In the current modeling study, a single 8.89 diameter dust grain was released along the reactor centerline, ; the grain was tracked and the computed electric force was compared against the experimental data Douglass et al. (2012). This validation exercise was conduced for both the OML and CEC charging models.
Figure 4 shows the electric force profiles from the current simulations based on OML and CEC charging models as well as the previous experimental data from Douglass et al. (2012). The electric force in the experiment is almost constant at heights above 6mm and increases rapidly as the height decreases suggesting a transition between the bulk and sheath around 6mm. In contrast, neither the OML nor CEC models show an obvious transition point between bulk and sheath. It is noted that Douglass et al. (2012) did not directly measure the electric force but used the measured data in combination with a theoretical equation for the grain motion where the ion drag force was completely neglected. In contrast, the ion drag force is included in our model. Nonetheless, the trends of all three curves are similar in this figure but it is evident that between two models, CEC does a better job in terms of the error, defined as the difference between the modeling and experimental electric forces, for all range of and all considered grain sizes.
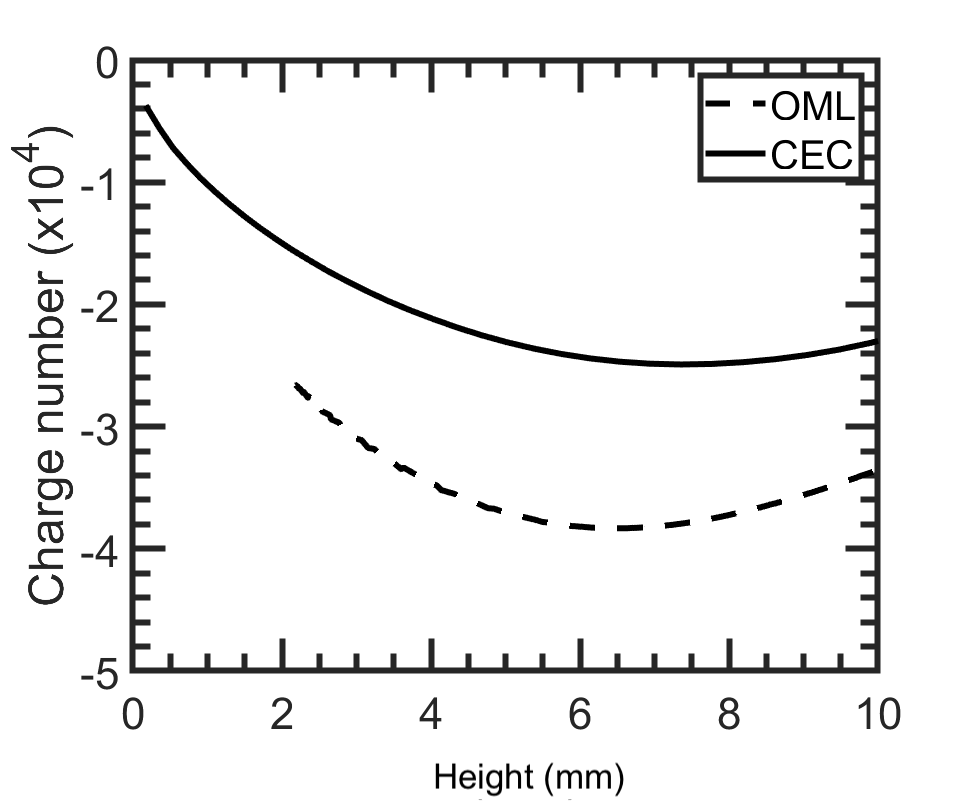
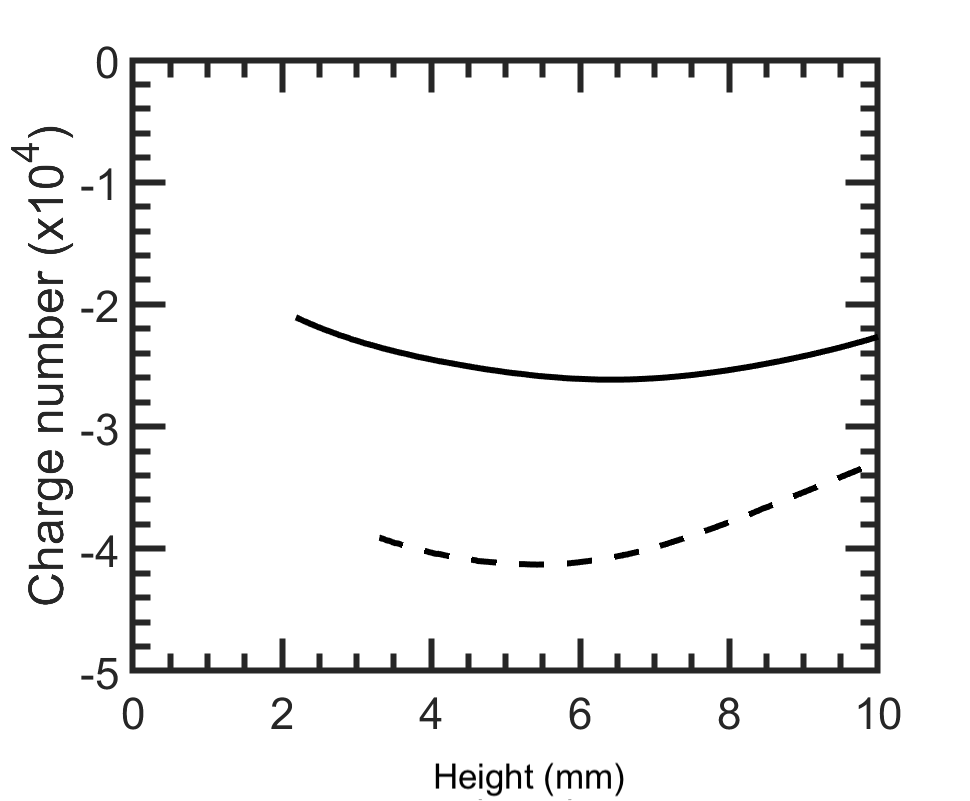
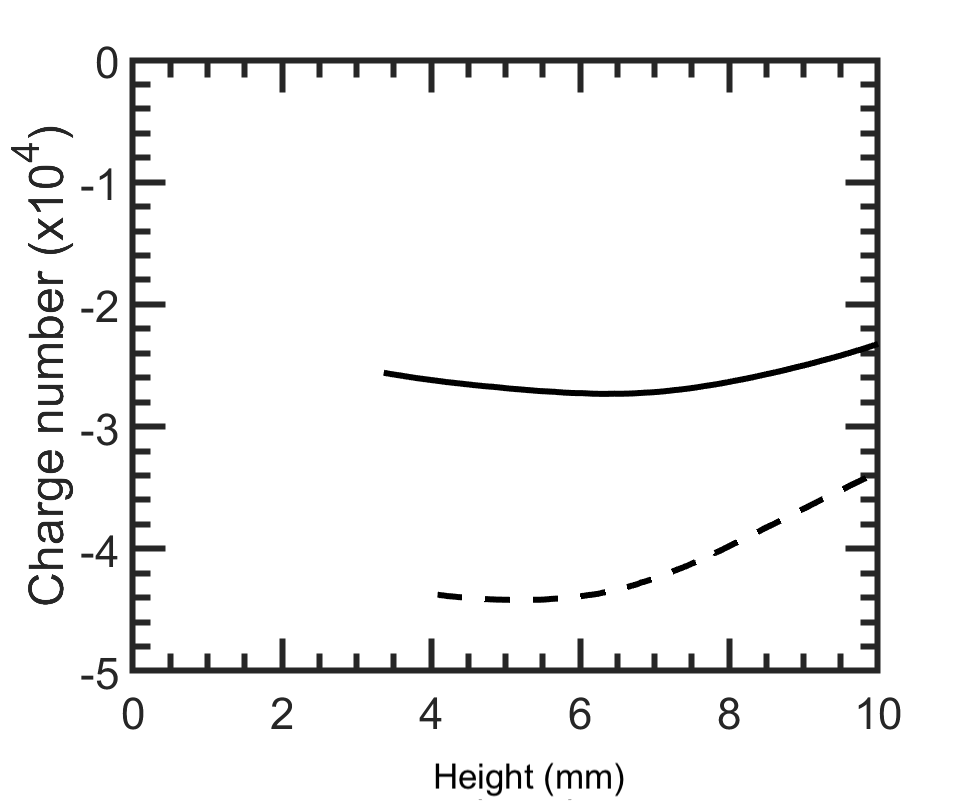
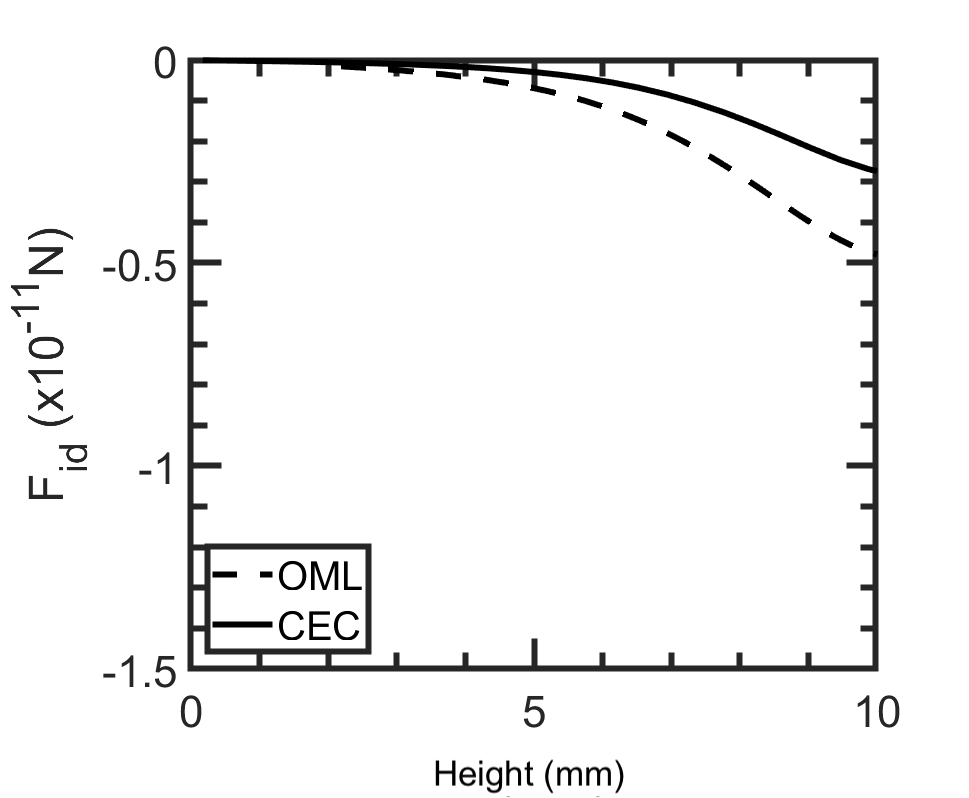
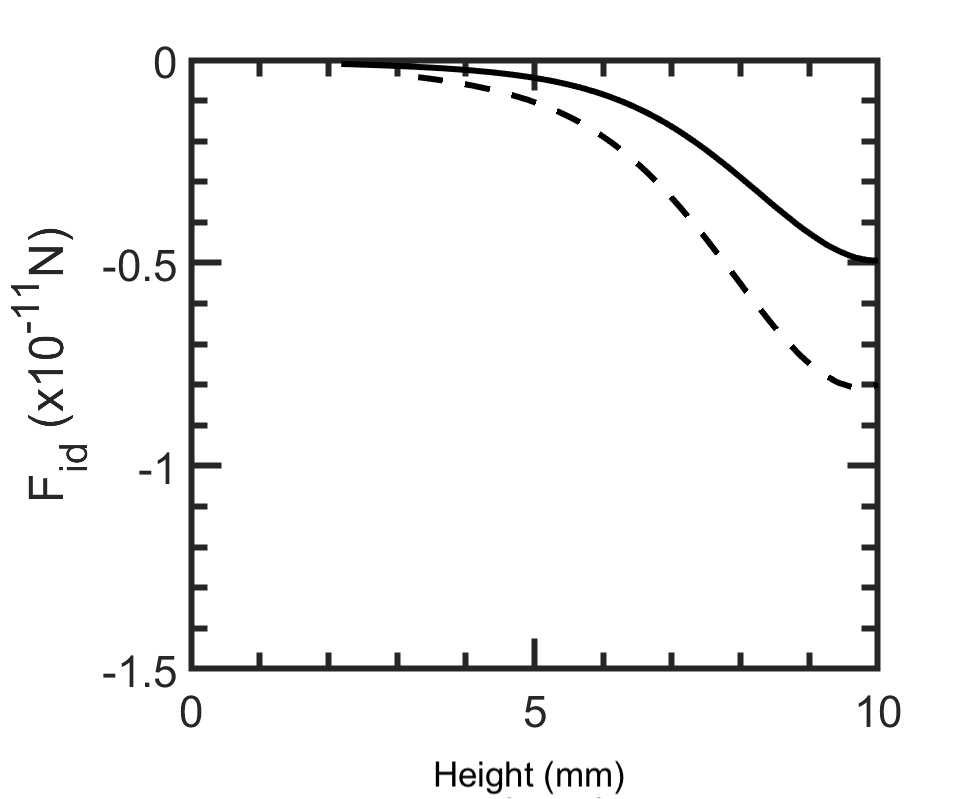
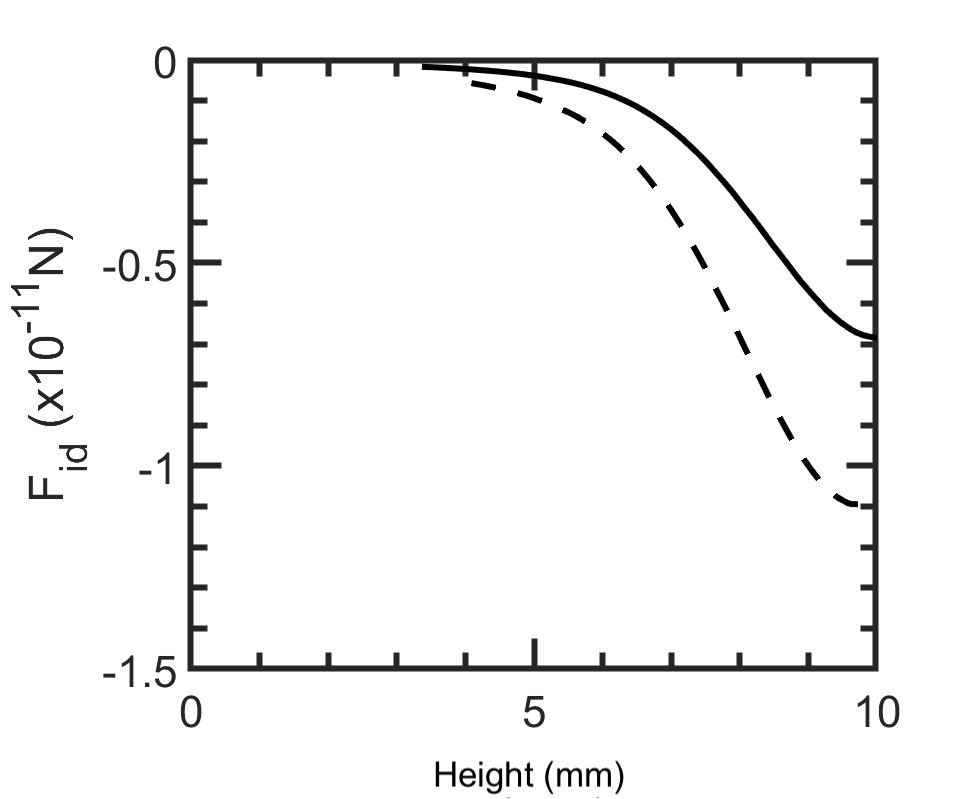
The difference in the electric force between the two models is due to a lower charge represented by the CEC model, as seen in Figure 5, which shows the dust charge number, i.e. the number of electrons collected on the dust grain . The additional ion current due to thermal ions in the CEC model reduces the dust charge by around 20% throughout the domain. The ion drag force is also dependent on the grain charge, and Figure 6 shows the ion drag force on the dust grain for the two charging models, OML and CEC. The ion drag force, Eq. (19), is a function of the dust floating potential and the ion velocity, through the term , so the difference between the OML and CEC results is larger in the regions near the bulk where the ion velocity is smaller and less dominant. Since the dust grains levitate between 4-8mm above the electrode, the ion drag force will be around 20-40% of the electric force and will influence the levitation height of the dust grain.
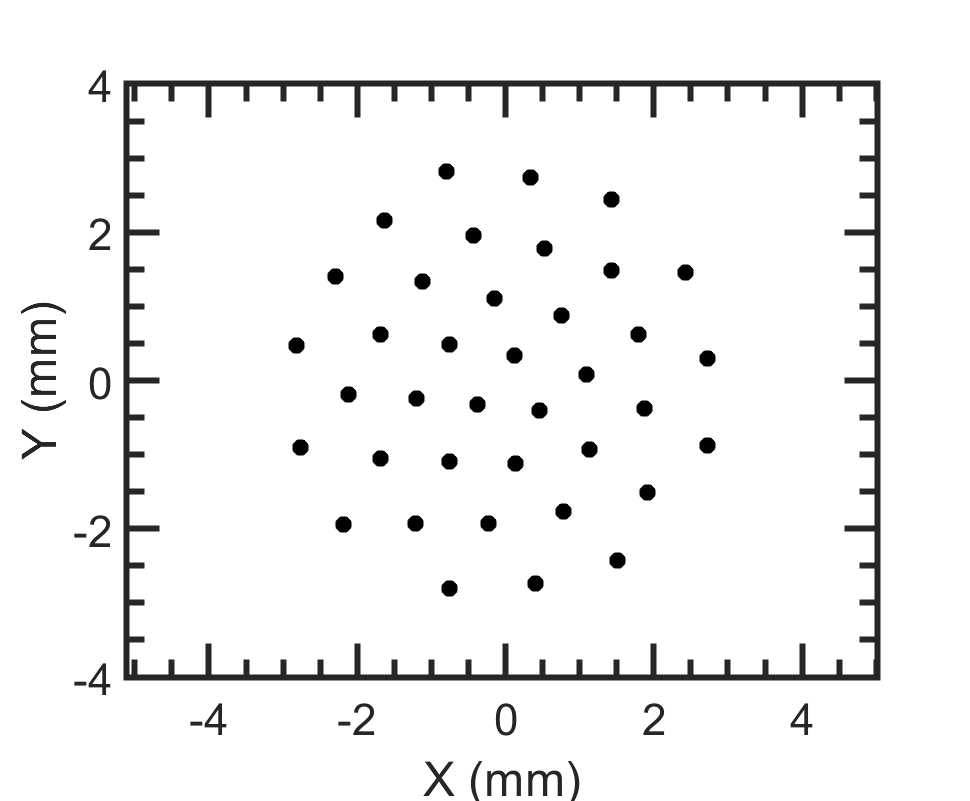
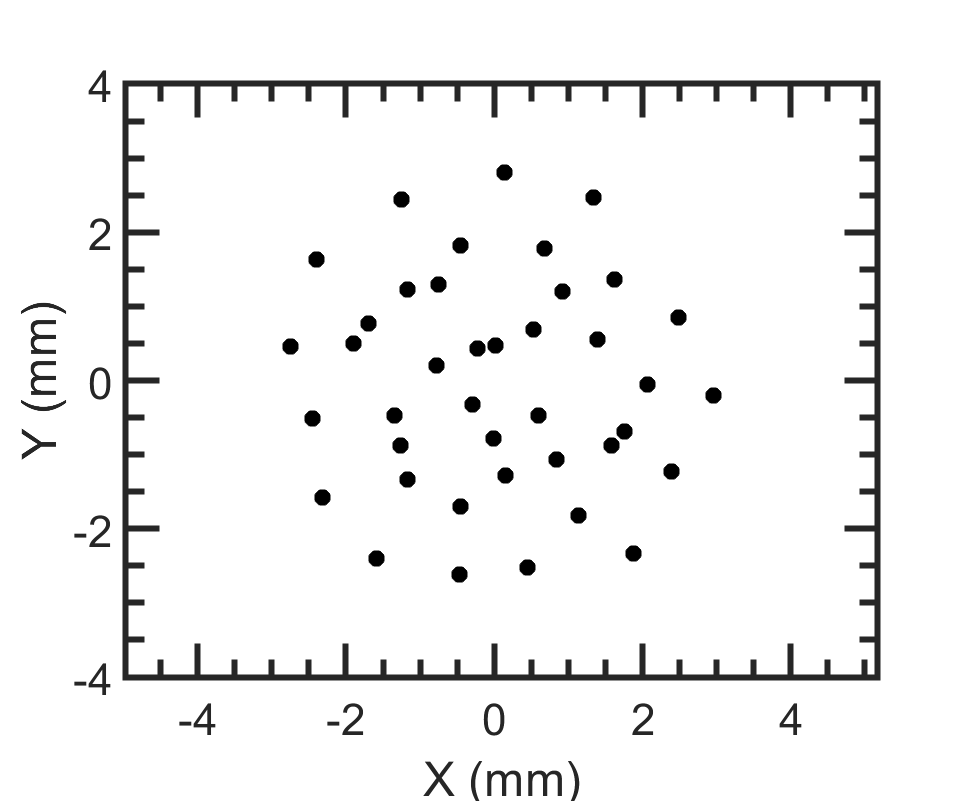
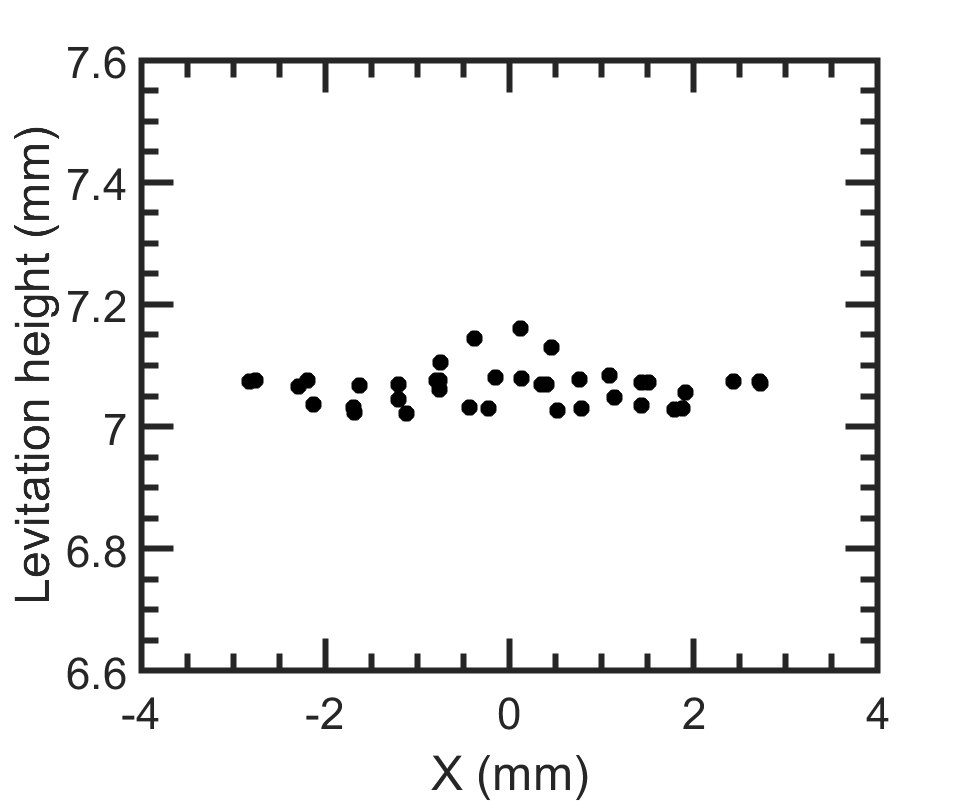
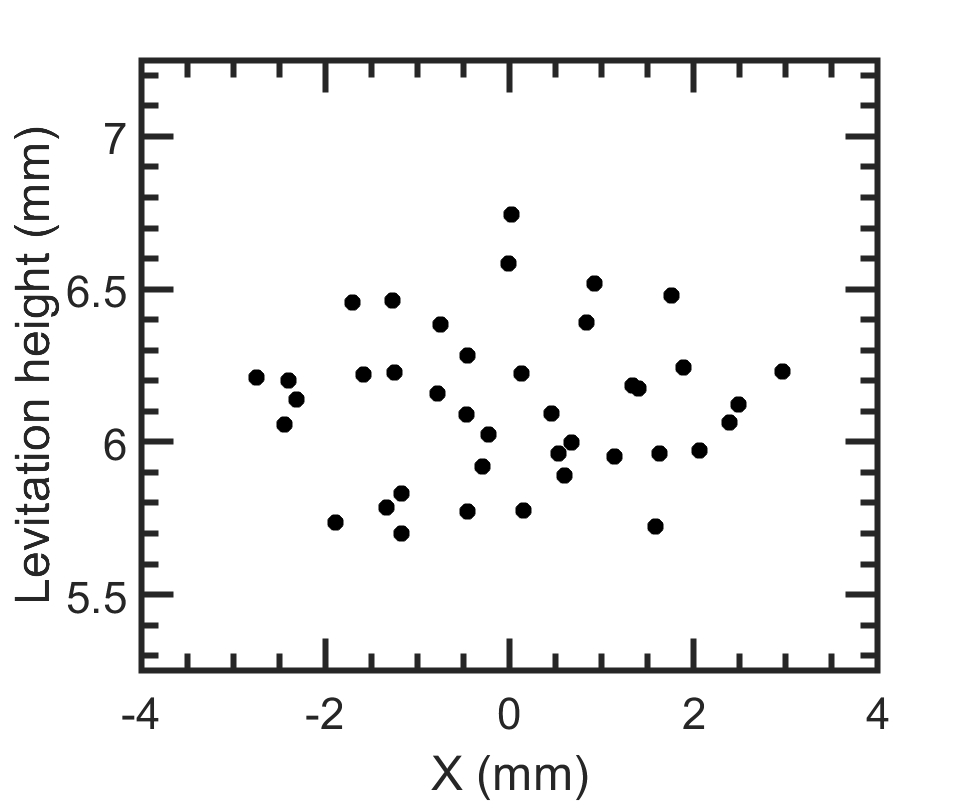
Dust crystals were simulated by releasing 40-100 dust grains in the plasma, sometimes dust grains were pushed far enough from the center that they crossed the electrode cutout and were not incorporated into the crystal. The resulting crystals consisted of a single layer. However, the in-plane arrangement of the dust grains was not always stable, some cases melted and did not form a crystalline structure. Figure 7 shows top and side views of one of the stable crystals as well as one of the melted cases. The stable crystal has a hexagonal structure with each grain having six neighbors, as is typical for a strongly coupled two-dimensional Yukawa system Klumov (2010), the inter-particle distance does not vary substantially across the crystal. The levitation height varies by 0.13 mm across the crystal due to the radial variation in the plasma resulting from the electrode cutout. The levitation height for the grains in the melted case varies by 1.0 mm and the grains move throughout the crystal. Table 2 gives the breakdown of which cases melted. The CEC model was more susceptible to melting than the OML model. For both models, melting was related to both grain size and the RF voltage applied to the plasma, with larger grains and lower voltages being more likely to melt. Since dust grains in the melted cases had a height variation on the order of 1 mm and were in motion, accurately representing the melted cases requires for the 3D dynamics to be treated with a more advance wake model. Therefore, the melted cases are not discussed further considering that this work is focused on the stable crystals.
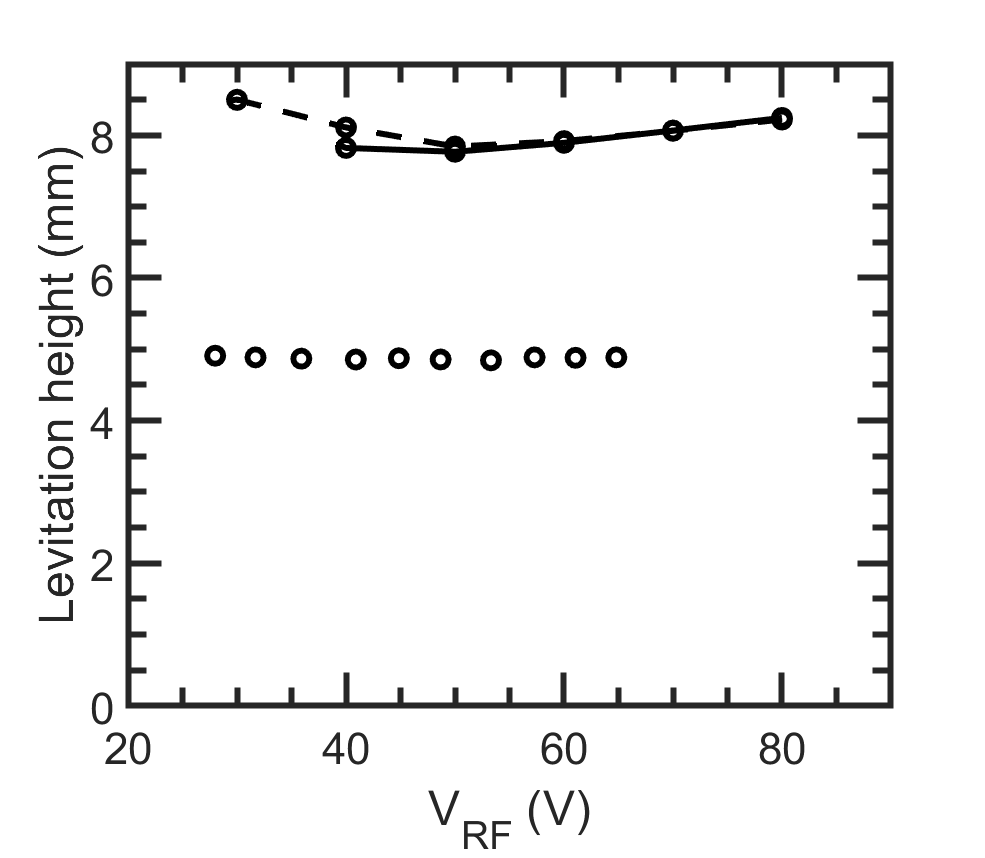
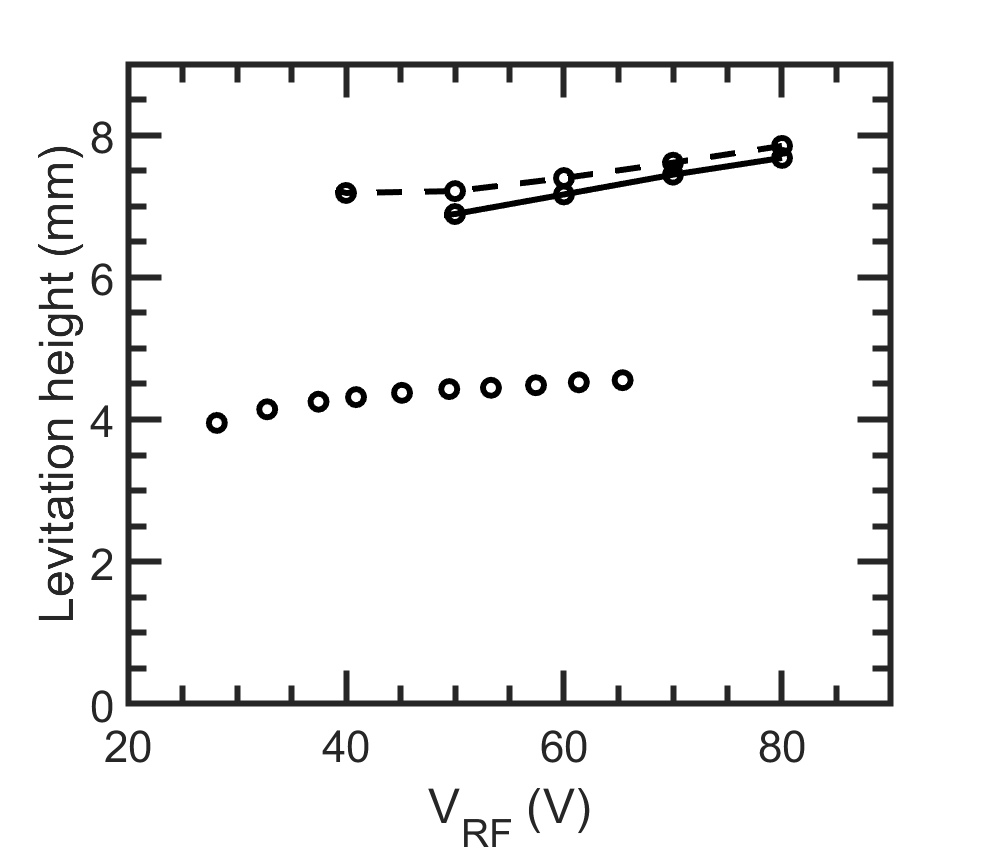
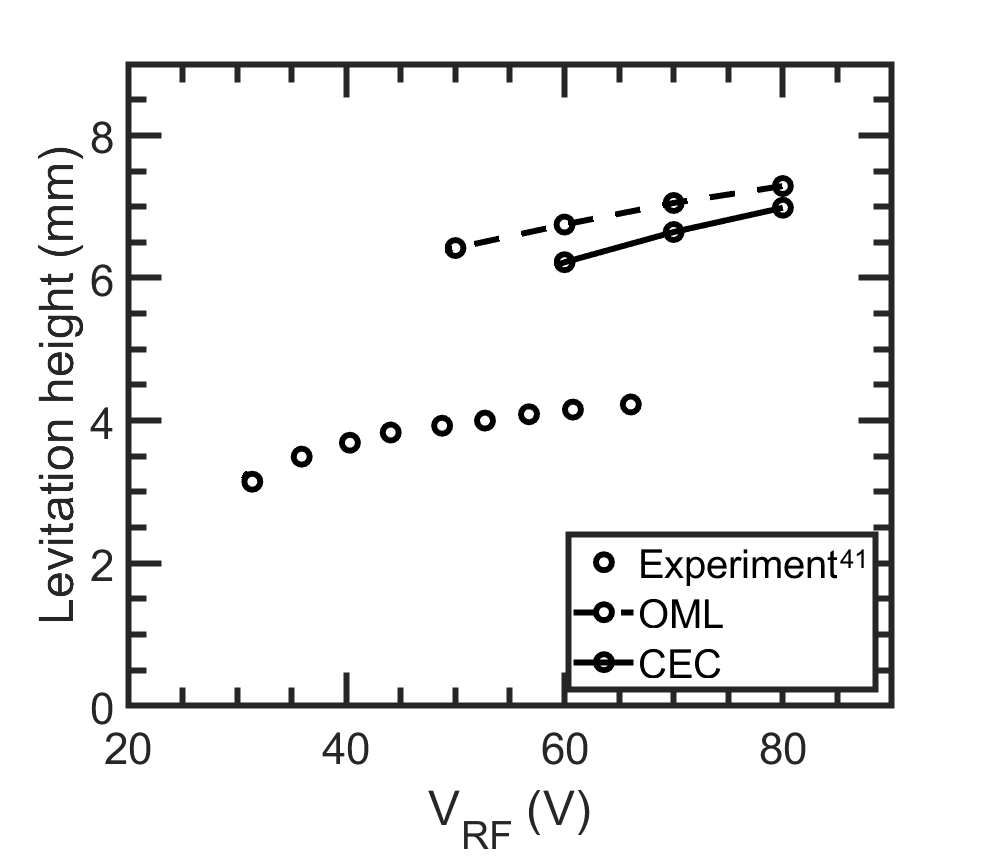
The levitation height of the dust grains above the electrode is shown in Figure 8. The effect of the collision enhanced charging is not substantial with the CEC model producing 0.5 mm lower levitation heights compared to the OML model for the largest grains and having negligible effect on the levitation heights of the smallest grains. Both the OML and CEC models over-predicted the levitation height by around 2mm compared to the experimental results which is consistent with the visual inspection of Figure 4 which indicated the models had a 1-2mm wider sheath than the experiment.
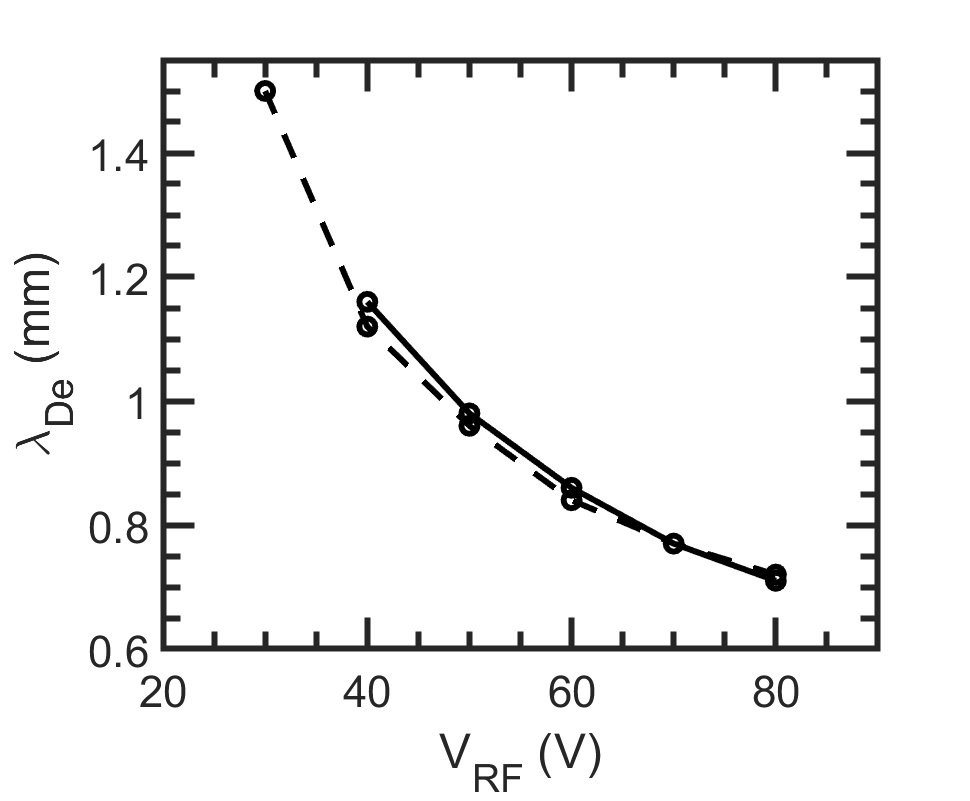
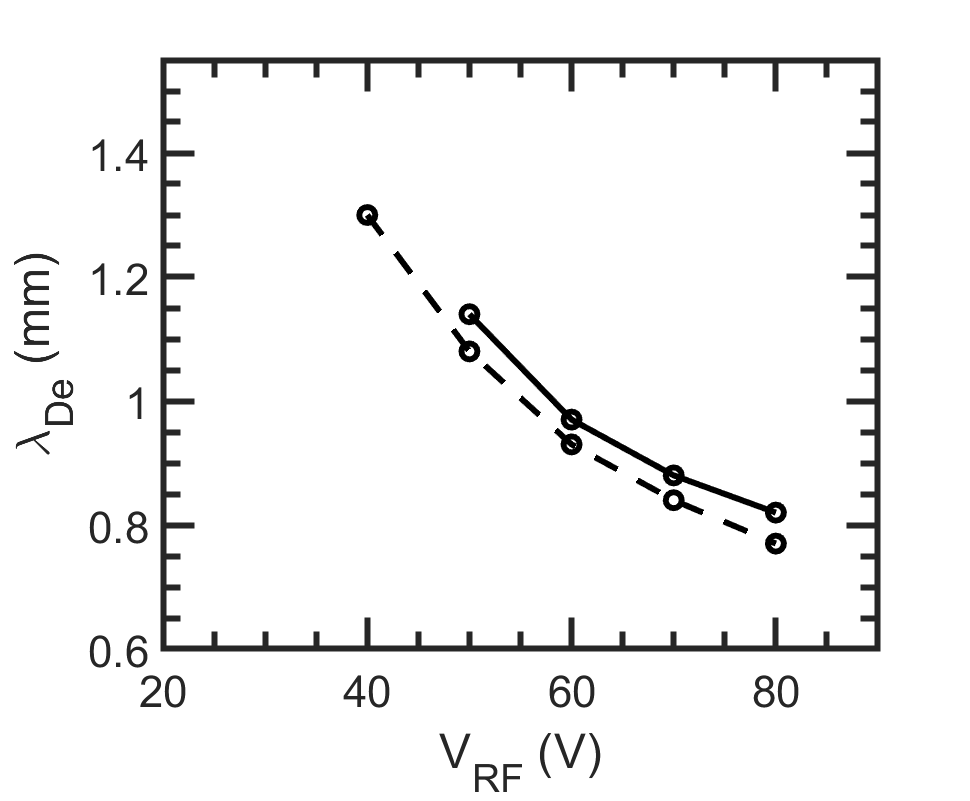
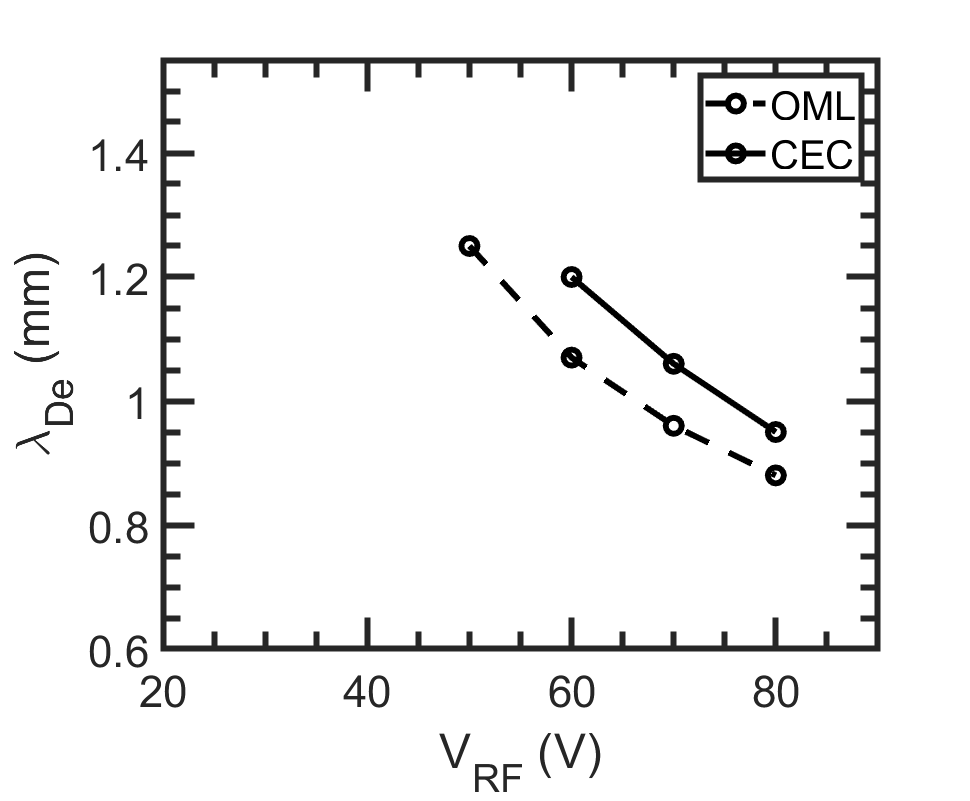
The electron Debye length at the location of the crystals is shown in Figure 9. The CEC model has a higher Debye length because the grains have a lower levitation height. The Debye length is larger than the variation in the levitation height across a stable crystal, by a factor of 5, so the chosen wake model is sufficient to handle the stable crystals in spite of the wake model’s limitations in handling 3D dynamics.
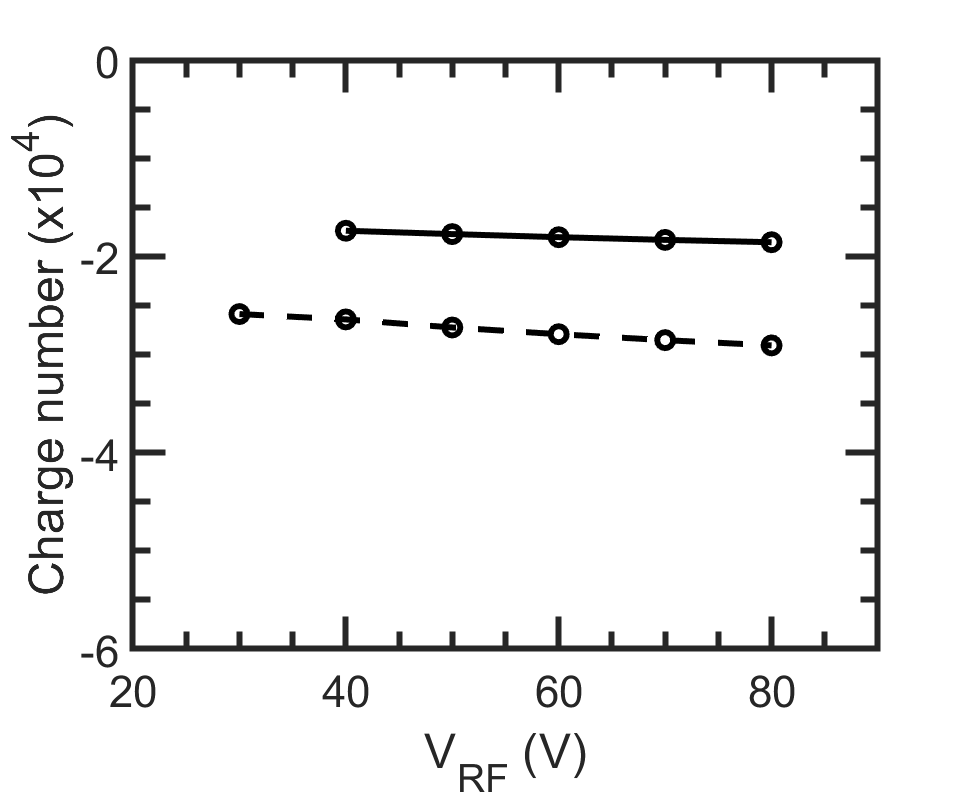
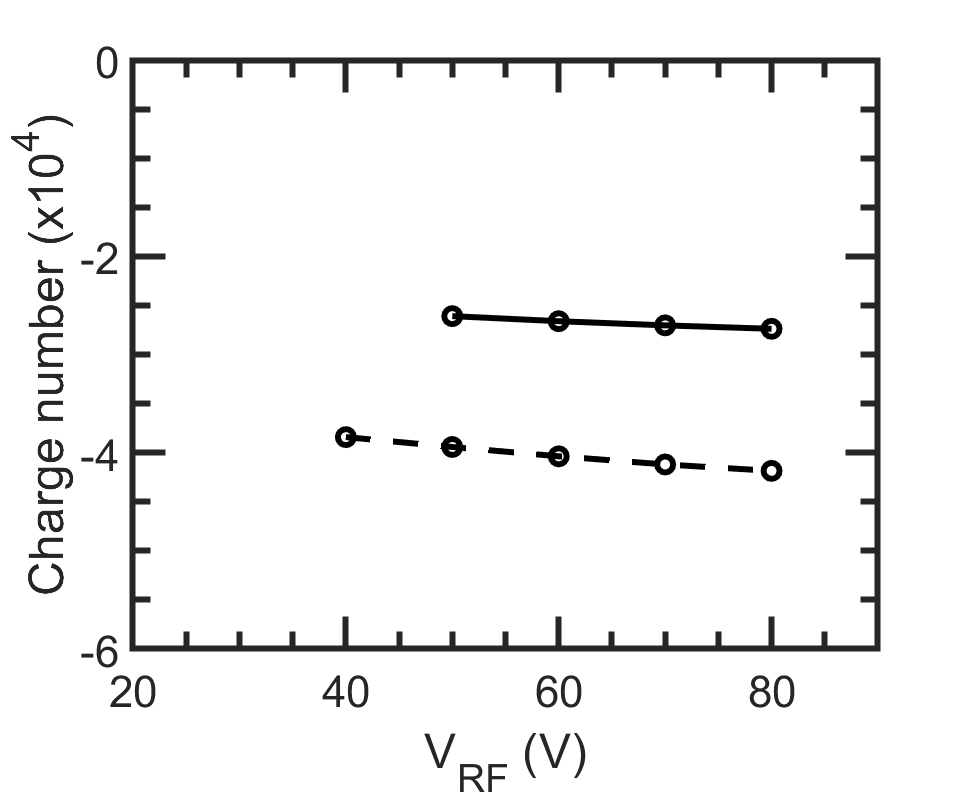
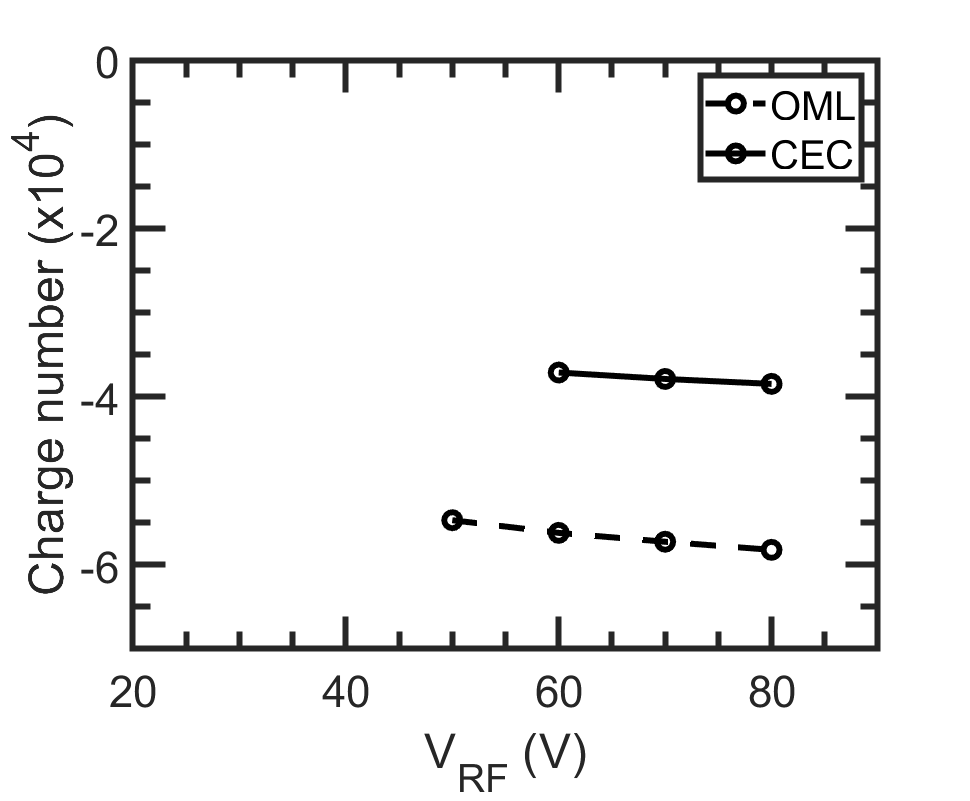
The average charge number of the dust grains is shown in Figure 10. The charge increases as the dust grain radius is increased but is less sensitive to the applied RF voltage. As expected, the OML model produces a higher charge, around 20-30% higher than the CEC model. The lower charge produced by the CEC model will reduce the electric force as well as the ion drag force. The large difference in the charge and small difference in the levitation height indicates that the reduction in the electric force is balanced by the reduction in the ion drag force.
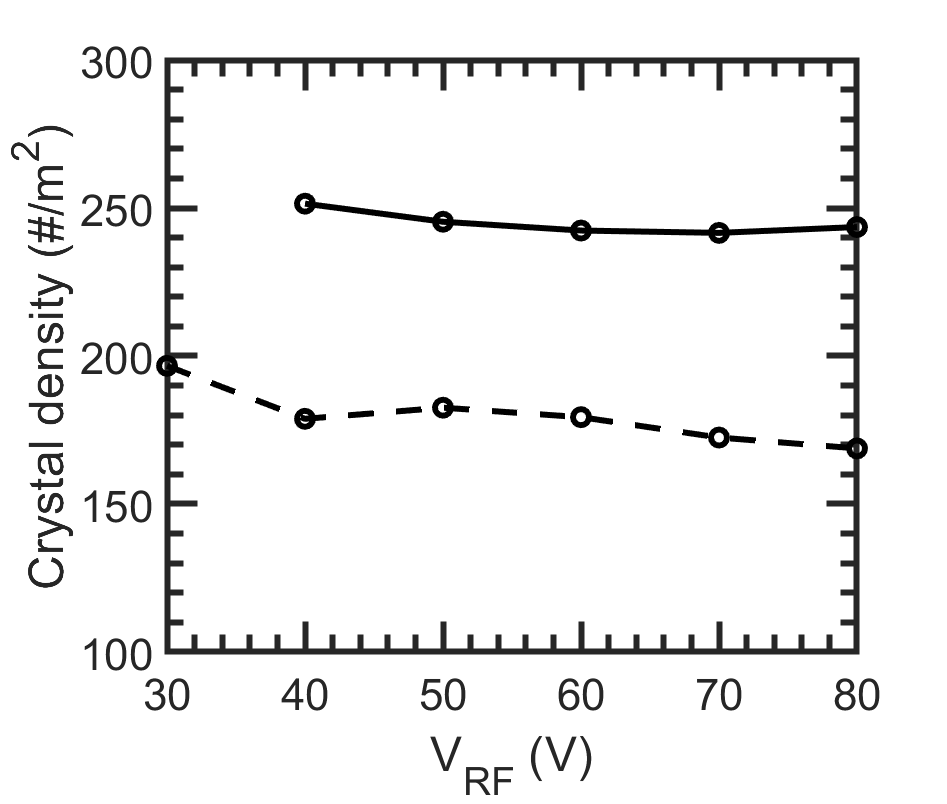
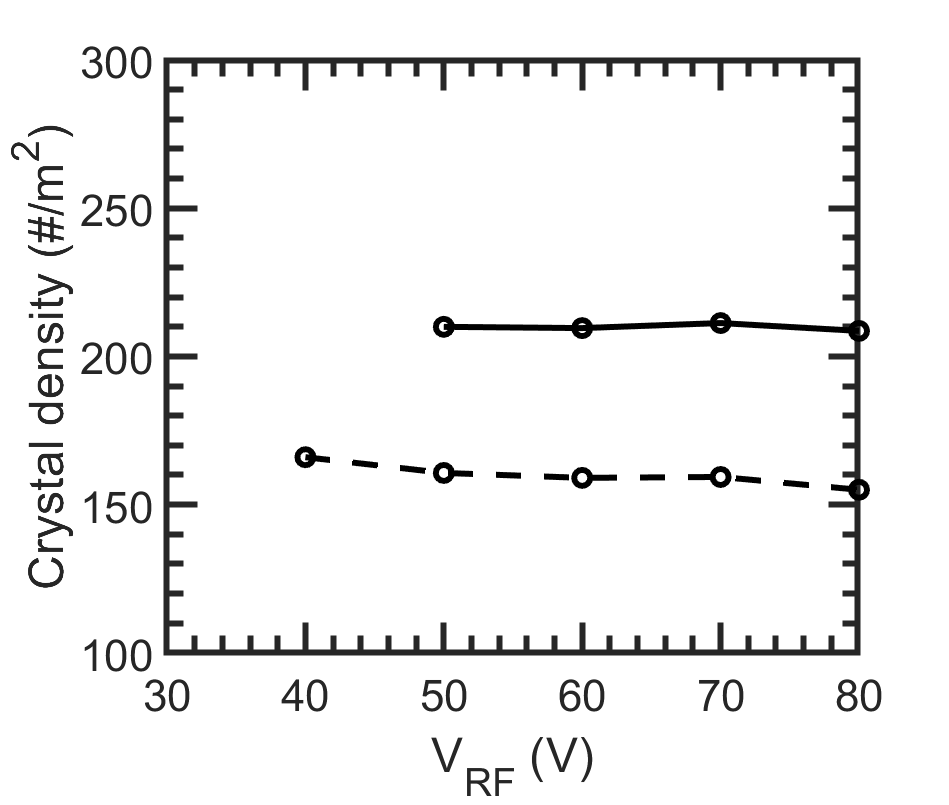
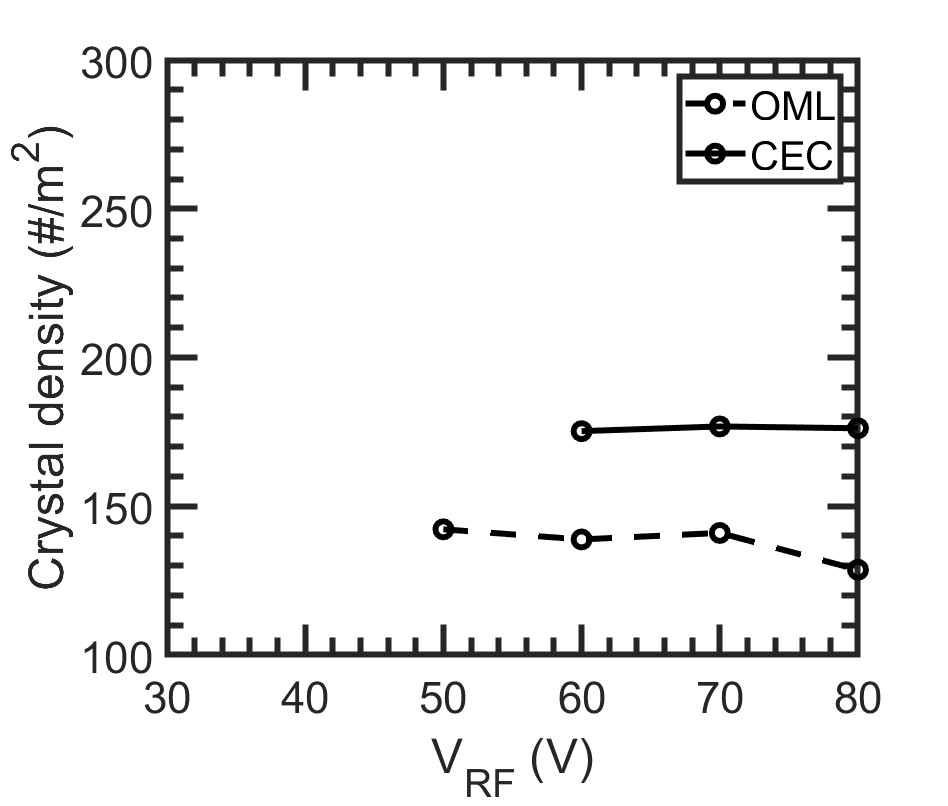
Since the crystals were single layer, the crystal density was defined as the number of dust grains divided by the area of the circle enclosing the crystal. The density of the stable crystals is shown in Figure 11. The density decreased for larger dust grains but did not show a strong dependence on the applied RF voltage due to the fact that the charge was not highly sensitive to the voltage. The CEC model produced a 20-30% higher density than the OML model since the lower charge in the CEC model results in weaker repulsion between the grains.
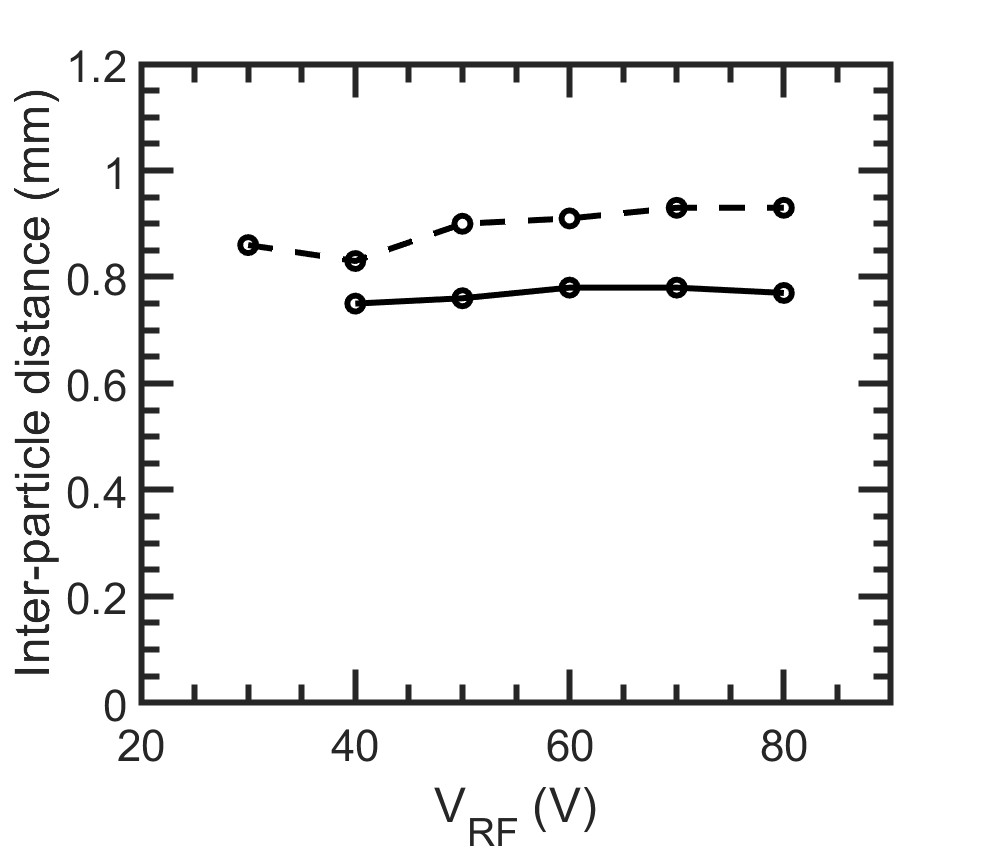
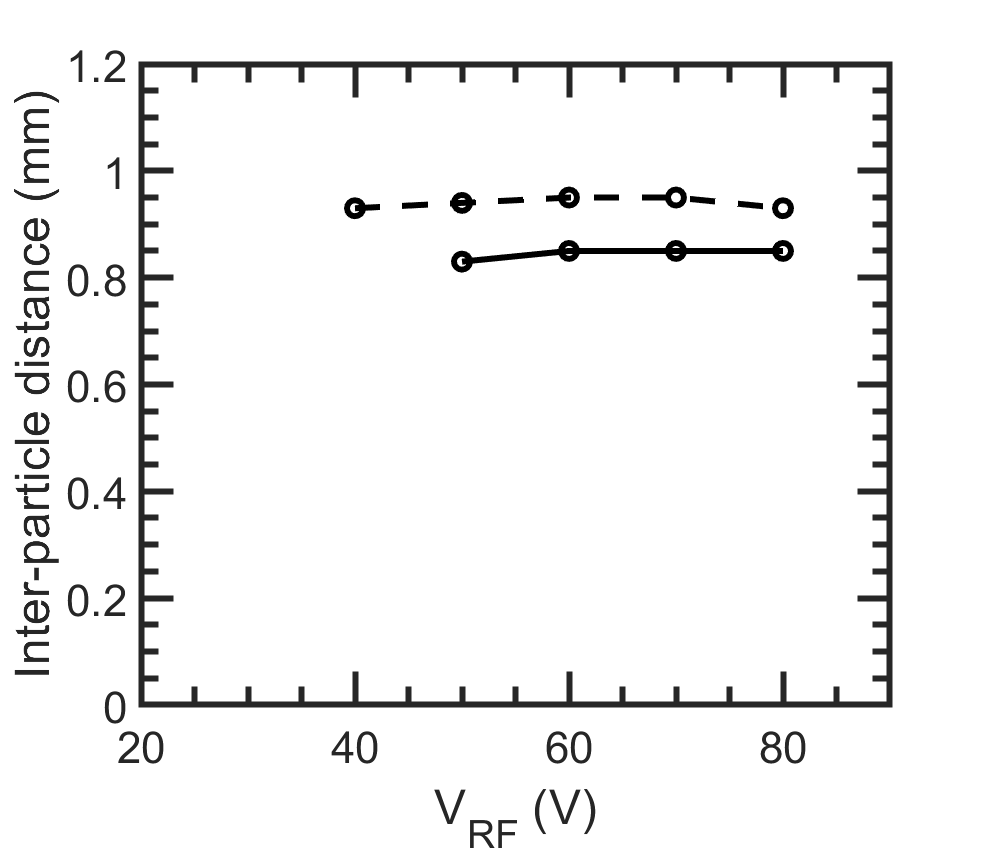
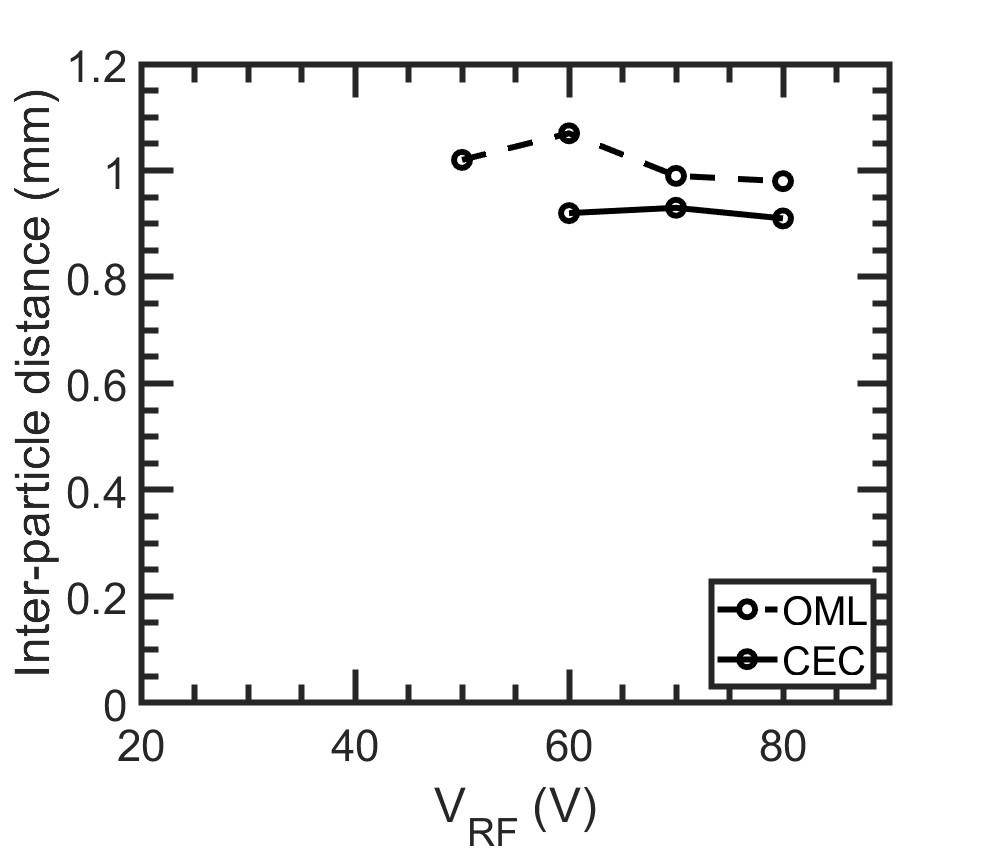
Figure 12 shows the inter-particle distance which is the distance between a grain and its neighbors.It is determined by creating a histogram of the distance between each pair of grains, the first peak occurs at the inter-particle distance. The inter-particle distance does not show a strong dependence on either the applied RF voltage or the dust grain size. Including the collision enhancement to the ion current reduced the inter-particle distance by 10-15%.
V Summary and Conclusions
Monolayer dust crystals were investigated by modeling in a computational configuration resembling the GEC cell of previous experiments with dust particles Douglass et al. (2012). The plasma was modeled using a continuum description and the back way coupling effect of dust on the plasma was neglected due to the low dust loading. Once the plasma had reached quasi-steady state, the plasma values were averaged over one RF cycle and the dust grains were added. The dust was released into the plasma and tracked over time. The time history of the individual grains was examined and the final crystal structure was investigated. Two models for determining the dust grain charge, viz. the OML and CEC models, were implemented and investigated against each other and the data from Douglass et al. (2012). Since the CEC charging model is simplified to the OML charging model at the collisionless limit, the comparison of the results obtained from two models shedded a light on the influence of the collision-enhanced ion current in dust crystals.
Comparing trajectories for a single grain showed that both models had a less pronounced transition point between the bulk and sheath and the transition occurred 1-2mm higher than in the experimental data. The CEC model had a lower dust charge than the OML model due to the increased ion current. The lower charge in the CEC model resulted in lower values for both the electric and ion drag forces. Consequently, the CEC results agreed better with the experimental electric force profile.
An examination of clusters showed that larger grains in low voltage plasmas did not always form crystalline structures, and the CEC model was more likely not to form a crystal. The stable crystals were examined further but the melted cases were not considered further due to the model limitations in dealing with melted crystals. Stable crystals were two-dimensional and had a hexagonal structure, the side view of the crystal showed a small amount of curvature due to the parabolic confining potential created by the electrode cutout. The variation in the levitation height was around 0.1-0.15mm which is substantially smaller than the Debye length, which was on the order of 1mm, so the structure was essentially 2D. The difference between the modeled and previously measured levitation heights remained below 4mm.
While the CEC model produced 20-30% lower charges, the reduction in the ion drag force balanced the reduction in the electric force for most cases so the levitation height was similar for both the CEC and OML models. Both OML and CEC models overpredicted the levitation height compared to the experimental data, which could be a result of the wider sheath observed in the single grain validation study. The levitation height decreased as the voltage was reduced or the dust grain radius was increased. The crystal density decreased as the dust radius increased but did not show a strong dependence on the RF voltage. The inter-particle distance increased by around 0.1 mm as the dust radius increased. The CEC model produced a 10-15% smaller inter-particle distance and 20-30% larger crystal density than the OML model. Both interparticle distance and crystal density were negligibly sensitive to the applied voltage.
Data Availability Statement
The data that support the findings of this study are available from the corresponding author upon reasonable request.
Appendix A Trapping region details
The CEC model accounts for the increased ion current due to charge exchange collisions creating thermal ions. If the potential energy of the ion is below a certain threshold, it will be collected by the dust grain. The potential energy of the ion is defined in a polar coordinate system centered on the dust grain with in the direction of the ion drift. The ion potential energy is given by
| (27) |
where is the dust charge and is the electric field. The trapping criteria is:
| (28) |
where is the saddle point. Piel and Schmidt (2015) approximated the saddle point by setting the electric force equal to the gravitational force which assumes the dust grain has already settled to the correct location. For this study, the mathematical saddle point is used instead since the dust grain is moving.
By applying the definition of the ion potential energy, Eq. (27), the trapping criteria can be expanded as:
| (29) |
This can be simplified by defining , , and , which allows the trapping condition to be written as:
| (30) |
The trapping region is ellipsoidal and described by the major semi-axis, , and minor semi-axis, . Both terms, and , are determined numerically. The trapping region is not centered on the dust grain but is centered downstream of the dust grain due to the ion wake. The major semi-axis occurs along the x-axis, while the minor semi-axis is parallel to, but not along, the -axis.
The major semi-axis, , is half the distance between the maximum and minimum -values, , which are determined from:
| (31) |
and
| (32) |
The minor semi-axis,, is half the distance between the maximum and minimum y-values, which means it is necessary to solve while maximizing . By using Lagrangian multipliers, the angle for is related to by:
| (33) |
and the value for can be obtained from:
| (34) |
Since the trapping region is symmetric about the x-axis, and .
References
- Shukla (2001) P. Shukla, “A survey of dusty plasma physics,” Physics of Plasmas 8, 1791–1803 (2001).
- Goertz (1989) C. Goertz, “Dusty plasmas in the solar system,” Reviews of Geophysics 27, 271–292 (1989).
- Matthews, Land, and Hyde (2011) L. S. Matthews, V. Land, and T. W. Hyde, “Charging and coagulation of dust in protoplanetary plasma environments,” The Astrophysical Journal 744, 8 (2011).
- Selwyn, Heidenreich, and Haller (1990) G. S. Selwyn, J. E. Heidenreich, and K. L. Haller, “Particle trapping phenomena in radio frequency plasmas,” Applied Physics Letters 57, 1876–1878 (1990).
- Cao and Matsoukas (2002) J. Cao and T. Matsoukas, “Deposition kinetics on particles in a dusty plasma reactor,” Journal of Applied Physics 92, 2916–2922 (2002).
- Stoffel et al. (1996) A. Stoffel, A. Kovacs, W. Kronast, and B. Müller, “LPCVD against pecvd for micromechanical applications,” Journal of Micromechanics and Microengineering 6, 1 (1996).
- Meyyappan et al. (2003) M. Meyyappan, L. Delzeit, A. Cassell, and D. Hash, “Carbon nanotube growth by pecvd: a review,” Plasma Sources Science and Technology 12, 205 (2003).
- Ikezi (1986) H. Ikezi, “Coulomb solid of small particles in plasmas,” Physics of Fluids (1958-1988) 29, 1764–1766 (1986).
- Thomas et al. (1994) H. Thomas, G. Morfill, V. Demmel, J. Goree, B. Feuerbacher, and D. Möhlmann, “Plasma crystal: Coulomb crystallization in a dusty plasma,” Physical Review Letters 73, 652 (1994).
- Thomas et al. (2005) H. M. Thomas, G. E. Morfill, A. V. Ivlev, A. P. Nefedov, V. E. Fortov, H. Rothermel, M. Rubin-Zuzic, A. M. Lipaev, V. I. Molotkov, and O. F. Petrov, “Pke-nefedov—complex plasma research on the international space station,” Microgravity-Science and Technology 16, 317–321 (2005).
- Goedheer and Land (2008) W. Goedheer and V. Land, “Simulation of dust voids in complex plasmas,” Plasma Physics and Controlled Fusion 50, 124022 (2008).
- Schwabe et al. (2014) M. Schwabe, S. Zhdanov, C. Räth, D. B. Graves, H. M. Thomas, and G. E. Morfill, “Collective effects in vortex movements in complex plasmas,” Physical Review Letters 112, 115002 (2014).
- Schweigert et al. (1996) V. Schweigert, I. Schweigert, A. Melzer, A. Homann, and A. Piel, “Alignment and instability of dust crystals in plasmas,” Physical Review E 54, 4155 (1996).
- Schweigert et al. (1998) V. Schweigert, I. Schweigert, A. Melzer, A. Homann, and A. Piel, “Plasma crystal melting: a nonequilibrium phase transition,” Physical Review letters 80, 5345 (1998).
- Rubin-Zuzic et al. (2006) M. Rubin-Zuzic, G. Morfill, A. Ivlev, R. Pompl, B. Klumov, W. Bunk, H. Thomas, H. Rothermel, O. Havnes, and A. Fouquet, “Kinetic development of crystallization fronts in complex plasmas,” Nature Physics 2, 181 (2006).
- Klumov (2010) B. A. Klumov, “On melting criteria for complex plasma,” Physics-Uspekhi 53, 1053 (2010).
- Hartmann et al. (2010) P. Hartmann, A. Douglass, J. C. Reyes, L. S. Matthews, T. W. Hyde, A. Kovács, and Z. Donkó, “Crystallization dynamics of a single layer complex plasma,” Physical review letters 105, 115004 (2010).
- Klumov (2019) B. A. Klumov, “On the effect of confinement on the structure of a complex (dusty) plasma,” JETP Letters 110, 715–721 (2019).
- Steinmüller et al. (2018) B. Steinmüller, C. Dietz, M. Kretschmer, and M. H. Thoma, “Crystallization process of a three-dimensional complex plasma,” Physical Review E 97, 053202 (2018).
- Reshetniak and Filippov (2019) V. Reshetniak and A. Filippov, “Properties of yukawa crystals and liquid under phase equilibrium conditions,” Journal of Experimental and Theoretical Physics 129, 459–469 (2019).
- Nosenko, Morfill, and Rosakis (2011) V. Nosenko, G. Morfill, and P. Rosakis, “Direct experimental measurement of the speed-stress relation for dislocations in a plasma crystal,” Physical Review Letters 106, 155002 (2011).
- Schwabe et al. (2007) M. Schwabe, M. Rubin-Zuzic, S. Zhdanov, H. Thomas, and G. Morfill, “Highly resolved self-excited density waves in a complex plasma,” Physical review letters 99, 095002 (2007).
- Barkan, Merlino, and D’angelo (1995) A. Barkan, R. L. Merlino, and N. D’angelo, “Laboratory observation of the dust-acoustic wave mode,” Physics of Plasmas 2, 3563–3565 (1995).
- Merlino et al. (1998) R. Merlino, A. Barkan, C. Thompson, and N. D’angelo, “Laboratory studies of waves and instabilities in dusty plasmas,” Physics of Plasmas 5, 1607–1614 (1998).
- Goedheer, Land, and Venema (2009) W. J. Goedheer, V. Land, and J. Venema, “Hydrodynamic and kinetic modelling of complex radio-frequency plasmas,” Journal of Physics D: Applied Physics 42, 194015 (2009).
- Land et al. (2010) V. Land, L. S. Matthews, T. W. Hyde, and D. Bolser, “Fluid modeling of void closure in microgravity noble gas complex plasmas,” Physical Review E 81, 056402 (2010).
- Allen (1992) J. Allen, “Probe theory-the orbital motion approach,” Physica Scripta 45, 497 (1992).
- Barnes et al. (1992) M. S. Barnes, J. H. Keller, J. C. Forster, J. A. O’Neill, and D. K. Coultas, “Transport of dust particles in glow-discharge plasmas,” Physical Review Letters 68, 313 (1992).
- Douglass et al. (2011) A. Douglass, V. Land, L. Matthews, and T. Hyde, “Dust particle charge in plasma with ion flow and electron depletion near plasma boundaries,” Physics of Plasmas 18, 083706 (2011).
- Khrapak et al. (2005) S. Khrapak, S. V. Ratynskaia, A. Zobnin, A. Usachev, V. Yaroshenko, M. Thoma, M. Kretschmer, H. Höfner, G. Morfill, O. Petrov, et al., “Particle charge in the bulk of gas discharges,” Physical Review E 72, 016406 (2005).
- Piel and Schmidt (2015) A. Piel and C. Schmidt, “Dust charging and charge fluctuations in a weakly collisional radio-frequency sheath at low pressure,” Physics of Plasmas 22, 053701 (2015).
- Schwabe and Graves (2013) M. Schwabe and D. B. Graves, “Simulating the dynamics of complex plasmas,” Physical Review E 88, 023101 (2013).
- Davoudabadi and Mashayek (2007) M. Davoudabadi and F. Mashayek, “Numerical modeling of dust particle configurations in a cylindrical radio-frequency plasma reactor,” Physical Review E 76, 056405 (2007).
- Klumov, Rubin-Zuzic, and Morfill (2007) B. A. Klumov, M. Rubin-Zuzic, and G. Morfill, “Crystallization waves in a dusty plasma,” JETP Letters 84, 542–546 (2007).
- Hartmann et al. (2014) P. Hartmann, A. Z. Kovács, J. C. Reyes, L. S. Matthews, and T. W. Hyde, “Dust as probe for horizontal field distribution in low pressure gas discharges,” Plasma Sources Science and Technology 23, 045008 (2014).
- Boeuf and Pitchford (1995) J. Boeuf and L. Pitchford, “Two-dimensional model of a capacitively coupled rf discharge and comparisons with experiments in the gaseous electronics conference reference reactor,” Physical Review E 51, 1376 (1995).
- Kong et al. (2016) J. Kong, K. Qiao, L. S. Matthews, and T. W. Hyde, “Temperature measurement of a dust particle in a rf plasma gec reference cell,” Journal of Plasma Physics 82, 905820505 (2016).
- Siari et al. (2020) K. Siari, S. Rebiai, H. Bahouh, and F. Bouanaka, “Plasma-enhanced chemical vapor deposition of silicon films at low pressure in gec reference cell,” Plasma Physics Reports 46, 667–674 (2020).
- Land et al. (2009) V. Land, E. Shen, B. Smith, L. Matthews, and T. Hyde, “Experimental and computational characterization of a modified GEC cell for dusty plasma experiments,” New Journal of Physics 11, 063024 (2009).
- Davoudabadi and Mashayek (2006) M. Davoudabadi and F. Mashayek, “Dust particle dynamics in low-pressure plasma reactor,” Journal of Applied Physics 100, 083302 (2006).
- Douglass et al. (2012) A. Douglass, V. Land, K. Qiao, L. Matthews, and T. Hyde, “Determination of the levitation limits of dust particles within the sheath in complex plasma experiments,” Physics of Plasmas 19, 013707 (2012).
- Wilson and Shotorban (2018) A. Wilson and B. Shotorban, “Investigation of surface boundary conditions for continuum modeling of rf plasmas,” Physics of Plasmas 25, 053509 (2018).
- Gogolides and Sawin (1992) E. Gogolides and H. H. Sawin, “Continuum modeling of radio-frequency glow discharges. i. theory and results for electropositive and electronegative gases,” Journal of Applied Physics 72, 3971–3987 (1992).
- Hagelaar and Pitchford (2005) G. Hagelaar and L. Pitchford, “Solving the boltzmann equation to obtain electron transport coefficients and rate coefficients for fluid models,” Plasma Sources Science and Technology 14, 722 (2005).
- Havnes, Aanesen, and Melandsø (1990) O. Havnes, T. K. Aanesen, and F. Melandsø, “On dust charges and plasma potentials in a dusty plasma with dust size distribution,” Journal of Geophysical Research: Space Physics 95, 6581–6585 (1990).
- Passchier and Goedheer (1993) J. Passchier and W. Goedheer, “A two-dimensional fluid model for an argon rf discharge,” Journal of Applied Physics 74, 3744–3751 (1993).
- Davoudabadi, Shrimpton, and Mashayek (2009) M. Davoudabadi, J. S. Shrimpton, and F. Mashayek, “On accuracy and performance of high-order finite volume methods in local mean energy model of non-thermal plasmas,” Journal of Computational Physics 228, 2468–2479 (2009).
- Phelps (1991) A. Phelps, “The resonant charge exchange cross section of ,” J. Phys. Chem. Ref. Data 20, 557–573 (1991).
- Hutchinson (2006) I. Hutchinson, “Collisionless ion drag force on a spherical grain,” Plasma physics and controlled fusion 48, 185 (2006).
- Nitter (1996) T. Nitter, “Levitation of dust in rf and dc glow discharges,” Plasma Sources Science and Technology 5, 93 (1996).
- Kompaneets, Morfill, and Ivlev (2016) R. Kompaneets, G. E. Morfill, and A. V. Ivlev, “Wakes in complex plasmas: A self-consistent kinetic theory,” Physical Review E 93, 063201 (2016).
- Qiao, Matthews, and Hyde (2010) K. Qiao, L. S. Matthews, and T. W. Hyde, “Vibrational modes and instabilities of a dust-particle pair in a complex plasma,” IEEE Transactions on Plasma Science 38, 826–832 (2010).
- Samarian, Vladimirov, and James (2005) A. Samarian, S. Vladimirov, and B. James, “Dust particle alignments and confinement in a radio frequency sheath,” Physics of Plasmas 12, 022103 (2005).
- Konopka, Morfill, and Ratke (2000) U. Konopka, G. Morfill, and L. Ratke, “Measurement of the interaction potential of microspheres in the sheath of a rf discharge,” Physical Review Letters 84, 891 (2000).
- Fortov et al. (2005) V. Fortov, A. Ivlev, S. Khrapak, A. Khrapak, and G. Morfill, “Complex (dusty) plasmas: Current status, open issues, perspectives,” Physics Reports 421, 1–103 (2005).
- Carstensen, Greiner, and Piel (2010) J. Carstensen, F. Greiner, and A. Piel, “Determination of dust grain charge and screening lengths in the plasma sheath by means of a controlled cluster rotation,” Physics of Plasmas 17, 083703 (2010).
- Kompaneets et al. (2007) R. Kompaneets, U. Konopka, A. Ivlev, V. Tsytovich, and G. Morfill, “Potential around a charged dust particle in a collisional sheath,” Physics of plasmas 14, 052108 (2007).
- Laframboise (1966) J. G. Laframboise, “Theory of spherical and cylindrical langmuir probes in a collisionless, maxwellian plasma at rest,” Tech. Rep. (TORONTO UNIV DOWNSVIEW (ONTARIO) INST FOR AEROSPACE STUDIES, 1966).
- Scharfetter and Gummel (1969) D. L. Scharfetter and H. K. Gummel, “Large-signal analysis of a silicon read diode oscillator,” IEEE Transactions on Electron Devices 16, 64–77 (1969).
- Boeuf (1987) J.-P. Boeuf, “Numerical model of rf glow discharges,” Physical Review A 36, 2782 (1987).
- Hagelaar and Kroesen (2000) G. Hagelaar and G. Kroesen, “Speeding up fluid models for gas discharges by implicit treatment of the electron energy source term,” Journal of Computational Physics 159, 1–12 (2000).
| Parameter | Value |
|---|---|
| Applied RF voltage, | 30-80 V |
| DC bias voltage, | -5 V |
| Frequency, | 13.56 MHz |
| Neutral gas pressure, | 20 Pa |
| Ion and neutral temperature, | 300 K |
| Electron mobility | 4103 |
| Electron diffusion | 1.6104 |
| Ion mobility | 1.86101 |
| Ion diffusion | 5.3310-1 |
| OML | CEC | |||||
|---|---|---|---|---|---|---|
| 6.37 | 8.89 | 11.93 | 6.37 | 8.89 | 11.93 | |
| 30V | Melted | Melted | Melted | Melted | Melted | |
| 40V | Melted | Melted | Melted | |||
| 50V | Melted | |||||
| 60V | ||||||
| 70V | ||||||
| 80V | ||||||