Predicting Covid-19 EMS Incidents from Daily Hospitalization Trends
Abstract
Introduction: The aim of our retrospective study was to quantify the impact of Covid-19 on the temporal distribution of Emergency Medical Services (EMS) demand in Travis County, Austin, Texas, and propose a robust model to forecast Covid-19 EMS incidents.
Methods: We analyzed the temporal distribution of EMS calls in the Austin-Travis County area between January 1st, 2019, and December 31st, 2020. Change point detection was performed to identify critical dates marking changes in EMS call distributions, and time series regression was applied for forecasting Covid-19 EMS incidents.
Results: Two critical dates marked the impact of Covid-19 on the distribution of EMS calls: March 17th, when the daily number of non-pandemic EMS incidents dropped significantly, and May 13th, by which the daily number of EMS calls climbed back to 75% of the number in pre-Covid-19 time. The new daily count of the hospitalization of Covid-19 patients alone proves a powerful predictor of the number of pandemic EMS calls, with an value equal to 0.85. In particular, for every 2.5 cases where EMS takes a Covid-19 patient to a hospital, one person is admitted.
Conclusion: The mean daily number of non-pandemic EMS demand was significantly less than the period before Covid-19 pandemic. The number of EMS calls for Covid-19 symptoms can be predicted from the daily new hospitalization of Covid-19 patients. These findings may be of interest to EMS departments as they plan for future pandemics, including the ability to predict pandemic-related calls in an effort to adjust a targeted response.
keywords:
Emergency Medical Services , Pandemics, Covid-191 Introduction
The ongoing outbreak of the coronavirus disease 2019 (Covid-19) has caused overwhelming disruptions to healthcare systems around the globe (1, 2, 3, 4), especially the emergency medical services (EMS). Researchers have conducted extensive studies on different aspects of the EMS since the outbreak of Covid-19, including the temporal distribution of EMS demand and emergency department visits (5, 6, 7, 8, 9, 10, 11, 12, 13, 14, 15, 16, 17), pre-hospital patient assessment (18, 19), medical resource availability and allocation (20, 21, 22, 23), personnel protective equipment (24, 25, 26), EMS response practices and strategies (27, 28, 29, 14) and ethical considerations (30, 31).
Globally, the EMS utilization rates varied during the early stage of the Covid-19 outbreak. The number of EMS calls increased in some parts of Europe (France (32), Ankara, Turkey (12), Copenhagen, Denmark (14)) and Saudi Arabia (11). However, other observational studies suggested a significant decrease in the number of EMS calls across the United States (5, 7, 8, 33), Canada (34), and other parts of Europe (Italy (9, 35), England (10), Finland (36)). Nonetheless, there is very limited information available after the beginning of summer 2020, when states began to lift travel restrictions, and people became better informed of the nature of the virus.
There is a long history of forecasting that has explored many factors to model EMS demand. The study of forecasting models dates back to the 1970s (37, 38). Earlier studies in cities across the United States incorporated socio-demographic and socioeconomic variables to forecast daily demand (38, 39, 40, 41). Other studies also found that weather factors and seasonality (season, day of the week, and holidays) could also be used to predict the daily ambulance demand (42, 43, 44, 45).
Nevertheless, these EMS models were developed under normal conditions. It is unclear whether they are able to adapt to large-scale disasters such as the Covid-19 pandemic. Studies in the 2016 Melbourne thunderstorm asthma epidemic (46) discovered a positive correlation between thunderstorm asthma cases and increased EMS demand. To our best knowledge, no models specifically targeting Covid-19 related EMS demand have been proposed. However, earlier studies in France (47, 48) and Israel (49) hinted correlations between Covid-19 case hospitalization and Covid-19 EMS demand.
The objective of this study is twofold. First, we seek to examine the long-term impact of Covid-19 on the temporal distribution of emergency calls and the average response time of ambulance assignment, dispatch and arrival. Second, we seek to design a predictive model to forecast the daily number of Covid-19 pandemic EMS calls.
2 Methods
2.1 Data Description
Our retrospective study is based on two datasets from the City of Austin Open Data Portal. The first dataset contains all records of EMS incidents in Austin Travis County from January 1st, 2019 to December 31st, 2020 (50). These EMS incident records do not contain any identifiable information. For each incident, this dataset included its problem type, call disposition, priority number, and the date of the incident. Additionally, it included EMS response times, such as the time elapsed, in minutes, to assign the call, dispatch the ambulance, and for the ambulance to arrive. For a comprehensive list of descriptions of the dataset, see Table 1. This data is collected by the 911 call taker and the ambulance crew. As the caller is interrogated using the Medical Priority Dispatch System (MPDS) protocol (51), the data is entered into the Computer Aided Dispatch (CAD) software. Once enough information is gathered to generate a unique call, the data is transferred into a Microsoft SQL Server database. The data appears on the Mobile Data Center (MDC) in the ambulance showing the address and nature of the emergency. The ambulance crew then acknowledges receipt of the call and travels en route to the emergency. From this point onward, the ambulance crew enters the information into the MDC. The timestamps gathered by the ambulance crew are the time elapsed, in minutes, to assign the call, dispatch the ambulance, and for the ambulance to arrive.
Please note that in our study, we define incidents of priority number 1 or 2 as high-priority incidents. These incidents are of very high acuity and require a very fast response. Examples include cardiac arrest, severe bleeding, and unconsciousness. For a detailed description of the level of risk corresponding to each priority number, please see Table 3.
The second dataset consists of the daily frequencies of all incidents from January 1st, 2019 to December 31st, 2020 (52).This aggregated dataset distinguishes Covid-19 pandemic incidents from incidents of other problem types, as well as the defunct incidents from incidents of other types of call dispositions. The 911 call taker interrogated the caller on breathing difficulty, level of alertness, vomiting, chest pain, chills and sweats, and then, via the MPDS protocol, the call taker decided whether an incident was classified as a Covid-19 pandemic incident. Defunct calls are defined as the EMS incidents where neither the call was from another government agency, nor did the ambulance transport the patient to a hospital. For a complete list of descriptions of the subcategories of defunct calls, see Table 4. The Covid-19 hospitalization data consists of the daily count of the hospital admission of Covid-19 patients in the Austin-Round Rock metropolitan statistical area. This hospitalization data was requested from the University of Texas Covid-19 Modeling Consortium (53). For a comprehensive list of descriptions of each series of daily frequencies in the dataset, see Table 2.
| Raw names | Names | Description |
|---|---|---|
| Problem | Problem Type | The problem type of the emergency. |
| Priority_Number | Priority Number | The acuity of the emergency. A indicates highest priority and a would indicate least priority. |
| Time_PhonePickUp_Date | Date | The date of the EMS call. |
| Time_First_Unit_Assigned | Assignment Time | The length of time, in minutes, after the EMS call was picked up and before the first ambulance received notification of the emergency and was assigned. |
| Time_First_Unit_Enroute | Dispatch Time | The length of time, in minutes, after the first ambulance was assigned and before the ambulance set off toward the emergency. |
| Time_First_Unit_Arrived | Arrival Time | The length of time, in minutes, after the first ambulance wheels began to roll and before the ambulance arrived at the emergency and the wheels stopped. |
| Call_Disposition | Call Disposition | The final disposition of the event, such as cancelled call, transported to hospital, etc. If the ambulance transported the patient to a hospital, the name of the hospital would be specified. If the emergency call was from another government agency, for example, the Austin Fire Department, then the call disposition would be labelled as ”referred”. Other types of call dispositions fall into the category of ”defunct calls”, whose subcategories are defined in Table 4; in this case, the call disposition of an incident would be labelled as its respective subcategory. |
| Raw names | Names | Description |
|---|---|---|
| total_ts | Total | The daily frequency of all EMS incidents. |
| defunct_calls_pandemic_removed_ts | Non-pandemic Defunct | The daily frequency of non-pandemic defunct EMS incidents. |
| Pandemic_defunct_calls_ts | Pandemic Defunct | The daily frequency of pandemic defunct EMS incidents. |
| Incidents_pandemic_removed_ts | Non-pandemic Effect | The daily frequency of non-pandemic, non-defunct EMS incidents. |
| Pandemic_effect_ts | Pandemic Effect | The daily frequency of pandemic, non-defunct EMS incidents. |
| hospitalisation_ts | Hospitalization | The daily frequency of the newly admitted Covid-19 patients to hospitals in the Austin-Round Rock metropolitan statistical area. |
| Priority | Priority Number | Description |
|---|---|---|
| High-priority | 1 | An imminent emergency requiring a very fast response. For example, it can be a person having a cardiac arrest and not breathing, or a person bleeding profusely. |
| High-priority | 2 | Incidents also of very high acuity. For example, it can be a person having a cardiac arrest but still breathing, or a person falling off a roof, but breathing and conscious. |
| Mid-priority | 3 | Incidents such as a car accident with low level injuries. The patient is breathing, conscious and alert. |
| Mid-priority | 4 | Incidents of a lower level such as a patient who is conscious and stable but still needs transport. For example, it can be a patient who steps on glass and is bleeding, but not profusely and the patient is not in imminent danger. |
| Low-priority | 5 | Incidents which could be responded to without lights and sirens. For example, it can be a stubbed toe or a very low level injury. |
| Low-priority | 6 to 15 | Incidents of very low priority. |

| Call Disposition | Description |
|---|---|
| Refusal | A refusal means the situation when the ambulance arrives on scene and speaks with the patient, the patient refuses medical help. |
| No Patient | The ambulance responds to the address provided but does not find a patient. |
| Other | Call disposition is unspecified. |
| Call Cancelled | |
| Duplicate Call | |
| False Alarm Call | |
| Information Call Only |
2.2 Statistical Analysis
The statistical analysis was performed using R statistical computing and graphics environment. The R code is available on GitHub.333https://github.com/Xieyangxinyu/AustinEMS2020) To evaluate the impact of Covid-19 on non-pandemic incidents, we applied change point detection from the R software package ”changepoint.np”. We identified changes in mean, and variance (the function ”cpt.meanvar”) with binary segmentation method (54) and Bayesian information criterion (BIC) penalty assuming underlying normal distribution. To restrict our attention to the impact of the pandemic only, we chose the maximal number of change points as 2.
After identifying the change point dates, Student’s t-tests were applied to make various comparisons between the first period (pre-pandemic) and the third period (post-pandemic). To identify which of the 22 major problems (see figure 5 for a complete list) were impacted by the outbreak of Covid-19 pandemic, we use Student’s t-test with Bonferroni correction to compare the mean number of daily calls for each problem type between the first period and the third period. In other words, we set the significance cut-off at . Another comparison of the mean time of EMS responses (assignment, dispatch and arrival) was made using one-sided Student’s t-test.
To predict the daily frequency of pandemic EMS incidents, time series regression with change point detection was applied in the modeling process. The regressor is the daily frequency of the Covid-19 hospitalization (the ”Hospitalization” time series in Table 2). First, we identified multiple change points in the daily Covid-19 hospitalization data. Specifically, we applied exact change point detection, the pruned exact linear time (PELT, (55)) method, on variance with modified Bayesian information criterion (MBIC) penalty assuming underlying normal distribution. Second, to reduce noise and thus improve the predictive power of our model, we smoothed the time series of daily Covid-19 hospitalization by an average of a period of 7 days. Smoothing the daily hospitalization is reasonable because in practical settings epidemiological models commonly output hospitalization forecasts as ”expected values,” which would then be fed into our model as inputs. Next, we parsed the daily hospitalization data into different periods in accordance with detected change point dates by adding dummy variables. Lastly, after splitting the training (80%) and testing set (20%), we applied exhaustive (non-stepwise) selection of autoregressive integrated moving average (ARIMA) models and binomial thinning (56). The function used was ”auto.arima” from the R software package ”forecast.” To evaluate the robustness of our model, we estimated the value using smoothed daily pandemic EMS incident data to remove unnecessary random noise. To evaluate the predictive power of our model, we estimated the mean squared error and standard error of prediction residual using the original daily pandemic EMS incident data.
3 Results
This section consists of three major parts. The first subsection includes the descriptive statistics concerning the big picture of the EMS in Austin. During the 2019 to 2020 period, the total number of EMS calls was 246,809, with the six major hospitals covering 47% of all EMS incidents. Moreover, the average time it took for a dispatched ambulance to arrive on the scene was 7.14 minutes.
The second subsection identifies two critical dates, March 17th and May 13th, indicating the change in mean and variance of the temporal distribution of non-pandemic EMS calls. (Unless otherwise specified, in the result section, we use non-pandemic EMS calls to refer to non-pandemic effect EMS calls and pandemic EMS calls to refer to pandemic effect EMS calls.) To further investigate the lasting impact of the outbreak of Covid-19, we separated the timeline into three periods: period one, from January 1st, 2019 to March 17th, 2020 with , represents the pre-pandemic norm; period two, from March 18th to May 12th in 2020, represents the sudden outbreak of Covid-19 in Austin; and period three, after May 13th in 2020, represents the new normal. Comparing period one and three, we found that the average daily number of non-pandemic EMS incidents dropped, and the average EMS response time became slower.
In the third subsection, we propose a time series regression model predicting the daily frequency of pandemic EMS incidents. The regressor, the daily frequency of the Covid-19 hospitalization, is parsed into four stages since March 2020. The regression model obtained an value equal to and indicated that for every 2.5 cases where EMS took a Covid-19 patient to a hospital, one person was admitted.
3.1 Overall Statistics
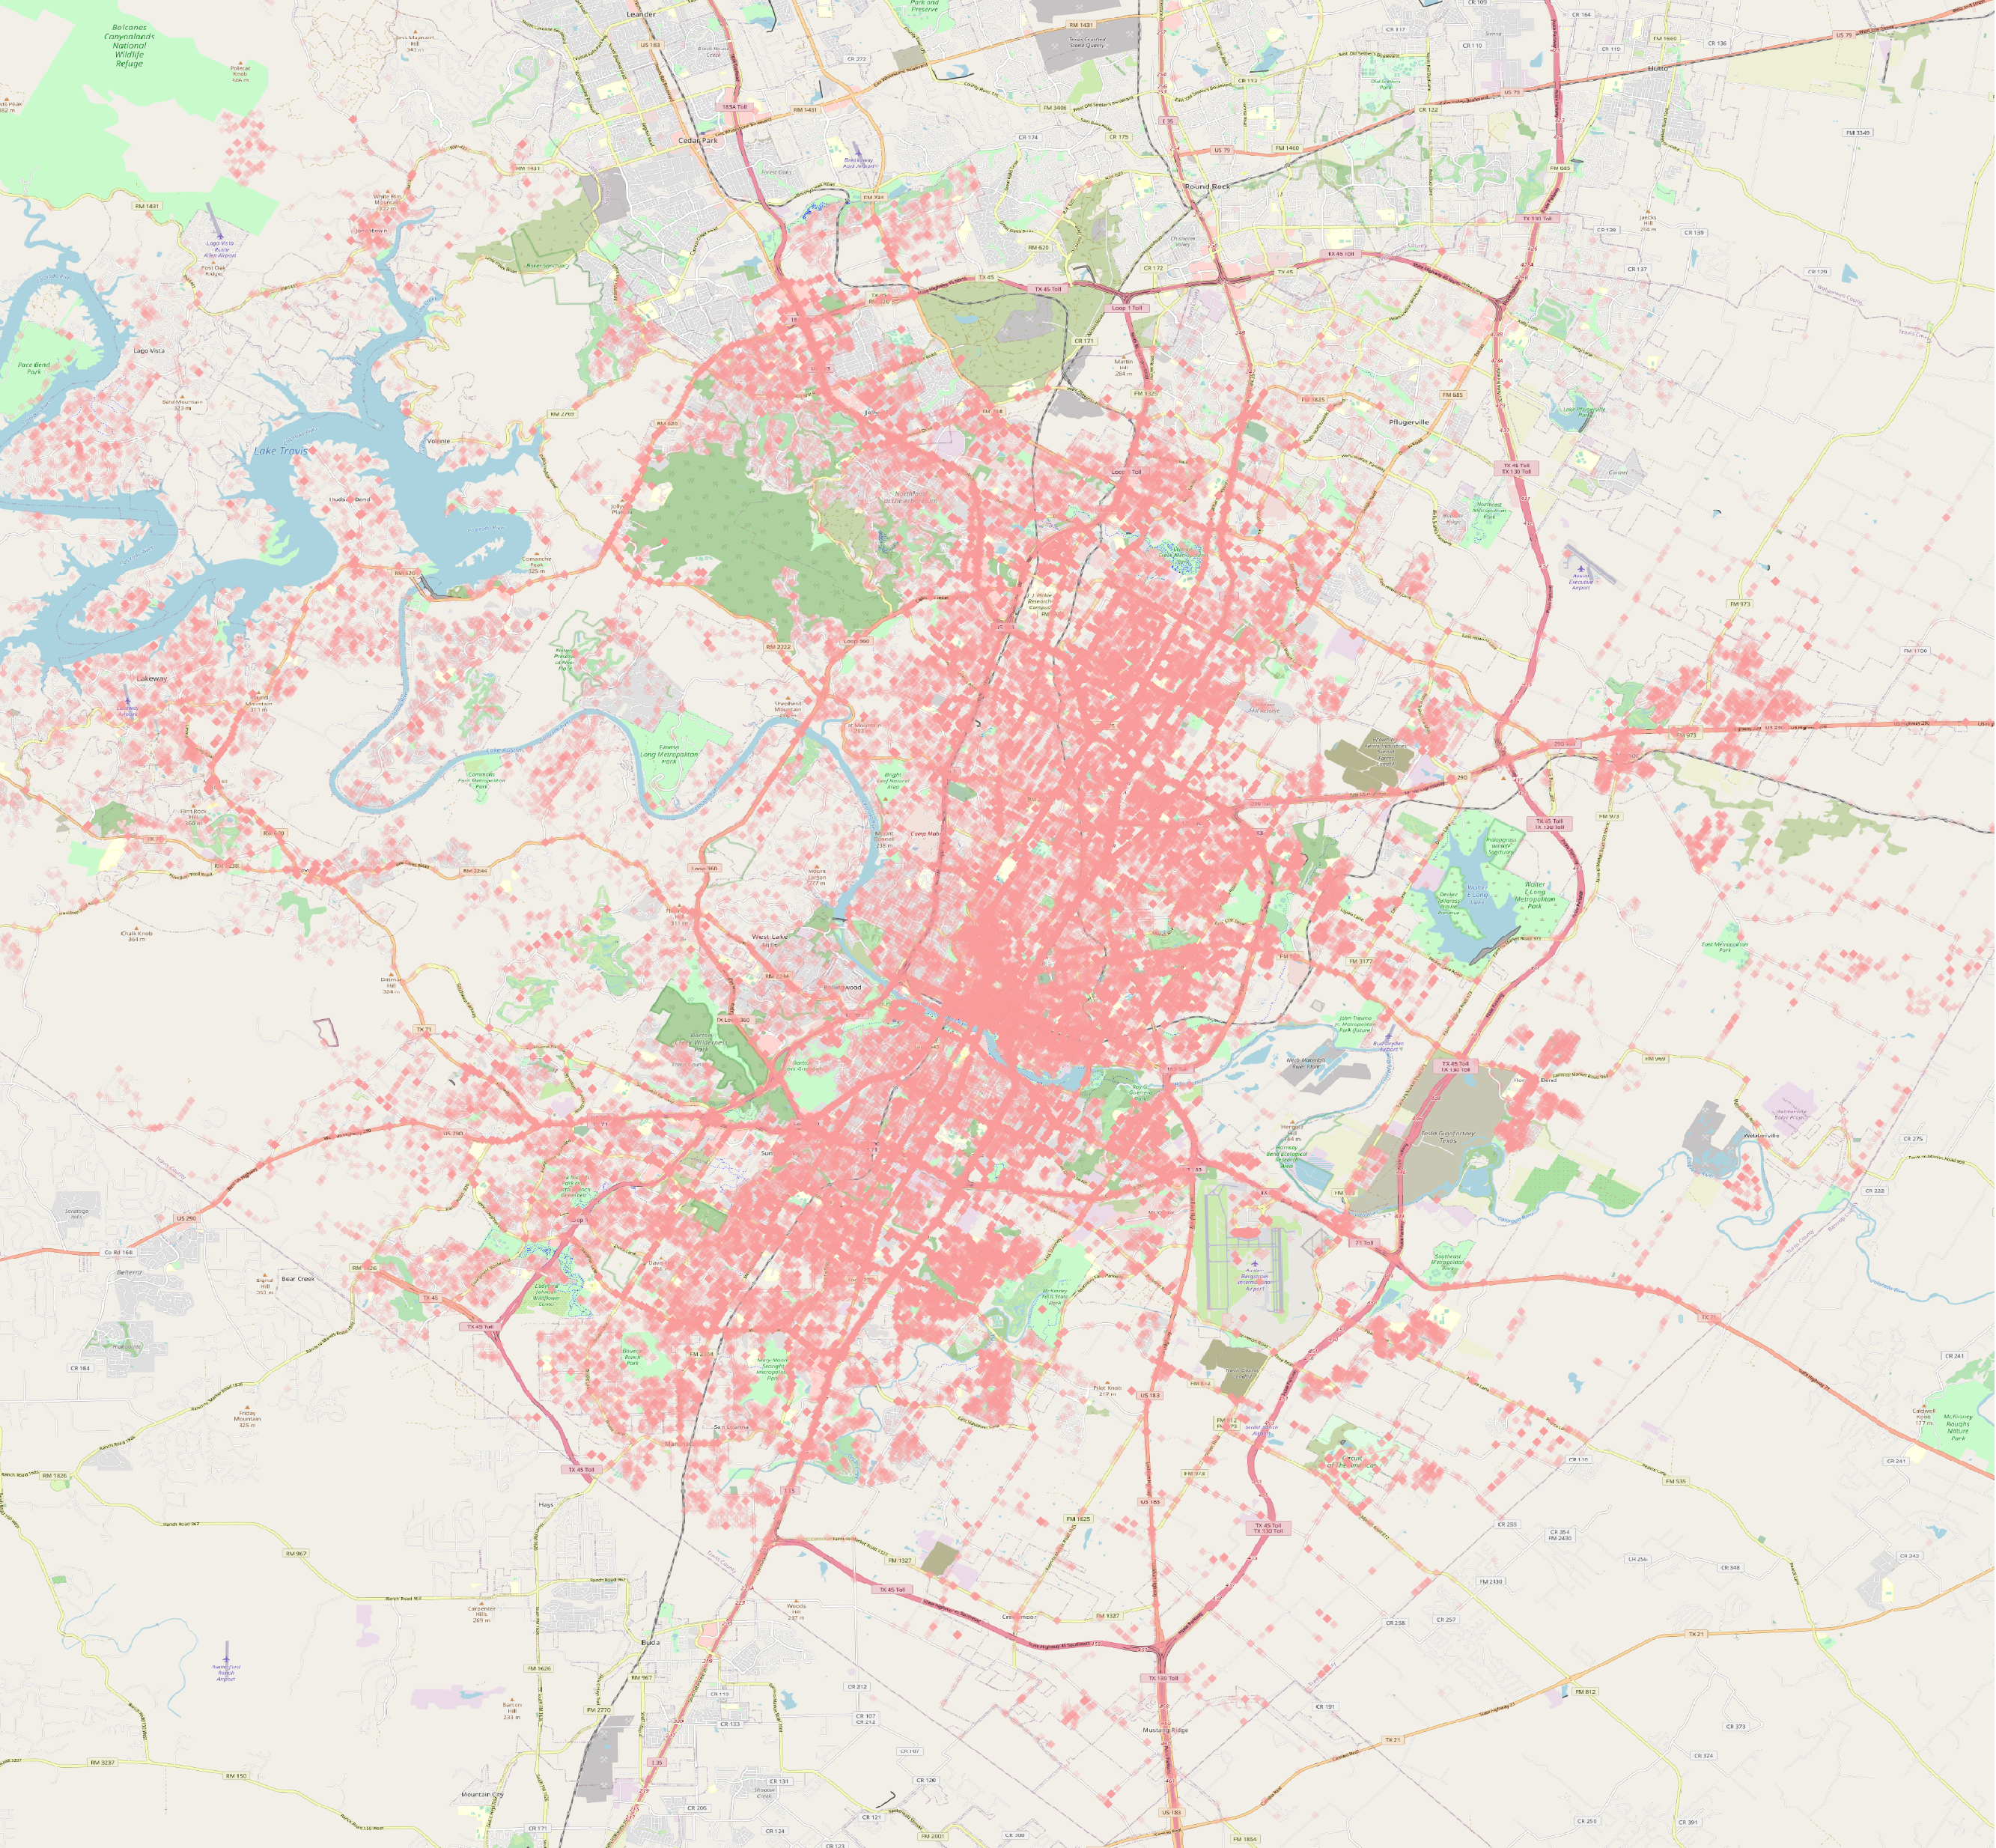
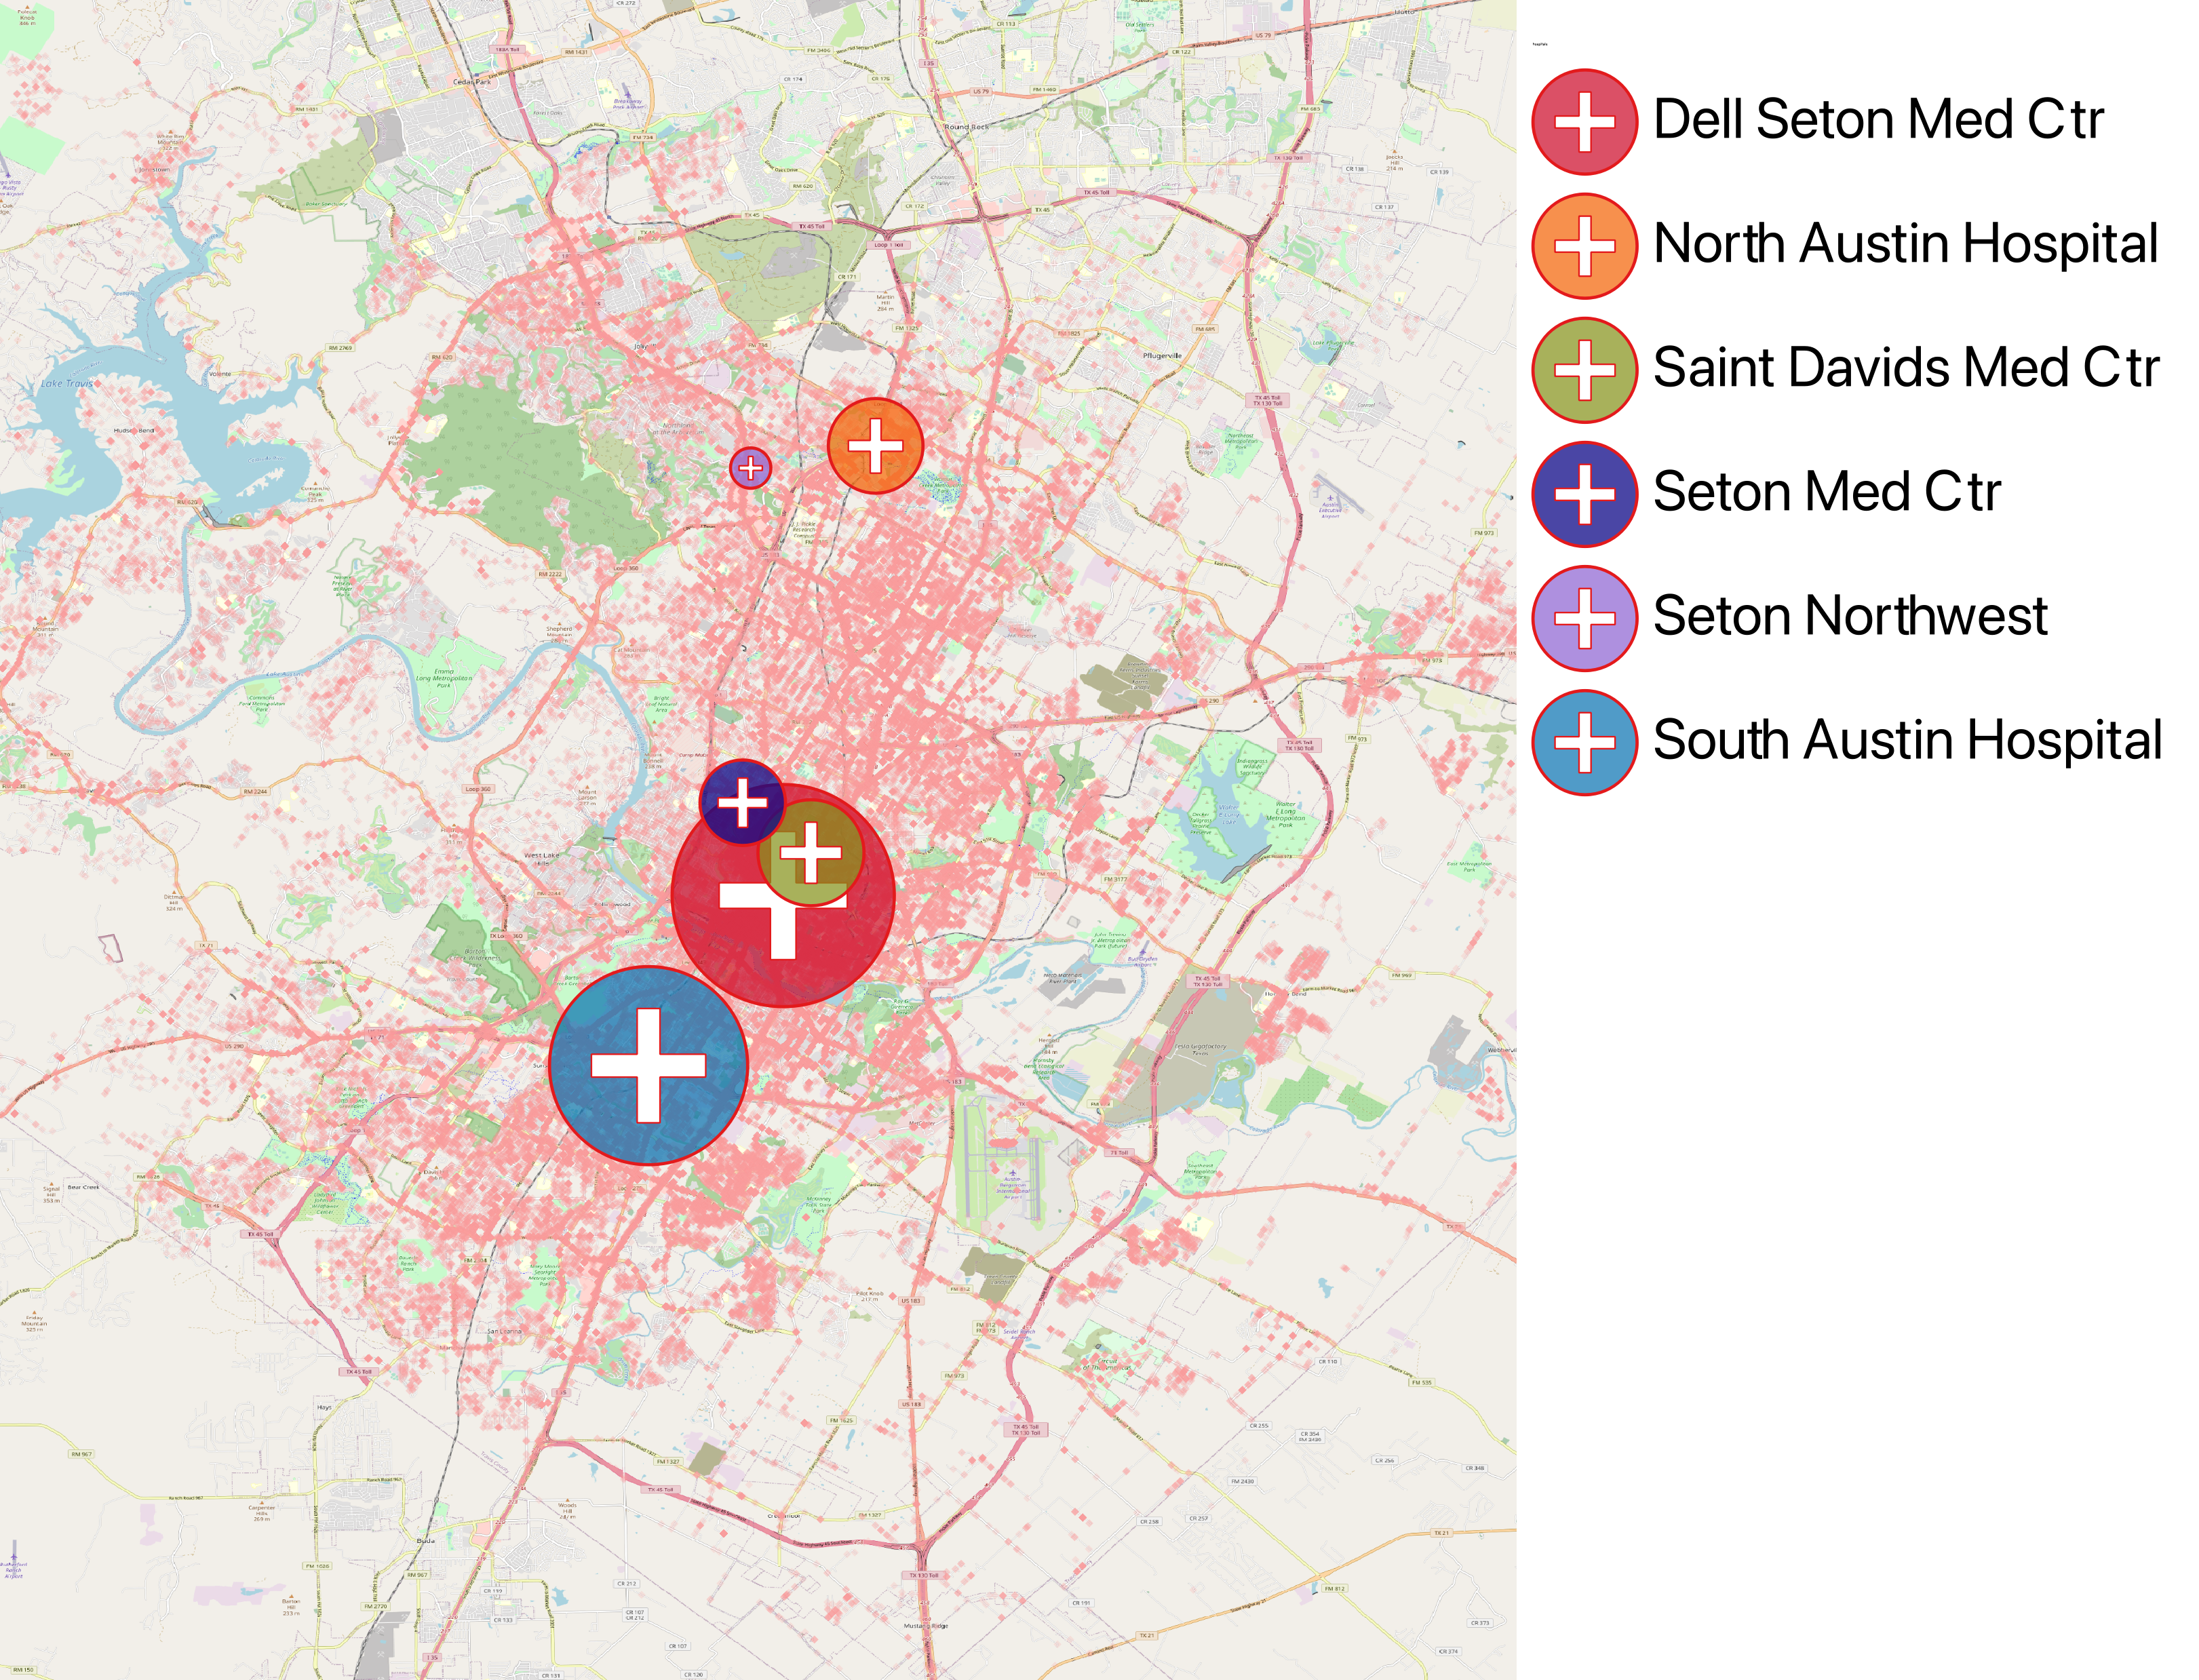
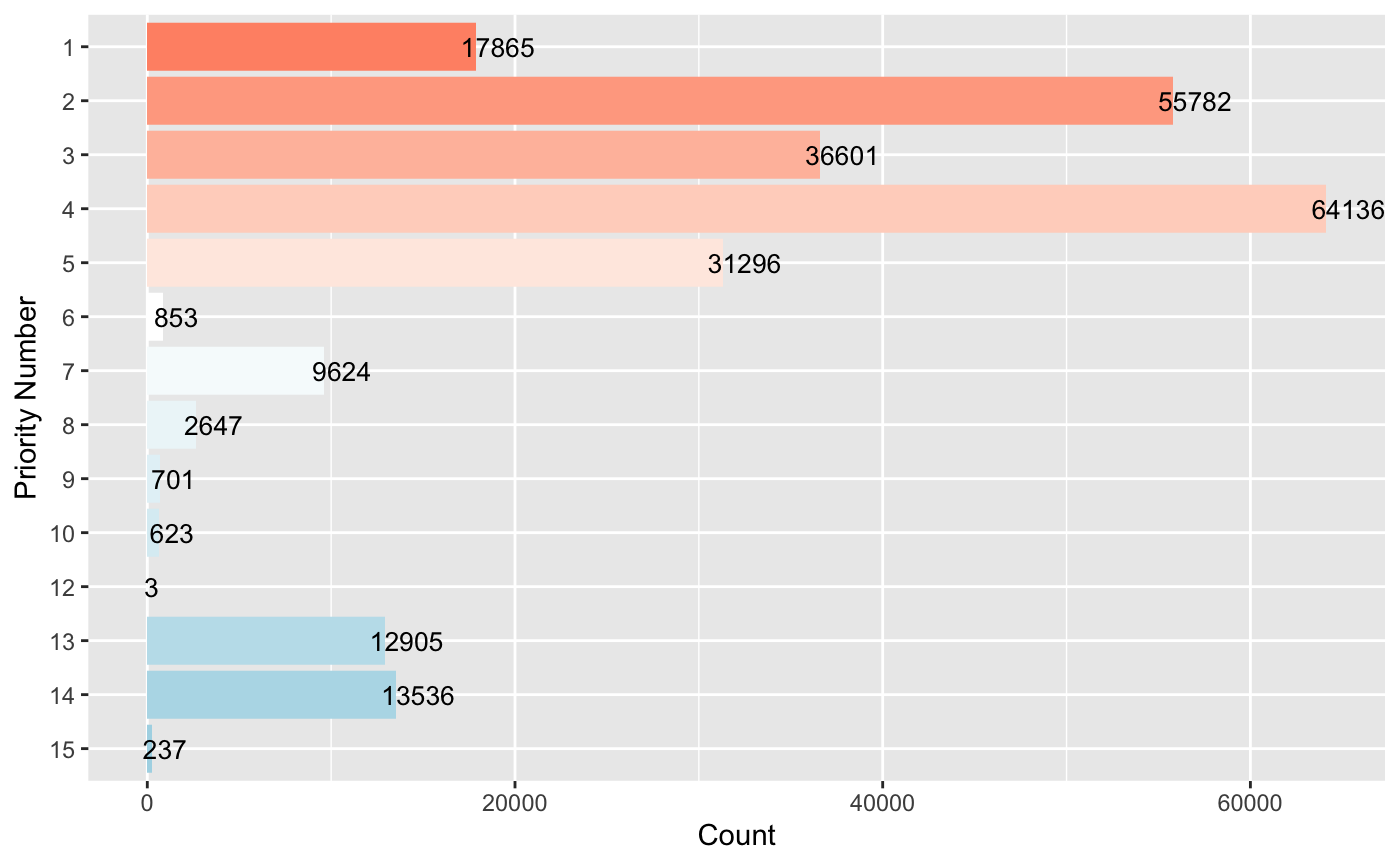
The total number of EMS calls during the 2019 to 2020 period was 246,809. On average, the 37 ambulances in Austin Travis County responded to calls per day. Out of all incidents, 29.8% are of high-priority, 40.8% are of mid-priority, and 29.3% are of low-priority, as shown in Figure 3. The spatial distribution of EMS incidents is shown in Figure 1. Noticeably, EMS incidents were prevalent along I-35 highway in Austin and were most frequent in downtown Austin. There are six major hospitals in Travis County (for the locations of these hospitals, see Figure 2; for the percentages of EMS incidents classified by call dispositions, see Figure 4), among which Dell Seton Medical Center and South Austin Hospital are the two biggest ones, covering 26% of all EMS incidents. In summary, the six major hospitals took care of 47% of all EMS incidents. Meanwhile, refusal (20%), cancellation (7%), missing patient (5%) are also among the highest percentages.
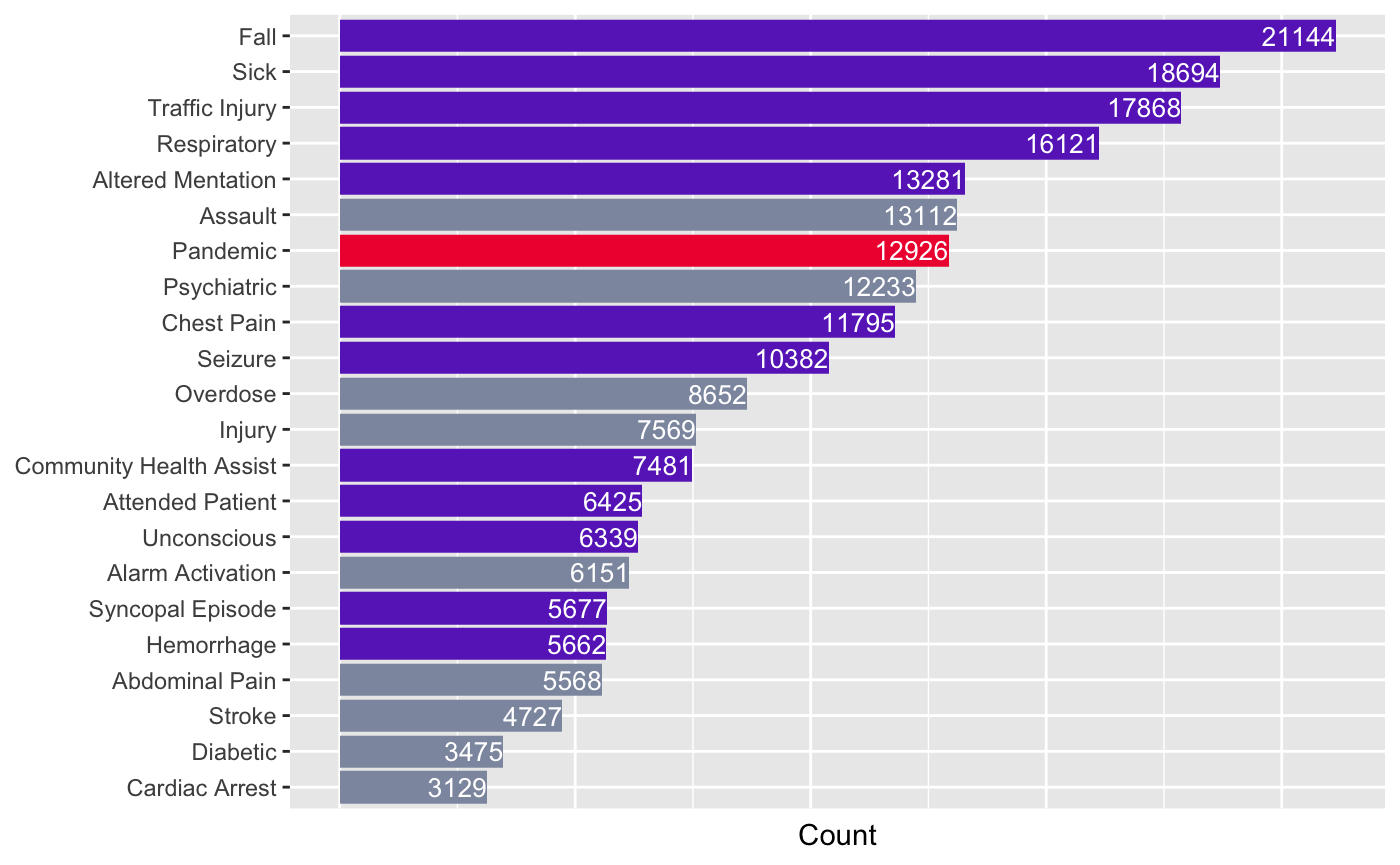
There were 22 types of problems with the highest number of calls, which in sum comprise 88% of the total number of incidents. For a complete list of problem types and their frequencies in the period of 2019 to 2020, see Figure 5. Notably, there were 12,926 emergency calls related to the Covid-19 pandemic.
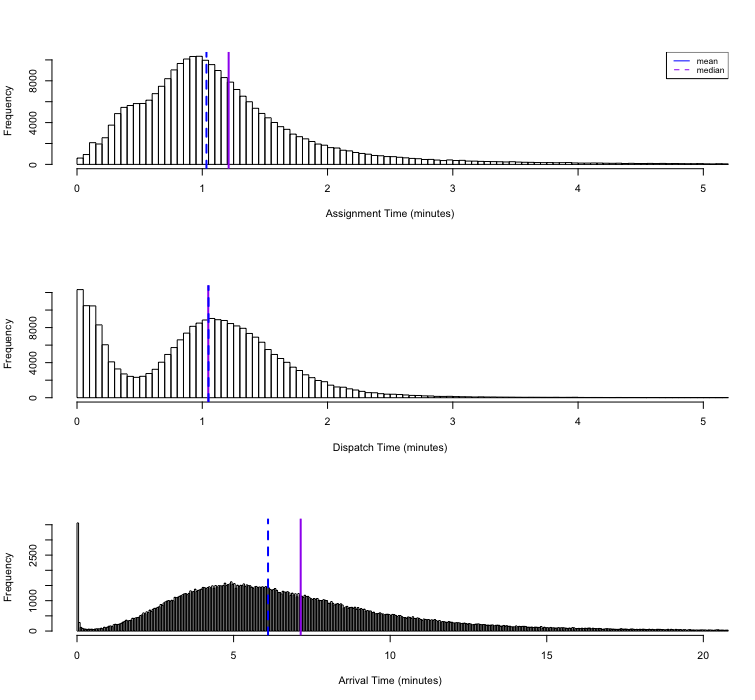
The distribution of EMS response times in 2019-2020 is shown in Figure 6. On average, after an EMS call was picked up, the mean time for an ambulance assignment was 1.21 minutes, and the median was 1.03 minutes. The mean and median time for an assigned ambulance to dispatch were both 1.05 minutes. The average time for a dispatched ambulance to arrive on the scene was 7.14 minutes, and the median was 6.1 minutes.444The average response time varies among the six major hospitals. For a detailed comparison, see the appendix section.
3.2 Impacts of the pandemic
3.2.1 EMS call volumes changed significantly with two critical dates
Via change point detection in mean and variance of the temporal distribution of non-pandemic EMS calls, with binary segmentation method and BIC penalty, we found two critical dates marking the impact of Covid-19 on non-pandemic EMS calls (shown as purple vertical lines in Figure 7). The first date was March 17th, around the time of the Austin shelter-in-place order. The average daily number of non-pandemic EMS incidents dropped significantly, from 225.69 in period one to 155.84 in period two.
The second critical date was May 13th, or the beginning of summer, by which the daily number of EMS calls climbed back to a new plateau, which is about 75% of that before March 17th (169.53 in period three versus 225.69 in period one). In sum, the total number of non-pandemic EMS calls decreased during Covid-19 times.
Noticeably, despite the disruption of Covid-19, non-pandemic defunct calls did not witness the same level of decrease in daily frequency (shown by the orange line in Figure 7). Nevertheless, the proportion of defunct calls rose from 35% of the overall number of non-pandemic EMS calls in period one to 39% in period three. For a complete comparison of the number of non-pandemic EMS incidents per day among periods one, two, and three, see Table 5.
| Comparison of number of non-pandemic EMS incidents | ||||||
| period 1 | period 2 | period 3 | ||||
| Mean | SD | Mean | SD | Mean | SD | |
| Admitted | 225.69 | 19.43 | 155.84 | 20.23 | 169.53 | 14.76 |
| Defunct | 122.35 | 21.71 | 113.59 | 19.30 | 109.34 | 12.73 |
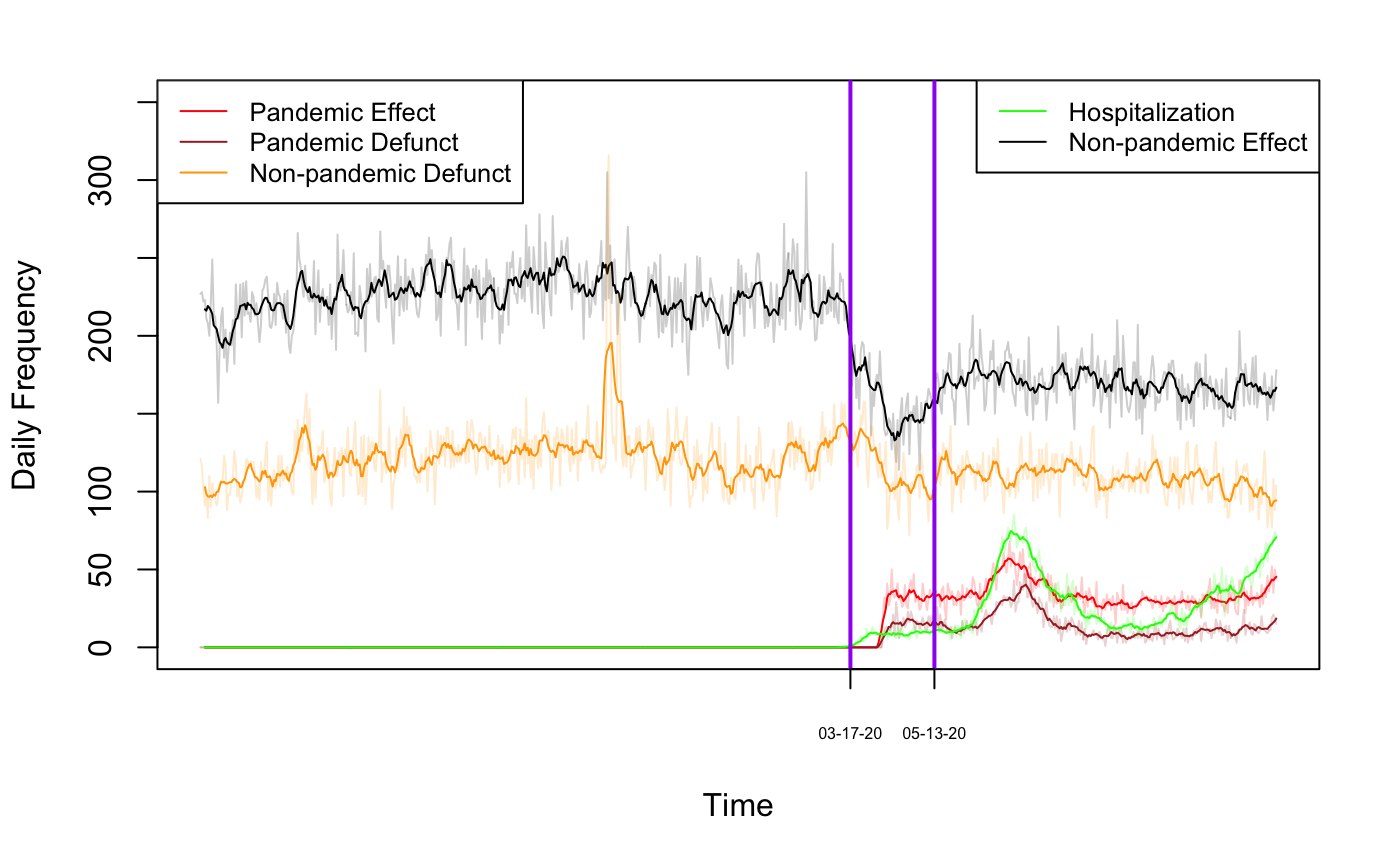
As for pandemic-related incidents, the red line represents pandemic EMS calls disposed to hospitals, and the brown line represents pandemic related defunct calls in Figure 7. Note that pandemic EMS calls are closely correlated with the daily frequency of the newly admitted Covid-19 patients to hospitals in the Austin-Round Rock metropolitan statistical area, shown by the green line. Our time-series model in the next subsection found that this hospitalization trend alone is a powerful predictor for pandemic EMS calls.
| Comparison of number of non-pandemic EMS incidents by problem type | |||
| period 1 | period 3 | ||
| Mean | Mean | p-value | |
| Cardiac Arrest | 4.03 | 4.54 | 0.999 |
| Psychiatric | 16.52 | 17.49 | 0.996 |
| Assault | 17.86 | 18.45 | 0.904 |
| Stroke | 6.51 | 6.55 | 0.561 |
| Abdominal Pain | 7.65 | 7.51 | 0.271 |
| Alarm Activation | 8.52 | 8.23 | 0.128 |
| Injury | 10.67 | 10.24 | 0.061 |
| Overdose | 12.16 | 11.42 | 0.008 |
| Diabetic | 4.91 | 4.45 | 0.007 |
| Altered Mentation | 20.90 | 14.15 | |
| Attended Patient | 10.43 | 6.63 | |
| Chest Pain | 19.17 | 11.10 | |
| Community Health Assist | 11.56 | 8.06 | |
| Fall | 30.47 | 27.27 | |
| Hemorrhage | 8.51 | 6.48 | |
| Respiratory | 24.83 | 16.19 | |
| Seizure | 15.18 | 12.91 | |
| Sick | 31.78 | 14.79 | |
| Syncopal Episode | 8.66 | 6.62 | |
| Traffic Injury | 27.39 | 21.37 | |
| Unconscious | 9.46 | 7.68 | |
| Assignment Time | Dispatch Time | Arrival Time | ||||
|---|---|---|---|---|---|---|
| Mean | Median | Mean | Median | Mean | Median | |
| period 1 | 1.18 | 1.02 | 1.01 | 1.00 | 6.88 | 5.87 |
| period 2 | 1.33 | 1.12 | 1.08 | 1.10 | 7.52 | 6.40 |
| period 3 | 1.25 | 1.05 | 1.11 | 1.10 | 7.61 | 6.55 |

| High-priority Incidents | Period 1 | Period 2 | Period 3 |
|---|---|---|---|
| Total Count | |||
| min | |||
| Proportion |
A closer comparison between period one and period three showed that the frequencies of only certain types of problems dropped, while others remained unaffected by Covid-19. The complete list of comparisons of the number of non-pandemic EMS incidents of each problem type can be found in Table 6.
3.2.2 EMS response times were slower during the pandemic
The performance of EMS response was also impacted since the outbreak of Covid-19. The mean response time for each action, assignment, dispatch and arrival, was slower during period two and period three than that in period one (one-sided t-test, p-value ). In particular, the arrival time during period three is 0.73 minutes slower than during period one for each EMS incident. A complete list of comparisons of the mean and median of response time is in Table 7. The reader can also see from Figure 8 that the mean (solid line) and median (dashed line) of the distributions of the response time has slightly shifted to the right from period one to period three. As shown in Table 8, the proportions of high-priority incidents EMS whose response time (in minutes) were within 5 minutes decreased from 44.7% in period one to 33.6% in period three. A one-sided t-test suggests that this decrease is statistically significant with p-value .
3.3 Covid-19 hospitalization predicts pandemic EMS calls
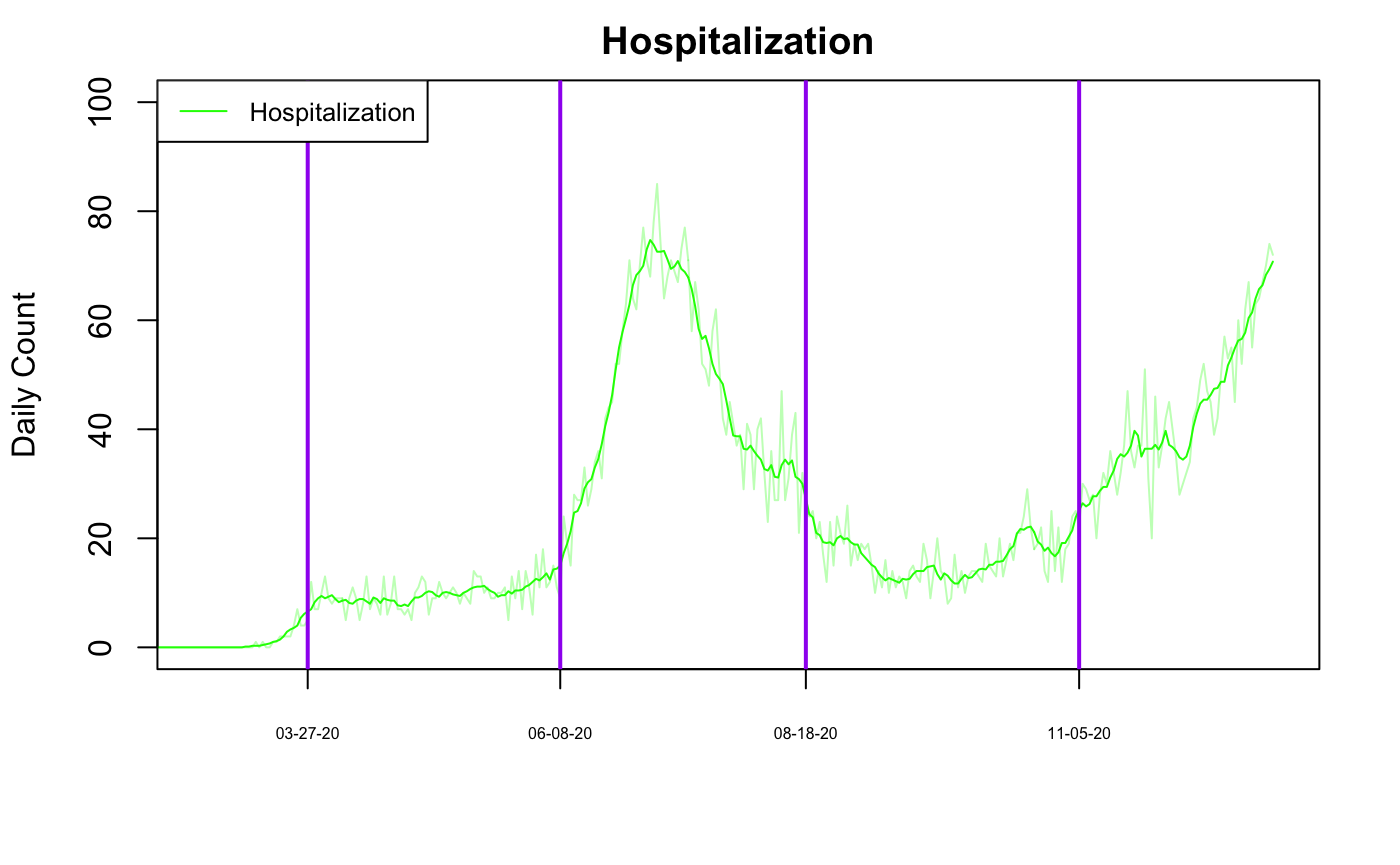
The exact change point detection on variance with MBIC penalty yielded 4 Covid-19 hospitalization stages since March 2020. The four change point dates are shown by the purple vertical lines in Figure 9. In particular, we see rises in Covid-19 hospitalizations during summer 2020 (June 8th - August 18th) and winter 2020 (November 5th - December 31st). This resonated with the global pandemic second and third waves. To achieve optimal modeling performance, we avoided the uncertainties at the earliest stage of the pandemic by only fitting and testing the model using data from April 9th to December 31st in 2020. Thus, we set the dummy variable ”1st_period” to 1 during the period from April 9th - June 8th, the dummy variable ”2nd_period” to 1 during the period from June 8th - August 17th, and the dummy variable ”3rd_period” to 1 during the period from August 17th - December 31st.
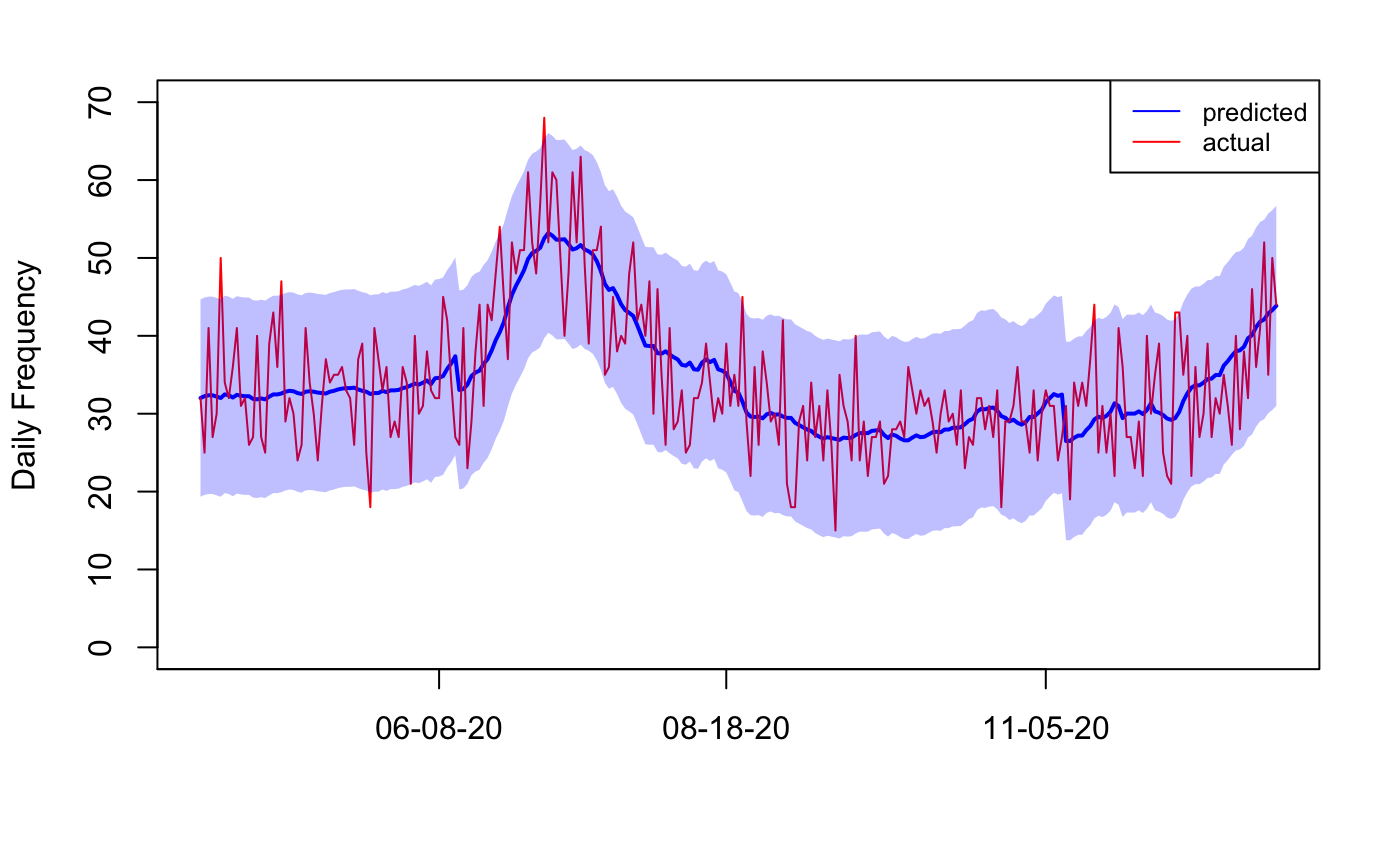
The exhaustive selection of ARIMA models outputs 0 autoregressive order, 0 degrees of differencing, and 0 moving average order. The coefficients of the linear regression model, with the pandemic EMS Calls regressed on the smoothed (7-day average) hospitalization data, are specified in Table 9. This model obtained an value equal to . Moreover, the residual standard error of the training and test set are 6.62 and 5.44, respectively, which mainly characterize the random fluctuations on daily counts. The reader can also see from Figure 10 that most of the actual daily frequencies of pandemic EMS incidents fall within the 95% prediction interval. Therefore, daily new hospitalization of Covid-19 cases alone proves a powerful and robust indicator of pandemic-related EMS demand. The 0.40 estimate of slope suggests that on average, for every 2.5 cases where EMS took a Covid-19 patient to a hospital, one person was admitted. Moreover, moving from the 1st to the 3rd period, there was a decreasing offset between pandemic EMS incidents and hospitalization numbers.
| Coefficients | intercept | hospitalization | 1st_period | 2nd_period | 3rd_period |
|---|---|---|---|---|---|
| Estimate | 15.09774 | 0.40327 | 13.87507 | 7.90718 | 6.72668 |
| Standard Error | 2.15766 | 0.04341 | 1.99988 | 1.34397 | 1.76075 |
| train | |||||
| Residual standard error: 6.619 on 209 degrees of freedom | |||||
| test | |||||
| Mean squared error: 29.012 | |||||
| Standard error of prediction residual: 5.435 | |||||
4 Discussion
The daily number of non-pandemic EMS incidents dropped precipitously since the beginning of the Covid-19 pandemic and the declaration of the local state of emergency. This resonates with earlier studies in the United States (5, 6, 8, 33), Italy (9, 35), England (10), Canada (34) and Finland (36). Even though the number of non-pandemic EMS incidents increased at the beginning of summer, it remained consistently lower than in the pre-pandemic era. More interestingly, the proportion of non-pandemic defunct calls rose after the outbreak of the Covid-19 pandemic. The rise of refusals to transportation to hospitals has also been observed in Israel (57). This corroborates with earlier studies in the United States suggesting that people showed reluctance to receive hospitalization out of fear of contagion (13, 58).
This significant decrease in non-pandemic EMS incidents may also be partially explained by travel restrictions (attended patient, community health assist, fall, hemorrhage, traffic injury) and misclassification into Covid-19 cases (chest pain, respiratory, and sick). An overall decrease in traffic-related incidents was also observed in Israel (57) and Ontario, Canada (34) during period two. People may have traveled less frequently due to the shelter-in-place order issued in March 2020 and possibly been less exposed to injury-prone locations. A study in Connecticut found that the mean daily vehicle miles traveled and the mean daily counts of crashes significantly decreased in the post-stay-at-home period in 2020 (59). Our comparison between periods one and three in Table 6 showed that the frequencies of traffic-related incidents remained lower in the long run than those of the pre-pandemic time, despite the lifting of Texas stay-at-home order.
The decrease in emergency calls regarding chest pain, sickness, and respiratory problems was also found in Netherlands (60) and Ontario, Canada (34). One possible explanation is that calls previously classified as ”chest pain,” ”respiratory,” and ”sick,” due to their similarity to Covid-19 symptoms, became categorized as ”pandemic” (34).
Prior studies have found increase in EMS calls regarding cardiac arrest (57, 34, 61), stroke (34) mental health (57) and overdose (34), during the early stages of the Covid-19 pandemic. Our study confirmed that, in the long term, the EMS demand for these problems did not decrease. Interestingly, although earlier findings in Ontario, Canada (62) showed a decrease in emergency calls related to assault during the period March-May 2020, our study found that the daily average number of emergency calls related to assault in Austin was higher during the post-pandemic time (period three) than pre-pandemic time (period one).
Despite the overall decrease in emergency call volume, we observed statistically significant prolongation of the EMS response time (see Section 3.2.2). Whether this is clinically significant is beyond our scope, though there are studies that may raise concerns. (63). In particular, it was shown that for incidents of intermediate or high risk of mortality, a survival benefit was identified when the response time was within 4 to 5 minutes for patients when compared with that exceeding 5 minutes (64, 65). Hence, as found in this study, the decrease in the proportion of high-priority incidents whose response time was within 5 minutes may raise concerns for EMS practitioners.
Investigating the cause of the lengthened response time is a very interesting problem, but it is well beyond the scope of this study. One possible explanation is that the adaptation to Covid-19 personal protective equipment (PPE) protocol (66, 67, 68) may have contributed to the overall prolongation of EMS response time. Prior studies reported that following Covid-19 PPE protocols has hampered surgical performance by causing visual impairment, communication impediments, and increased fatigue (69). We hypothesize that the same could have happened to health workers at the EMS department. Additionally, previous studies have reported shortages in resources such as PPE equipment among EMS facilities (70), which may limit the number of available personnel and ambulances. Indeed, local news reported in Austin suggested that the EMS department did not receive adequate funding to maintain sufficient personnel and ambulances during the pandemic, leading to delays in response time (71, 72). Meanwhile, the prolongation of EMS response time after the beginning of the Covid-19 pandemic was also found in Finland (36) and Western Pennsylvania (33).
Previous studies reporting the patterns of EMS demand under the impact of Covid-19 in France (47, 48) and Israel (49) suggested that the increase of EMS calls for Covid-19 symptoms followed the same shape as for confirmed Covid-19 patients. Our study confirms and quantifies this observation. We computed the correlation between the daily new hospitalization of Covid-19 patients and pandemic-related EMS demand. Covid-19 hospitalization projection models have been investigated extensively (53, 73, 74, 75, 76). Our regression model, which can use forecasts of the Covid-19 hospitalization count as input, can thus serve as a simple and convenient tool for EMS departments to quickly forecast pandemic-related EMS demand. Interestingly, as time progressed, the offset between pandemic EMS and hospitalization numbers became smaller. The reason remains unclear. We hypothesize that people became better at making informed decisions about Covid-19-related EMS Calls. At the beginning of the outbreak, due to a lack of knowledge of the epidemic, people might have made haste to raise red flags even though they were not contaminated by Covid-19. However, we did not find supporting evidence for our hypothesis.
5 Limitations and Future Directions
Our analysis and the proposed time series model were restricted to the data observed in Austin. It will be interesting to see whether a similar simple model can be fitted to forecast pandemic-related EMS demand in other cities. Moreover, the decrease in the offset between pandemic EMS and hospitalization numbers stood out very interesting. However, we are unable to find a satisfying reason, and we hope for future studies to test our hypothesis.
Another limitation was that our regression model forecasts the overall number of Covid-19 EMS cases without differentiating the priority levels or the geolocation of each incident. The ability to identify and forecast urgent incidents may improve EMS further. Additionally, a more fine-grained model incorporating spatial information may help identify incident hotspots within the city.
6 Conclusions
This study analyzed the impact of the Covid-19 pandemic on EMS call distributions and response time. Overall, we have confirmed that non-pandemic EMS calls in Austin have significantly decreased since the beginning of the Covid-19 pandemic, yet the proportion of non-pandemic defunct calls increased. In terms of problem types, we observed that some problems seemed to remain unaffected despite an overall decrease in call volumes. Specifically, EMS calls related to traffic and Covid-19 symptoms decreased while calls related to cardiac arrest, stroke, mental health, overdose, and assault did not. These results resonate with those in other geographical areas around the globe. Meanwhile, the response time of EMS was significantly prolonged since the outbreak of the Covid-19 pandemic. This information can provide an opportunity for dialogue among EMS agencies, government officials, and health care partners on adjusting changes in EMS demand and shortening response time during future pandemics.
Moreover, we proposed a time series regression model with change point detection to predict the daily frequency of pandemic EMS incidents. The daily new hospitalization of Covid-19 patients proved a powerful predictor for the number of Covid-19-related EMS calls. In particular, this model suggested that for every 2.5 cases where EMS took a Covid-19 patient to a hospital, one person was admitted. This model may be of interest to other EMS departments as they plan for future pandemics, including the ability to predict pandemic-related calls in an effort to adjust a targeted response.
Acknowledgement
This project is funded by the Good Systems – UT Austin Bridging Barriers Initiative (https://bridgingbarriers.utexas.edu/good-systems/). We would like to thank Prof. Junfeng Jiao for suggesting the CDC SVI data and Mauricio Tec for providing data on the hospital admission of Covid-19 patients in the Austin-Round Rock metropolitan statistical area. We also thank Natasha Stewart for the insightful comments on earlier drafts.
References
- Organization et al. (2020) W. H. Organization, et al., Coronavirus disease 2019 (COVID-19): situation report, 86 (2020).
- Moghadas et al. (2020) S. M. Moghadas, A. Shoukat, M. C. Fitzpatrick, C. R. Wells, P. Sah, A. Pandey, J. D. Sachs, Z. Wang, L. A. Meyers, B. H. Singer, A. P. Galvani, Projecting hospital utilization during the COVID-19 outbreaks in the United States, Proceedings of the National Academy of Sciences 117 (2020) 9122–9126.
- Willan et al. (2020) J. Willan, A. J. King, K. Jeffery, N. Bienz, Challenges for NHS hospitals during covid-19 epidemic, BMJ 368 (2020).
- Guharoy et al. (2021) R. Guharoy, E. Krenzelok, J. Noviasky, Race Against the Pandemic: The United States and Global Health, Journal of Emergency Medicine 60 (2021) 402–406.
- Lerner et al. (2020) E. B. Lerner, C. D. Newgard, N. C. Mann, Effect of the Coronavirus Disease 2019 (COVID-19) Pandemic on the U.S. Emergency Medical Services System: A Preliminary Report, Academic Emergency Medicine 27 (2020) 693–699.
- Boserup et al. (2020) B. Boserup, M. McKenney, A. Elkbuli, The impact of the COVID-19 pandemic on emergency department visits and patient safety in the United States, The American Journal of Emergency Medicine 38 (2020) 1732–1736.
- Hartnett et al. (2020) K. P. Hartnett, A. Kite-Powell, J. DeVies, M. A. Coletta, T. K. Boehmer, J. Adjemian, A. V. Gundlapalli, et al., Impact of the COVID-19 pandemic on emergency department visits—United States, January 1, 2019–May 30, 2020, Morbidity and Mortality Weekly Report 69 (2020) 699.
- Jeffery et al. (2020) M. M. Jeffery, G. D’Onofrio, H. Paek, T. F. Platts-Mills, W. E. Soares, J. A. Hoppe, N. Genes, B. Nath, E. R. Melnick, Trends in emergency department visits and hospital admissions in health care systems in 5 states in the first months of the COVID-19 pandemic in the US, JAMA internal medicine 180 (2020) 1328–1333.
- Lazzerini et al. (2020) M. Lazzerini, E. Barbi, A. Apicella, F. Marchetti, F. Cardinale, G. Trobia, Delayed access or provision of care in Italy resulting from fear of COVID-19, The Lancet Child & Adolescent Health 4 (2020) e10–e11.
- Thornton (2020) J. Thornton, Covid-19: A&E visits in England fall by 25% in week after lockdown, 2020.
- Al-Wathinani et al. (2021) A. Al-Wathinani, A. J. Hertelendy, S. Alhurishi, A. Mobrad, R. Alhazmi, M. Altuwaijri, M. Alanazi, R. Alotaibi, K. Goniewicz, Increased Emergency Calls during the COVID-19 Pandemic in Saudi Arabia: A National Retrospective Study, Healthcare 9 (2021).
- Şan et al. (2020) İ. Şan, E. Usul, B. Bekgöz, S. Korkut, Effects of COVID-19 pandemic on emergency medical services, International Journal of Clinical Practice (2020) e13885.
- WongLaura et al. (2020) E. WongLaura, E. HawkinsJessica, L. MurrellKaren, et al., Where are all the patients? Addressing Covid-19 fear to encourage sick patients to seek emergency care, NEJM Catalyst Innovations in Care Delivery (2020).
- Jensen et al. (2020) T. Jensen, M. G. Holgersen, M. S. Jespersen, S. N. Blomberg, F. Folke, F. Lippert, H. C. Christensen, Strategies to handle increased demand in the COVID-19 crisis: A coronavirus EMS support track and a web-based self-triage system, Prehospital Emergency Care 25 (2020) 28–38.
- Lucero et al. (2020) A. D. Lucero, A. Lee, J. Hyun, C. Lee, C. Kahwaji, G. Miller, M. Neeki, J. Tamayo-Sarver, L. Pan, Underutilization of the Emergency Department During the COVID-19 Pandemic, Western Journal of Emergency Medicine 21 (2020) 15.
- Butt et al. (2020) A. A. Butt, A. M. Azad, A. B. Kartha, N. A. Masoodi, R. Bertollini, A.-B. Abou-Samra, Volume and acuity of emergency department visits prior to and after COVID-19, The Journal of emergency medicine 59 (2020) 730–734.
- Montagnon et al. (2021) R. Montagnon, L. Rouffilange, G. Agard, P. Benner, N. Cazes, A. Renard, Impact of the COVID-19 pandemic on emergency department use: focus on patients requiring urgent revascularization, The Journal of Emergency Medicine 60 (2021) 229–236.
- Fernandez et al. (2020) A. R. Fernandez, R. P. Crowe, S. Bourn, S. E. Matt, A. L. Brown, A. B. Hawthorn, J. Brent Myers, COVID-19 preliminary case series: characteristics of EMS encounters with linked hospital diagnoses, Prehospital Emergency Care 25 (2020) 16–27.
- Yang et al. (2020) B. Y. Yang, L. M. Barnard, J. M. Emert, C. Drucker, L. Schwarcz, C. R. Counts, D. L. Murphy, S. Guan, K. Kume, K. Rodriquez, et al., Clinical characteristics of patients with coronavirus disease 2019 (COVID-19) receiving emergency medical services in King County, Washington, JAMA network open 3 (2020) e2014549–e2014549.
- Gibson et al. (2020) C. Gibson, C. Ventura, G. D. Collier, Emergency Medical Services resource capacity and competency amid COVID-19 in the United States: preliminary findings from a national survey, Heliyon 6 (2020) e03900.
- Hick et al. (2020) J. L. Hick, D. Hanfling, M. K. Wynia, A. T. Pavia, Duty to plan: health care, crisis standards of care, and novel coronavirus SARS-CoV-2, NAM Perspectives (2020).
- Devereaux et al. (2020) A. Devereaux, H. Yang, G. Seda, V. Sankar, R. C. Maves, N. Karanjia, J. S. Parrish, C. Rosenberg, P. Goodman-Crews, L. Cederquist, et al., Optimizing Scarce Resource Allocation During COVID-19: Rapid Creation of a Regional Health-Care Coalition and Triage Teams in San Diego County, California, Disaster Medicine and Public Health Preparedness (2020) 1–7.
- Schreyer et al. (2020) K. E. Schreyer, A. Daniel, L. L. King, A. Blome, M. DeAngelis, K. Stauffer, K. Desrochers, W. Donahue, N. Politarhos, C. Raab, et al., Emergency department management of the Covid-19 pandemic, The Journal of emergency medicine 59 (2020) 946–951.
- Murphy et al. (2020) D. L. Murphy, L. M. Barnard, C. J. Drucker, B. Y. Yang, J. M. Emert, L. Schwarcz, C. R. Counts, T. Y. Jacinto, A. M. McCoy, T. A. Morgan, J. E. Whitney, J. V. Bodenman, J. S. Duchin, M. R. Sayre, T. D. Rea, Occupational exposures and programmatic response to COVID-19 pandemic: an emergency medical services experience, Emergency Medicine Journal 37 (2020) 707–713.
- Jalili (2020) M. Jalili, How should emergency medical services personnel protect themselves and the patients during COVID-19 pandemic?, Frontiers in Emergency Medicine 4 (2020) e37–e37.
- Ehrlich et al. (2020) H. Ehrlich, M. McKenney, A. Elkbuli, Defending the front lines during the COVID-19 pandemic: Protecting our first responders and emergency medical service personnel, The American Journal of Emergency Medicine (2020).
- Spina et al. (2020) S. Spina, F. Marrazzo, M. Migliari, R. Stucchi, A. Sforza, R. Fumagalli, The response of Milan’s Emergency Medical System to the COVID-19 outbreak in Italy, The Lancet 395 (2020) e49–e50.
- Cabañas et al. (2020) J. G. Cabañas, J. G. Williams, J. M. Gallagher, J. H. Brice, COVID-19 Pandemic: The Role of EMS Physicians in a Community Response Effort, Prehospital Emergency Care (2020) 1–8.
- Ghazali et al. (2020) D. A. Ghazali, A. Ouersighni, M. Gay, V. Audebault, T. Pavlovsky, E. Casalino, Feedback to Prepare EMS Teams to Manage Infected Patients with COVID-19: A Case Series, Prehospital and Disaster Medicine 35 (2020) 451–453.
- Maguire et al. (2020) B. J. Maguire, K. Shearer, J. McKeown, S. Phelps, D. R. Gerard, K. A. Handal, B. O’Neill, The ethics of PPE and EMS in the COVID-19 era, JEMS (2020).
- Shadyab et al. (2021) A. H. Shadyab, E. M. Castillo, J. J. Brennan, T. C. Chan, V. M. Tolia, Ethnic Disparities in COVID-19 among Older Adults Presenting to the Geriatric Emergency Department, The Journal of Emergency Medicine (2021).
- Penverne et al. (2020) Y. Penverne, J. Jenvrin, E. Montassier, EMS dispatch center activity during the COVID-19 containment, The American Journal of Emergency Medicine (2020).
- Satty et al. (2020) T. Satty, S. Ramgopal, J. Elmer, V. N. Mosesso, C. Martin-Gill, EMS responses and non-transports during the COVID-19 pandemic, The American Journal of Emergency Medicine (2020).
- Ferron et al. (2021) R. Ferron, G. Agarwal, R. Cooper, D. Munkley, The effect of COVID-19 on emergency medical service call volumes and patient acuity: a cross-sectional study in Niagara, Ontario, BMC Emergency Medicine 21 (2021) 39.
- Mantica et al. (2020) G. Mantica, N. Riccardi, C. Terrone, A. Gratarola, Non-COVID-19 visits to emergency departments during the pandemic: the impact of fear, Public Health 183 (2020) 40.
- Laukkanen et al. (2021) L. Laukkanen, S. Lahtinen, J. Liisanantti, T. Kaakinen, A. Ehrola, L. Raatiniemi, Early impact of the COVID-19 pandemic and social restrictions on ambulance missions, European Journal of Public Health (2021). Ckab065.
- Hall (1971) W. K. Hall, Management science approaches to the determination of urban ambulance requirements, Socio-economic Planning Sciences 5 (1971) 491–499.
- Aldrich et al. (1971) C. A. Aldrich, J. C. Hisserich, L. B. Lave, An analysis of the demand for emergency ambulance service in an urban area., American Journal of Public Health 61 (1971) 1156–1169.
- Siler (1975) K. F. Siler, Predicting demand for publicly dispatched ambulances in a metropolitan area., Health Services Research 10 (1975) 254.
- Kvålseth and Deems (1979) T. O. Kvålseth, J. M. Deems, Statistical models of the demand for emergency medical services in an urban area., American Journal of Public Health 69 (1979) 250–255.
- McConnel and Wilson (1998) C. E. McConnel, R. W. Wilson, The demand for prehospital emergency services in an aging society, Social Science & Medicine 46 (1998) 1027–1031.
- Wong and Lai (2012) H. T. Wong, P. C. Lai, Weather inference and daily demand for emergency ambulance services, Emergency Medicine Journal 29 (2012) 60–64.
- McCarthy et al. (2008) M. L. McCarthy, S. L. Zeger, R. Ding, D. Aronsky, N. R. Hoot, G. D. Kelen, The challenge of predicting demand for emergency department services, Academic Emergency Medicine 15 (2008) 337–346.
- Channouf et al. (2007) N. Channouf, P. L’Ecuyer, A. Ingolfsson, A. N. Avramidis, The application of forecasting techniques to modeling emergency medical system calls in Calgary, Alberta, Health care management science 10 (2007) 25–45.
- Setzler et al. (2009) H. Setzler, C. Saydam, S. Park, EMS call volume predictions: A comparative study, Computers & Operations Research 36 (2009) 1843–1851.
- Andrew et al. (2017) E. Andrew, Z. Nehme, S. Bernard, M. J. Abramson, E. Newbigin, B. Piper, J. Dunlop, P. Holman, K. Smith, Stormy weather: a retrospective analysis of demand for emergency medical services during epidemic thunderstorm asthma, bmj 359 (2017).
- Group (2020) C.-. A.-U.-I.-I. Group, Early indicators of intensive care unit bed requirement during the COVID-19 epidemic: A retrospective study in Ile-de-France region, France, PloS one 15 (2020) e0241406.
- Riou et al. (2020) B. Riou, et al., Emergency calls are early indicators of ICU bed requirement during the COVID-19 epidemic, medRxiv (2020).
- Jaffe et al. (2020) E. Jaffe, R. Sonkin, R. Strugo, E. Zerath, Evolution of emergency medical calls during a pandemic - An emergency medical service during the COVID-19 outbreak, The American journal of emergency medicine (2020) S0735–6757(20)30527–1.
- Kulpanowski (2021) D. Kulpanowski, University of Texas Good Systems and ATCEMS incidents data, 2021. URL: https://data.austintexas.gov/Public-Safety/University-of-Texas-Good-Systems-and-ATCEMS-incide/8mwi-dpdp.
- MPD (2021) Medical Priority Dispatch System EMD Cardset, Accessed on 08/08/2021. URL: https://prioritydispatch.net/emd-cardset/.
- Kulpanowski (2021) D. Kulpanowski, University of Texas Good Systems and ATCEMS Hospitalization time series, 2021. URL: https://data.austintexas.gov/Public-Safety/University-of-Texas-Good-Systems-and-ATCEMS-Hospit/2srm-55iz.
- Tec et al. (2020) M. Tec, M. Lachmann, S. J. Fox, R. Pasco, S. Woody, J. Starling, M. Dahan, K. Gaither, J. Scott, L. A. Meyers, Austin COVID-19 transmission estimates and healthcare projections (2020).
- Scott and Knott (1974) A. J. Scott, M. Knott, A cluster analysis method for grouping means in the analysis of variance, Biometrics (1974) 507–512.
- Killick et al. (2012) R. Killick, P. Fearnhead, I. A. Eckley, Optimal detection of changepoints with a linear computational cost, Journal of the American Statistical Association 107 (2012) 1590–1598.
- Weiß (2008) C. H. Weiß, Thinning operations for modeling time series of counts—a survey, AStA Advances in Statistical Analysis 92 (2008) 319.
- Siman-Tov et al. (2021) M. Siman-Tov, R. Strugo, T. Podolsky, O. Blushtein, An assessment of treatment, transport, and refusal incidence in a National EMS’s routine work during COVID-19, The American Journal of Emergency Medicine (2021).
- Moroni et al. (2020) F. Moroni, M. Gramegna, S. Ajello, A. Beneduce, L. Baldetti, L. M. Vilca, A. Cappelletti, A. M. Scandroglio, L. Azzalini, Collateral damage: medical care avoidance behavior among patients with myocardial infarction during the COVID-19 pandemic, Case Reports 2 (2020) 1620–1624.
- Doucette et al. (2021) M. L. Doucette, A. Tucker, M. E. Auguste, A. Watkins, C. Green, F. E. Pereira, K. T. Borrup, D. Shapiro, G. Lapidus, Initial impact of COVID-19’s stay-at-home order on motor vehicle traffic and crash patterns in Connecticut: an interrupted time series analysis, Injury prevention 27 (2021) 3–9.
- de Koning et al. (2021) E. R. de Koning, M. J. Boogers, J. Bosch, M. de Visser, M. J. Schalij, S. L. M. A. Beeres, Emergency medical services evaluations for chest pain during first COVID-19 lockdown in Hollands-Midden, the Netherlands, Netherlands Heart Journal 29 (2021) 224–229.
- Goldberg et al. (2021) S. A. Goldberg, R. E. Cash, G. Peters, S. G. Weiner, P. G. Greenough, R. Seethala, The impact of COVID-19 on statewide EMS use for cardiac emergencies and stroke in Massachusetts, Journal of the American College of Emergency Physicians Open 2 (2021) e12351.
- Muldoon et al. (2021) K. A. Muldoon, K. M. Denize, R. Talarico, D. B. Fell, A. Sobiesiak, M. Heimerl, K. Sampsel, COVID-19 pandemic and violence: rising risks and decreasing urgent care-seeking for sexual assault and domestic violence survivors, BMC Medicine 19 (2021) 20.
- Wilde (2013) E. T. Wilde, Do emergency medical system response times matter for health outcomes?, Health economics 22 (2013) 790–806.
- Blackwell and Kaufman (2002) T. H. Blackwell, J. S. Kaufman, Response time effectiveness: comparison of response time and survival in an urban emergency medical services system, Academic Emergency Medicine 9 (2002) 288–295.
- Pons et al. (2005) P. T. Pons, J. S. Haukoos, W. Bludworth, T. Cribley, K. A. Pons, V. J. Markovchick, Paramedic response time: does it affect patient survival?, Academic Emergency Medicine 12 (2005) 594–600.
- for Disease Control et al. (2020) C. for Disease Control, Prevention, et al., Interim Recommendations for Emergency Medical Services (EMS) Systems and 911 Public Safety Answering Points/Emergency Communication Centers (PSAP/ECCS) in the United States During the Coronavirus Disease (COVID-19) Pandemic, in: Centers for Disease Control and Prevention (US), Centers for Disease Control and Prevention (US), 2020.
- Ribeiro Jr et al. (2020) M. Ribeiro Jr, H. Alexandrino, P. Koleda, S. Baptista, M. Azfar, S. Di Saverio, L. Ponchietti, A. Güemes, J. Blas, C. Mesquita, et al., International cooperation group of emergency surgery during the COVID-19 pandemic., European Journal of Trauma and Emergency Surgery: Official Publication of the European Trauma Society (2020).
- BenÍtez et al. (2020) C. Y. BenÍtez, A. N. Pedival, I. Talal, B. Cros, M. A. F. Ribeiro, M. Azfar, S. D. Saverio, J. L. B. Laina, Adapting to an unprecedented scenario: surgery during the COVID-19 outbreak, Revista do Colégio Brasileiro de Cirurgiões 47 (2020).
- Benítez et al. (2020) C. Y. Benítez, A. Güemes, J. Aranda, M. Ribeiro, P. Ottolino, S. Di Saverio, H. Alexandrino, L. Ponchietti, J. L. Blas, J. P. Ramos, et al., Impact of personal protective equipment on surgical performance during the COVID-19 pandemic, World Journal of Surgery 44 (2020) 2842–2847.
- Ventura et al. (2020) C. Ventura, C. Gibson, G. D. Collier, Emergency Medical Services resource capacity and competency amid COVID-19 in the United States: preliminary findings from a national survey, Heliyon 6 (2020) e03900.
- Weber (0723) A. Weber, Austin EMS Medics Are Overworked And Overloaded During COVID-19. It’s Taking A ’Huge Mental Toll.’, 2020/07/23. URL: https://www.kut.org/austin/2020-07-23/austin-ems-medics-are-overworked-and-overloaded-during-covid-19-its-taking-a-huge-mental-toll, accessed: 2021/05/21.
- Balagtas (0722) T. Balagtas, Austin EMS Association says pandemic has impacted emergency response times, 2020/07/22. URL: https://cbsaustin.com/news/local/austin-ems-association-says-pandemic-has-impacted-emergency-response-times, accessed: 2021/05/21.
- Moghadas et al. (2020) S. M. Moghadas, A. Shoukat, M. C. Fitzpatrick, C. R. Wells, P. Sah, A. Pandey, J. D. Sachs, Z. Wang, L. A. Meyers, B. H. Singer, et al., Projecting hospital utilization during the COVID-19 outbreaks in the United States, Proceedings of the National Academy of Sciences 117 (2020) 9122–9126.
- Du et al. (2020) Z. Du, X. Wang, R. Pasco, M. Petty, S. J. Fox, L. A. Meyers, Covid-19 healthcare demand projections: 22 texas cities, UT COVID-19 Consortium (2020).
- Gel et al. (2020) E. S. Gel, M. Jehn, T. Lant, A. R. Muldoon, T. Nelson, H. M. Ross, COVID-19 healthcare demand projections: Arizona, PloS one 15 (2020) e0242588.
- Ferstad et al. (2020) J. O. Ferstad, A. J. Gu, R. Y. Lee, I. Thapa, A. Y. Shin, J. A. Salomon, P. Glynn, N. H. Shah, A. Milstein, K. Schulman, et al., A model to forecast regional demand for COVID-19 related hospital beds, medRxiv (2020).
- Chen and Gupta (1997) J. Chen, A. K. Gupta, Testing and locating variance changepoints with application to stock prices, Journal of the American Statistical association 92 (1997) 739–747.
Appendix
Comparison of mean response time across hospitals
One-way analysis of variance (ANOVA) suggested that the mean response time varied for the 6 major hospitals (F-test, p-value for assignment, dispatch and arrival). This is also shown in the mean plots in Figure 11. In particular, Dell Seton Medical Center, located in downtown Austin, had a lower response time than other hospitals. However, the slight difference in time may not have practical significance. A complete list of the mean and median response time for each of the 6 hospitals in given in Table 10.
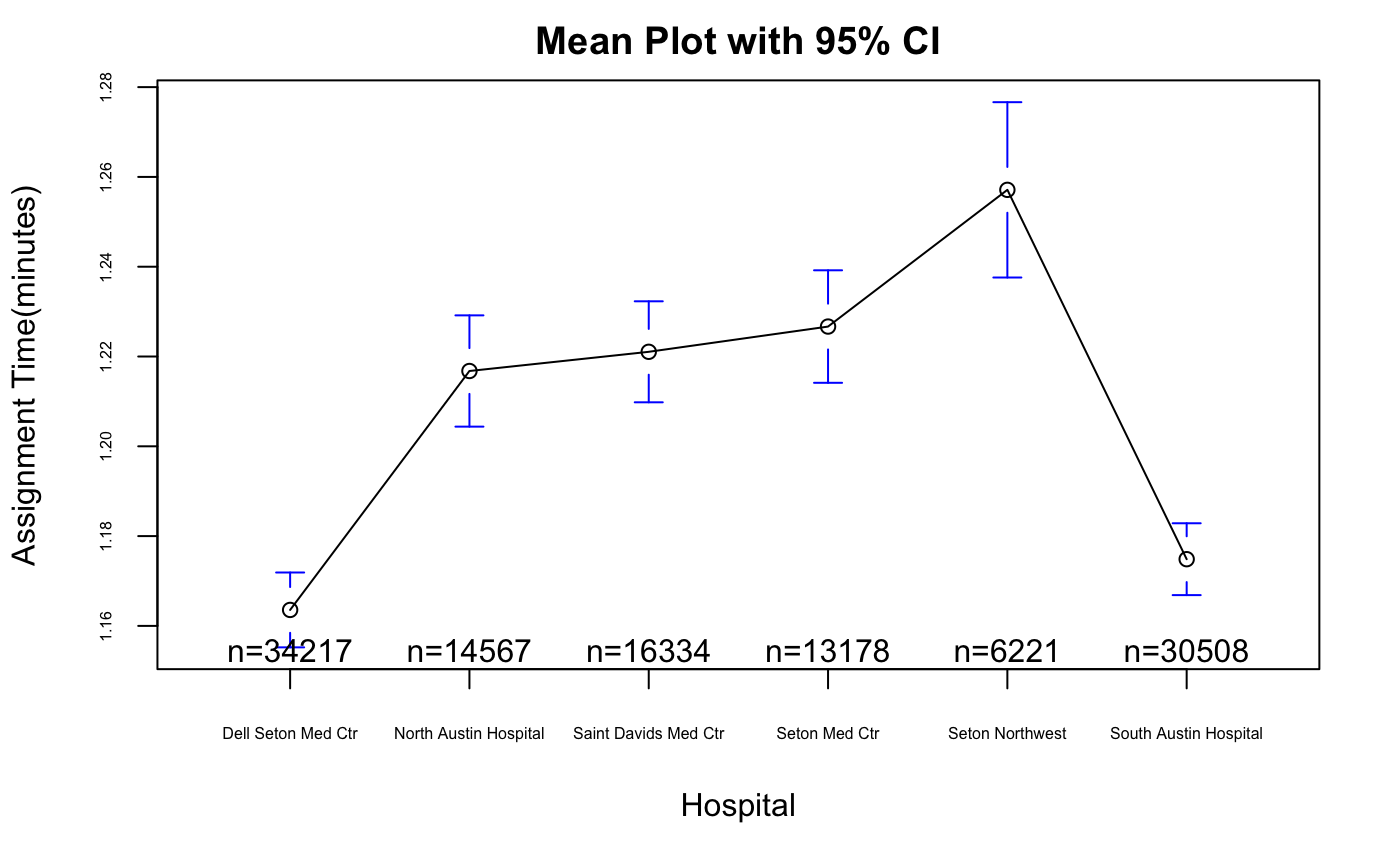
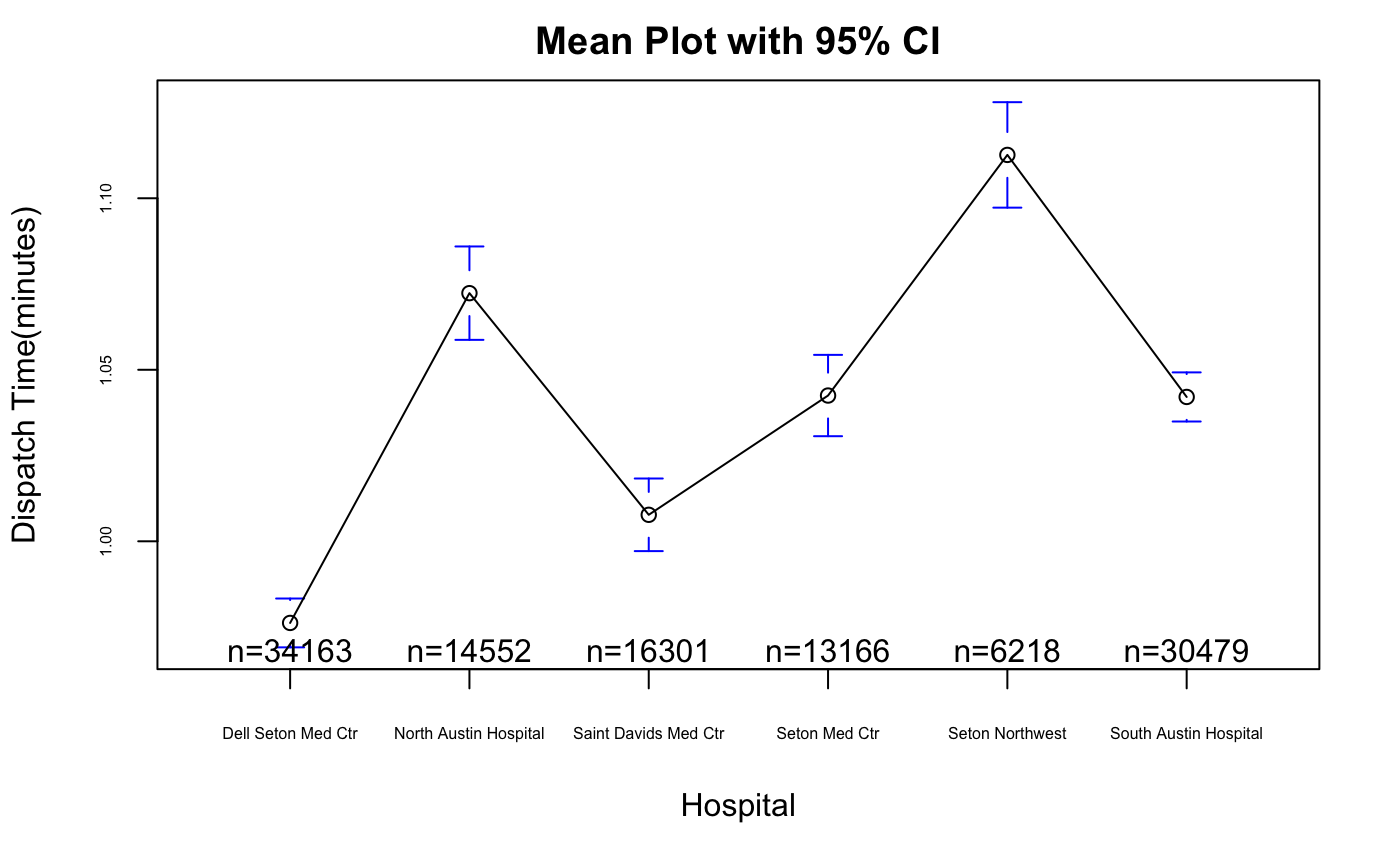
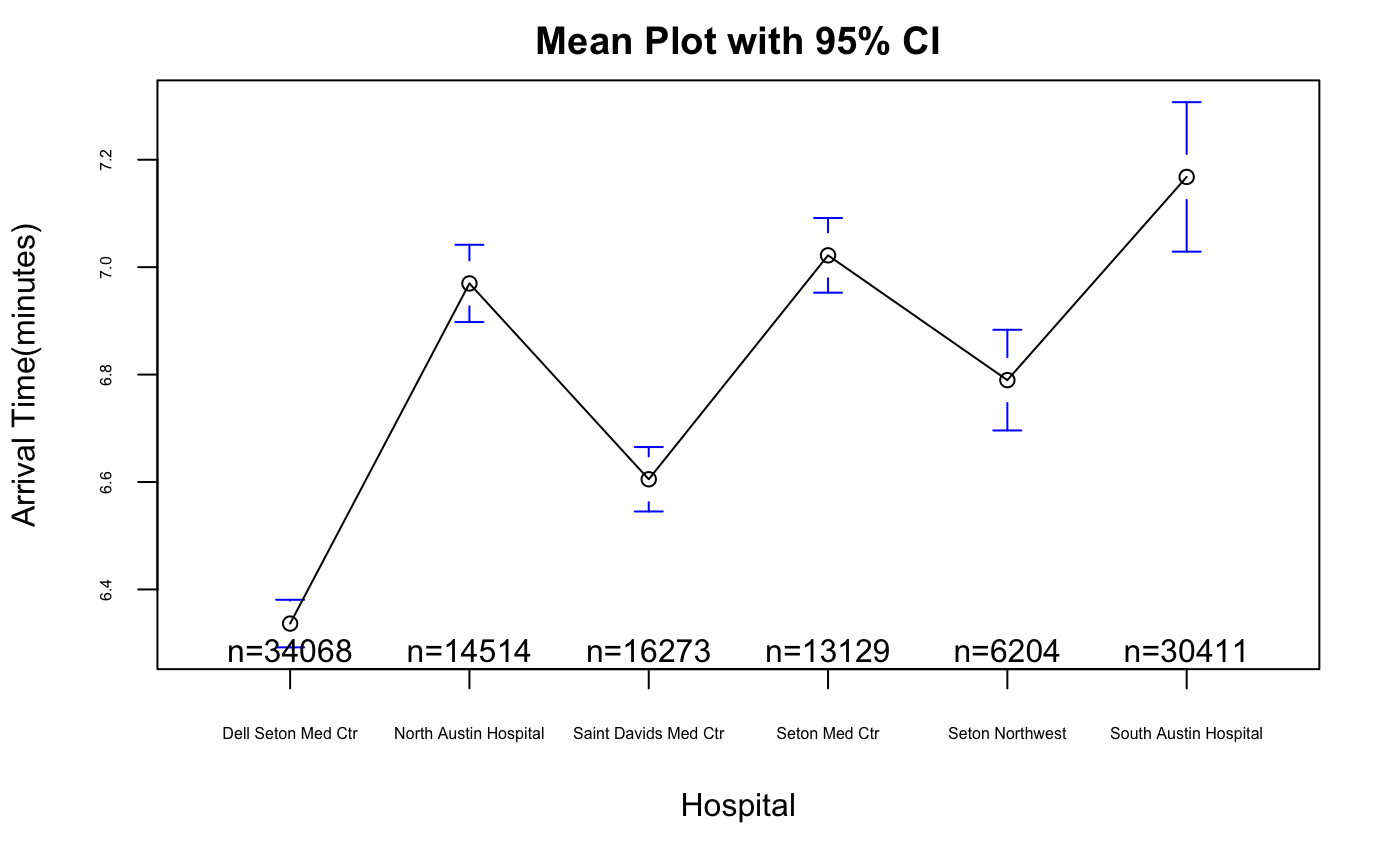
| Assignment Time | Dispatch Time | Arrival Time | ||||
|---|---|---|---|---|---|---|
| Mean | Median | Mean | Median | Mean | Median | |
| Dell Seton Med Ctr | 1.16 | 1.03 | 0.98 | 1.00 | 6.34 | 5.57 |
| North Austin Hospital | 1.22 | 1.08 | 1.07 | 1.08 | 6.97 | 6.20 |
| Saint Davids Med Ctr | 1.22 | 1.08 | 1.01 | 1.03 | 6.61 | 5.88 |
| Seton Med Ctr | 1.23 | 1.08 | 1.04 | 1.07 | 7.02 | 6.27 |
| Seton Northwest | 1.26 | 1.12 | 1.11 | 1.13 | 6.79 | 6.07 |
| South Austin Hospital | 1.17 | 1.05 | 1.04 | 1.07 | 7.17 | 6.30 |
Comparison of change point locations with respect to various choices of penalty
To evaluate the impact of pandemic on non-pandemic incidents, we identified changes in mean and variance with binary segmentation method and BIC penalty assuming underlying normal distribution. To restrict our attention to the impact of the pandemic only, we chose the maximal number of change points as 2. When we allowed a greater number of change points, binary segmentation with both BIC penalty and Schwarz information criterion (SIC (77)) penalty also identified the date April 8th, around which the non-pandemic incidents began to increase from the lowest point. We have also tested the PELT method, which failed to produce meaningful results. To identify changes in mean and variance, the PELT method was sensitive to random noise and produced too many dates. When we restricted the PELT method to variance only, it failed to identify the date March 17th.
To identify multiple change points in the daily hospitalization data, we applied PELT method on variance with MBIC penalty assuming underlying normal distribution. We chose PELT on variance with MBIC penalty because it produced a relatively small number of change points, which could help avoid overfitting. The PELT method with other types of penalties (BIC, Akaike information criterion (AIC), SIC), as well as the Binary Segmentation method, however, produced too many change points ().
Time series regression model without change point detection
Table 11 gives the output of a single variable time series regression model. The mean squared error of this model is 40.501, which is worse than that of our proposed model (table 9).
| Coefficients | intercept | hosp |
|---|---|---|
| Estimate | 26.10542 | 0.27774 |
| Standard Error | 0.94579 | 0.02735 |
| train | ||
| Residual standard error: 7.665 on 212 degrees of freedom | ||
| test | ||
| Mean squared error: 40.501 | ||
| Standard error of prediction residual: 6.420 | ||