Parallel detection and spatial mapping of large nuclear spin clusters
Abstract
Nuclear magnetic resonance imaging (MRI) at the atomic scale offers exciting prospects for determining the structure and function of individual molecules and proteins. Quantum defects in diamond have recently emerged as a promising platform towards reaching this goal, and allowed for the detection and localization of single nuclear spins under ambient conditions. We present an efficient strategy for extending imaging to large nuclear spin clusters, fulfilling an important requirement towards a single-molecule MRI technique. Our method combines the concepts of weak quantum measurements, phase encoding and simulated annealing to detect three-dimensional positions from many nuclei in parallel. Detection is spatially selective, allowing us to probe nuclei at a chosen target radius while avoiding interference from strongly-coupled proximal nuclei. We demonstrate our strategy by imaging clusters containing more than 20 carbon-13 nuclear spins within a radius of 2.4 nm from single, near-surface nitrogen–vacancy centers at room temperature. The radius extrapolates to 7-8 nm for 1H. Beside taking an important step in nanoscale MRI, our experiment also provides an efficient tool for the characterization of large nuclear spin registers in the context of quantum simulators and quantum network nodes.
I Introduction
Nuclear magnetic resonance (NMR) spectroscopy and magnetic resonance imaging (MRI) are powerful tools for molecular analysis and and medical diagnostics. While conventional NMR operates on millimeter-sized samples containing large ensembles of molecules, much effort has been directed at improving the resolution to the nanometer scale [1, 2] where the atomic structure could be analyzed at the level of individual molecules [3]. Such a “single-molecule MRI” technique has the prospect of enabling direct imaging of molecular structures with three-dimensional resolution and chemical specificity. This capability would lead to important applications in molecular biology, analytical chemistry, and many areas of nanoscale science and technology.
Quantum sensors based on nitrogen–vacancy (NV) centers in diamond have recently generated exciting progress in micron-scale [4, 5] and nanoscale [6, 7, 8] NMR spectroscopy. Early experiments have demonstrated detection of single nuclear spins within the diamond crystal [9, 10, 11] as well as of nanoscale films deposited on diamond surfaces [6, 7, 8]. Recent refinement of protocols has led to tremendous advances in sensitivity and spectral resolution [12, 13, 4], allowing for the three-dimensional localization of individual nuclear spins [14, 15, 16, 17], spin pairs [18, 19, 20], and the chemical fingerprinting of molecular ensembles with high spectral resolution [21, 4]. Most recently, the complete mapping of a 27-nuclear-spin cluster at cryogenic temperatures has been reported [22].
To extend experiments to the imaging of single molecules, methods are required that can efficiently detect and precisely localize a large number of distant nuclear spins in parallel. To be compatible with single-molecule detection, the experimental arrangement requires very shallow defects () and preferably an ambient environment. While advanced strategies have been proposed to solve the challenge of nuclear spin detection and localization [23, 24, 25, 26, 27], many of these strategies require very long coherence times or a single-shot readout of the quantum sensor to reach adequate sensitivity and spectral resolution [22, 28]. These conditions are difficult to realize with shallow defect centers at room temperature [29, 30]. In addition, most proposed approaches require addressing nuclear spins one-by-one, leading to an unfavorable scaling as the number of nuclei become increasingly large.
In this work, we demonstrate a powerful method for the sensitive detection and spatial mapping of individual nuclei in large nuclear spins clusters. Our approach combines the concepts of weak quantum measurements [31, 32], phase encoding [16, 17] and simulated annealing [33, 34] to detect signal and extract precise three-dimensional distances from many nuclei in parallel. We further show that our detection is spatially selective, allowing us to probe nuclei at a chosen target radius while avoiding interference from strongly-coupled proximal nuclei. We demonstrate our strategy by mapping the 13C environment of two NV centers containing 21 and 29 nuclei, respectively. Because our experiments are performed on near-surface spin defects and at room temperature, they are compatible with the demanding environment of prospective single-molecule MRI investigations. Besides taking an important step in developing a single-molecule MRI platform, our experiment also provides an efficient tool for the characterization of large qubit registers in the context of quantum simulators [35], quantum network nodes [36, 37, 28] and multi-qubit quantum processors [38, 39].
II Imaging concept
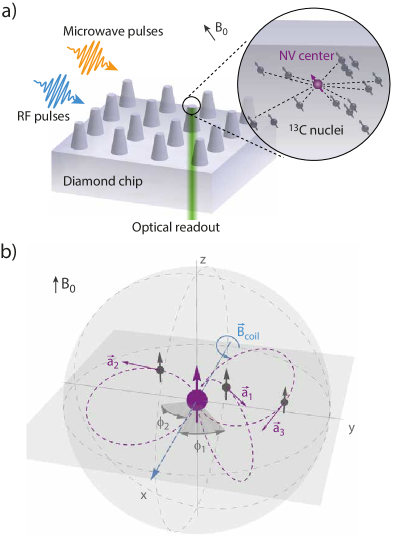
Our concept and experimental situation is sketched in Fig. 1a. We consider a central electronic spin surrounded by a group of nuclear spins whose three-dimensional locations we aim to determine. Here, both the electronic and nuclear spins are embedded in the solid matrix of a diamond crystal, but our concept is applicable to a general situation of a localized electronic spin [40, 41, 42] and a nearby nuclear ensemble, including surface molecules [6, 7, 43] or crystalline layers [44]. The electronic spin plays a dual role in our arrangement [25]: first, it acts as a local sensor for the weak magnetic fields produced by the nearby nuclei. Second, it generates a strong magnetic dipole field that we exploit for spatial imaging. In a reference frame where is the common quantization axis (Fig. 1b), the dipole field is given by:
| (1) |
where is the hyperfine vector (see Fig. 1b), are the polar coordinates of the nuclear spin relative to the electron spin situated at the origin, is a unit vector along , is the magnetic quantum number of the electronic spin ( for the NV center), and where we neglect Fermi contact effects [15]. Further, is the vacuum permeability, the reduced Planck constant, and and are the electronic and nuclear gyromagnetic ratios, respectively. Thus, by measuring the three components of the hyperfine vector , the distance vector can be directly inferred (up to an inversion symmetry at the origin), revealing a spin’s three-dimensional spatial location.
III Parallel signal acquisition
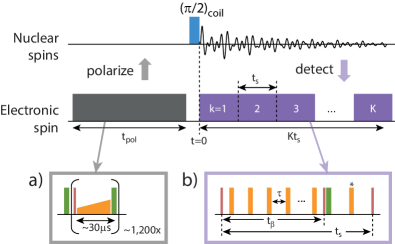
While three-dimensional localization has been demonstrated on individual nuclear spins [14, 15, 16, 17], the principal challenge lies in extending these experiments to large numbers of nuclei. We address this challenge by exploiting the principle of weak quantum measurements [46, 31], which closely resembles the detection of a free-induction decay (FID) in canonical Fourier NMR spectroscopy. Fig. 2 introduces our experimental protocol, consisting of a polarization, excitation and read-out step. We begin by hyperpolarizing nuclear spins through a polarization transfer from the optically-aligned electronic spin (Fig. 2a). This initial step, when applied repetitively and for a sufficiently long time, leads to a volume of near-fully polarized nuclei around the central electronic spin [47]. We then excite all nuclei simultaneously using a broad-band pulse and detect the free nuclear precession signal by sampling the transverse nuclear magnetization using weak measurements [31]. The procedure yields an FID signal of the form:
| (2) |
where is the number of nuclear spins. Further, is the probability amplitude [12], the dephasing rate, the precession frequency, and the initial phase of the signal belonging to the ’th nucleus. The parameter:
| (3) |
is a “measurement gain” parameter that is proportional to the hyperfine coupling constant multiplied by the interaction time of the ac detection (Fig. 2b). The parameter , discussed in Section V, plays an important role in single-spin FID detection as it governs the balance between signal gain and quantum back-action [31, 32, 48]. We sample the FID at instances , where is the sampling time, , and where is the number of points in the FID trace (Fig. 2).
IV Hyperfine parameters
We next show that an FID trace described by Eq. (2) contains all the information needed to reconstruct the hyperfine vectors , and hence, the three-dimensional locations of the nuclear spins. First, the parallel components (see Fig. 1b) can be determined from the spectral positions of the nuclear resonances, given by the free precession frequencies:
| (4) |
where the approximation is for small (fulfilled in our experiments) and where , with being the external magnetic bias field [45]. Because the values of spins are in general different, they provide a means to separate out nuclear signals in the Fourier spectrum. (Accidental overlap of resonances could be resolved using two-dimensional NMR schemes [45]).
Second, the amplitudes and decay rates encode information about the perpendicular components :
| (5a) | ||||
| (5b) | ||||
where is the initial polarization of the ’th nuclear spin. We will assume that all nuclei carry approximately the same polarization (); a justification is given in Refs. 47, 56. Note that also contains any pulse errors and other imperfections of our pulse sequence, and therefore rather reflects a pre-scaling factor and lower bound for the nuclear polarization. The dephasing rate of nuclei is influenced by three effects: (i) a measurement-induced dephasing proportional to due to quantum backaction [31], (ii) an intrinsic dephasing (assumed the same for all nuclei [56]), and (iii) an additional decay rate proportional to that is specific to the stochastic optical read-out process of the NV center with effective duration [56, 31].
Finally, the azimuth is encoded in the complex phase of the nuclear FID signal. Because we initiate the FID by applying a pulse with an external RF coil, all nuclei are rotated around a common laboratory-frame axis and start precession with the same phase. By contrast, the ac detection of the FID is phase-sensitive with respect to each nucleus’ individual hyperfine field. As a consequence, the phase is equal to the spatial angle between the coil and hyperfine axes in the laboratory frame (Fig. 1b) [16, 17]. Analysis of the complex FID signal therefore directly reveals the desired azimuth .
V Sensitive slice
The magnitude of the FID signal strongly depends on a spin’s three-dimensional position , because of the position dependence of the hyperfine interaction. We can capture the spatial dependence by calculating a sensitivity function that quantifies the signal contribution as a function of spin location . The sensitivity function is expressed as a signal-to-noise ratio [56] and given by:
| (6) |
where (Eq. 3) encodes the spatial position (via the hyperfine parameter ), and where , , and are experimental parameters defined in Fig. 2.
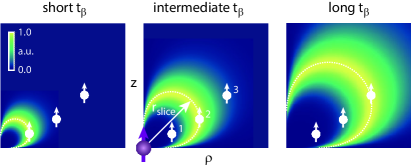
Fig. 3 plots as a function of vertical and radial distance to the central electronic spin. Interestingly, the sensitivity does not monotonically decay with distance, as might be expected from the scaling of the hyperfine interaction. Rather, is initially low, and increases with until it reaches a maximum at a characteristic radius before showing the expected decay. The suppression of signal from close spins is a consequence of quantum back-action [31]: Because these spins are strongly coupled, their measurement strength parameter is large, leading to a rapid signal decay (Eq. 5b). Conversely, distant spins with small generate weak signals because (Eq. 5a). Maximum sensitivity results at an intermediate value where the two effects are balanced,
| (7) |
The optimum point of sensitivity is reached when intrinsic and induced decay rates are commensurate, and when the FID record length is matched to the decay rate, [56].
As shown in Fig. 3, the points of maximum sensitivity are located along a contour of constant . We denote this contour the “sensitive slice” associated with the interaction time . By varying , we can vary the radius of the sensitive slice and tune detection from close to distant nuclear spins (Fig. 3, left to right). Because , the radius of the sensitive slice scales as [56]. The spatial selectivity in an important feature of our method, since it allows us to selectively probe nuclear spins at a defined (far) distance from the central electronic spin while avoiding interference from strongly-coupled nuclei in close proximity. Further, by sweeping , we can collect FID traces from several sensitive slices and cover an extended spatial volume in the sample.
VI Maximum Likelihood Estimation by Simulated Annealing
Armed with a protocol for measuring the signals and coupling constants from many nuclei in parallel, we develop a maximum likelihood protocol to extract the hyperfine parameters and position vectors from an FID trace (Eq. 2). Assuming spins are contributing to the signal, our model contains unknown parameters, including the three hyperfine parameters , and for each spin plus three additional, global parameters accounting for an initial polarization and dephasing times and [see Eq. (5)]. To proceed, we collect the unknown parameters in a single parameter vector , where . Our goal is to balance goodness of the fit and model complexity by minimizing a cost function of the form:
| (8) |
where is a measure of the goodness of the fit, , where , is the set of measured data points, and is a penalty term to prevent over-fitting [56, 57]. Eq. 8 is the generic form of a so-called information criterion (IC). In a likelihood framework, can be expressed in terms of a negative likelihood function [58]:
| (9) |
where the argument of the logarithm is the residual sum of squares. The function represents the estimated data points calculated from Eq. (2) using the parameter vector . The most common penalty terms are defined by the Akaike Information Criterion (AIC) [59] and the Bayesian Information Criterion (BIC) [60]. In our strategy, we combine the AIC and BIC penalties into a single term, known as the Weighted Average Information Criterion (WIC) [61] and defined in the Supplemental Material [56], that combines the strengths of both criteria and performs well independent of sample size .
By minimizing Eq. (8) we obtain the most likely parameter vector and the vector size , which reflects the minimum number of spins needed to explain the data. The minimization is challenging due to the large number of unknown parameters . We implement the method of generalized simulated annealing (GSA) to address this challenge. GSA is a stochastic approach [34] that combines the original method of classical simulated annealing [33] and fast simulated annealing [62]. The method has proven especially useful for global optimization of complicated, multi-dimensional systems with large numbers of local minima such as those present in quantum chemistry, genetics or non-linear time series [63]. Due to its statistical nature, local minima can be escaped much more easily than with steepest-descent or gradient methods. The core idea is to combine importance sampling with an artificial temperature which is gradually decreased to simulate thermal noise. To improve the GSA, we run the minimization over a large number of random starting configurations for . Finally, once a best-estimate set of parameters has been found, we can compute the three-dimensional locations of nuclei from the hyperfine vector by inverting Eq. (1) (see Appendix A).
VII Experimental demonstration
We experimentally demonstrate our three-dimensional nuclear localization strategy by imaging the 13C environment of shallow NV centers in diamond. We focus on two NV centers in this work, labeled NV1 and NV2, out of recorded datasets. The two NV centers are selected for favorable optical contrast and electron spin coherence times, but not for their 13C environment. Their shallow depth () is not important for this study except for demonstrating that our method is compatible with near-surface NV centers. We probe the NV centers at room temperature using non-resonant optical excitation and a single-photon counting module [56]. Electronic and nuclear spins are manipulated via two arbitrary waveform generators connected to separate microwave transmission line and RF micro-coil circuits, respectively [16, 51]. Experiments use a bias field aligned to within of the NV symmetry axis (Fig. 1b).
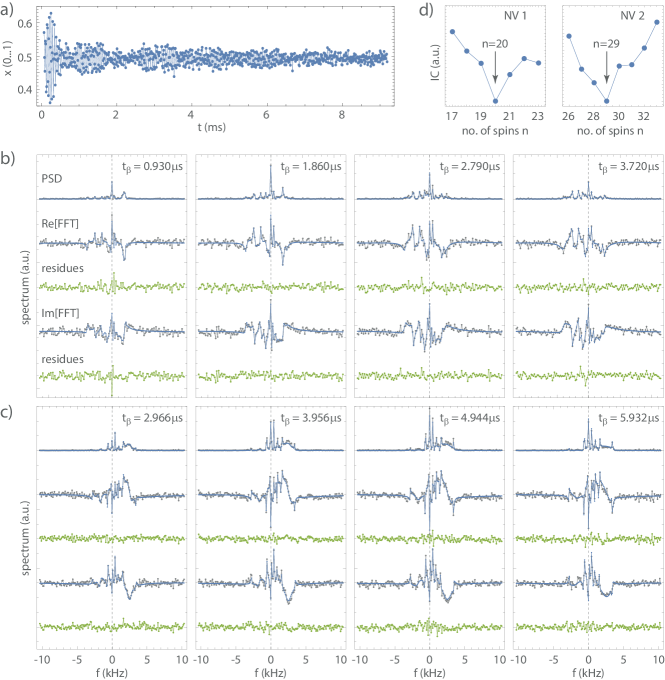
Fig. 4a shows an example of an FID time trace from NV2 for , and Fig. 4b,c show the complete data set of 13C Fourier spectra obtained for both NV centers. For each NV center, we record four spectra with different values of the interaction time to sample different radii of the sensitive slice and to add redundancy. For each dataset, we plot the power spectrum, the real and imaginary parts of the complex Fourier spectrum, as well as the fit residues. Clearly, the spectra show a rich peak structure, indicating that we are detecting a large number of 13C resonances.
To extract the hyperfine parameters, we apply Eq. (8) to the combined set of complex Fourier spectra. We fit the spectra, rather than the FID traces, to improve the robustness of the fit (see below). We begin by randomly initializing each parameter, and then minimize the residues between the experimental and computed spectra using a GSA algorithm [56] on a high-performance computer cluster [64]. To improve the robustness of the fit, we compute separate residues for real and imaginary parts of the complex spectrum as well as for their magnitude squared, and minimize the sum of all residues within the likelihood framework [56]. Further, we penalize configurations where the distance between any two 13C is less than one bond length. To accelerate the search for a global minimum, we repeat the procedure for a large number () of starting values randomly chosen from pre-defined parameter intervals [56]. Finally, to determine the number of spins we run the minimization routine for different and select the configuration with the smallest global IC value (Fig. 4d). Once the minimization has terminated and has been determined, we perform bootstrapping on the final fit residues [65, 56] to obtain an estimate for the fit uncertainties for all parameters.
The calculated spectra for the most likely nuclear configurations are displayed as blue solid lines in Fig. 4b,c. For the two datasets we find for NV1 and for NV2 (Fig. 4d). The good agreement with the experimental data (gray dots) and the small residues (green), which are of the same order as the measurement noise, indicate that our model and fitting method are appropriate. We have verified the calculated spectra by performing a full density matrix simulation using the final parameter set (Fig. S2 [56]). All fit results are collected in Tables S3 and S4 [56].
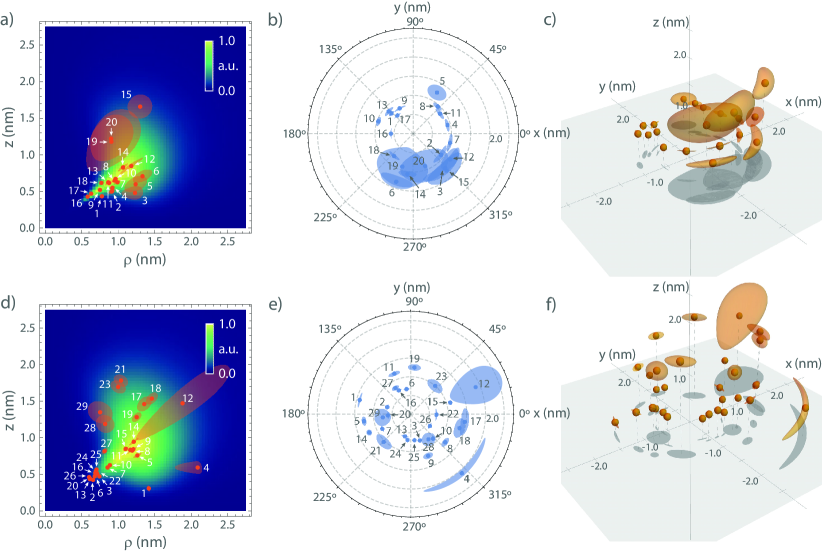
Fig. 5 shows visualizations of the three-dimensional locations of nuclei. We find that nuclear positions are clustered between ca. =0.7-2.4 nm and ca. =30-75∘. This clustering is a consequence of the spatial selectivity of our method: although the 13C nuclei are distributed randomly over the diamond lattice, only spins falling within the sensitive slice are picked up by the weak measurement detection sequence. The combined sensitive slice for all measurements, taking the values of the four spectra, and dephasing into account, agrees well with the extracted 13C positions. (The dephasing suppresses signal from nuclei with large , leading to a low sensitivity for spins near and ). Fig. 5 also clearly shows that the spatial precision of our method is highest and well below 1 Å for 13C’s that are located near the maximum of the sensitive slice, while the precision can be poor for spins located at the fringe of the slice.
Due to the large parameter space and complex structure of the minimization problem it is not guaranteed that the solution presented in Fig. 5 represents the “true” configuration of 13C nuclei. In fact, our method may report a single-spin position that in fact represents a pair or cluster of 13C. This issue could be resolved my measuring nuclear spin-spin interactions using two-dimensional NMR (see below). While we do not have independent means for verifying the three-dimensional nuclear configuration, we can perform some basic statistical tests on the density, spatial distribution and fit uncertainty of 13C positions. Comparing the volume uncertainties of the 13C (indicated by orange shading in Figs. 5c,e and tabulated in [56]) with the volume per carbon atom in the diamond lattice ( [66]), we find that 13 out of 20 spins (NV1) and 21 out of 29 spins (NV2) have and therefore likely represent single nuclei. Next, defining the volume of the sensitive region by the volume in space contributing 50% to the total signal [6], we find sensitive volumes of and for NV1 and NV2, respectively. Considering an average density for 13C nuclei in diamond at natural isotope abundance (1.1%), the average number of 13C in the sensitive slices are 18.0 and 28.6, respectively, in good agreement with our experimental result. Further, a test for the angular distributions of the azimuth angles yields -values well above the level ( and , respectively), as expected for a random 13C distribution. Within these statistics, our experimental results are fully consistent with a stochastic distribution of 13C atoms around the NV centers.
VIII Outlook
Before concluding, we point out some limitations of our present experiment and how these may be resolved in the future. A central issue is that there is no direct way of confirming the maximum likelihood solution beyond testing the robustness of the minimization. In addition, because of the inversion symmetry of the dipolar interaction [Eq. (1)], our method does not discriminate between spins lying in the upper and lower hemisphere. The logical way forward is to introduce additional spatial constraints. The inversion ambiguity can be resolved, for example, by positioning all spins in one hemisphere. This is a natural arrangement for single-molecule detection or planar spin registers. Another option is the application of a strong external magnetic gradient [67].
The most promising avenue, however, is the inclusion of nuclear spin-spin interactions. Such pair-wise nuclear spin couplings can provide precise local constraints [22] that ideally complement the global distance information provided by our method. While internuclear couplings between 13C are small in our experiment because of the low isotope abundance [56], couplings between protons in molecules can exceed and dominate over the hyperfine interaction. The two-dimensional (2D) NMR techniques needed to perform internuclear distance measurements, like nuclear-Overhauser-effect or electron-spin-echo-envelope-modulation spectroscopies, can be conveniently integrated with our protocol because of its similarity to conventional FID detection. While multi-dimensional spectroscopy schemes will further increase the measurement time and complexity for retrieving three-dimensional structures, techniques exists to address these challenges, such as sparse sampling [68, 24] and machine learning [69, 70, 71].
IX Summary
By demonstrating three-dimensional mapping of nuclear spins in ambient conditions, our work takes an important step forward towards the ambitious goal of single-molecule MRI. Next steps include extending the sensing radius of the NV center to , which is the minimum depth reported for stable near-surface NV centers [72]. While the most distant 13C in this work is at (13C no. 12 in Fig. 5d), increasing the interaction time to the coherence time (=50-200 [56, 72]) will scale this distance to for 13C and to for the high-moment nuclei 1H and 19F, respectively. Reaching this limit will require very high magnetic field stability, and work is currently underway to address this challenge. Another step includes the controlled termination and subsequent functionalization of the diamond surface to bind desired target molecules and simultaneously decouple the shallow NV center from the surface chemistry [73, 74].
Beside magnetic imaging of single spins, our work also provides interesting perspectives for the characterization of large qubit registers in quantum applications. For example, our method can be applied to efficiently map out the coupling network of quantum nodes built from a central electronic spin backed by a nuclear spin register [75, 76]. Such quantum nodes are central elements in emerging optical [77] or electronic [78] quantum interconnects. Another application is nuclear quantum simulation using an electronic qubit for initialization and readout [35]. Finally, our parallel measurement protocol could provide a rapid means for calibrating cross-talk in superconducting qubit architectures [38, 39].
Acknowledgements
We thank M. L. Palm for helpful discussions and acknowledge technical support from the machine shop of the Department of Physics at ETH Zurich. This work has been supported by Swiss National Science Foundation (SNFS) Project Grant No. 200020_175600, the National Center of Competence in Research in Quantum Science and Technology (NCCR QSIT), and the Advancing Science and TEchnology thRough dIamond Quantum Sensing (ASTERQIS) program, Grant No. 820394, of the European Commission.
Appendix A Hyperfine vector and position
The radius and polar angle are computed from the parallel and transverse hyperfine parameters and as follows (see Ref. 45, Eq. S28 and S29):
| (10) | ||||
| (11) |
References
- Degen et al. [2009] C. L. Degen, M. Poggio, H. J. Mamin, C. T. Rettner, and D. Rugar, Nanoscale magnetic resonance imaging, Proc. Nat. Acad. Sci. U.S.A. 106, 1313 (2009).
- Rose et al. [2018] W. Rose, H. Haas, A. Q. Chen, N. Jeon, L. J. Lauhon, D. G. Cory, and R. Budakian, High-resolution nanoscale solid-state nuclear magnetic resonance spectroscopy, Phys. Rev. X 8, 011030 (2018).
- Sidles [1991] J. A. Sidles, Noninductive detection of single-proton magnetic resonance, Appl. Phys. Lett. 58, 2854 (1991).
- Glenn et al. [2018] D. R. Glenn, D. B. Bucher, J. Lee, M. D. Lukin, H. Park, and R. L. Walsworth, High-resolution magnetic resonance spectroscopy using a solid-state spin sensor, Nature 555, 351 (2018).
- Smits et al. [2019] J. Smits, J. T. Damron, P. Kehayias, A. F. Mcdowell, N. Mosavian, I. Fescenko, N. Ristoff, A. Laraoui, A. Jarmola, and V. M. Acosta, Two-dimensional nuclear magnetic resonance spectroscopy with a microfluidic diamond quantum sensor, Sci Adv 5, eaaw7895 (2019).
- Mamin et al. [2013] H. J. Mamin, M. Kim, M. H. Sherwood, C. T. Rettner, K. Ohno, D. D. Awschalom, and D. Rugar, Nanoscale nuclear magnetic resonance with a nitrogen-vacancy spin sensor, Science 339, 557 (2013).
- Staudacher et al. [2013] T. Staudacher, F. Shi, S. Pezzagna, J. Meijer, J. Du, C. A. Meriles, F. Reinhard, and J. Wrachtrup, Nuclear magnetic resonance spectroscopy on a (5-nanometer)3 sample volume, Science 339, 561 (2013).
- Loretz et al. [2014] M. Loretz, S. Pezzagna, J. Meijer, and C. L. Degen, Nanoscale nuclear magnetic resonance with a 1.9-nm-deep nitrogen-vacancy sensor, Appl. Phys. Lett. 104, 033102 (2014).
- Jelezko et al. [2004] F. Jelezko, T. Gaebel, I. Popa, M. Domhan, A. Gruber, and J. Wrachtrup, Observation of coherent oscillation of a single nuclear spin and realization of a two-qubit conditional quantum gate, Phys. Rev. Lett. 93, 130501 (2004).
- Dutt et al. [2007] M. V. G. Dutt, L. Childress, L. Jiang, E. Togan, J. Maze, F. Jelezko, A. S. Zibrov, P. R. Hemmer, and M. D. Lukin, Quantum register based on individual electronic and nuclear spin qubits in diamond, Science 316, 1312 (2007).
- Dreau et al. [2013] A. Dreau, P. Spinicelli, J. R. Maze, J. Roch, and V. Jacques, Single-shot readout of multiple nuclear spin qubits in diamond under ambient conditions, Phys. Rev. Lett. 110, 060502 (2013).
- Boss et al. [2017] J. M. Boss, K. S. Cujia, J. Zopes, and C. L. Degen, Quantum sensing with arbitrary frequency resolution, Science 356, 837 (2017).
- Schmitt et al. [2017] S. Schmitt, T. Gefen, F. M. Sturner, T. Unden, G. Wolff, C. Muller, J. Scheuer, B. Naydenov, M. Markham, S. Pezzagna, J. Meijer, I. Schwarz, M. Plenio, A. Retzker, L. P. McGuinness, and F. Jelezko, Submillihertz magnetic spectroscopy performed with a nanoscale quantum sensor, Science 356, 832 (2017).
- Zhao et al. [2012] N. Zhao, J. Honert, B. Schmid, M. Klas, J. Isoya, M. Markham, D. Twitchen, F. Jelezko, R. Liu, H. Fedder, and J. Wrachtrup, Sensing single remote nuclear spins, Nature Nano. 7, 657 (2012).
- Zopes et al. [2018a] J. Zopes, K. S. Cujia, K. Sasaki, J. M. Boss, K. M. Itoh, and C. L. Degen, Three-dimensional localization spectroscopy of individual nuclear spins with sub-angstrom resolution, Nat. Commun. 9, 4678 (2018a).
- Zopes et al. [2018b] J. Zopes, K. Herb, K. S. Cujia, and C. L. Degen, Three-dimensional nuclear spin positioning using coherent radio-frequency control, Phys. Rev. Lett. 121, 170801 (2018b).
- Sasaki et al. [2018] K. Sasaki, K. M. Itoh, and E. Abe, Determination of the position of a single nuclear spin from free nuclear precessions detected by a solid-state quantum sensor, Phys. Rev. B 98, 121405 (2018).
- Shi et al. [2014] F. Shi, X. Kong, P. Wang, F. Kong, N. Zhao, R. Liu, and J. Du, Sensing and atomic-scale structure analysis of single nuclear-spin clusters in diamond, Nature Physics 10, 21 (2014).
- Abobeih et al. [2018] M. H. Abobeih, J. Cramer, M. A. Bakker, N. Kalb, M. Markham, D. J. Twitchen, and T. H. Taminiau, One-second coherence for a single electron spin coupled to a multi-qubit nuclear-spin environment, Nature Communications 9, 2552 (2018).
- Yang et al. [2020] Z. Yang, X. Kong, Z. Li, K. Yang, P. Yu, P. Wang, Y. Wang, X. Qin, X. Rong, C. Duan, F. Shi, and J. Du, Structural analysis of nuclear spin clusters via 2d nanoscale nuclear magnetic resonance spectroscopy, Advanced Quantum Technologies 3, 1900136 (2020).
- Aslam et al. [2017] N. Aslam, M. Pfender, P. Neumann, R. Reuter, A. Zappe, F. F. de Oliveira, A. Denisenko, H. Sumiya, S. Onoda, J. Isoya, and J. Wrachtrup, Nanoscale nuclear magnetic resonance with chemical resolution, Science 357, 10.1126/science.aam8697 (2017).
- Abobeih et al. [2019] M. H. Abobeih, J. Randall, C. E. Bradley, H. P. Bartling, M. A. Bakker, M. J. Degen, M. Markham, D. J. Twitchen, and T. H. Taminiau, Atomic-scale imaging of a 27-nuclear-spin cluster using a quantum sensor, Nature 576, 411 (2019).
- Ajoy et al. [2015] A. Ajoy, U. Bissbort, M. D. Lukin, R. L. Walsworth, and P. Cappellaro, Atomic-scale nuclear spin imaging using quantum-assisted sensors in diamond, Phys. Rev. X 5, 011001 (2015).
- Kost et al. [2015] M. Kost, J. Cai, and M. B. Plenio, Resolving single molecule structures with nitrogen-vacancy centers in diamond, Scientific Reports 5, 11007 (2015).
- Perunicic et al. [2016] V. S. Perunicic, C. D. Hill, L. T. Hall, and L. Hollenberg, A quantum spin-probe molecular microscope, Nat. Commun. 7, 12667 (2016).
- Wang et al. [2016] Z.-Y. Wang, J. F. Haase, J. Casanova, and M. B. Plenio, Positioning nuclear spins in interacting clusters for quantum technologies and bioimaging, Phys. Rev. B 93, 174104 (2016).
- Schwartz et al. [2019] I. Schwartz, J. Rosskopf, S. Schmitt, B. Tratzmiller, Q. Chen, L. P. McGuinness, F. Jelezko, and M. B. Plenio, Blueprint for nanoscale NMR, Scientific Reports 9, 6938 (2019).
- Bradley et al. [2019] C. Bradley, J. Randall, M. Abobeih, R. Berrevoets, M. Degen, M. Bakker, M. Markham, D. Twitchen, and T. Taminiau, A ten-qubit solid-state spin register with quantum memory up to one minute, Phys. Rev. X 9, 031045 (2019).
- Neumann et al. [2010] P. Neumann, J. Beck, M. Steiner, F. Rempp, H. Fedder, P. R. Hemmer, J. Wrachtrup, and F. Jelezko, Single-shot readout of a single nuclear spin, Science 329, 542 (2010).
- Shields et al. [2015] B. Shields, Q. P. Unterreithmeier, N. P. de Leon, H. Park, and M. D. Lukin, Efficient readout of a single spin state in diamond via spin-to-charge conversion, Phys. Rev. Lett. 114, 136402 (2015).
- Cujia et al. [2019] K. S. Cujia, J. M. Boss, K. Herb, J. Zopes, and C. L. Degen, Tracking the precession of single nuclear spins by weak measurements, Nature 571, 1476 (2019).
- Pfender et al. [2019] M. Pfender, P. Wang, H. Sumiya, S. Onoda, W. Yang, D. B. R. Dasari, P. Neumann, X. Pan, J. Isoya, R. Liu, and J. Wrachtrup, High-resolution spectroscopy of single nuclear spins via sequential weak measurements, Nature Communications 10, 594 (2019).
- Kirkpatrick et al. [1983] S. Kirkpatrick, C. D. Gelatt, and M. P. Vecchi, Optimization by simulated annealing, Science 220, 671 (1983), https://science.sciencemag.org/content/220/4598/671.full.pdf .
- Tsallis and Stariolo [1996] C. Tsallis and D. A. Stariolo, Generalized simulated annealing, Physica A: Statistical Mechanics and its Applications 233, 395 (1996).
- Cai et al. [2013] J. M. Cai, A. Retzker, F. Jelezko, and M. B. Plenio, A large-scale quantum simulator on a diamond surface at room temperature, Nature Physics 9, 168 (2013).
- Waldherr et al. [2014] G. Waldherr, Y. Wang, S. Zaiser, M. Jamali, T. Schulte-Herbruggen, H. Abe, T. Ohshima, J. Isoya, J. F. Du, P. Neumann, and J. Wrachtrup, Quantum error correction in a solid-state hybrid spin register, Nature 506, 10.1038/nature12919 (2014).
- Wolfowicz et al. [2016] G. Wolfowicz, P. Mortemousque, R. Guichard, S. Simmons, M. L. W. Thewalt, K. M. Itoh, and J. J. L. Morton, 29si nuclear spins as a resource for donor spin qubits in silicon, New Journal of Physics 18, 023021 (2016).
- Krinner et al. [2020] S. Krinner, S. Lazar, A. Remm, C. Andersen, N. Lacroix, G. Norris, C. Hellings, M. Gabureac, C. Eichler, and A. Wallraff, Benchmarking coherent errors in controlled-phase gates due to spectator qubits, Phys. Rev. Applied 14, 024042 (2020).
- Tsunoda et al. [2020] T. Tsunoda, G. Bhole, S. A. Jones, J. A. Jones, and P. J. Leek, Efficient hamiltonian programming in qubit arrays with nearest-neighbor couplings, Phys. Rev. A 102, 032405 (2020).
- Christle et al. [2015] D. J. Christle, A. L. Falk, P. Andrich, P. V. Klimov, J. U. Hassan, N. Son, E. Janzen, T. Ohshima, and D. D. Awschalom, Isolated electron spins in silicon carbide with millisecond coherence times, Nature Materials 14, 160 (2015).
- Iwasaki et al. [2015] T. Iwasaki, F. Ishibashi, Y. Miyamoto, Y. Doi, S. Kobayashi, T. Miyazaki, K. Tahara, K. D. Jahnke, L. J. Rogers, B. Naydenov, F. Jelezko, S. Yamasaki, S. Nagamachi, T. Inubushi, N. Mizuochi, and M. Hatano, Germanium-vacancy single color centers in diamond, Scientific Reports 5, 12882 (2015).
- Sukachev et al. [2017] D. Sukachev, A. Sipahigil, C. Nguyen, M. Bhaskar, R. Evans, F. Jelezko, and M. Lukin, Silicon-vacancy spin qubit in diamond: a quantum memory exceeding 10 ms with single-shot state readout, Phys. Rev. Lett. 119, 223602 (2017).
- Lovchinsky et al. [2016] I. Lovchinsky, A. O. Sushkov, E. Urbach, N. P. de Leon, S. Choi, K. de Greve, R. Evans, R. Gertner, E. Bersin, C. Muller, L. McGuinness, F. Jelezko, R. L. Walsworth, H. Park, and M. D. Lukin, Nuclear magnetic resonance detection and spectroscopy of single proteins using quantum logic, Science 351, 836 (2016).
- Lovchinsky et al. [2017] I. Lovchinsky, J. D. Sanchez-yamagishi, E. K. Urbach, S. Choi, S. Fang, T. I. Andersen, K. Watanabe, T. Taniguchi, A. Bylinskii, E. Kaxiras, P. Kim, H. Park, and M. D. Lukin, Magnetic resonance spectroscopy of an atomically thin material using a single-spin qubit, Science 355, 503 (2017).
- Boss et al. [2016] J. M. Boss, K. Chang, J. Armijo, K. Cujia, T. Rosskopf, J. R. Maze, and C. L. Degen, One- and two-dimensional nuclear magnetic resonance spectroscopy with a diamond quantum sensor, Phys. Rev. Lett. 116, 197601 (2016).
- Colangelo et al. [2017] G. Colangelo, F. M. Ciurana, L. C. Bianchet, R. J. Sewell, and M. W. Mitchell, Simultaneous tracking of spin angle and amplitude beyond classical limits, Nature 543, 525 (2017).
- Broadway et al. [2018] D. A. Broadway, J. P. Tetienne, A. Stacey, J. A. Wood, D. A. Simpson, L. T. Hall, and L. C. L. Hollenberg, Quantum probe hyperpolarisation of molecular nuclear spins, Nature Communications 9, 1246 (2018).
- Gefen et al. [2018] T. Gefen, M. Khodas, L. P. McGuinness, F. Jelezko, and A. Retzker, Quantum spectroscopy of single spins assisted by a classical clock, Phys. Rev. A 98, 013844 (2018).
- Henstra et al. [1988] A. Henstra, P. Dirksen, J. Schmidt, and W. Wenckebach, Nuclear spin orientation via electron spin locking (NOVEL), Journal of Magnetic Resonance (1969) 77, 389 (1988).
- London et al. [2013] P. London, J. Scheuer, J. M. Cai, I. Schwarz, A. Retzker, M. B. Plenio, M. Katagiri, T. Teraji, S. Koizumi, J. Isoya, R. Fischer, L. P. Mcguinness, B. Naydenov, and F. Jelezko, Detecting and polarizing nuclear spins with double resonance on a single electron spin, Phys. Rev. Lett. 111, 067601 (2013).
- Herb et al. [2020] K. Herb, J. Zopes, K. S. Cujia, and C. L. Degen, Broadband radio-frequency transmitter for fast nuclear spin control, Review of Scientific Instruments 91, 113106 (2020).
- Degen et al. [2017] C. Degen, F. Reinhard, and P. Cappellaro, Quantum sensing, Rev. Mod. Phys. 89, 035002 (2017).
- Lange et al. [2011] G. D. Lange, D. Riste, V. V. Dobrovitski, and R. Hanson, Single-spin magnetometry with multipulse sensing sequences, Phys. Rev. Lett. 106, 080802 (2011).
- Alvarez and Suter [2011] G. A. Alvarez and D. Suter, Measuring the spectrum of colored noise by dynamical decoupling, Phys. Rev. Lett. 107, 230501 (2011).
- Kotler et al. [2011] S. Kotler, N. Akerman, Y. Glickman, A. Keselman, and R. Ozeri, Single-ion quantum lock-in amplifier, Nature 473, 61 (2011).
- [56] See Supplemental Material accompanying this manuscript .
- Knowles et al. [2016] H. S. Knowles, D. M. Kara, and M. Atature, Demonstration of a coherent electronic spin cluster in diamond, Phys. Rev. Lett. 117, 100802 (2016).
- Burnham and Anderson [2002] K. P. Burnham and D. R. Anderson, Model Selection and Multimodel Inference (Springer-Verlag New York, 2002).
- Akaike [1974] H. Akaike, A new look at the statistical model identification, IEEE Transactions on Automatic Control 19, 716 (1974).
- Schwarz [1978] G. Schwarz, Estimating the dimension of a model, Ann. Statist. 6, 461 (1978).
- Wu and Sepulveda [1998] T.-J. Wu and A. Sepulveda, The weighted average information criterion for order selection in time series and regression models, Statistics and Probability Letters 39, 1 (1998).
- Szu and Hartley [1987] H. Szu and R. Hartley, Fast simulated annealing, Physics Letters A 122, 157 (1987).
- Xiang et al. [1997] Y. Xiang, D. Sun, W. Fan, and X. Gong, Generalized simulated annealing algorithm and its application to the thomson model, Physics Letters A 233, 216 (1997).
- [64] Euler cluster, ETH Zurich, https://scicomp.ethz.ch (retrieved 2020-08-25) .
- Efron [1979] B. Efron, Bootstrap Methods: Another Look at the Jackknife, Ann. Statist. 7, 1 (1979).
- Shikata et al. [2018] S. Shikata, T. Tanno, T. Teraji, H. Kanda, T. Yamada, and J. Kushibiki, Precise measurements of diamond lattice constant using bond method, Japanese Journal of Applied Physics 57, 111301 (2018).
- Grinolds et al. [2014] M. S. Grinolds, M. Warner, K. de Greve, Y. Dovzhenko, L. Thiel, R. L. Walsworth, S. Hong, P. Maletinsky, and A. Yacoby, Subnanometre resolution in three-dimensional magnetic resonance imaging of individual dark spins, Nat. Nano. 9, 279 (2014).
- Mobli et al. [2012] M. Mobli, M. W. Maciejewski, A. D. Schuyler, A. S. Stern, and J. C. Hoch, Sparse sampling methods in multidimensional NMR, Phys. Chem. Chem. Phys. 14, 10835 (2012).
- Aharon et al. [2019] N. Aharon, A. Rotem, L. P. Mcguinness, F. Jelezko, A. Retzker, and Z. Ringel, NV-center-based nano-NMR enhanced by deep learning, Scientific Reports 9, 17802 (2019).
- Kong et al. [2020] X. Kong, L. Zhou, Z. Li, Z. Yang, B. Qiu, X. Wu, F. Shi, and J. Du, Artificial intelligence enhanced two-dimensional nanoscale nuclear magnetic resonance spectroscopy, npj Quantum Information 6, 79 (2020).
- Jung et al. [2021] K. Jung, M. H. Abobeih, J. Yun, G. Kim, H. Oh, A. Henry, T. H. Taminiau, and D. Kim, Deep learning enhanced individual nuclear-spin detection, npj Quantum Information 7, 41 (2021).
- Sangtawesin et al. [2019] S. Sangtawesin, B. L. Dwyer, S. Srinivasan, J. J. Allred, L. V. Rodgers, K. D. Greve, A. Stacey, N. Dontschuk, K. M. ODonnell, D. Hu, D. A. Evans, C. Jaye, D. A. Fischer, M. L. Markham, D. J. Twitchen, H. Park, M. D. Lukin, and N. P. de Leon, Origins of diamond surface noise probed by correlating single-spin measurements with surface spectroscopy, Phys. Rev. X 9, 031052 (2019).
- Kaviani et al. [2014] M. Kaviani, P. Deak, B. Aradi, T. Frauenheim, J. P. Chou, and A. Gali, Proper surface termination for luminescent near-surface nv-centres in diamond, Nano Letters 14, 4772 (2014).
- Kawai et al. [2019] S. Kawai, H. Yamano, T. Sonoda, K. Kato, J. J. Buendia, T. Kageura, R. Fukuda, T. Okada, T. Tanii, T. Higuchi, M. Haruyama, K. Yamada, S. Onoda, T. Ohshima, W. Kada, O. Hanaizumi, A. Stacey, T. Teraji, S. Kono, J. Isoya, and H. Kawarada, Nitrogen-terminated diamond surface for nanoscale nmr by shallow nitrogen-vacancy centers, J. Phys. Chem. C 123, 3594 (2019).
- Awschalom et al. [2018] D. D. Awschalom, R. Hanson, J. Wrachtrup, and B. B. Zhou, Quantum technologies with optically interfaced solid-state spins, Nature Photonics 12, 516 (2018).
- Zwanenburg et al. [2013] F. A. Zwanenburg, A. S. Dzurak, A. Morello, M. Y. Simmons, L. C. L. Hollenberg, G. Klimeck, S. Rogge, S. N. Coppersmith, and M. A. Eriksson, Silicon quantum electronics, Rev. Mod. Phys. 85, 961 (2013).
- Bernien et al. [2013] H. Bernien, B. Hensen, W. Pfaff, G. Koolstra, M. S. Blok, L. Robledo, T. H. Taminiau, M. Markham, D. J. Twitchen, L. Childress, and R. Hanson, Heralded entanglement between solid-state qubits separated by three metres, Nature 497, 86 (2013).
- Tosi et al. [2017] G. Tosi, F. A. Mohiyaddin, V. Schmitt, S. Tenberg, R. Rahman, G. Klimeck, and A. Morello, Silicon quantum processor with robust long-distance qubit couplings, Nature Communications 8, 450 (2017).